
Prognostic Factors and the Role of Adjuvant Chemotherapy in Pathological Node-Negative T3 Gastric Cancer
 ,
,
Abstract
:1. Introduction
2. Materials and Methods
2.1. Clinical Information
2.2. Outcomes
2.3. Statistical Analysis
3. Results
4. Discussion
5. Conclusions
Author Contributions
Funding
Institutional Review Board Statement
Informed Consent Statement
Data Availability Statement
Acknowledgments
Conflicts of Interest
References
- Sung, H.; Ferlay, J.; Siegel, R.L.; Laversanne, M.; Soerjomataram, I.; Jemal, A.; Bray, F. Global Cancer Statistics 2020: GLOBOCAN Estimates of incidence and mortality worldwide for 36 cancers in 185 countries. CA Cancer J. Clin. 2021, 71, 209–249. [Google Scholar] [CrossRef] [PubMed]
- Cunningham, D.; Allum, W.H.; Stenning, S.P.; Thompson, J.N.; Van de Velde, C.J.; Nicolson, M.; Scarffe, J.H.; Lofts, F.J.; Falk, S.J.; Iveson, T.J.; et al. Perioperative chemotherapy versus surgery alone for resectable gastroesophageal cancer. N. Engl. J. Med. 2006, 355, 11–20. [Google Scholar] [CrossRef] [PubMed] [Green Version]
- Ychou, M.; Boige, V.; Pignon, J.P.; Conroy, T.; Bouche, O.; Lebreton, G.; Ducourtieux, M.; Bedenne, L.; Fabre, J.M.; Saint-Aubert, B.; et al. Perioperative chemotherapy compared with surgery alone for resectable gastroesophageal adenocarcinoma: An FNCLCC and FFCD multicenter phase III trial. J. Clin. Oncol. 2011, 29, 1715–1721. [Google Scholar] [CrossRef] [PubMed]
- Huang, Z.N.; Desiderio, J.; Chen, Q.Y.; Zheng, C.H.; Li, P.; Xie, J.W.; Wang, J.B.; Lin, J.X.; Lu, J.; Cao, L.L.; et al. Indications for adjuvant chemotherapy in patients with AJCC stage IIa T3N0M0 and T1N2M0 gastric cancer-an east and west multicenter study. BMC Gastroenterol. 2019, 19, 205. [Google Scholar] [CrossRef] [Green Version]
- Lee, K.G.; Lee, H.J.; Oh, S.Y.; Yang, J.Y.; Ahn, H.S.; Suh, Y.S.; Kong, S.H.; Kim, T.Y.; Oh, D.Y.; Im, S.A.; et al. Is there any role of adjuvant chemotherapy for T3N0M0 or T1N2M0 gastric cancer patients in stage II in the 7th TNM but stage I in the 6th TNM system? Ann. Surg. Oncol. 2016, 23, 1234–1243. [Google Scholar] [CrossRef]
- Warneke, V.S.; Behrens, H.M.; Hartmann, J.T.; Held, H.; Becker, T.; Schwarz, N.T.; Rocken, C. Cohort study based on the seventh edition of the TNM classification for gastric cancer: Proposal of a new staging system. J. Clin. Oncol. 2011, 29, 2364–2371. [Google Scholar] [CrossRef]
- Mohamed, A.A.; Gordon, A.; Cartwright, E.; Cunningham, D. Optimising multimodality treatment of resectable oesophago-gastric adenocarcinoma. Cancers 2022, 14, 586. [Google Scholar] [CrossRef]
- Amin, M.B.; Edge, S.; Greene, F.; Byrd, D.R.; Brookland, P.K.; Washington, M.K.; Gershenwald, J.E.; Compton, C.C.; Hess, K.R.; Sullivan, D.C. AJCC Cancer Staging Manual, 8th ed.; Springer: New York, NY, USA, 2017. [Google Scholar]
- Hothorn, T.; Hornik, K.; Zeileis, A. Unbiased Recursive Partitioning: A Conditional Inference Framework. J. Comput. Graph. Stat. 2006, 15, 651–674. [Google Scholar] [CrossRef] [Green Version]
- Bang, Y.J.; Van Cutsem, E.; Feyereislova, A.; Chung, H.C.; Shen, L.; Sawaki, A.; Lordick, F.; Ohtsu, A.; Omuro, Y.; Satoh, T.; et al. Trastuzumab in combination with chemotherapy versus chemotherapy alone for treatment of HER2-positive advanced gastric or gastro-oesophageal junction cancer (ToGA): A phase 3, open-label, randomised controlled trial. Lancet 2010, 376, 687–697. [Google Scholar] [CrossRef]
- Sato, Y.; Okamoto, K.; Kida, Y.; Mitsui, Y.; Kawano, Y.; Sogabe, M.; Miyamoto, H.; Takayama, T. Overview of chemotherapy for Gastric Cancer. J. Clin. Med. 2023, 12, 1336. [Google Scholar] [CrossRef]
- Hsu, J.T.; Chen, T.C.; Tseng, J.H.; Chiu, C.T.; Liu, K.H.; Yeh, C.N.; Hwang, T.L.; Jan, Y.Y.; Yeh, T.S. Impact of HER-2 overexpression/amplification on the prognosis of gastric cancer patients undergoing resection: A single-center study of 1,036 patients. Oncologist 2011, 16, 1706–1713. [Google Scholar] [CrossRef] [PubMed] [Green Version]
- Lu, J.; Huang, C.M.; Zheng, C.H.; Li, P.; Xie, J.W.; Wang, J.B.; Lin, J.X. Consideration of tumor size improves the accuracy of TNM predictions in patients with gastric cancer after curative gastrectomy. Surg. Oncol. 2013, 22, 167–171. [Google Scholar] [CrossRef]
- Aoyama, T.; Yoshikawa, T.; Watanabe, T.; Hayashi, T.; Ogata, T.; Cho, H.; Tsuburaya, A. Macroscopic tumor size as an independent prognostic factor for stage II/III gastric cancer patients who underwent D2 gastrectomy followed by adjuvant chemotherapy with S-1. Gastric Cancer 2011, 14, 274–278. [Google Scholar] [CrossRef] [PubMed] [Green Version]
- Kooby, D.A.; Suriawinata, A.; Klimstra, D.S.; Brennan, M.F.; Karpeh, M.S. Biologic predictors of survival in node-negative gastric cancer. Ann. Surg. 2003, 237, 828–835; discussion 835–827. [Google Scholar] [CrossRef]
- Soga, K.; Ichikawa, D.; Yasukawa, S.; Kubota, T.; Kikuchi, S.; Fujiwara, H.; Okamoto, K.; Ochiai, T.; Sakakura, C.; Kokuba, Y.; et al. Prognostic impact of the width of subserosal invasion in gastric cancer invading the subserosal layer. Surgery 2010, 147, 197–203. [Google Scholar] [CrossRef]
- Lee, I.S.; Yook, J.H.; Kim, T.H.; Kim, H.S.; Kim, K.C.; Oh, S.T.; Kim, B.S. Prognostic factors and recurrence pattern in node-negative advanced gastric cancer. Eur. J. Surg. Oncol. 2013, 39, 136–140. [Google Scholar] [CrossRef]
- Sakuramoto, S.; Sasako, M.; Yamaguchi, T.; Kinoshita, T.; Fujii, M.; Nashimoto, A.; Furukawa, H.; Nakajima, T.; Ohashi, Y.; Imamura, H.; et al. Adjuvant chemotherapy for gastric cancer with S-1, an oral fluoropyrimidine. N. Engl. J. Med. 2007, 357, 1810–1820. [Google Scholar] [CrossRef] [PubMed]
- Sasako, M.; Sakuramoto, S.; Katai, H.; Kinoshita, T.; Furukawa, H.; Yamaguchi, T.; Nashimoto, A.; Fujii, M.; Nakajima, T.; Ohashi, Y. Five-year outcomes of a randomized phase III trial comparing adjuvant chemotherapy with S-1 versus surgery alone in stage II or III gastric cancer. J. Clin. Oncol. 2011, 29, 4387–4393. [Google Scholar] [CrossRef] [Green Version]
- Yoshikawa, T.; Terashima, M.; Mizusawa, J.; Nunobe, S.; Nishida, Y.; Yamada, T.; Kaji, M.; Fukushima, N.; Hato, S.; Choda, Y.; et al. Four courses versus eight courses of adjuvant S-1 for patients with stage II gastric cancer (JCOG1104 [OPAS-1]): An open-label, phase 3, non-inferiority, randomised trial. Lancet Gastroenterol. Hepatol. 2019, 4, 208–216. [Google Scholar] [CrossRef]
- Japanese Gastric Cancer Association. Japanese gastric cancer treatment guidelines 2010 (ver. 3). Gastric Cancer 2011, 14, 113–123. [Google Scholar] [CrossRef] [Green Version]
- Ajani, J.A.; D’Amico, T.A.; Bentrem, D.J.; Chao, J.; Cooke, D.; Corvera, C.; Das, P.; Enzinger, P.C.; Enzler, T.; Fanta, P.; et al. NCCN clinical practice guidelines in oncology. Gastric cancer, version 2.2022. J. Natl. Compr. Canc. Netw. 2022, 20, 167–192. [Google Scholar] [CrossRef] [PubMed]
- Waddell, T.; Verheij, M.; Allum, W.; Cunningham, D.; Cervantes, A.; Arnold, D.; European Society for Medical Oncology (ESMO); European Society of Surgical Oncology (ESSO); European Society of Radiotherapy and Oncology (ESTRO). Gastric cancer: ESMO-ESSO-ESTRO clinical practice guidelines for diagnosis, treatment and follow-up. Ann. Oncol. 2013, 24 (Suppl. 6), vi57–vi63. [Google Scholar] [CrossRef] [PubMed]
- Huang, S.F.; Chen, T.C.; Hsu, J.T.; Tsai, C.Y.; Liu, K.H.; Yeh, C.N.; Yeh, T.S. Lymph node micrometastasis of poorly differentiated node-negative gastric cancer risks a worse-than-expected survival outcome under standard management algorithm. Eur. J. Surg. Oncol. 2022, 48, 783–788. [Google Scholar] [CrossRef] [PubMed]
- Selvaggi, F.; Melchiorre, E.; Casari, I.; Cinalli, S.; Cinalli, M.; Aceto, G.M.; Cotellese, R.; Garajova, I.; Falasca, M. Perineural invasion in pancreatic ductal adenocarcinoma: From molecules towards drugs of clinical relevance. Cancers 2022, 14, 5793. [Google Scholar] [CrossRef]
- Knijn, N.; Mogk, S.C.; Teerenstra, S.; Simmer, F.; Nagtegaal, I.D. Perineural invasion is a strong prognostic factor in colorectal cancer: A systematic review. Am. J. Surg. Pathol. 2016, 40, 103–112. [Google Scholar] [CrossRef]
- Liebig, C.; Ayala, G.; Wilks, J.A.; Berger, D.H.; Albo, D. Perineural invasion in cancer: A review of the literature. Cancer 2009, 115, 3379–3391. [Google Scholar] [CrossRef]
- Chou, H.H.; Kuo, C.J.; Hsu, J.T.; Chen, T.H.; Lin, C.J.; Tseng, J.H.; Yeh, T.S.; Hwang, T.L.; Jan, Y.Y. Clinicopathologic study of node-negative advanced gastric cancer and analysis of factors predicting its recurrence and prognosis. Am. J. Surg. 2013, 205, 623–630. [Google Scholar] [CrossRef]
- Chen, Y.F.; Wang, S.Y.; Le, P.H.; Chen, T.H.; Kuo, C.J.; Lin, C.J.; Chou, W.C.; Yeh, T.S.; Hsu, J.T. Prognostic significance of perineural invasion in patients with stage II/III gastric cancer undergoing radical surgery. J. Pers. Med. 2022, 12, 962. [Google Scholar] [CrossRef]
- Tsai, C.Y.; Lin, T.A.; Huang, S.C.; Hsu, J.T.; Yeh, C.N.; Chen, T.C.; Chiu, C.T.; Chen, J.S.; Yeh, T.S. Is Adjuvant chemotherapy necessary for patients with deficient mismatch repair gastric cancer?-Autophagy inhibition matches the mismatched. Oncologist 2020, 25, e1021–e1030. [Google Scholar] [CrossRef] [Green Version]
- Le, D.T.; Uram, J.N.; Wang, H.; Bartlett, B.R.; Kemberling, H.; Eyring, A.D.; Skora, A.D.; Luber, B.S.; Azad, N.S.; Laheru, D.; et al. PD-1 blockade in tumors with mismatch-repair deficiency. N. Engl. J. Med. 2015, 372, 2509–2520. [Google Scholar] [CrossRef] [Green Version]
- Hashimoto, T.; Kurokawa, Y.; Takahashi, T.; Miyazaki, Y.; Tanaka, K.; Makino, T.; Yamasaki, M.; Nakajima, K.; Ikeda, J.I.; Mori, M.; et al. Predictive value of MLH1 and PD-L1 expression for prognosis and response to preoperative chemotherapy in gastric cancer. Gastric Cancer 2019, 22, 785–792. [Google Scholar] [CrossRef] [PubMed] [Green Version]
- Tie, J.; Cohen, J.D.; Lahouel, K.; Lo, S.N.; Wang, Y.; Kosmider, S.; Wong, R.; Shapiro, J.; Lee, M.; Harris, S.; et al. Circulating tumor DNA analysis guiding adjuvant therapy in stage II colon cancer. N. Engl. J. Med. 2022, 386, 2261–2272. [Google Scholar] [CrossRef] [PubMed]
- Tsuburaya, A.; Yoshida, K.; Kobayashi, M.; Yoshino, S.; Takahashi, M.; Takiguchi, N.; Tanabe, K.; Takahashi, N.; Imamura, H.; Tatsumoto, N.; et al. Sequential paclitaxel followed by tegafur and uracil (UFT) or S-1 versus UFT or S-1 monotherapy as adjuvant chemotherapy for T4a/b gastric cancer (SAMIT): A phase 3 factorial randomised controlled trial. Lancet Oncol. 2014, 15, 886–893. [Google Scholar] [CrossRef] [PubMed]
- Yen, H.H.; Chen, C.N.; Yeh, C.C.; Lai, I.R. Adjuvant tegafur-uracil (UFT) or S-1 monotherapy for advanced gastric cancer: A single center experience. World J. Surg. Oncol. 2021, 19, 124. [Google Scholar] [CrossRef] [PubMed]


| Parameter | Chemotherapy | p-Value | |
|---|---|---|---|
| No | Yes | ||
| No. of cases (%) | 83 (60.6) | 54 (39.4) | |
| Age, median (range) (years) | 71 (32–91) | 61 (33–86) | 0.003 |
| <65 | 31 (37.3) | 32 (59.3) | 0.012 |
| ≥65 | 52 (62.7) | 22 (40.7) | |
| Sex, n (%) | 0.535 | ||
| Male | 58 (69.9) | 35 (64.8) | |
| Female | 25 (30.1) | 19 (35.2) | |
| Charlson comorbidity index score, n (%) | 0.133 | ||
| 0 | 30 (36.1) | 24 (44.4) | |
| 1 | 27 (32.5) | 19 (35.2) | |
| 2 | 12 (14.5) | 9 (16.7) | |
| ≥3 | 14 (16.9) | 2 (3.7) | |
| Stump cancer, n (%) | 6 (7.2) | 0 | 0.081 |
| Type of resection, n (%) | 0.533 | ||
| Total gastrectomy | 24 (28.9) | 13 (24.1) | |
| Partial gastrectomy | 59 (71.1) | 41 (75.9) | |
| Location, n (%) | 0.405 | ||
| Upper | 14 (16.9) | 13 (24.1) | |
| Middle | 24 (28.9) | 11 (20.3) | |
| Lower | 45 (54.2) | 30 (55.6) | |
| Tumor size (cm), median (range) | 3.8 (1–16) | 4.0 (1–11) | 0.290 |
| Number of lymph nodes retrieved, median (range) | 35 (17–91) | 41.5 (16–121) | 0.042 |
| Histology, n (%) | 0.113 | ||
| Differentiated | 39 (47.0) | 18 (33.3) | |
| Undifferentiated | 44 (53.0) | 36 (66.7) | |
| Vascular invasion, n (%) | 4 (4.8) | 9 (16.7) | 0.021 |
| Lymphatic invasion, n (%) | 6 (7.2) | 8 (14.8) | 0.152 |
| Perineural invasion, n (%) | 29 (34.9) | 29 (53.7) | 0.030 |
| Complications, n (%) | 12 (14.5) | 12 (22.2) | 0.243 |
| Parameter | Recurrence | p-Value | |
|---|---|---|---|
| No | Yes | ||
| No. of cases (%) | 116 (84.7) | 21 (15.3) | |
| Age, median (range) (years) | 68 (33–91) | 62 (32–84) | 0.141 |
| <65 | 51 (44.0) | 12 (57.1) | 0.265 |
| ≥65 | 65 (56.0) | 9 (42.9) | |
| Sex, n (%) | 0.524 | ||
| Male | 80 (69.0) | 13 (61.9) | |
| Female | 36 (31.0) | 8 (38.1) | |
| Charlson comorbidity index score, n (%) | 0.274 | ||
| 0 | 46 (39.7) | 8 (38.2) | |
| 1 | 42 (36.2) | 4 (19.0) | |
| 2 | 16 (13.8) | 5 (23.8) | |
| ≥3 | 12 (10.3) | 4 (19.0) | |
| Stump cancer, n (%) | 3 (2.6) | 3 (14.3) | 0.046 |
| Type of resection, n (%) | 0.075 | ||
| Total gastrectomy | 28 (24.1) | 9 (42.9) | |
| Partial gastrectomy | 88 (75.9) | 12 (57.1) | |
| Location, n (%) | 0.108 | ||
| Upper | 25 (21.6) | 2 (9.5) | |
| Middle | 26 (22.4) | 9 (42.9) | |
| Lower | 65 (56.0) | 10 (47.6) | |
| Tumor size (cm), median (range) | 3.5 (1–16) | 5.6 (3–10) | 0.016 |
| Number of lymph nodes retrieved, median (range) | 36 (16–121) | 35 (18–84) | 0.185 |
| Histology, n (%) | 0.403 | ||
| Differentiated | 50 (43.1) | 7 (33.3) | |
| Undifferentiated | 66 (56.9) | 14 (66.7) | |
| Vascular invasion, n (%) | 11 (9.5) | 2 (9.5) | 1 |
| Lymphatic invasion, n (%) | 12 (10.3) | 2 (9.5) | >0.999 |
| Perineural invasion, n (%) | 45 (38.8) | 13 (61.9) | 0.049 |
| Complications, n (%) | 18 (15.5) | 6 (28.6) | 0.207 |
| Chemotherapy, n (%) | 48 (41.4) | 6 (28.6) | 0.269 |
| Parameter | Univariate Analysis | Multivariate Analysis | ||||
|---|---|---|---|---|---|---|
| Hazard Ratio | 95% CI | p-Value | Hazard Ratio | 95% CI | p-Value | |
| Age | 0.401 | - | ||||
| <65 (n = 63) | 1.45 | 0.61–3.44 | ||||
| ≥65 (n = 74) | 1 | |||||
| Sex | - | |||||
| Male (n = 93) | 1 | |||||
| Female (n = 44) | 1.30 | 0.54–3.13 | 0.563 | |||
| Charlson comorbidity index score | - | |||||
| 0 (n = 54) | 1 | |||||
| 1 (n = 46) | 0.68 | 0.20–2.25 | 0.526 | |||
| 2 (n = 21) | 1.96 | 0.64–6.01 | 0.237 | |||
| ≥3 (n = 16) | 2.39 | 0.71–7.97 | 0.158 | |||
| Stump cancer | ||||||
| No (n = 131) | 1 | 1 | ||||
| Yes (n = 6) | 6.02 | 1.75–20.76 | 0.004 | 2.61 | 0.69–9.85 | 0.158 |
| Type of resection | - | |||||
| Total gastrectomy (n = 37) | 1.96 | 0.83–4.66 | 0.126 | |||
| Partial gastrectomy (n = 100) | 1 | |||||
| Location | ||||||
| Upper (n = 27) | 1 | 1 | ||||
| Middle (n = 35) | 3.70 | 0.80–17.11 | 0.095 | 2.09 | 0.40–10.94 | 0.384 |
| Lower (n = 75) | 2.03 | 0.44–9.28 | 0.361 | 1.59 | 0.34–7.32 | 0.555 |
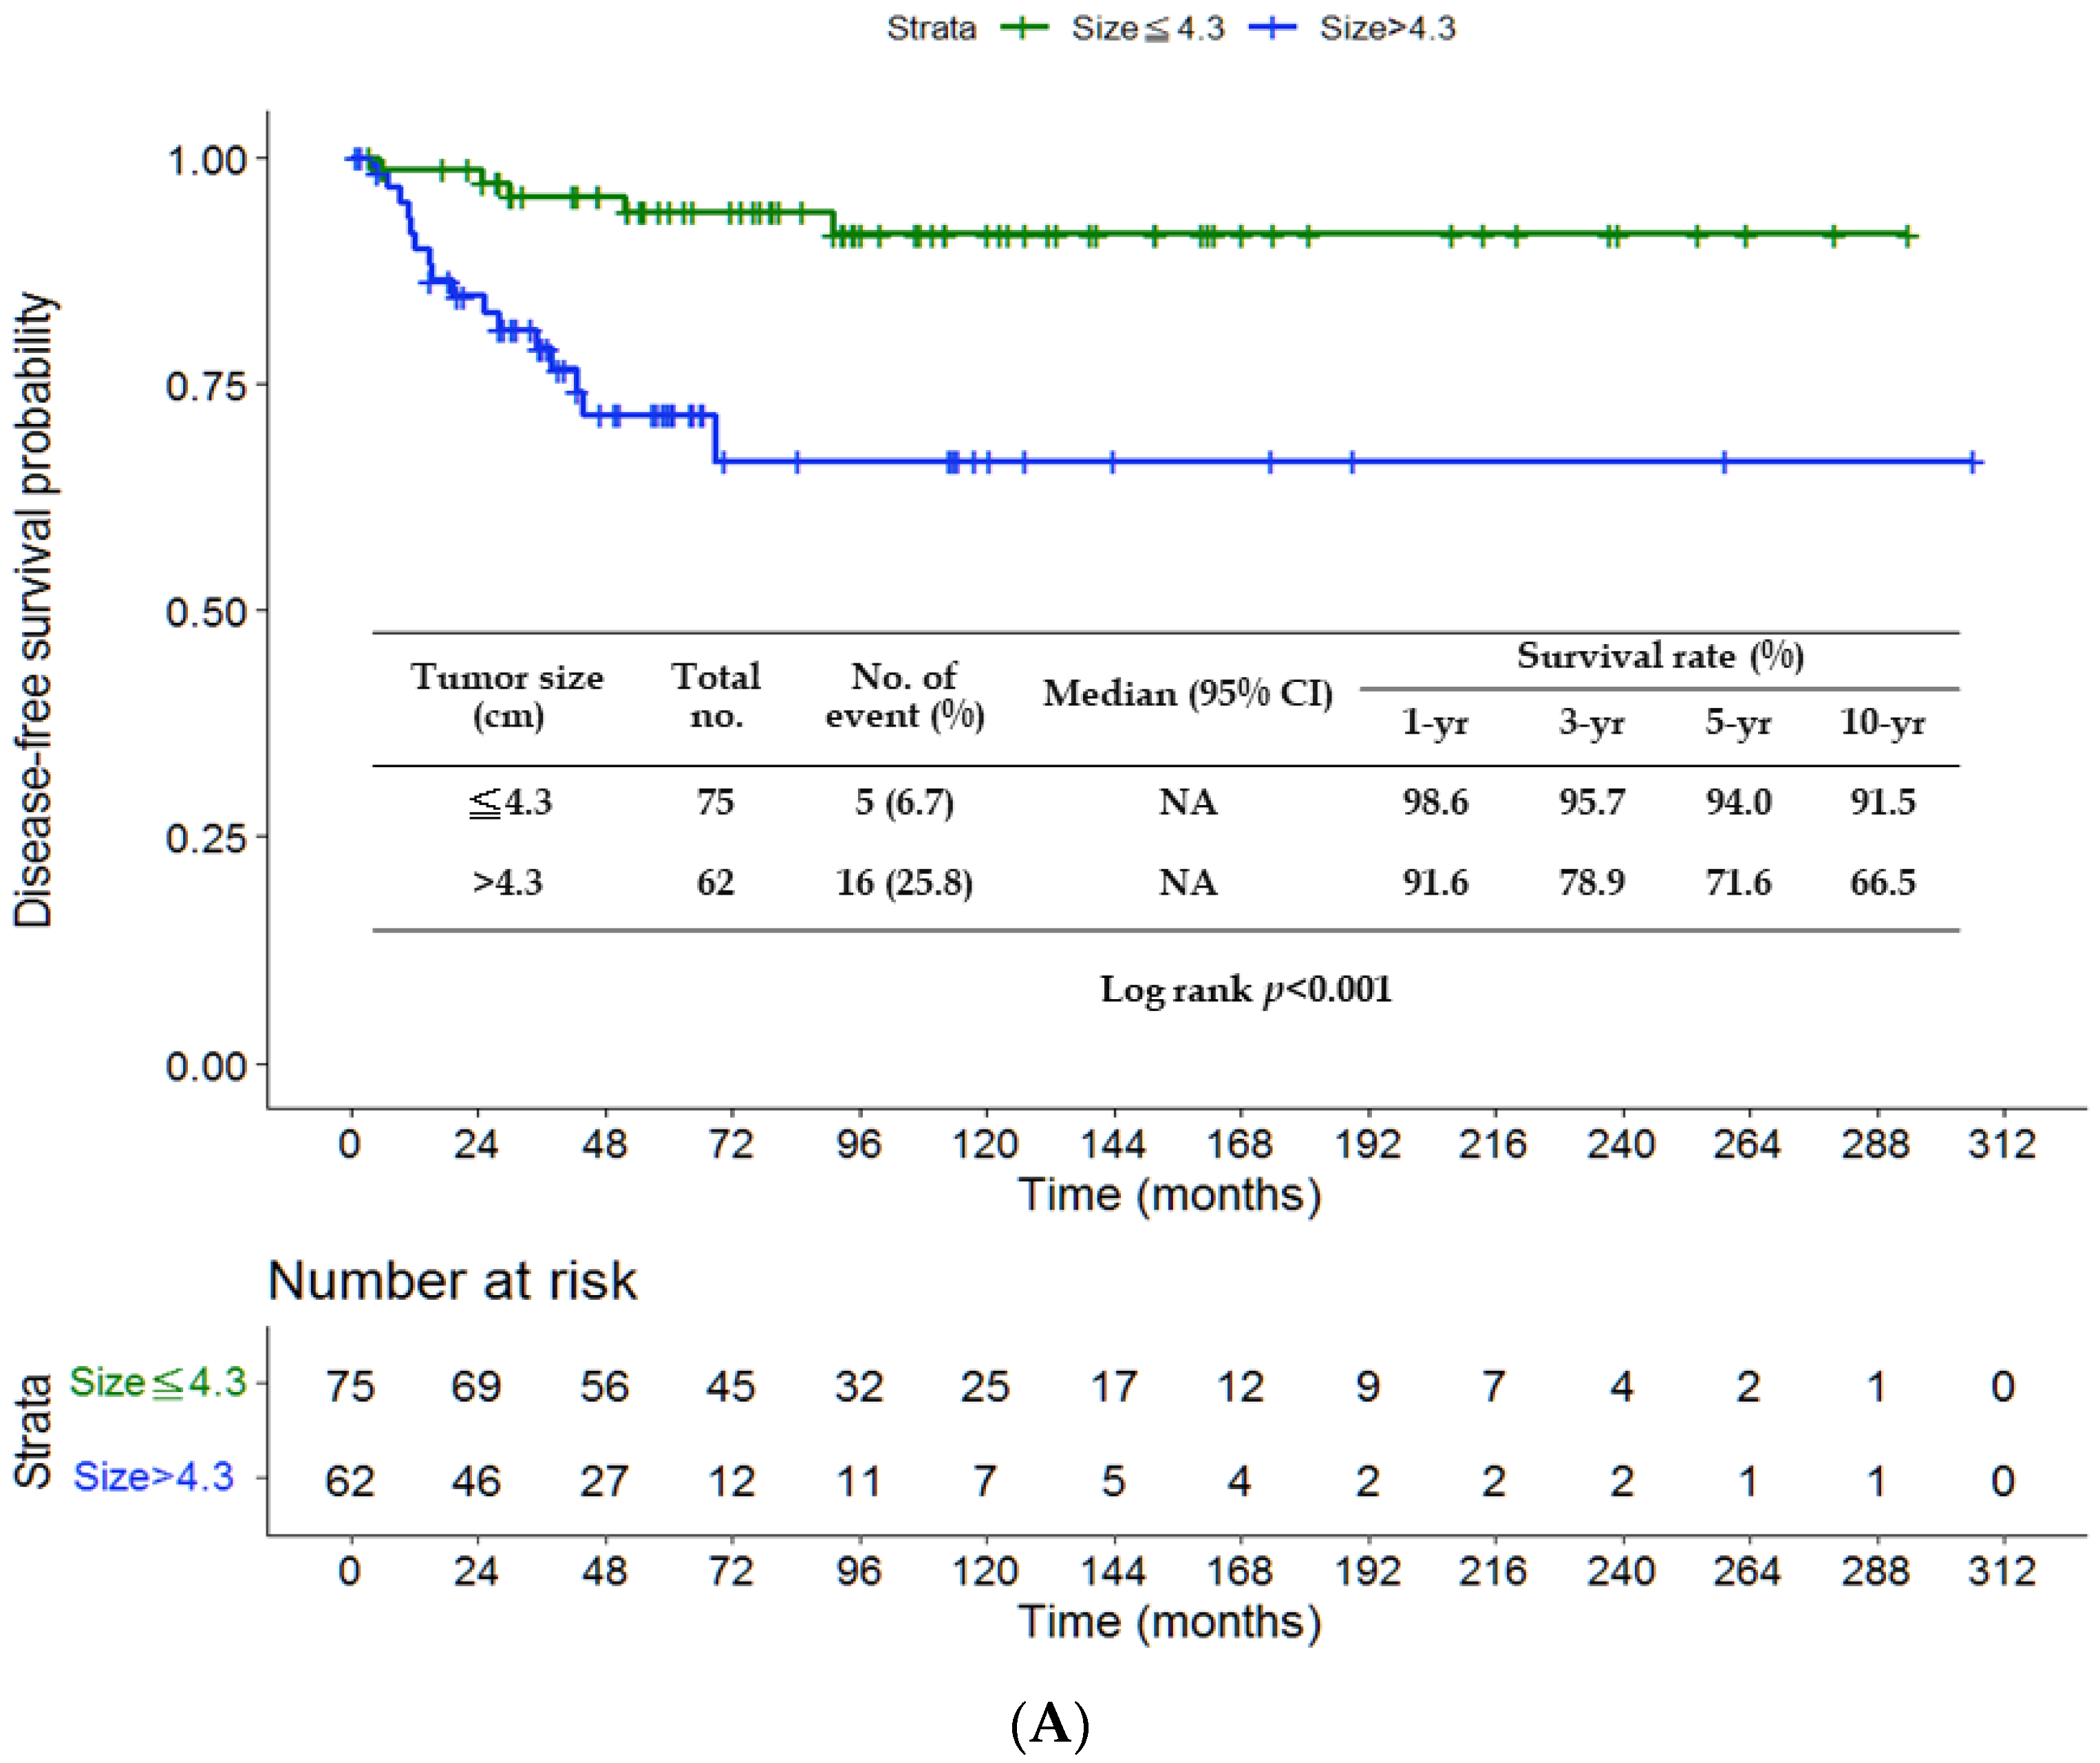
| Tumor size (cm) | ||||||
| ≤4.3 (n = 75) | 1 | 1 | ||||
| >4.3 (n = 62) | 5.20 | 1.89–14.33 | 0.001 | 4.55 | 1.59–12.99 | 0.005 |
| Histology | - | |||||
| Differentiated (n = 57) | 1 | |||||
| Undifferentiated (n = 80) | 1.53 | 0.62–3.78 | 0.363 | |||
| Vascular invasion | - | |||||
| No (n = 124) | 1 | |||||
| Yes (n = 13) | 0.92 | 0.21–3.94 | 0.909 | |||
| Lymphatic invasion | - | |||||
| No (n = 123) | 1 | |||||
| Yes (n = 14) | 1.02 | 0.24–4.39 | 0.978 | |||
| Perineural invasion | ||||||
| No (n = 79) | 1 | 1 | ||||
| Yes (n = 58) | 2.36 | 0.98–5.71 | 0.056 | 2.02 | 0.76–5.36 | 0.159 |
| Complications | ||||||
| No (n = 113) | 1 | 1 | ||||
| Yes (n = 24) | 2.64 | 1.01–6.90 | 0.047 | 1.18 | 0.41–3.44 | 0.757 |
| Chemotherapy | - | |||||
| No (n = 83) | 1.79 | 0.69–4.61 | 0.228 | |||
| Yes (n = 54) | 1 | |||||
| Parameter | Univariate Analysis | Multivariate Analysis | ||||
|---|---|---|---|---|---|---|
| Hazard Ratio | 95% CI | p-Value | Hazard Ratio | 95% CI | p-Value | |
| Age | 0.537 | - | ||||
| <65 (n = 63) | 1.32 | 0.55–3.19 | ||||
| ≥65 (n = 74) | 1 | |||||
| Sex | - | |||||
| Male (n = 93) | 1 | |||||
| Female (n = 44) | 1.38 | 0.56–3.37 | 0.483 | |||
| Charlson comorbidity index score | - | |||||
| 0 (n = 54) | 1 | |||||
| 1 (n = 46) | 0.51 | 0.14–1.93 | 0.321 | |||
| 2 (n = 21) | 2.00 | 0.65–6.12 | 0.226 | |||
| ≥3 (n = 16) | 2.43 | 0.73–8.17 | 0.150 | |||
| Stump cancer | ||||||
| No (n = 131) | 1 | 1 | ||||
| Yes (n = 6) | 6.08 | 1.74–21.26 | 0.005 | 2.61 | 0.68–9.98 | 0.162 |
| Type of resection | - | |||||
| Total gastrectomy (n = 37) | 1.71 | 0.70–4.17 | 0.242 | |||
| Partial gastrectomy (n = 100) | 1 | |||||
| Location | ||||||
| Upper (n = 27) | 1 | 1 | ||||
| Middle (n = 35) | 7.30 | 0.93–57.66 | 0.059 | 3.90 | 0.45–33.92 | 0.218 |
| Lower (n = 75) | 4.11 | 0.53–32.20 | 0.178 | 3.19 | 0.40–25.16 | 0.271 |
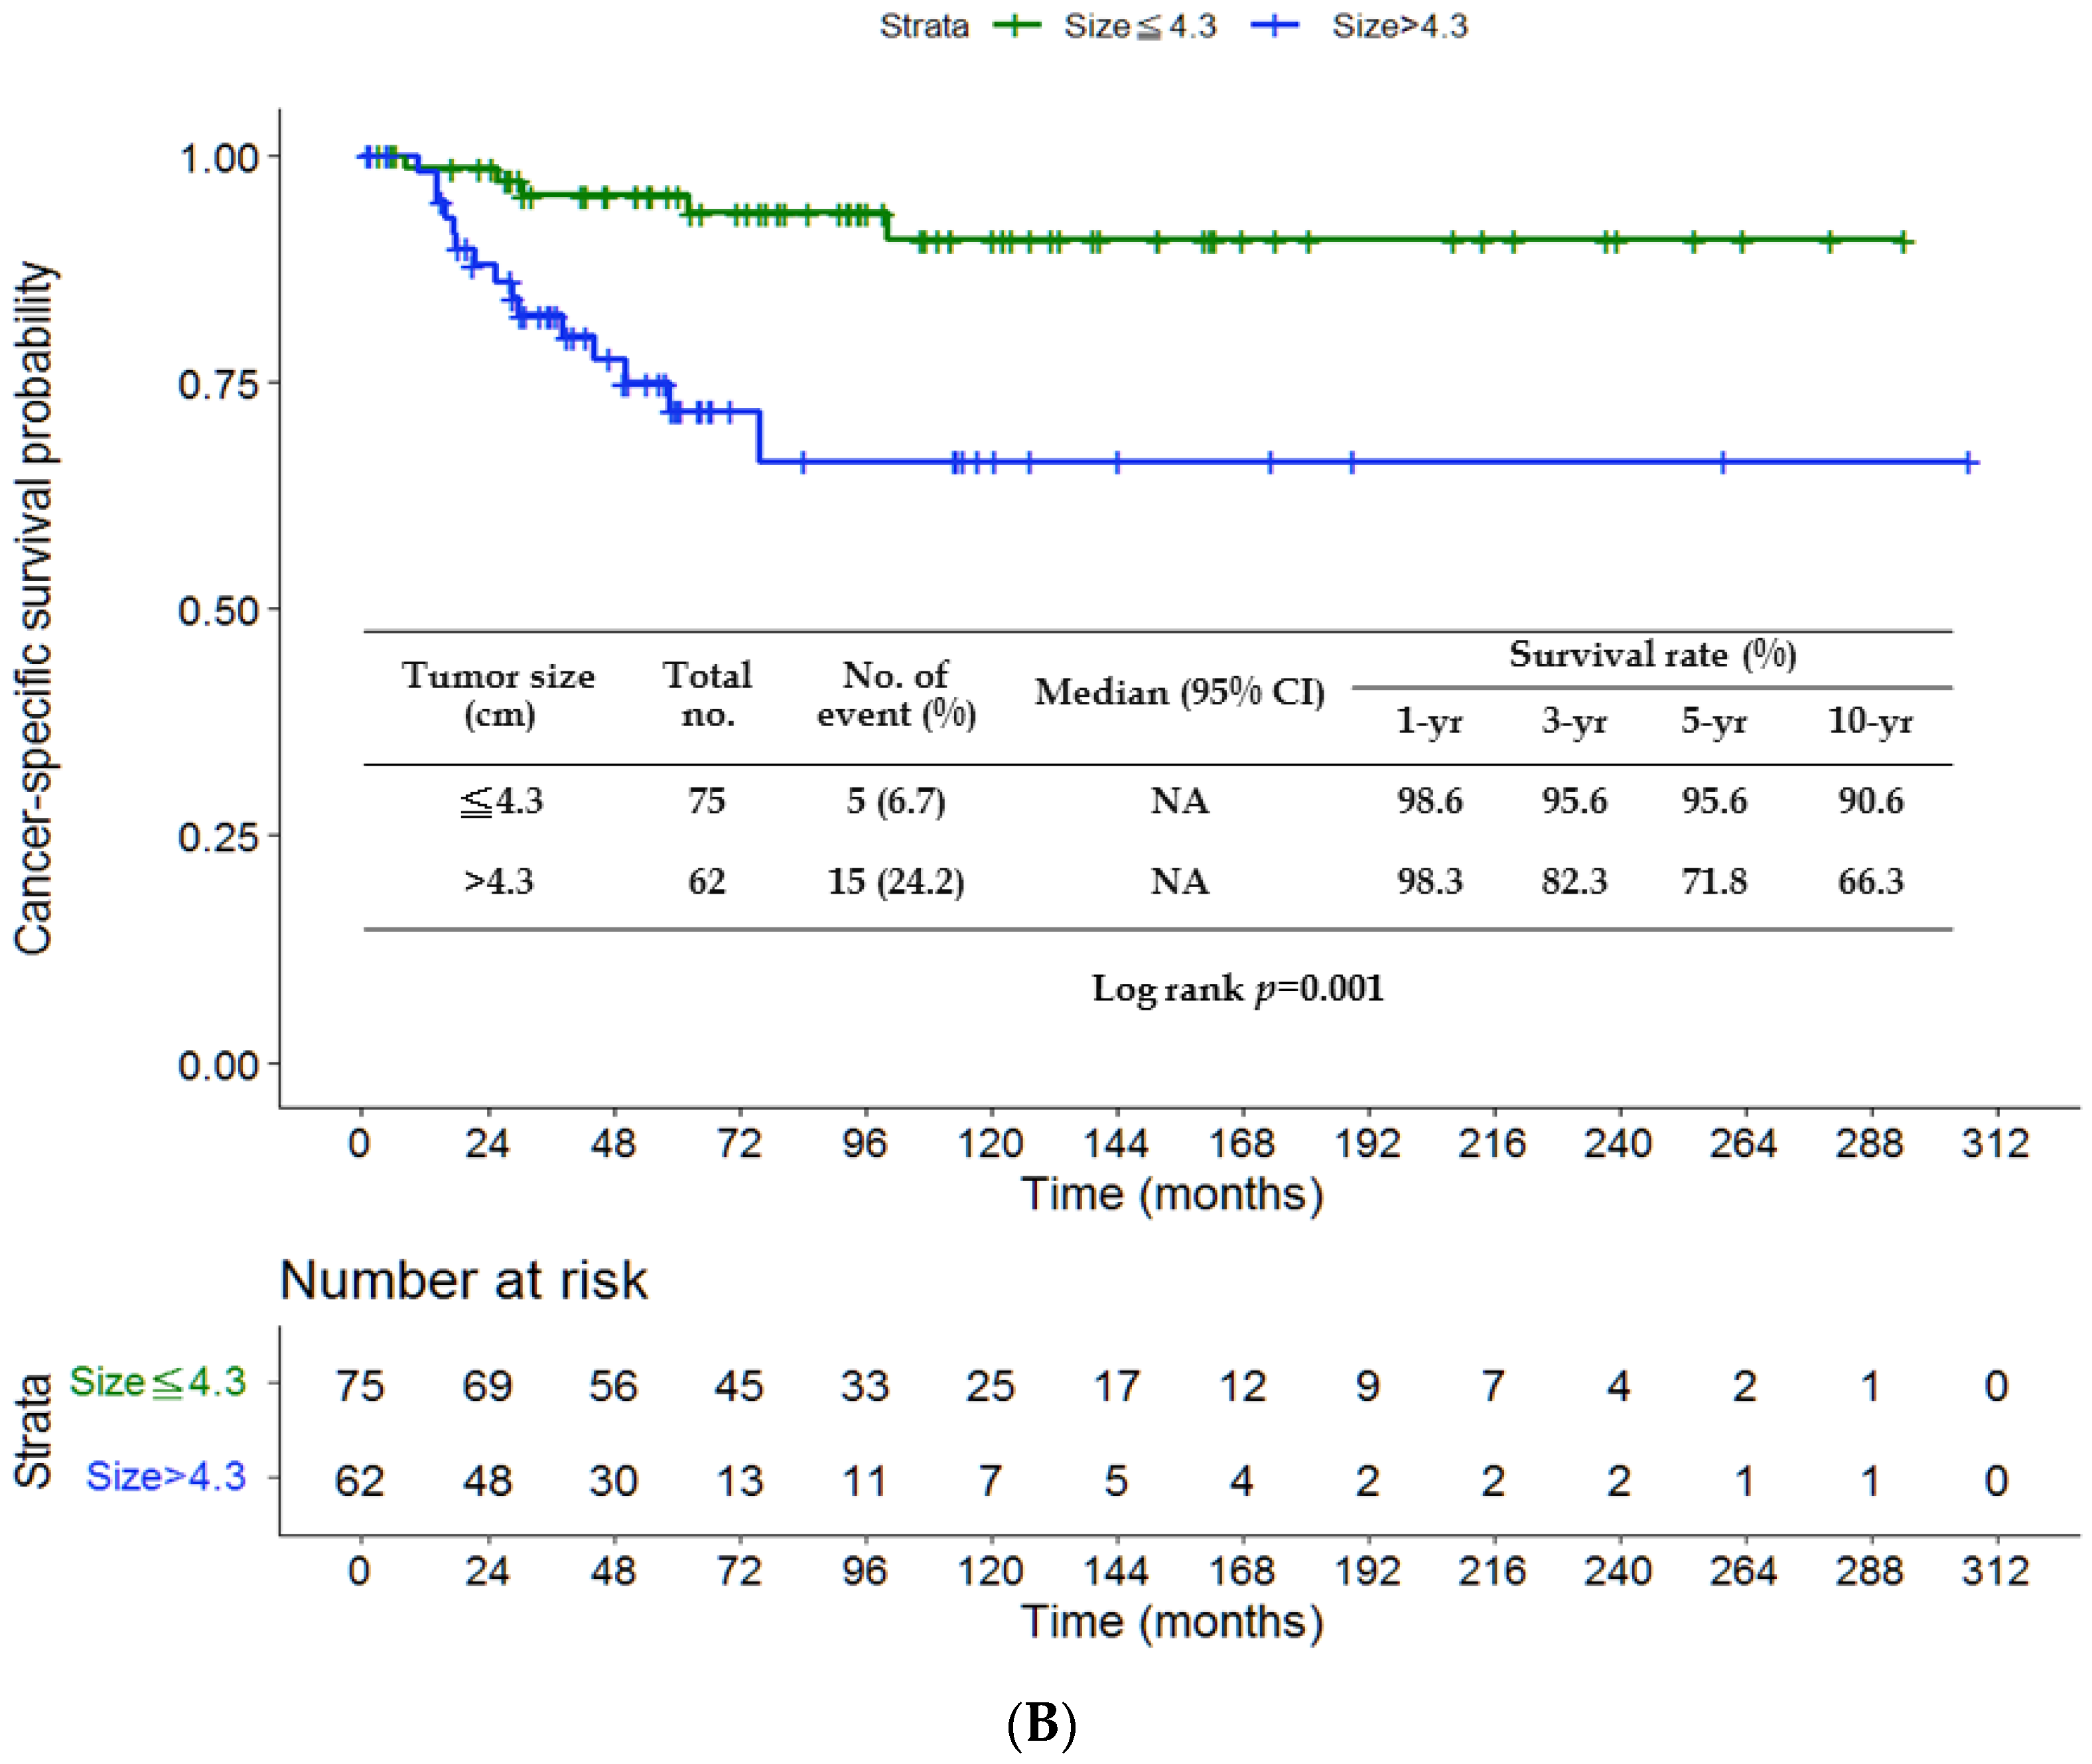
| Tumor size (cm) | ||||||
| ≤4.3 (n = 75) | 1 | 1 | ||||
| >4.3 (n = 62) | 4.90 | 1.77–13.62 | 0.002 | 3.97 | 1.38–11.43 | 0.011 |
| Histology | - | |||||
| Differentiated (n = 57) | 1 | |||||
| Undifferentiated (n = 80) | 1.79 | 0.69–4.67 | 0.233 | |||
| Vascular invasion | - | |||||
| No (n = 124) | 1 | |||||
| Yes (n = 13) | 0.99 | 0.23–4.27 | 0.988 | |||
| Lymphatic invasion | - | |||||
| No (n = 123) | 1 | |||||
| Yes (n = 14) | 1.17 | 0.27–5.07 | 0.835 | |||
| Perineural invasion | ||||||
| No (n = 79) | 1 | 1 | ||||
| Yes (n = 58) | 2.22 | 0.91–5.44 | 0.081 | 1.87 | 0.69–5.01 | 0.216 |
| Complications | ||||||
| No (n = 113) | 1 | 1 | ||||
| Yes (n = 24) | 3.11 | 1.17–8.26 | 0.023 | 1.39 | 0.47–4.11 | 0.551 |
| Chemotherapy | - | |||||
| No (n = 83) | 2.16 | 0.79–5.95 | 0.136 | |||
| Yes (n = 54) | 1 | |||||
Disclaimer/Publisher’s Note: The statements, opinions and data contained in all publications are solely those of the individual author(s) and contributor(s) and not of MDPI and/or the editor(s). MDPI and/or the editor(s) disclaim responsibility for any injury to people or property resulting from any ideas, methods, instructions or products referred to in the content. |
© 2023 by the authors. Licensee MDPI, Basel, Switzerland. This article is an open access article distributed under the terms and conditions of the Creative Commons Attribution (CC BY) license (https://creativecommons.org/licenses/by/4.0/).
Share and Cite
Chen, Y.-F.; Chen, M.-Y.; Le, P.-H.; Chen, T.-H.; Kuo, C.-J.; Wang, S.-Y.; Huang, S.-C.; Chou, W.-C.; Yeh, T.-S.; Hsu, J.-T. Prognostic Factors and the Role of Adjuvant Chemotherapy in Pathological Node-Negative T3 Gastric Cancer. J. Pers. Med. 2023, 13, 553. https://doi.org/10.3390/jpm13030553
Chen Y-F, Chen M-Y, Le P-H, Chen T-H, Kuo C-J, Wang S-Y, Huang S-C, Chou W-C, Yeh T-S, Hsu J-T. Prognostic Factors and the Role of Adjuvant Chemotherapy in Pathological Node-Negative T3 Gastric Cancer. Journal of Personalized Medicine. 2023; 13(3):553. https://doi.org/10.3390/jpm13030553
Chicago/Turabian StyleChen, Yi-Fu, Ming-Yang Chen, Puo-Hsien Le, Tsung-Hsing Chen, Chia-Jung Kuo, Shang-Yu Wang, Shih-Chiang Huang, Wen-Chi Chou, Ta-Sen Yeh, and Jun-Te Hsu. 2023. "Prognostic Factors and the Role of Adjuvant Chemotherapy in Pathological Node-Negative T3 Gastric Cancer" Journal of Personalized Medicine 13, no. 3: 553. https://doi.org/10.3390/jpm13030553