Article

Personalized Model to Predict Small for Gestational Age at Delivery Using Fetal Biometrics, Maternal Characteristics, and Pregnancy Biomarkers: A Retrospective Cohort Study of Births Assisted at a Spanish Hospital

by
Peña Dieste-Pérez
1,*,
Ricardo Savirón-Cornudella
2,
Mauricio Tajada-Duaso
1,
Faustino R. Pérez-López
3,
Sergio Castán-Mateo
1,
Gerardo Sanz
4 and
Luis Mariano Esteban
5,*
1
Department of Obstetrics and Gynecology, Miguel Servet University Hospital and Aragón Health Research Institute, 50009 Zaragoza, Spain
2
Department of Obstetrics and Gynecology, San Carlos Clinical Hospital and San Carlos Health Research Institute (IdISSC), Complutense University, 28040 Madrid, Spain
3
Department of Obstetrics and Gynecology, University of Zaragoza Faculty of Medicine and Aragón Health Research Institute, 50009 Zaragoza, Spain
4
Department of Statistical Methods and Institute for Biocomputation and Physics of Complex Systems-BIFI, University of Zaragoza,50018 Zaragoza, Spain
5
Engineering School of La Almunia, University of Zaragoza, 50100 La Almunia de Doña Godina, Spain
*
Authors to whom correspondence should be addressed.
J. Pers. Med. 2022, 12(5), 762; https://doi.org/10.3390/jpm12050762
Submission received: 11 March 2022 / Revised: 29 April 2022 / Accepted: 5 May 2022 / Published: 8 May 2022
(This article belongs to the Special Issue Pregnancy Complication and Precision Medicine)

Abstract

:
Small for gestational age (SGA) is defined as a newborn with a birth weight for gestational age < 10th percentile. Routine third-trimester ultrasound screening for fetal growth assessment has detection rates (DR) from 50 to 80%. For this reason, the addition of other markers is being studied, such as maternal characteristics, biochemical values, and biophysical models, in order to create personalized combinations that can increase the predictive capacity of the ultrasound. With this purpose, this retrospective cohort study of 12,912 cases aims to compare the potential value of third-trimester screening, based on estimated weight percentile (EPW), by universal ultrasound at 35–37 weeks of gestation, with a combined model integrating maternal characteristics and biochemical markers (PAPP-A and β-HCG) for the prediction of SGA newborns. We observed that DR improved from 58.9% with the EW alone to 63.5% with the predictive model. Moreover, the AUC for the multivariate model was 0.882 (0.873–0.891 95% C.I.), showing a statistically significant difference with EPW alone (AUC 0.864 (95% C.I.: 0.854–0.873)). Although the improvements were modest, contingent detection models appear to be more sensitive than third-trimester ultrasound alone at predicting SGA at delivery.

1. Introduction

Fetal growth restriction (FGR) is defined as a failure to achieve the endorsed growth potential. This definition includes the so-called true FGR, which associates alterations in the Doppler study, suggesting a hemodynamic redistribution that reflects fetal adaptation to malnutrition/hypoxia, as well as histological and biochemical signs of placental disease with an increased risk of preeclampsia [1]. These fetuses have a 5- to 10-fold increased risk of death in utero and increased risk of perinatal morbidity and mortality and suboptimal long-term outcomes [2,3,4,5]. This group also includes fetuses who were referred to as small for gestational age, whose estimated fetal weight (EFW) was below a certain threshold, most commonly the 10th percentile [6,7]. They also have a higher morbidity and perinatal mortality but are not usually associated with the Doppler signs described for FGR. Finally, a subgroup of the above corresponds to so-called “constitutionally small” fetuses, which are born small, with an estimated percentile weight (EPW) below the 10th percentile, but are otherwise healthy [8].
While these definitions seem conceptually simple, the distinction in clinical practice can be challenging. Most small for gestational age (SGA) babies go unnoticed until birth, even when a routine third-trimester ultrasound is performed [9,10]. On the other hand, this category misses cases of growth restriction that do not fall below the 10th percentile. In spite of this, this definition can still help to identify a subset of pregnancies considered as high risk [1].
Nowadays, the diagnostic strategy for the detection of these fetuses prenatally is routine third-trimester ultrasound, performed around 35–37 weeks of gestation, which evaluates fetal growth. However, this has quite low detection rates (DR), ranging from 50% to 80% [11], and the impact of this on perinatal outcome is unclear [12].
For this reason, the addition of other markers, such as maternal characteristics and biochemical and biophysical parameters, is being studied. Hence, combined models are being designed that either increase the predictive capacity of basic ultrasound in the third trimester of pregnancy to predict SGA or select patients at risk of giving birth to late-onset SGA fetuses [12,13,14,15,16,17,18]. In some of these studies, an ultrasound is performed well before delivery (week 30–34) [12,15,19]; in others, several ultrasounds are performed throughout the third trimester of pregnancy, in order to longitudinally assess fetal growth [20]. In others, the Doppler study or circulating biochemical markers, such as serum placental growth factor (PlGF) and soluble fms-like tyrosine kinase-1 (sFLT), are introduced, thus increasing the sensitivity and specificity, as well as the detection rates, of SGA fetuses. However, the above strategies are not routinely performed in low-risk pregnancies [5,13,18,19,21,22,23,24].
Recent evidence suggests that the pathologies underlying FGR and SGA take place in the first trimester. An earlier assessment, before the establishment of placental dysfunction, may have the potential to improve treatment and prognosis in clinical practice [25]. The cost effectiveness would be even greater if this identification could be a spinoff from the widely-implemented first trimester combined ultrasound and biochemical screening program for Down’s syndrome, which tests for maternal serological markers pregnancy-associated plasma protein A (PAPP-A) and the beta subunit of human chorionic gonadotrophin (β-hCG) [26].
Some studies have already evaluated the individual capacity of PAPP-A and β-hCG to predict SGA. They found that these markers have an independent influence on the final birth weight and correlated a lower PAPP-A with a higher risk of the fetus developing SGA. However, their predictive powers are insufficient for them to be used alone for SGA detection [27,28,29,30].
The objective of our study was to compare the predictive capacity for SGA neonates of fetal biometry, performed in the third-trimester ultrasound on all pregnant women in a Spanish hospital between 35 and 37 weeks of gestation, with a multivariate model composed of the aforementioned ultrasound, plus maternal characteristics and biochemical markers used for the screening of chromosomal abnormalities in the first trimester of gestation (PAPP-A and β-HCG), tests which are performed in all low-risk pregnant women.

2. Material and Methods
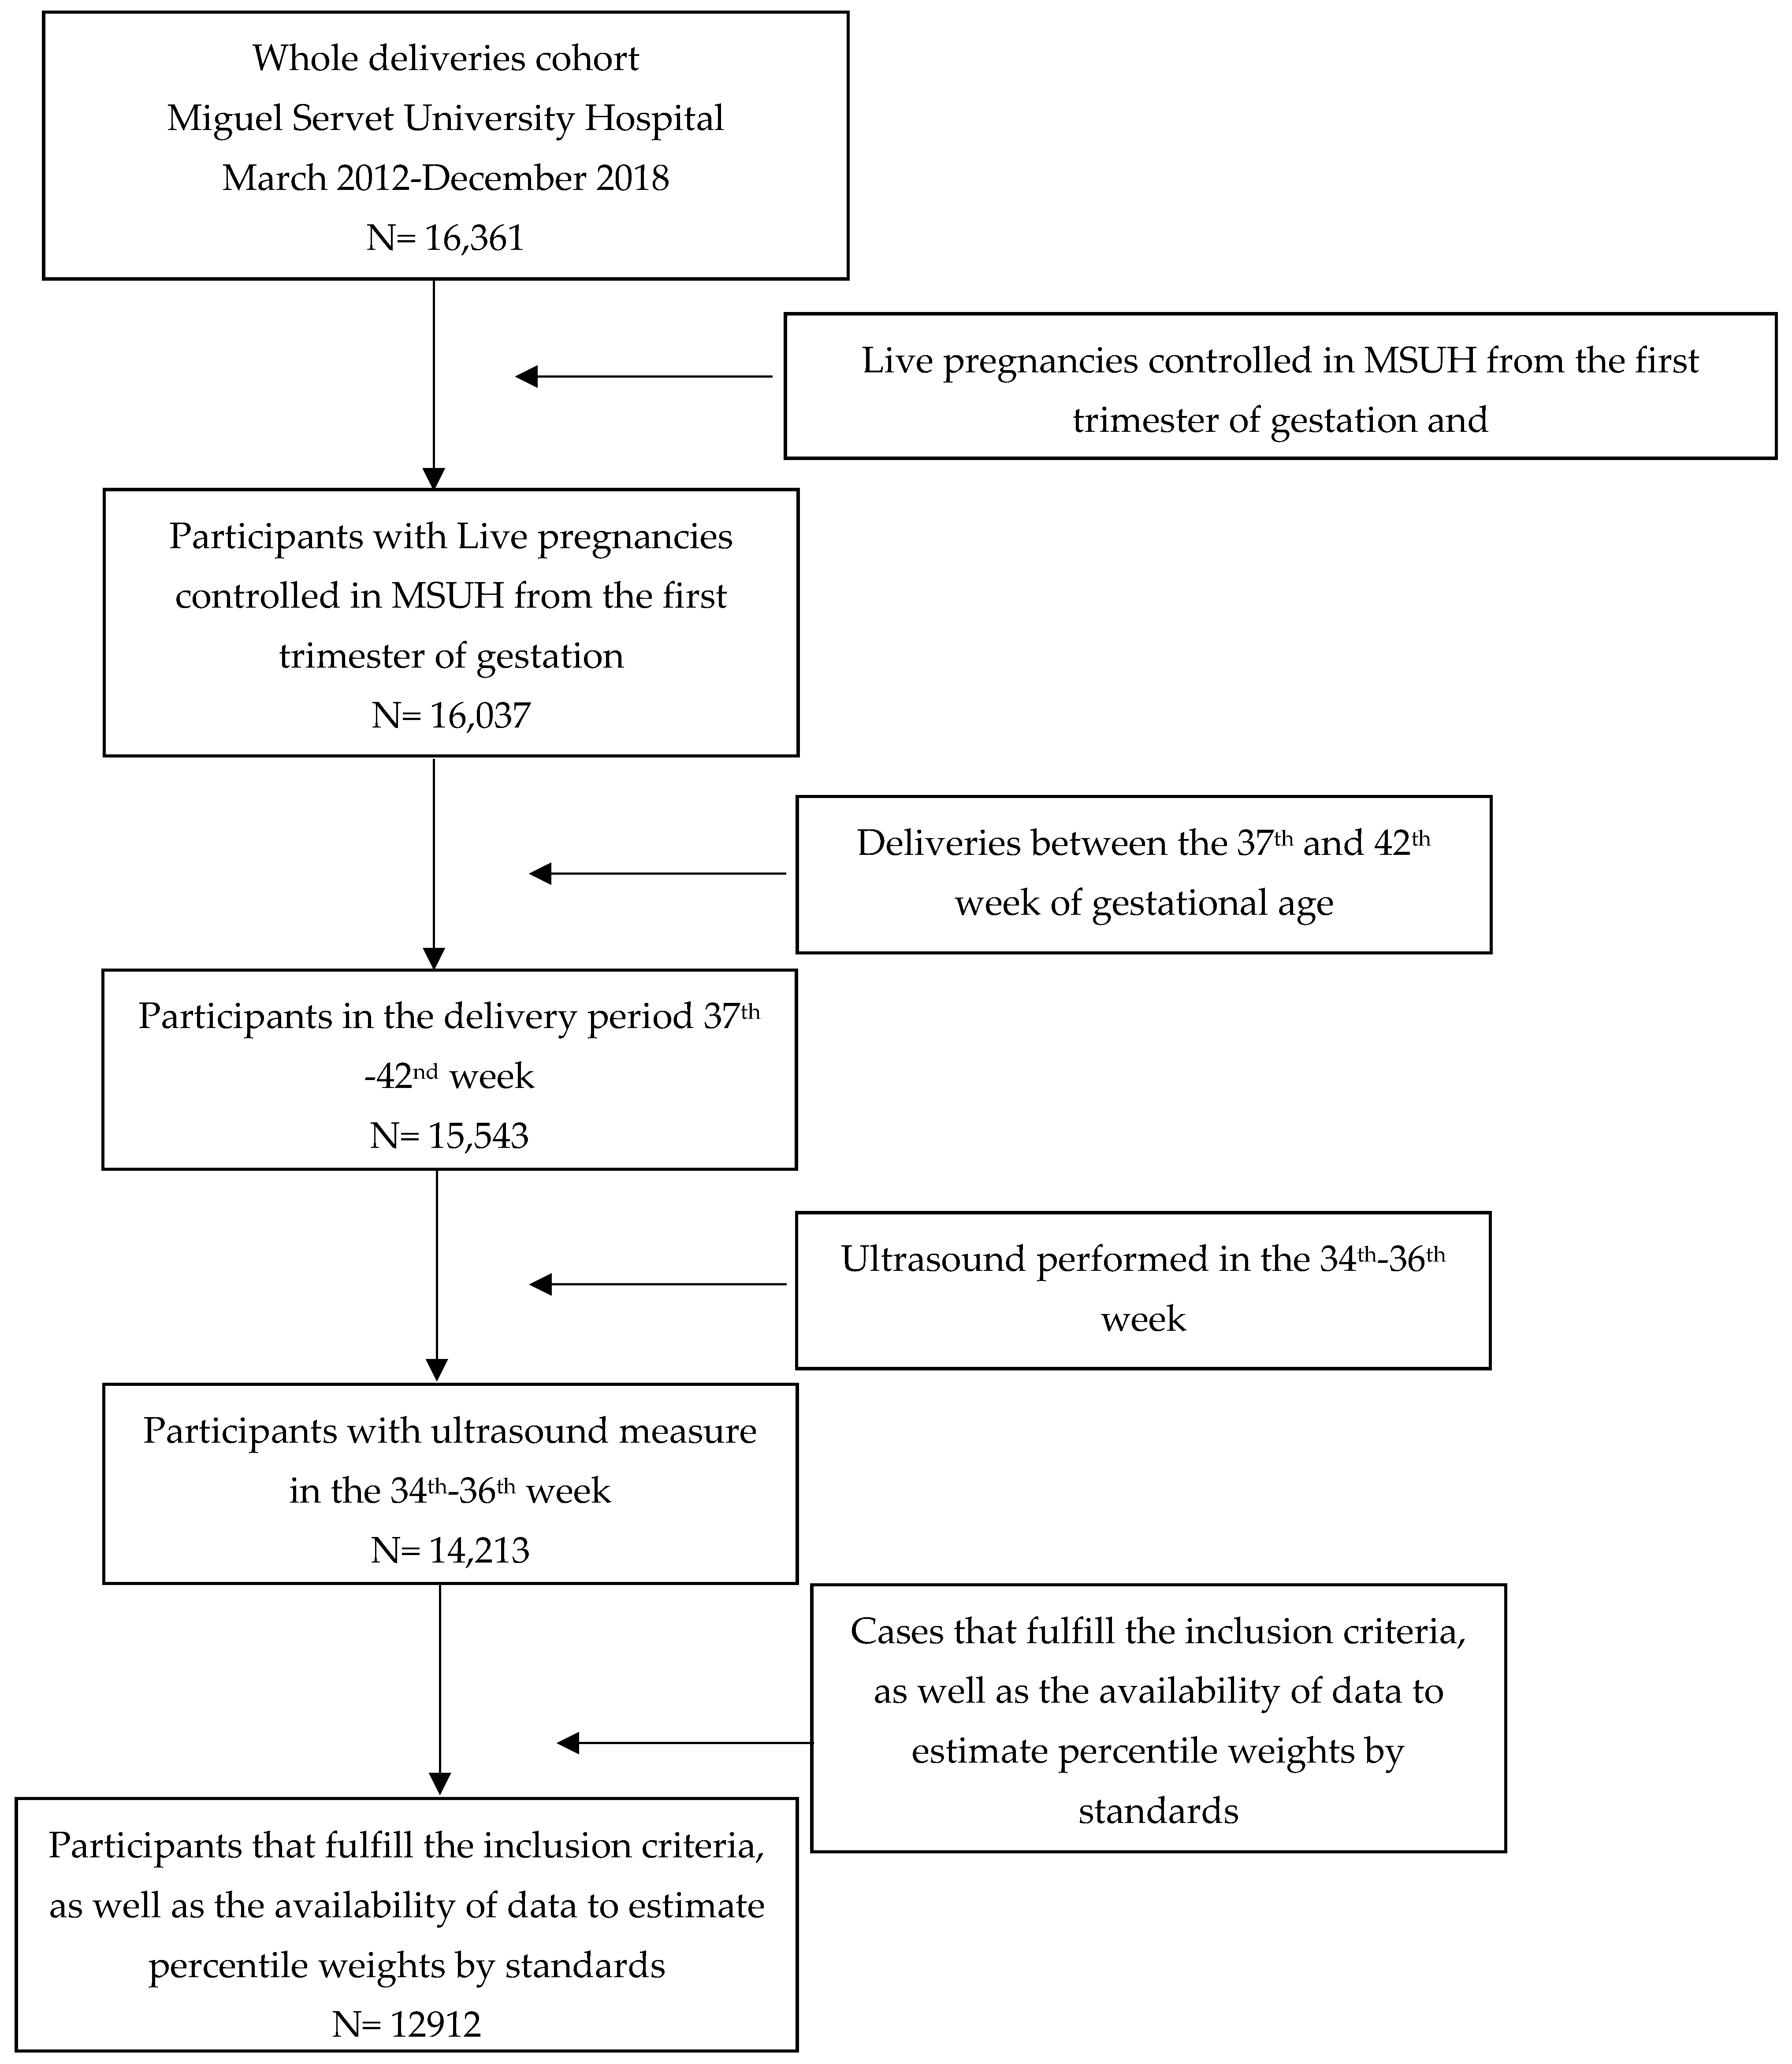
2.1. Study Design

This was a retrospective cohort study of births assisted at the Miguel Servet University Hospital (MSUH), Zaragoza, Spain, between March 2012 and December 2018. The inclusion criteria were as follows: live singleton pregnancies, controlled at the MSUH from the first trimester of gestation; fetal ultrasound assessment at a gestational age of 35 weeks (range 34–36); and deliveries between 37 and 42 weeks of gestational age, with fetuses without stillbirth associated with malformations or chromosomal abnormalities. Of the 16,361 deliveries assisted in our hospital in the study period, only the 12,912 cases that fulfilled the inclusion criteria, such as data availability to estimate percentile weights by standards, were considered. The selected sample of study participants is described, in detail, in Figure 1.
The last menstrual period was adjusted by the first trimester ultrasound [31]. Universal ultrasound screening was performed at 35 weeks (range 34–36 weeks) at the Ultrasound and Prenatal Diagnosis Unit, using either an ultrasound machine Voluson 730 Expert, E6, E8 (General Electric, Healthcare, Zipf, Austria) or Aloka Prosound SSD-5000 (Hitachi Aloka Medical Systems, Tokyo, Japan). This ultrasound test is routinely performed in all pregnancies at our center, in an attempt to increase the detection of fetal growth alterations. EFW was calculated with the formula of Hadlock et al. [32], which combines biparietal diameter, cephalic and abdominal circumference (AC), and femur length.

2.2. Estimated Percentile Weight

EPWs were calculated according to the local MSUH standard, customized to fetal gender, built using a modified version of Hadlock et al. growth charts [33], and adjusted to our population, with a coefficient of variation that changes with gestational age [34]. To assess ultrasound weight measures in the third trimester, EPWs were estimated between 34 and 36 weeks of gestational age. As a gold standard for the analysis, SGA was defined as percentile birth weight under 10, using a growth reference for the Spanish population, based on 9362 birth weights [35].

2.3. Estimated Abdominal Circumference Percentile

The AC percentile was estimated according to the Smulian et al. methodology [36]. These authors have derived a formula, based on 10,070 fetuses, for calculating the mean and standard deviation, depending on gestational age. Then, assuming a normal distribution for AC measures at a gestational age, the percentiles were estimated.

2.4. Statistical Analysis

Data were descriptively analyzed using the medians and interquartile ranges for continuous variables and absolute and relative frequencies for categorical variables. Differences between SGA and non-SGA groups were tested using Mann–Whitney and chi-square tests, as appropriate.
The predictive ability of EPW, provided by the MSUH standard, to predict SGAs was analyzed using the area under the receiver operating characteristic curve (AUC) [37]. This area is equivalent to the probability that, given two individuals, one SGA and the other non-SGA, the marker assigns a greater probability of being SGA to the individual that is really SGA. The area ranges from 0.5 to 1, with the 0.5 value corresponding to a random model, 0.7 to an acceptable model, 0.8 to a good model, 0.9 excellent model, and 1 to perfect discrimination.
To improve the prediction of SGA, we explored the added predictive ability of maternal–fetal characteristics and pathologies. These corresponded to: maternal age and body mass index at the start of pregnancy, maternal height, parity, previous cesarean, in vitro fertilization, infant gender, PAPP-A, β-HCG, smoking habits, hypertension, and diabetes. In addition, the AC percentile, estimated at the 35th week of gestational age, was added as a complementary predictor of the EPW to identify SGA fetuses at birth.
AUCs were compared using a bootstrap test [38], and the best model was taken as the one with the largest AUC value. Calibration and clinical utility analysis, by means of a calibration curve [39] and clinical utility curve (CUC) [40], complemented the validation process of the predictive model derived.
Calibration graphically analyzes the concordance between the predictions and real occurrence of the outcome, usually through calibration curves and two informative parameters: ‘intercept’ (calibration-in-the-large), which measures the difference between average predictions and average outcome; and ‘slope’, which reflects the average effect of predictions on the outcome.
The CUC reflects the consequences of choosing a cutoff point, in terms of patients with a wrongly classified outcome of interest versus processes avoided. In this curve, the X axis corresponds to the possible threshold probability points, and the Y axis represents the percentage of two measures; the first corresponds to the percentage of missing positive cases below the selected cut-off (FN), and the second to the number of individuals below the cut-off.
Analyses were performed using the R version 4.0.3 language programming package (The R Foundation for Statistical Computing, Vienna, Austria) [41].

3. Results

3.1. Descriptive Results

Table 1 shows the descriptive characteristics of the pregnancies for the SGA and non-SGA groups. For the standard calculation of EFWs, by ultrasound alone at 35 weeks (range 34 + 0 to 36 + 6 weeks), an EPW value < 10 detects 42.1% SGA at birth. The remaining 57.9% correspond to EPW > 10 at the 35th week of gestational age. An AC percentile of <10 at 35 weeks detects only 18.5% of SGA at birth. The variables body mass index, maternal height, parity, number of previous cesareans, in vitro fertilization, maternal smoking habits, hypertension, PAPP-A, and β-HCG all showed statistically significant differences between SGA and non-SGA groups.

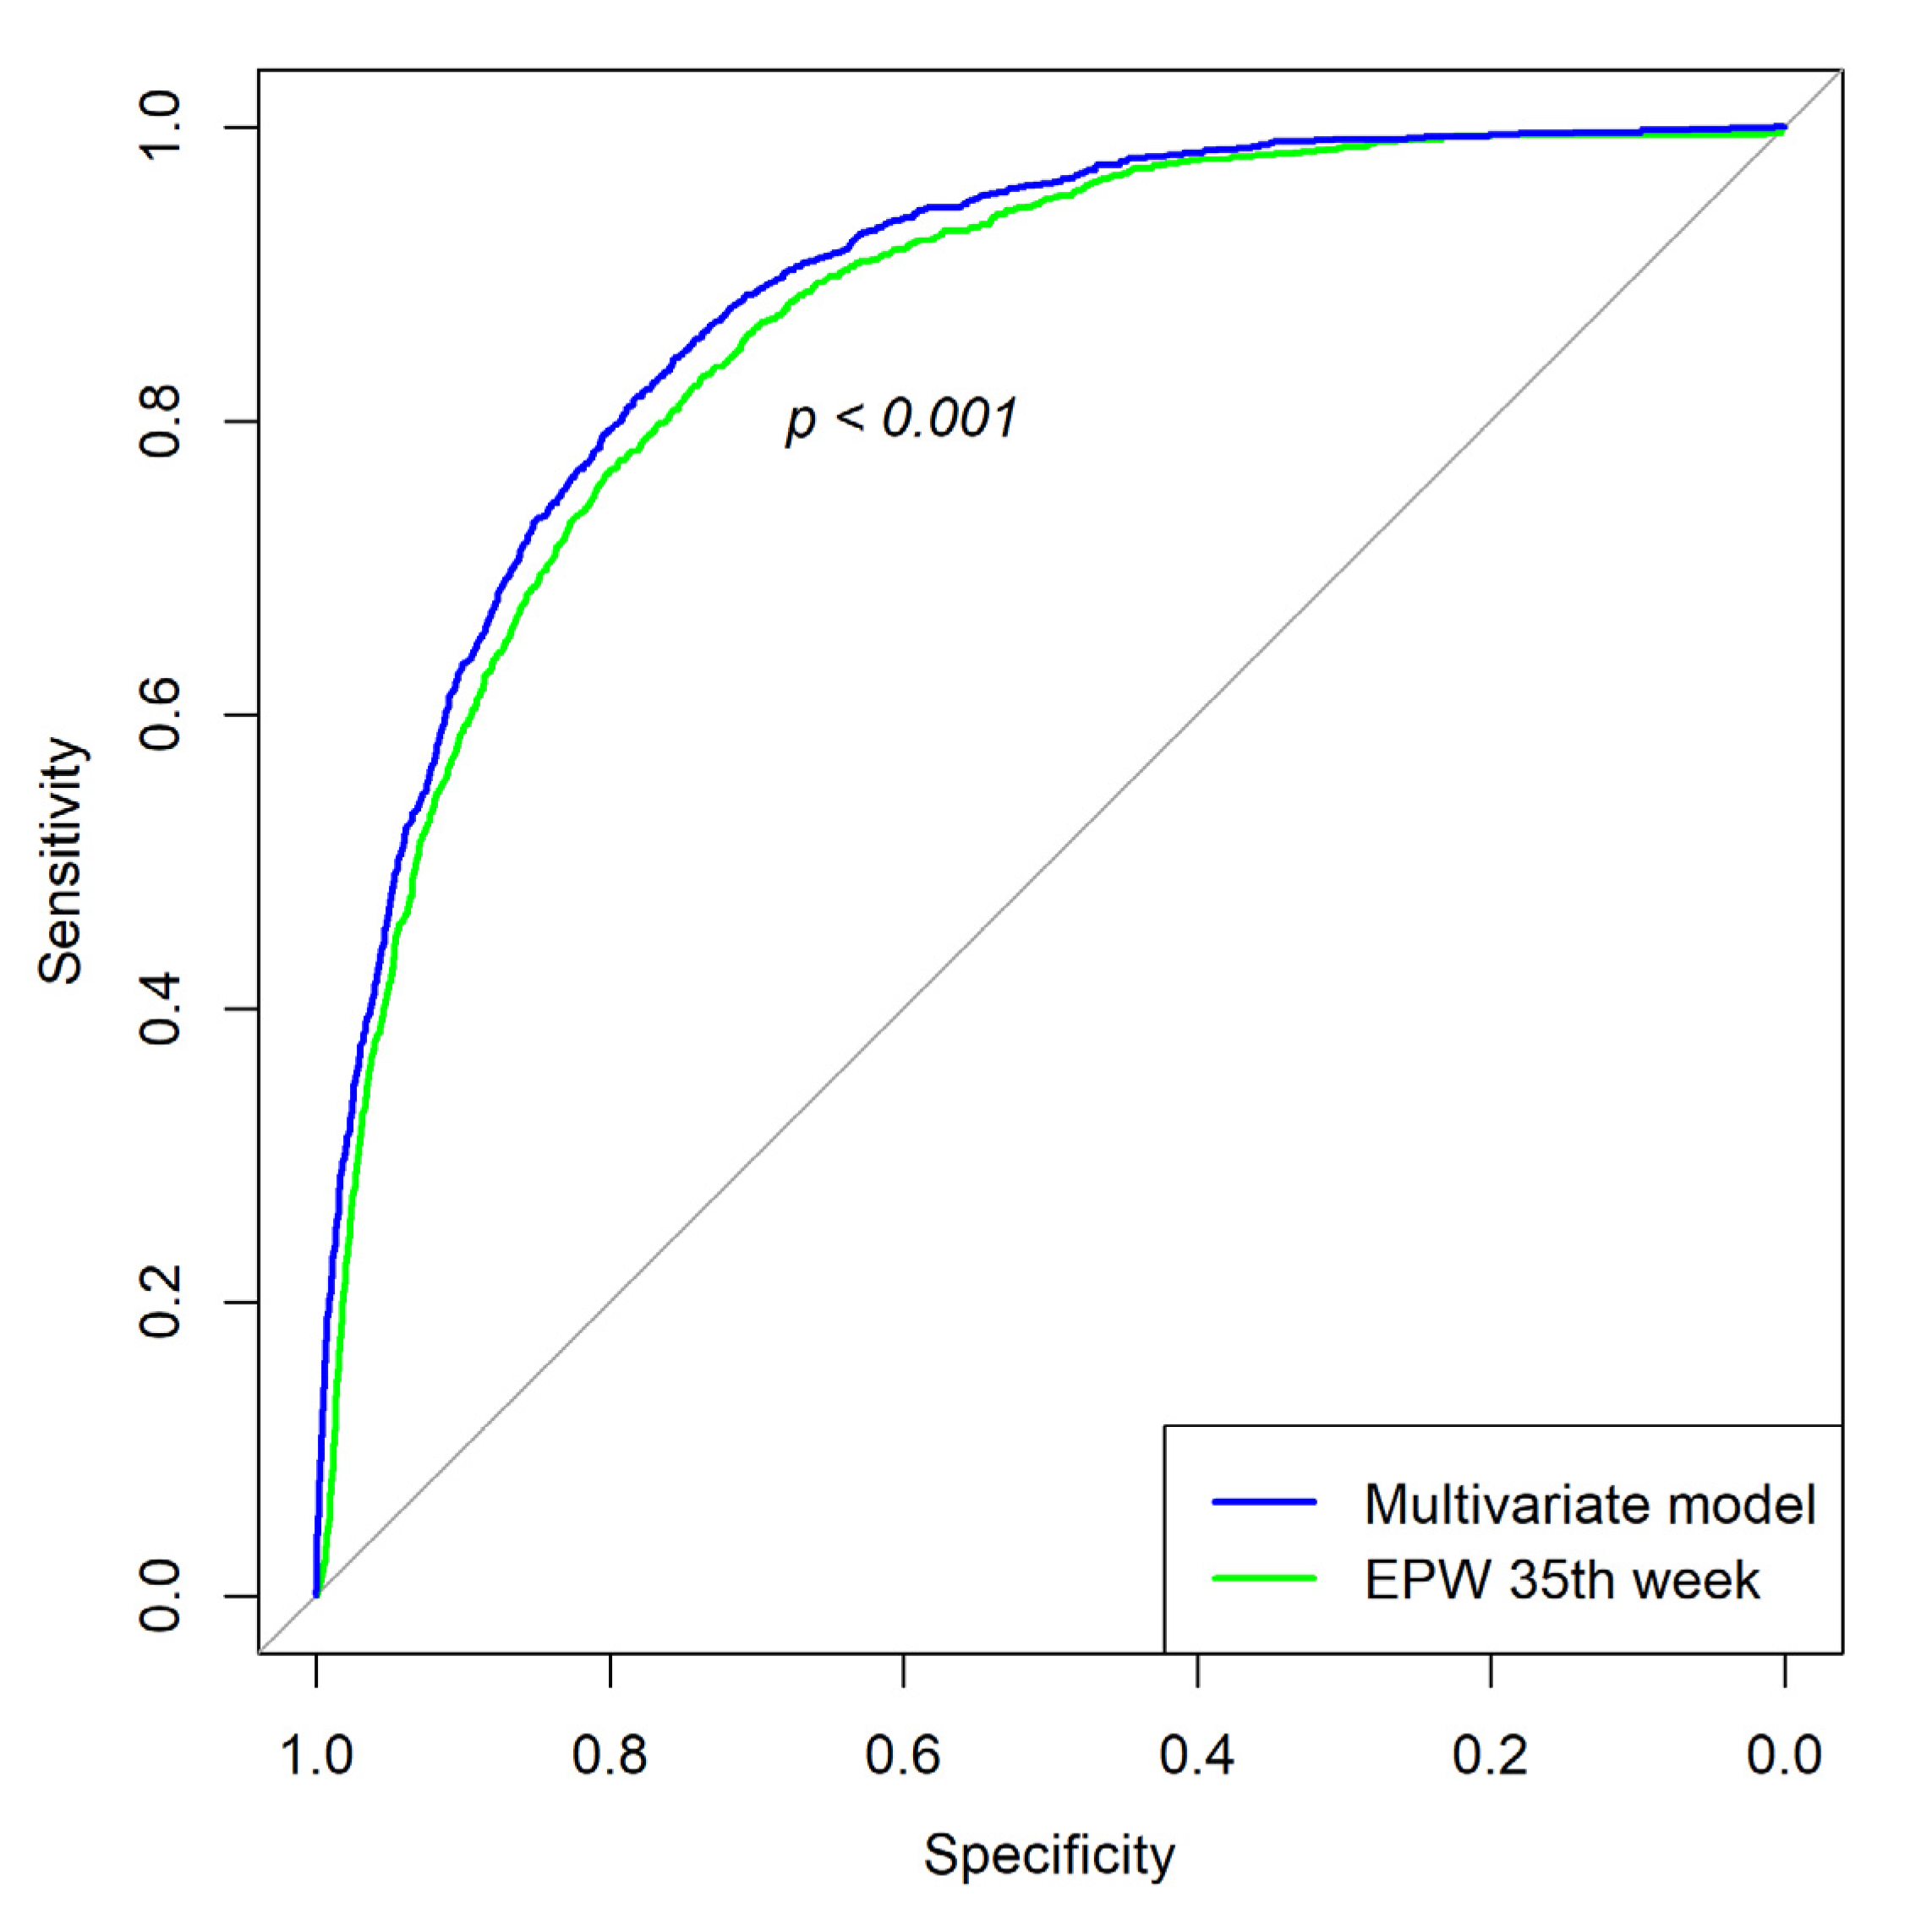
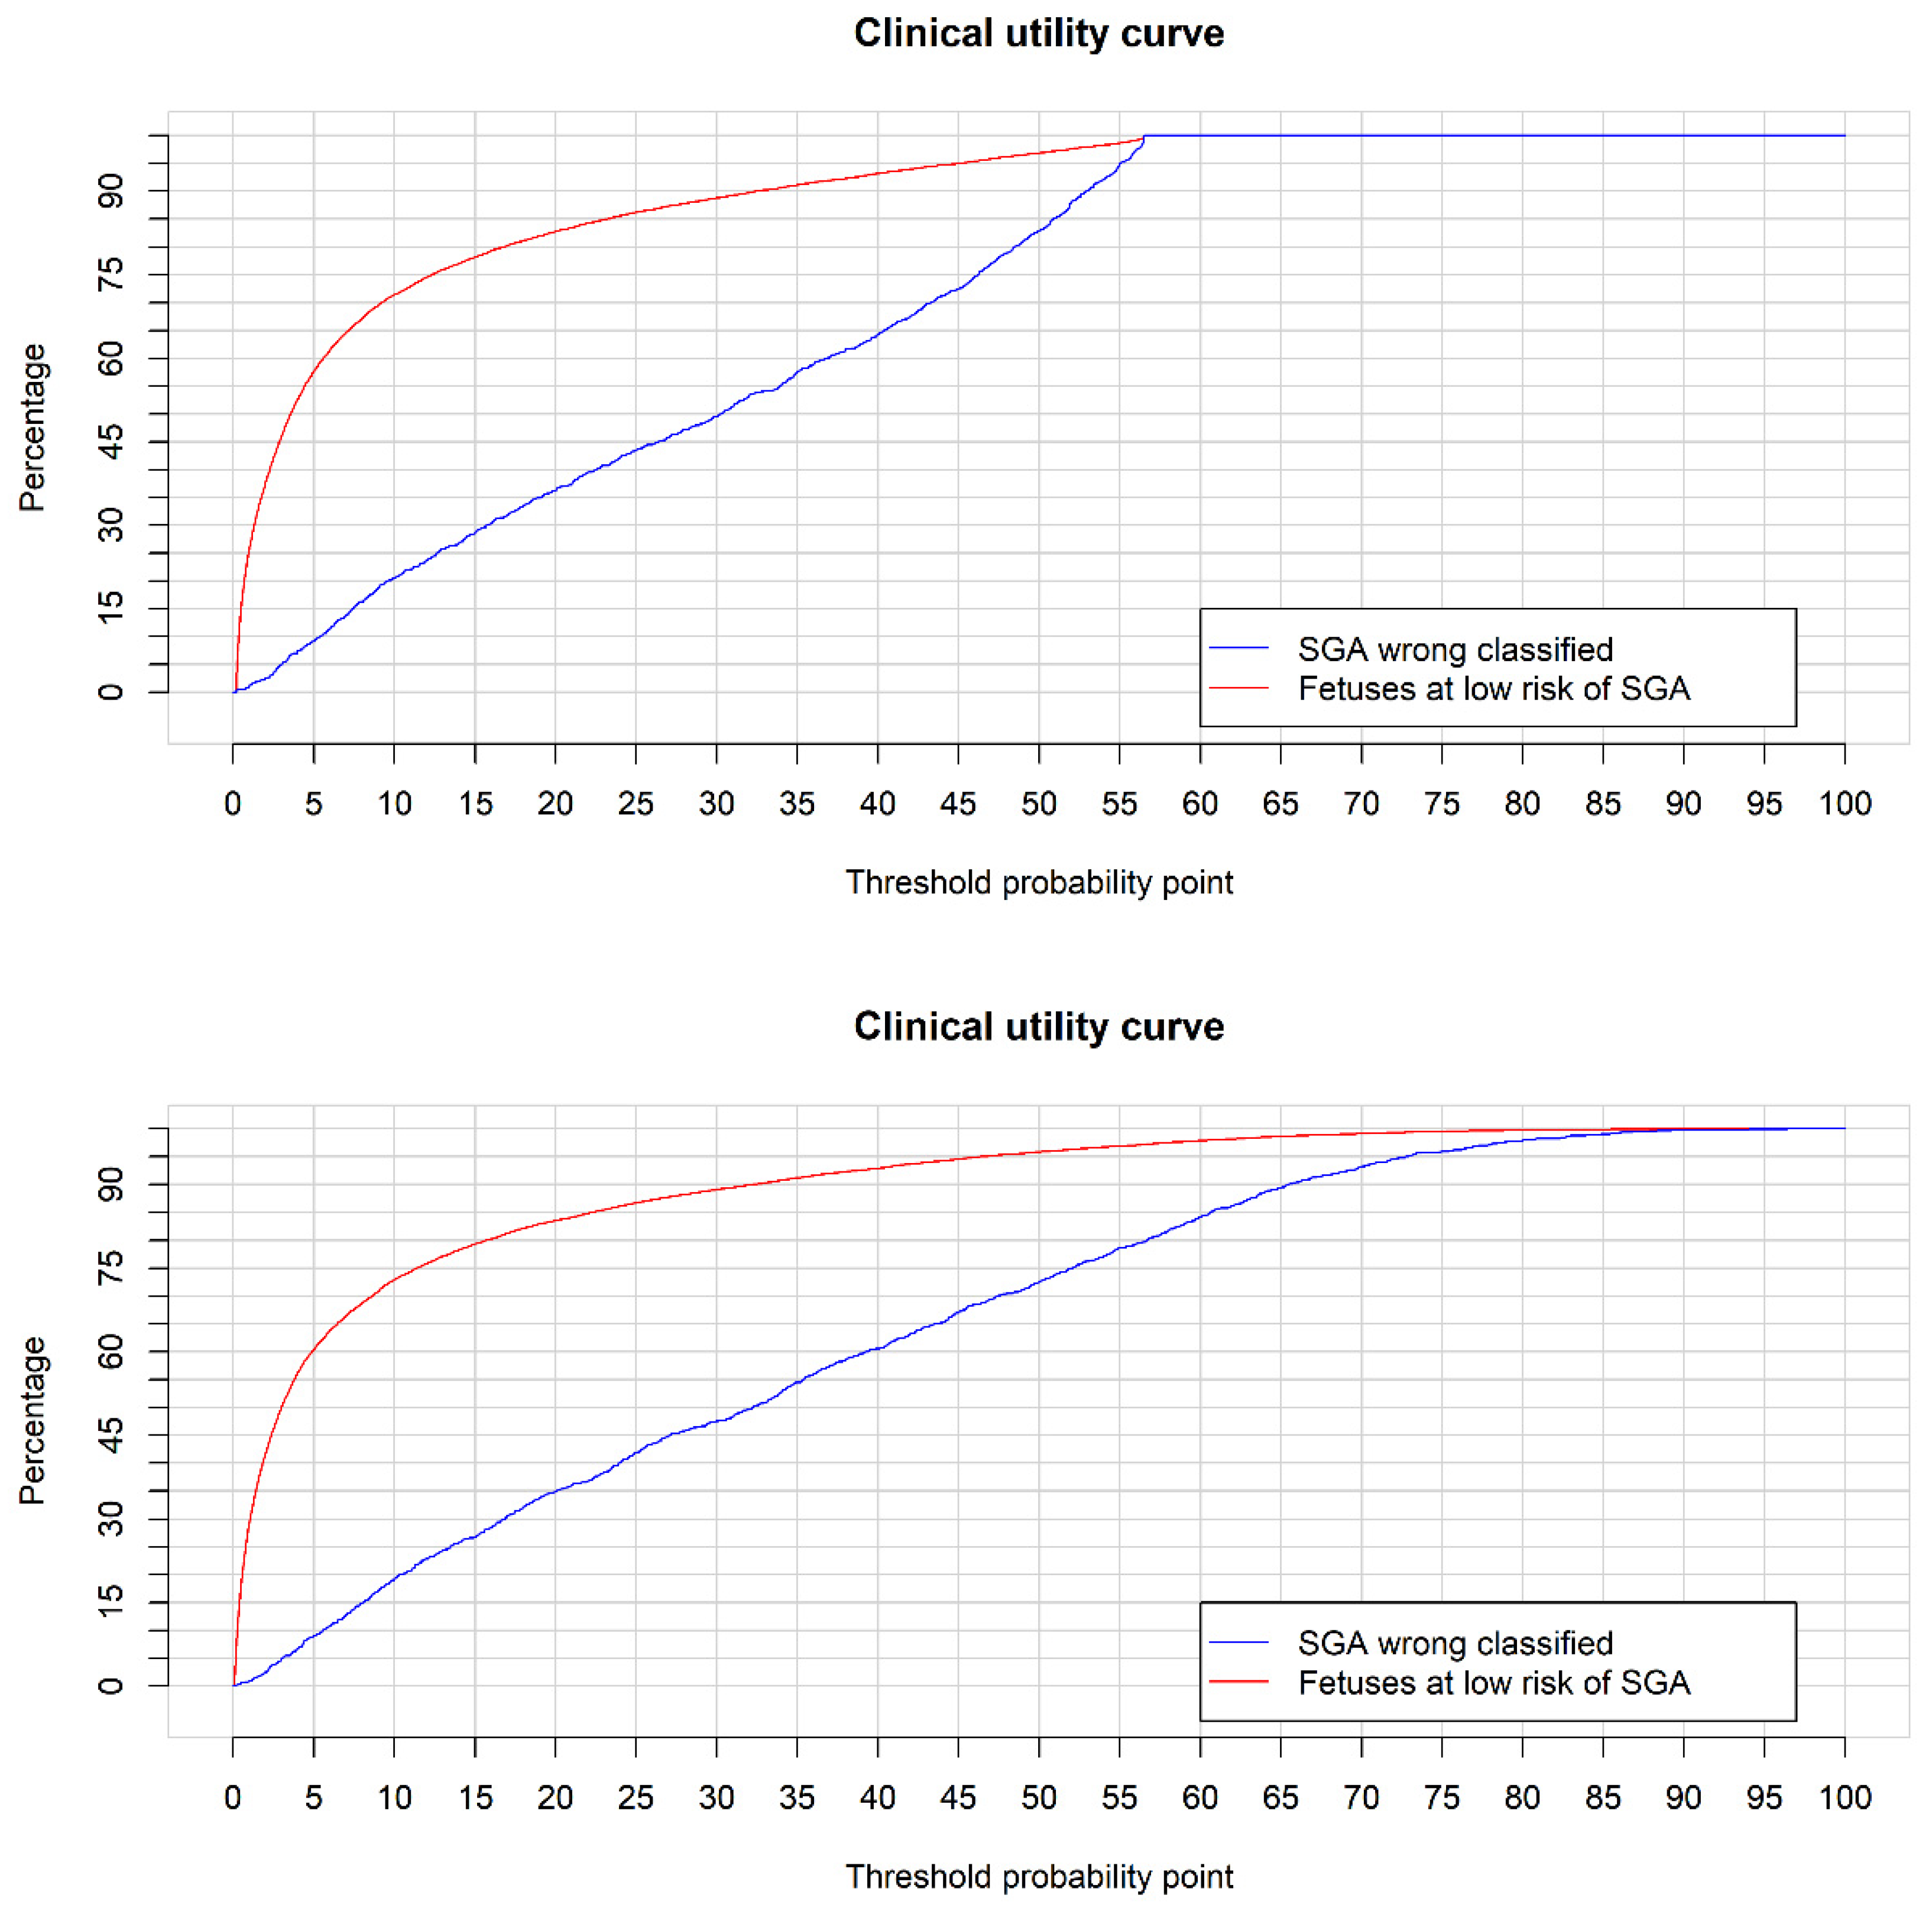
3.2. Small for Gestational Age Prediction

We explored EPW as a predictor of SGA using a logistic regression model, with EPW adjusted for restricted cubic splines with four knots. The AUC was 0.864 (0.854–0.873 95% C.I.), showing a good discriminative ability.
Moreover, we constructed a multivariate model by adding maternal–fetal characteristics and AC percentiles. Table 2 shows the hazard ratio, 95% CI, and p-values for significant variables.
The AUC for the multivariate model was 0.882 (0.873–0.891 95% C.I.), showing a statistically significant difference with the EPW at week 35 (p-value < 0.001), although the increase in AUC was modest. The ROC curves for both models are presented in Figure 2. Regarding the added predictive ability of the AC percentile, a multivariate model without this variable had an AUC value of 0.880, with no significant difference from the full model (p-value = 0.067). Table 3 shows the added predictive ability of each marker, measured by AUC, and discrimination rate for a 10% false-positive rate (FPR).
For the validation process of the EPW at the 35th week and multivariate model to predict SGA, the calibration was explored (Figure 3). Both models showed a good agreement between the predicted probability and actual occurrence, with an intercept of 0 and a slope of 1, corresponding to a perfect calibration.
Finally, we analyzed the clinical utility. Figure 4 shows the CUC for EPW at the 35th week (top panel), as well as for the multivariate model (bottom panel).
The better performance of a marker is reflected in a greater separation of the curves plotted in the CUC. Using the EPW at the 35th week, for a 6% cutoff point in a logistic regression model, 11.5% of SGA would be wrongly classified, with 61.5% of fetuses at low risk of being SGA. For the same cutoff point, in the multivariate model, 10.9% of SGA would be wrongly classified with 63.9% of fetuses at low risk of being SGA. A slightly better performance was, therefore, obtained with the multivariate model.

4. Discussion

Our findings show that a combined screening model, including EPW and AC percentile by ultrasound at the 35th week, maternal characteristics, and biochemical markers, had a better performance than EPW alone in predicting SGA. The combined model presented higher AUC than the model with only EPW. These differences were significant, but the increase was modest. The combined model, without AC percentile, did not show significant differences from the complete model. Moreover, with the combined screening model, 3% fewer fetuses required control for a high risk of SGA.
Our DR improved from 58.9% (threshold EPW 18.2%) using EPW, or from 52.3% with the AC percentile alone (threshold percentile AC 24.9%) to 63.5% using the predictive model, for a 10% FPR. However, this improvement is limited and comparable to the findings of other studies predicting neonates with a birth weight < 10th centile at, or after, term using combined models. These report DRs between 51% and 74%, at a 10% FPR [16,17,42,43], although the markers used in the predictive models are different. In addition, we used cut-off points higher than the 10th percentile, as a cut-off point of 10 was insufficient, in line with other publications [8,44].
The biochemical markers used in our study, β-hCG and PAPP-A, are routinely tested in the first trimester of pregnancy to screen for chromosomal disorders, and their correlations with chromosomal disorders are already known. Hence, PAPP-A is an independent factor influencing final birth weight, and the lower the PAPP-A, the higher the risk of a fetus developing SGA. However, their predictive powers are not sufficient for them to be used alone for SGA detection [27,28,29,30]. Moreover, a significant positive correlation has not been found between birth weight and free β-hCG levels [30]. These results are consistent with our findings of lower PAPP-A and β-hCG values in the group of SGA fetuses than in the group of non-SGA fetuses, both with significant differences.
With regards to combined SGA prediction models, a few studies have examined the performance of screening for SGA at 35–37 weeks’ gestation by combining EFW and different markers. One study of 5121 pregnancies reported that, in screening by maternal factors and EFW, the DR of SGA < 10th percentile delivering at >37 weeks was 66%, at a 10% screen-positive rate, and this did not improve with addition of the artery pulsatility index (UtA-PI) and mean arterial pressure [18]. Similarly, a study of 946 pregnancies reported that screening by EFW predicted 59% of SGA < 10th percentile, at a 10% screen- positive rate, and the performance was not improved, either by the addition of UtA-PI or the cerebroplacental ratio [45]. In yet another study of 3859 pregnancies, screened by maternal factors and EFW, the DR of SGA < 10th percentile delivering at >37 weeks was not improved by the addition of PlGF and sFLT [46].
On the other hand, Miranda et al. 2017 used a combined screening model, including a priori risk (maternal characteristics), third trimester (32 + 0 to 36 + 6) EPW, UtA-PI, PlGF, and estriol (with lipocalin-2 for SGA), and achieved a DR of 61% (AUC, 0.86 (95% confidence interval CI, 0.83–0.89)) for SGA cases and 77% (AUC, 0.92 (95% CI, 0.88–0.95)) for FGR. The combined model performed significantly better than using EPW alone (p < 0.001 and p = 0.002, respectively) [21]. Despite using different biomarkers and not adding Doppler ultrasound, our SGA DRs in the combined model were 63.5% (AUC 0.882 0.873–0.891 95% C.I.).
In their combined model, Souka et al. 2012 used AC, EFW, UA Doppler, smoking status, and first-trimester indices (free β-hCG and PAPP-A multiples of the median) and obtained an AUC = 0.88 for the prediction of SGA, a marginal improvement on EPW or AC alone, but without statistically significant differences [13]. The results of our work were very similar, without the use of AU Doppler, which is not routinely performed when the EFW is above the 10th percentile.
Ciobanu et al. reported a positive DR of 32% (95% CI, 30–36%) in the detection by maternal factors, 66% (95% CI, 63–69%) by maternal factors and EFW at 35–36 weeks of gestation, and 69% (95% CI, 66–72%) with the addition of biomarkers (UtA-PI, umbilical artery pulsatility index, middle cerebral artery pulsatility index, PlGF, and sFLT) [5]. In our cohort, these values were 26.3% (95% CI 23.9–28.8%) with maternal factors alone, 62.1% (95% CI 59.4–64.7%) with the addition of EPW, and 62.4% (95% CI 59.7–64.0%) with the complete combined model.
The strengths of our screening model are its simplicity and affordability, as it includes the standard tests used in screening for chromosomal abnormalities in the first trimester. It is based on variables easily obtained in the routine control of normal pregnancy, without requiring additional tests or parameters to elaborate the predictive model, such as Doppler studies or angiogenic biomarkers.
Several studies have shown that the performance of screening for SGA using a combined model of maternal characteristics and medical history (maternal factors), EFW, and biophysical and biochemical markers is acceptably high for a preterm birth, but disappointingly low for delivery at term [15,42]. Both in our study and in most of those cited here, the contribution of a model that combines maternal characteristics and medical history (maternal factors), EFW, and biophysical and biochemical markers increases the predictive capacity of SGA fetuses, but only to a small degree. However, other studies have shown this to be acceptably high for mothers who give birth prematurely [15,42].
We analyzed the clinical utility of EPW at the 35th week, as well as the predictive model using maternal–fetal characteristics, by means of the CUC. In this curve we showed the percentage of SGA incorrectly classified using a threshold point, as well as the fetuses at low risk of being SGA at birth. For the EPW at week 35, assuming a loss of 10% of fetuses that would be SGA at birth, 59% of fetuses can be considered as low risk. Alternatively, assuming a loss of 20% SGA cases, 71% of fetuses would be at low risk. Using the predictive model, assuming a loss in SGA cases of 10%, 62% would be considered as low risk; with a loss of 20%, a total of a 74% would be at low risk. From these findings, it can be deduced that, with the addition of maternal fetal characteristics, 3% fewer fetuses would require more controlled follow-up.
Detection of SGA at delivery by third-trimester ultrasound, either by EPW or CA, even with models combined with other maternal variables and first-trimester biochemical markers, is limited, and new tools are required to improve this.

5. Conclusions

Contingent screening models appear to be more sensitive than third-trimester ultrasound screening as the sole technique for predicting SGA at delivery. However, these improvements are modest (from 58.9% using EPW or 52.3% with AC percentile alone to 63.5% using the predictive model). AC at 35-week ultrasound does not appear to be superior to EPW or significantly improve on the full model.

Author Contributions

Conceptualization: P.D.-P., M.T.-D., R.S.-C. and L.M.E.; methodology: P.D.-P., M.T.-D., R.S.-C. and L.M.E.; software: L.M.E.; validation, P.D.-P., M.T.-D., R.S.-C. and L.M.E.; formal analysis, L.M.E. and P.D.-P.; investigation: P.D.-P.; resources: S.C.-M., G.S. and F.R.P.-L.; data curation, L.M.E. and F.R.P.-L.; writing—original draft preparation, P.D.-P. and M.T.-D.; writing—review and editing, P.D.-P., M.T.-D., R.S.-C. and L.M.E.; visualization, R.S.-C. and F.R.P.-L.; supervision: S.C.-M., G.S. and F.R.P.-L.; project administration: S.C.-M. and G.S.; funding acquisition: G.S. All authors have read and agreed to the published version of the manuscript.

Funding

This research was funded by Government of Aragon (Stochastic Models Research group, grant number E46_20R), and Ministerio de Ciencia e Innovación MCIN/AEI/10.13039/501100011033 (grant number PID2020-116873GB-I00).

Institutional Review Board Statement

The study was conducted in accordance with the guidelines of the Helsinki Declaration and approved by the Clinical Research Ethics Committee of Aragon (PI 18/333).

Informed Consent Statement

Patient consent was waived, as data were fully anonymized, due to the retrospective observational nature of the study.

Data Availability Statement

The data analyzed were retrieved from the Miguel Servet University Hospital database.

Acknowledgments

We gratefully thank all the staff of the Ultrasound and Prenatal Diagnosis Unit of the MSUH (Zaragoza, Spain) for their help in the acquisition and management of data.

Conflicts of Interest

The authors declare no conflict of interest. The funders had no role in the design of the study, in the collection, analyses, or interpretation of data, in the writing of the manuscript, or in the decision to publish the results.

References

  1. Figueras, F.; Gratacós, E. Update on the diagnosis and classification of fetal growth restriction and proposal of a stage-based management protocol. Fetal Diagn Ther. 2014, 36, 86–98. [Google Scholar] [CrossRef] [PubMed]
  2. McIntire, D.D.; Bloom, S.L.; Casey, B.M.; Leveno, K.J. Weight in relation to morbidity and mortality among newborn infants. Eng. J. Med. 1999, 340, 1234–1248. [Google Scholar] [CrossRef] [PubMed]
  3. Gardosi, J.; Madurasinghe, V.; Williams, M.; Malik, A.; Francis, A. Maternal and fetal risk factors for stillbirth: Population based study. BMJ 2013, 346, f108. [Google Scholar] [CrossRef] [PubMed] [Green Version]
  4. Malhotra, A.; Allison, B.J.; Castillo-Melendez, M.; Jenkin, G.; Polglase, G.R.; Miller, S.L. Neonatal morbidities of fetal growth restriction: Pathophysiology and impact. Front. Endocrinol. 2019, 10, 55. [Google Scholar] [CrossRef] [PubMed] [Green Version]
  5. Ciobanu, A.; Formuso, C.; Syngelaki, A.; Akolekar, R.; Nicolaides, K.H. Prediction of small-for-gestational-age neonates at 35–37 weeks’ gestation: Contribution of maternal factors and growth velocity between 20 and 36 weeks. Ultrasound Obstet. Gynecol. 2019, 53, 488–495. [Google Scholar] [CrossRef]
  6. Villar, J.; Ismail, L.C.; Victora, C.G.; Ohuma, E.O.; Bertino, E.; Altman, D.G.; Lambert, A.; Papageorghiou, A.T.; Carvalho, M.; Jaffer, Y.A.; et al. International standards for newborn weight, length, and head circumference by gestational age and sex: The Newborn Cross-Sectional Study of the INTERGROWTH-21st Project. Lancet 2014, 384, 857–868. [Google Scholar] [CrossRef]
  7. WHO Multicentre Growth Reference Study Group. WHO Child Growth Standards based on length/height, weight and age. Acta Paediatr. Suppl. 2006, 450, 76–85. [Google Scholar]
  8. McCowan, L.M.; Figueras, F.; Anderson, N.H. Evidence-based national guidelines for the management of suspected fetal growth restriction: Comparison, consensus, and controversy. Am. J. Obstet. Gynecol. 2018, 218, 855–868. [Google Scholar] [CrossRef] [Green Version]
  9. Figueras, F.; Eixarch, E.; Gratacós, E.; Gardosi, J. Predictiveness of antenatal umbilical artery Doppler for adverse pregnancy outcome in small-for-gestational-age babies according to customised birthweight centiles: Population-based study. BJOG Int. J. Obstet. Gynaecol. 2008, 115, 590–594. [Google Scholar] [CrossRef]
  10. Skovron, M.L.; Berkowitz, G.S.; Lapinski, R.H.; Kim, J.M.; Chitkara, U. Evaluation of early third-trimester ultrasound screening for intrauterine growth retardation. J. Ultrasound Obstet. Gynecol. Med. 1991, 10, 153–159. [Google Scholar] [CrossRef]
  11. Caradeux, J.; Martinez-Portilla, R.J.; Peguero, A.; Sotiriadis, A.; Figueras, F. Diagnostic performance of third-trimester ultrasound for the prediction of late-onset fetal growth restriction: A systematic review and meta-analysis. Am. J. Obstet. Gynecol. 2019, 220, 449–459. [Google Scholar] [CrossRef] [PubMed]
  12. Triunfo, S.; Crovetto, F.; Scazzocchio, E.; Parra-Saavedra, M.; Gratacós, E.; Figueras, F. Contingent versus routine third-trimester screening for late fetal growth restriction. Ultrasound Obstet. Gynecol. 2016, 47, 81–88. [Google Scholar] [CrossRef] [PubMed] [Green Version]
  13. Souka, A.P.; Papastefanou, I.; Pilalis, A.; Michalitsi, V.; Kassanos, D. Performance of third-trimester ultrasound for prediction of small-for-gestational-age neonates and evaluation of contingency screening policies. Ultrasound Obstet. Gynecol. 2012, 39, 535–542. [Google Scholar] [CrossRef] [PubMed]
  14. Souka, A.P.; Papastefanou, I.; Pilalis, A.; Michalitsi, V.; Panagopoulos, P.; Kassanos, D. Performance of the ultrasound examination in the early and late third trimester for the prediction of birth weight deviations. Prenat Diagn. 2013, 33, 915–920. [Google Scholar] [CrossRef] [PubMed]
  15. Di Lorenzo, G.; Monasta, L.; Ceccarello, M.; Cecotti, V.; D’Ottavio, G. Third trimester abdominal circumference, estimated fetal weight and uterine artery doppler for the identification of newborns small and large for gestational age. Eur. J. Obstet. Gynecol. Reprod. Biol. 2013, 166, 133–138. [Google Scholar] [CrossRef]
  16. Valiño, N.; Giunta, G.; Gallo, D.M.; Akolekar, R.; Nicolaides, K.H.; Akolekar, D.R. Biophysical and biochemical markers at 30–34 weeks’ gestation in the prediction of adverse perinatal outcome. Ultrasound Obstet. Gynecol. 2016, 47, 194–202. [Google Scholar] [CrossRef] [Green Version]
  17. Valiño, N.; Giunta, G.; Gallo, D.M.; Akolekar, R.; Nicolaides, K.H.; Akolekar, D.R. Biophysical and biochemical markers at 35–37 weeks’ gestation in the prediction of adverse perinatal outcome. Ultrasound Obstet. Gynecol. 2016, 47, 203–209. [Google Scholar] [CrossRef] [Green Version]
  18. Fadigas, C.; Saiid, Y.; Gonzalez, R.; Poon, L.C.; Nicolaides, K.H. Prediction of small-for-gestational-age neonates: Screening by fetal biometry at 35-37 weeks. Ultrasound Obstet. Gynecol. 2015, 45, 559–565. [Google Scholar] [CrossRef]
  19. Bakalis, S.; Silva, M.; Akolekar, R.; Poon, L.C.; Nicolaides, K.H. Prediction of small-for-gestational-age neonates: Screening by fetal biometry at 30–34 weeks. Ultrasound Obstet. Gynecol. 2015, 45, 551–558. [Google Scholar] [CrossRef]
  20. Bligh, L.N.; Flatley, C.J.; Kumar, S. Reduced growth velocity at term is associated with adverse neonatal outcomes in non-small for gestational age infants. Eur. J. Obstet. Gynecol. Reprod. Biol. 2019, 240, 125–129. [Google Scholar] [CrossRef]
  21. Miranda, J.; Triunfo, S.; Rodriguez-Lopez, M.; Sairanen, M.; Kouru, H.; Parra-Saavedra, M.; Crovetto, F.; Figureas, F.; Crispi, F.; Gratacós, E. Performance of third-trimester combined screening model for prediction of adverse perinatal outcome. Ultrasound Obstet. Gynecol. 2017, 50, 353–360. [Google Scholar] [CrossRef]
  22. McKenna, D.; Tharmaratnam, S.; Mahsud, S.; Bailie, C.; Harper, A.; Dornan, J. A randomized trial using ultrasound to identify the high-risk fetus in a low-risk population. Obstet. Gynecol. 2003, 101, 626–632. [Google Scholar] [PubMed]
  23. Erkamp, J.S.; Voerman, E.; Steegers, E.A.P.; Mulders, A.G.M.G.J.; Reiss, I.K.M.; Duijts, L.; Jaddoe, V.W.V.; Gaillard, R. Second and third trimester fetal ultrasound population screening for risks of preterm birth and small-size and large-size for gestational age at birth: A population-based prospective cohort study. BMC Med. 2020, 18, 63. [Google Scholar] [CrossRef] [PubMed]
  24. Litwińska, E.; Litwińska, M.; Oszukowski, P.; Szaflik, K.; Kaczmarek, P. Combined screening for early and late pre-eclampsia and intrauterine growth restriction by maternal history, uterine artery Doppler, mean arterial pressure and biochemical markers. Adv. Clin. Exp. Med. 2017, 26, 439–448. [Google Scholar] [CrossRef] [PubMed] [Green Version]
  25. Zhong, Y.; Zhu, F.; Ding, Y. Serum screening in first trimester to predict pre-eclampsia, small for gestational age and preterm delivery: Systematic review and meta-analysis. BMC Pregnancy Childbirth. 2015, 15, 191. [Google Scholar] [CrossRef] [PubMed] [Green Version]
  26. Pihl, K.; Larsen, T.; Krebs, L.; Christiansen, M. First trimester maternal serum PAPP-A, β-hCG and ADAM12 in prediction of small-for-gestational-age fetuses. Prenat Diagn. 2008, 28, 1131–1135. [Google Scholar] [CrossRef] [PubMed]
  27. Leung, T.Y.; Sahota, D.S.; Chan, L.W.; Law, L.W.; Fung, T.Y.; Leung, T.N.; Lau, T.K. Prediction of birth weight by fetal crown-rump length and maternal serum levels of pregnancy-associated plasma protein-A in the first trimester. Ultrasound Obstet. Gynecol. 2008, 31, 10–14. [Google Scholar] [CrossRef]
  28. Dukhovny, S.; Zera, C.; Little, S.E.; McElrath, T.; Wilkins-Haug, L. Eliminating first trimester markers: Will replacing PAPP-A and βhCG miss women at risk for small for gestational age? J. Matern. Neonatal. Med. 2014, 27, 1761–1764. [Google Scholar] [CrossRef]
  29. Yaron, Y.; Heifetz, S.; Ochshorn, Y.; Lehavi, O.; Orr-Urtreger, A. Decreased first trimester PAPP-A is a predictor of adverse pregnancy outcome. Prenat Diagn. 2002, 22, 778–782. [Google Scholar] [CrossRef]
  30. Canini, S.; Prefumo, F.; Pastorino, D.; Crocetti, L.; Afflitto, C.G.; Venturini, P.L.; De Biasio, P. Association between birth weight and first-trimester free β-human chorionic gonadotropin and pregnancy-associated plasma protein A. Fertil Steril. 2008, 89, 174–178. [Google Scholar] [CrossRef]
  31. Pettker, C.M.; Goldberg, J.D.; El-Sayed, Y.Y.; Copel, J.A. Committee opinion No 700: Methods for estimating the due date. Obstet. Gynecol. 2017, 129, 150–154. [Google Scholar]
  32. Hadlock, F.P.; Harrist, R.B.; Sharman, R.S.; Deter, R.L.; Park, S.K. Estimation of fetal weight with the use of head, body, and femur measurements--a prospective study. Am. J. Obstet. Gynecol. 1985, 151, 333–337. [Google Scholar] [CrossRef]
  33. Hadlock, F.P.; Harrist, R.B.; Martinez-Poyer, J. In utero analysis of fetal growth: A sonographic weight standard. Radiology 1991, 181, 129–133. [Google Scholar] [CrossRef] [PubMed]
  34. Savirón-Cornudella, R.; Esteban, L.M.; Lerma, D.; Cotaina, L.; Borque, Á.; Sanz, G.; Castan, S. Comparison of fetal weight distribution improved by paternal height by Spanish standard versus Intergrowth 21 st standard. J. Perinat. Med. 2018, 46, 750–759. [Google Scholar] [CrossRef] [Green Version]
  35. Carrascosa, A.; Fernández, J.M.; Ferrández, Á.; López-Siguero, J.P.; López, D.; Sánchez, E.; Colaborador, G. Estudios Españoles de crecimiento 2010. Rev Esp Endocrinol Pediatr. 2011, 259–262. [Google Scholar]
  36. Smulian, J.C.; Ananth, C.V.; Vintzileos, A.M.; Guzman, E.R. Revisiting sonographic abdominal circumference measurements: A comparison of outer centiles with established nomograms. Ultrasound Obstet. Gynecol. 2001, 18, 237–243. [Google Scholar] [CrossRef]
  37. Hanley, J.A.; McNeil, B.J. The meaning and use of the area under a receiver operating characteristic (ROC) curve. Radiology 1982, 143, 29–36. [Google Scholar] [CrossRef] [Green Version]
  38. Gu, W.; Pepe, M.S. Estimating the capacity for improvement in risk prediction with a marker. Biostatistics 2009, 10, 172–186. [Google Scholar] [CrossRef] [Green Version]
  39. Hosmer, D.W.; Lemeshow, S.; Sturdivant, R.X. Applied Logistic Regression, 3rd ed.; John Wiley & Sons: Hoboken, NJ, USA, 2013; pp. 1–510. [Google Scholar]
  40. Borque-Fernando, A.; Esteban-Escaño, L.M.; Rubio-Briones, J.; Lou-Mercadé, A.C.; García-Ruiz, R.; Tejero-Sánchez, A.; Muñoz-Rivero, M.V.; Cabañuz-Plo, T.; Alfaro-Torres, J.; Marquina-Ibáñez, I.M.; et al. A preliminary study of the ability of the 4kscore test, the prostate cancer prevention trial-risk calculator and the european research screening prostate-risk calculator for predicting high-grade prostate cancer. Actas Urol Esp. 2016, 40, 155–163. [Google Scholar] [CrossRef] [Green Version]
  41. R Core Team. R: A Language and Environment for Statistical Computing; R Foundation for Statistical Computing: Vienna, Austria, 2008; Available online: https://www.R-project.org/ (accessed on 8 February 2008).
  42. Bakalis, S.; Peeva, G.; Gonzalez, R.; Poon, L.C.; Nicolaides, K.H. Prediction of small-for-gestational-age neonates: Screening by biophysical and biochemical markers at 30–34 weeks. Ultrasound Obstet. Gynecol. 2015, 46, 446–451. [Google Scholar] [CrossRef] [Green Version]
  43. Miranda, J.; Rodriguez-Lopez, M.; Triunfo, S.; Sairanen, M.; Kouru, H.; Parra-Saavedra, M.; Crovetto, F.; Figueras, F.; Crispi, F.; Gratacós, E. Prediction of fetal growth restriction using estimated fetal weight vs a combined screening model in the third trimester. Ultrasound Obstet. Gynecol. 2017, 50, 603–611. [Google Scholar] [CrossRef] [PubMed] [Green Version]
  44. Savirón-Cornudella, R.; Esteban, L.M.; Aznar-Gimeno, R.; Dieste-Pérez, P.; Pérez-López, F.R.; Campillos, J.M.; Castán-Larraz, B.; Sanz, G.; Tajada-Duaso, M. Clinical medicine prediction of late-onset small for gestational age and fetal growth restriction by fetal biometry at 35 weeks and impact of ultrasound-delivery interval: Comparison of six fetal growth standards. J. Clin. Med. 2021, 10, 2984. [Google Scholar] [CrossRef] [PubMed]
  45. Triunfo, S.; Crispi, F.; Gratacós, E.; Figueras, F. Prediction of delivery of small-for-gestational-age neonates and adverse perinatal outcome by fetoplacental Doppler at 37 weeks’ gestation. Ultrasound Obstet. Gynecol. 2017, 49, 364–371. [Google Scholar] [CrossRef] [Green Version]
  46. Fadigas, C.; Peeva, G.; Mendez, O.; Poon, L.C.; Nicolaides, K.H. Prediction of small-for-gestational-age neonates: Screening by placental growth factor and soluble fms-like tyrosine kinase-1 at 35–37 weeks. Ultrasound Obstet. Gynecol. 2015, 46, 191–197. [Google Scholar] [CrossRef] [PubMed]
Figure 1. Study participants selection sample.
Jpm 12 00762 g001
Figure 2. ROC curve for the EPW at 35th week and multivariate model.
Jpm 12 00762 g002
Figure 3. Calibration curve for the EPW at 35th week (left panel) and multivariate model (right panel).
Jpm 12 00762 g003
Figure 4. The CUC for EPW at 35th week (top panel) and multivariate model (bottom panel).
Jpm 12 00762 g004
Table 1. Maternal baseline characteristics (top), pregnancy (middle), and perinatal characteristics (bottom) of pregnancies. Data are reported as n (%) or medians (interquartile range). MSUH, Miguel Servet University Hospital.
Clinical CharacteristicsPregnancies SGA (n = 1281)Pregnancies Non-SGA (n = 11,631)p-Value
Maternal characteristics
Maternal age (years)33.4 (29.9–36.4)33.2 (30.0–36.1)0.299
Maternal body mass index (kg/m2)22.5 (20.7–25.4)23.4 (21.2–26.4)<0.001
Maternal height (cm)161 (157–165)163 (160–168)<0.001
Parity
0872 (68.1%)6151 (52.9%)<0.001
1339 (26.5%)4411 (37.9%)
≥270 (5.4%)1069 (9.2%)
Previous cesarean
01211 (94.5%)10,739 (92.3%)0.004
169 (5.4%)826 (7.1%)
≥21 (0.1%)66 (0.6%)
In vitro fertilization
No1217 (95.0)11,121 (95.6%)0.394
Yes64 (5.0%)510 (4.4%)
Maternal smoking habits
Yes352 (27.5%)1676 (14.4%)<0.001
No929 (72.5%)9955 (85.6%)
Hypertension
No1235 (96.4%)11,485 (98.7%)<0.001
Chronic5 (0.4%)25 (0.2%)
Preeclampsia18 (1.4%)47 (0.4%)
Gestational23 (1.8%)74 (0.6%)
Diabetes
No1126 (87.9%)10,356 (89.0%)0.343
Pregestational6 (0.5%)81 (0.7%)
Gestational132 (10.3%)1043 (9.0%)
Carbohydrate intolerance17 (1.3%)151 (1.3%)
Ultrasound parameters at 35 (34–36) weeks
Gestational age (weeks) at ultrasound 35.1 (35.0–35.3)35.1 (35.0–35.3)0.345
Estimated fetal weight (grams) by Hadlock2186 (2042–2349)2532 (2362–2715)<0.001
Abdominal fetal circumference (cm)293 (284–301)311 (302–321)<0.001
Percentile weight by MSUH standard
<10513 (42.1%)542 (4.7%)<0.001
≥10768 (57.9%)11,089 (95.3%)
Percentile AC by Smulian standard
<10237 (18.5%)200 (17.6%)<0.001
≥101044 (81.5%)11,431 (82.4%)
Pregnancy and perinatal outcomes
PAPP-A0.84 (0.57–1.25)0.99 (0.68–1.42)<0.001
β-HCG0.91 (0.61–1.42)1.00 (0.67–1.51)<0.001
Gestational age at delivery39.6 (38.7–40.4)40.7 (40.0–41.3)<0.001
Newborn gender
Female663 (51.8%)5617 (48.3%)0.020
Male618 (48.2%)6014 (51.7%)
Birth weight2650 (2480–2760)3350 (3100–3610)<0.001
Table 2. Multivariate logistic regression model.
VariableOdds Ratio (95% C.I.)p-Value
rcs (EPW)0.937 (0.928–0.947)<0.001
rcs (EPW)’1.067 (1.030–1.106)<0.001
rcs (EPW)’’0.813 (0.700–0.942)0.006
Maternal age1.050 (1.035–1.065)<0.001
Maternal height0.948 (0.937–0.959)<0.001
Parity0.639 (0.572–0.711)<0.001
rcs (PAPP-A) 0.439 (0.031–0.591)<0.001
rcs (PAPP-A)’2.211 (1.490–3.066)<0.001
β-HCG0.880 (0.806–0.956)0.004
Hypertension
Chronic: no2.887 (0.807–8.665)0.075
Preeclampsia: no4.885 (2.443–9.476)<0.001
Gestational: no3.854 (2.066–7.009)<0.001
Smoking habits: no0.479 (0.408–0.563)<0.001
Abdominal circumference percentile0.120 (0.066–0.217)<0.001
Table 3. Screening performance for detection of small for gestational age (SGA) at birth.
VariableAUC (95% C.I.)Discrimination Rate (%) at 10% FPR
Abdominal circumference percentile0.840 (0.829–0.850)52.3
EPW0.864 (0.854–0.873)58.9
+Maternal age0.865 (0.855–0.874)59.4
+Maternal height0.867 (0.859–0.878)60.1
+Parity0.873 (0.863–0.882)60.7
+PAPP-A 0.874 (0.865–0.884)61.5
+β-HCG0.875 (0.865–0.884)61.0
+Hypertension0.877 (0.868–0.886)61.8
+Smoking habit0.880 (0.871–0.889)61.8
+Abdominal circumference percentile0.882 (0.873–0.891)63.5
Publisher’s Note: MDPI stays neutral with regard to jurisdictional claims in published maps and institutional affiliations.

