
Whole-Tumor ADC Texture Analysis Is Able to Predict Breast Cancer Receptor Status
 , , , ,
  ,
,
Abstract
:Abstract
1. Introduction
2. Materials and Methods
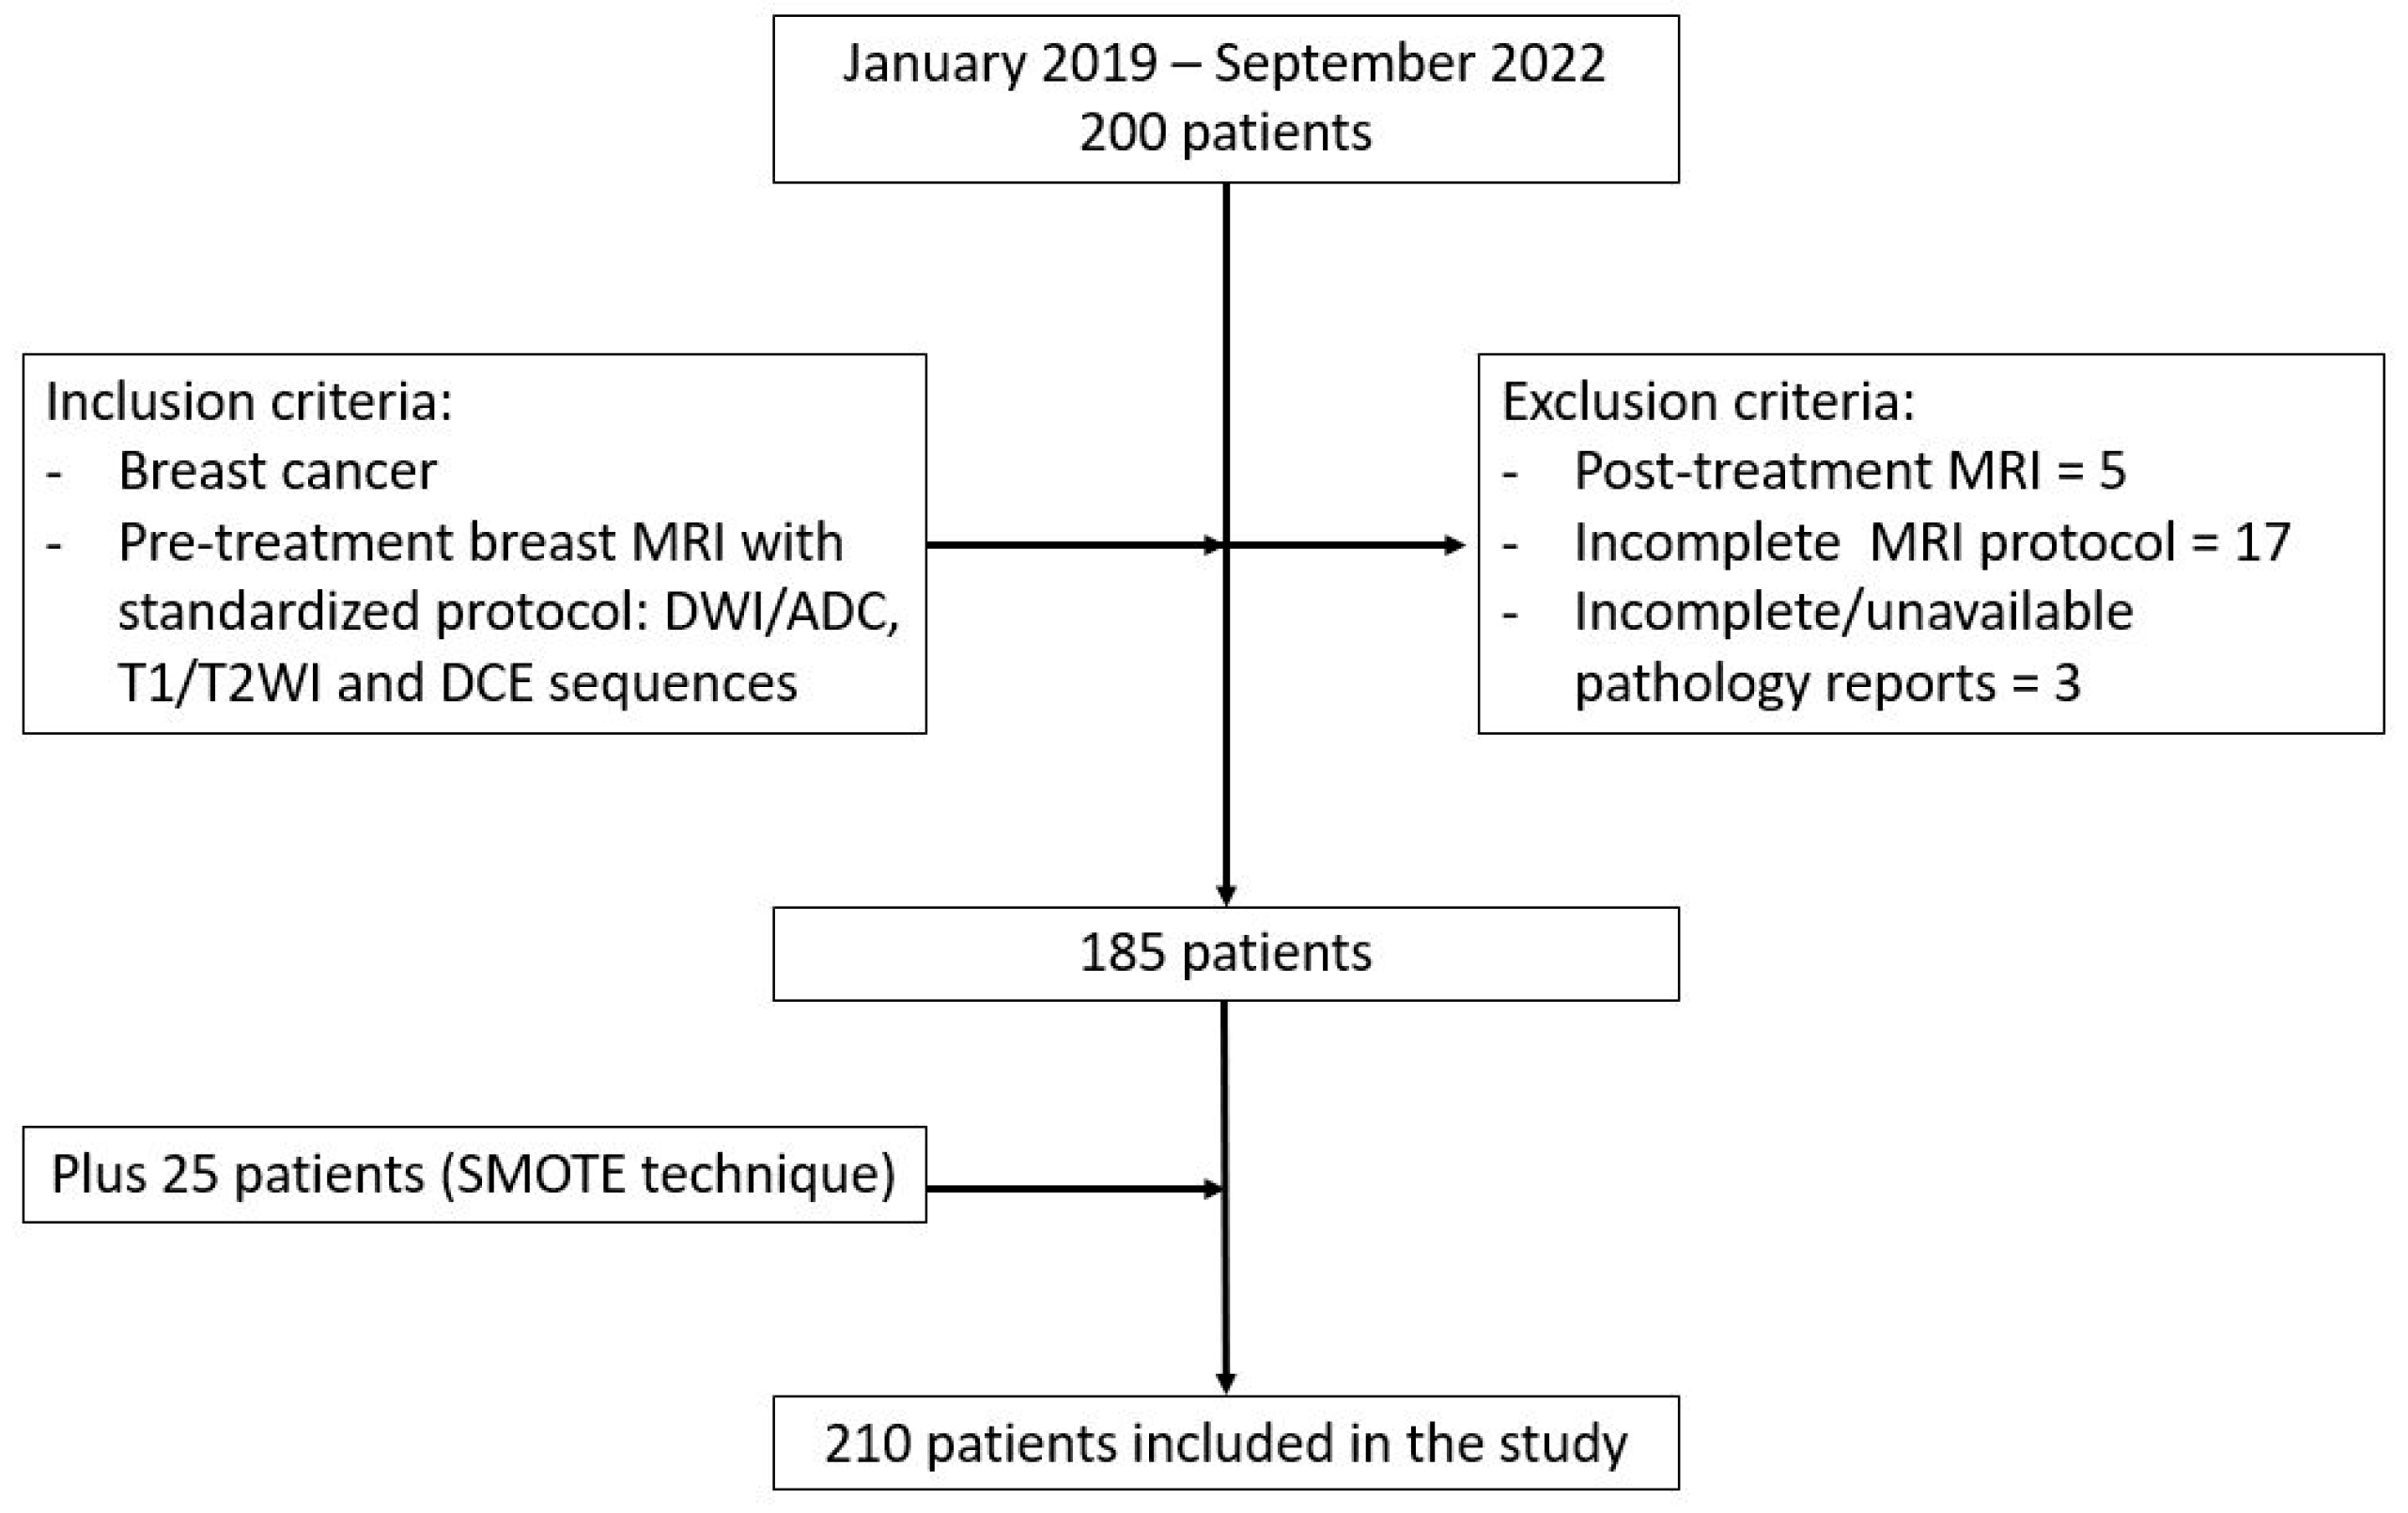
2.1. Patients
2.2. Pathology and Immunohistochemistry Reports
2.3. MR Acquisition
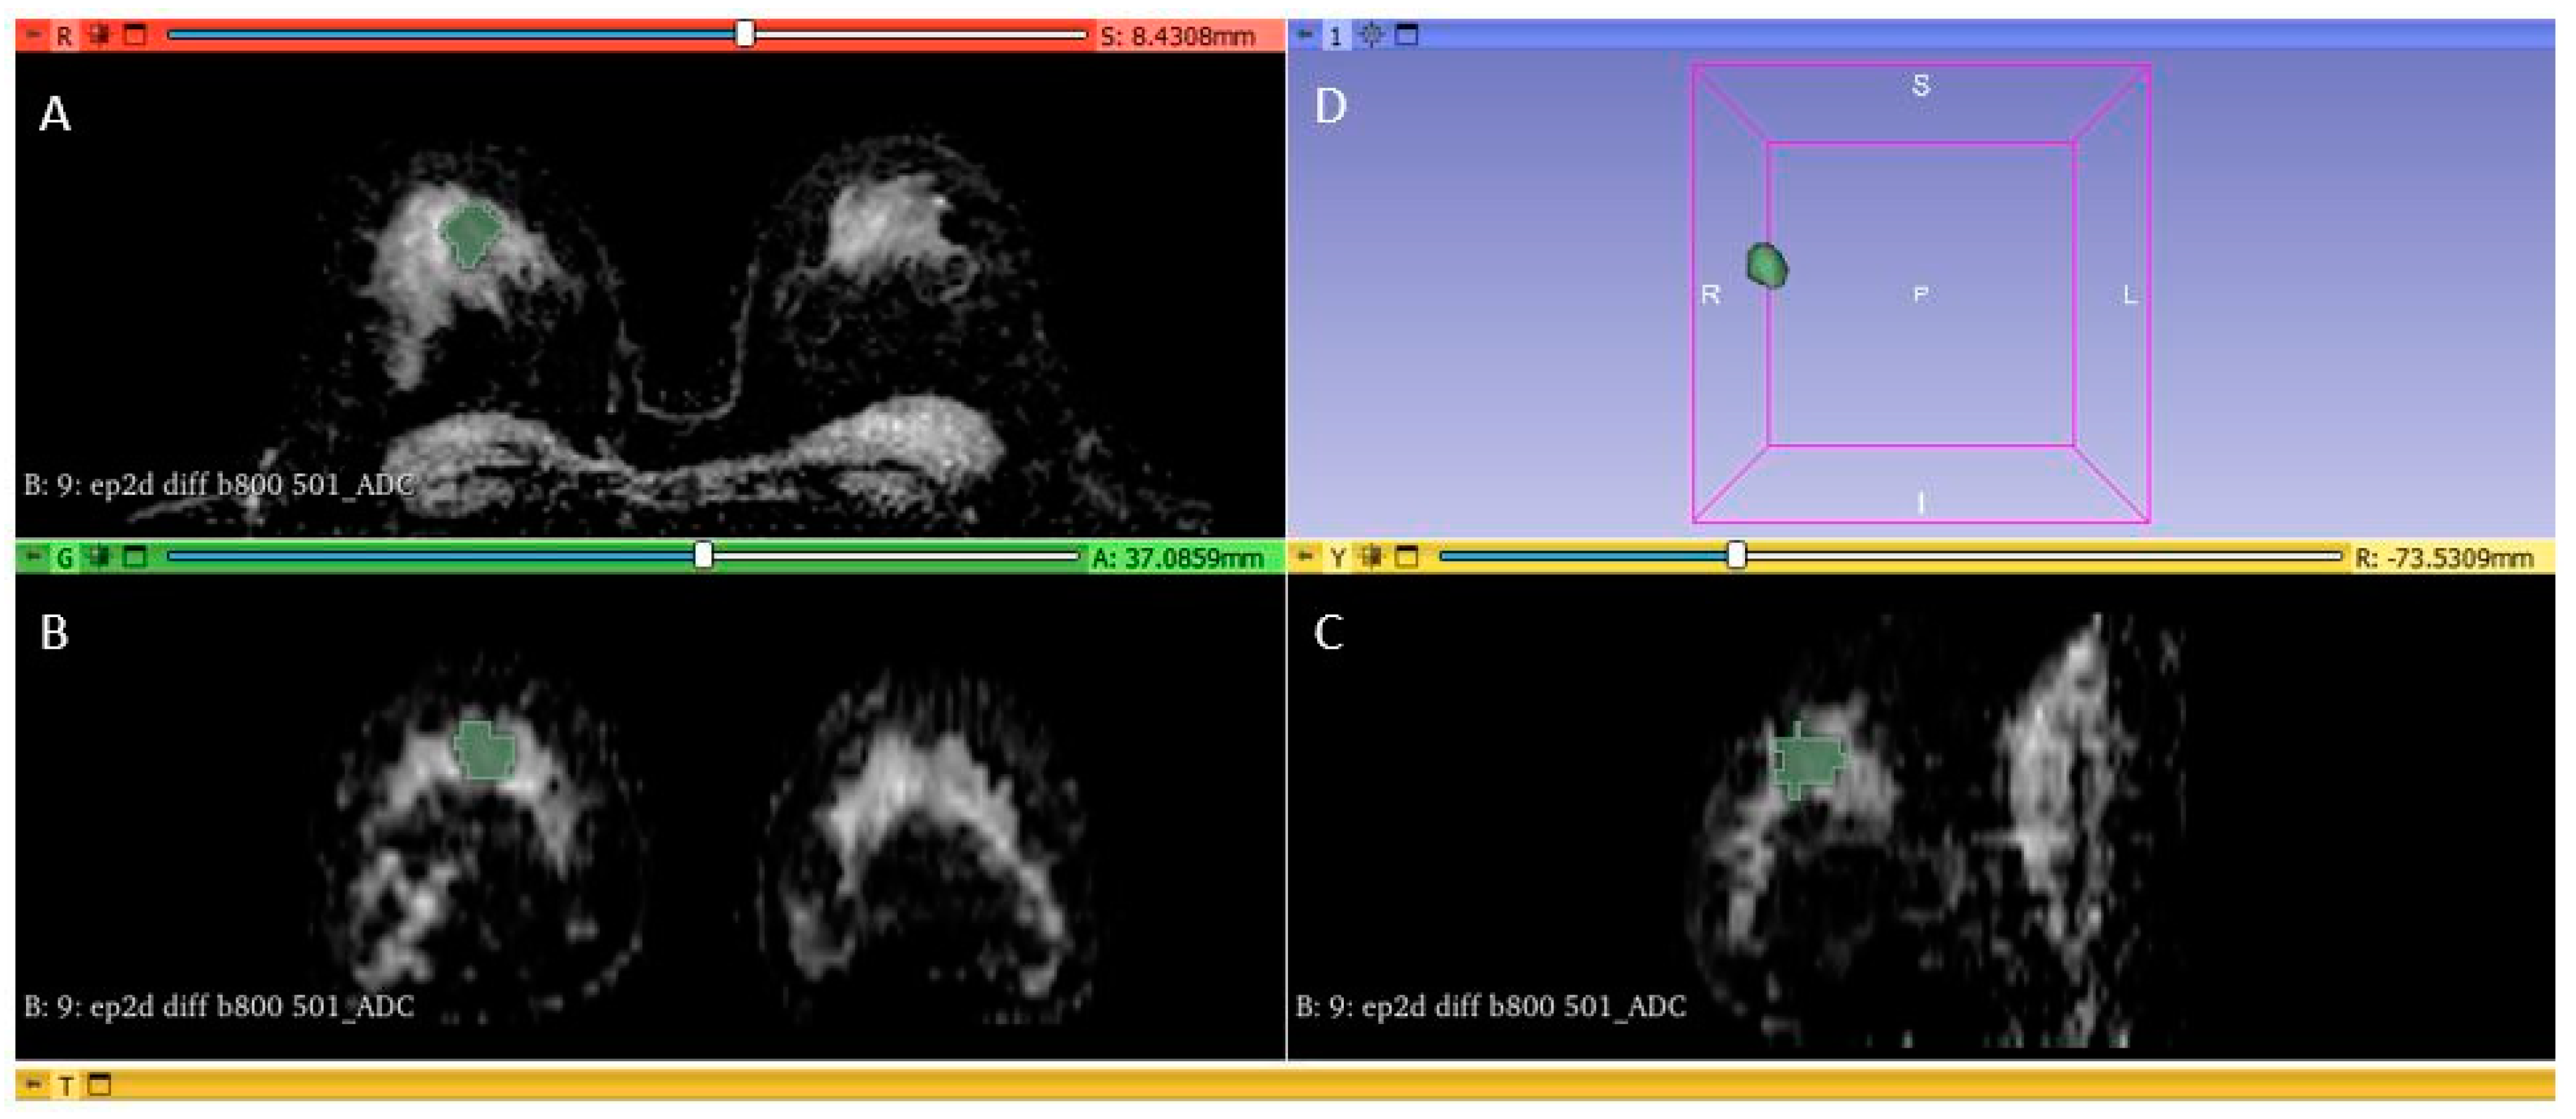
2.4. Tumor Segmentation and Radiomic Feature Extraction
2.5. Statistical Analysis
3. Results
3.1. Patient Characteristics
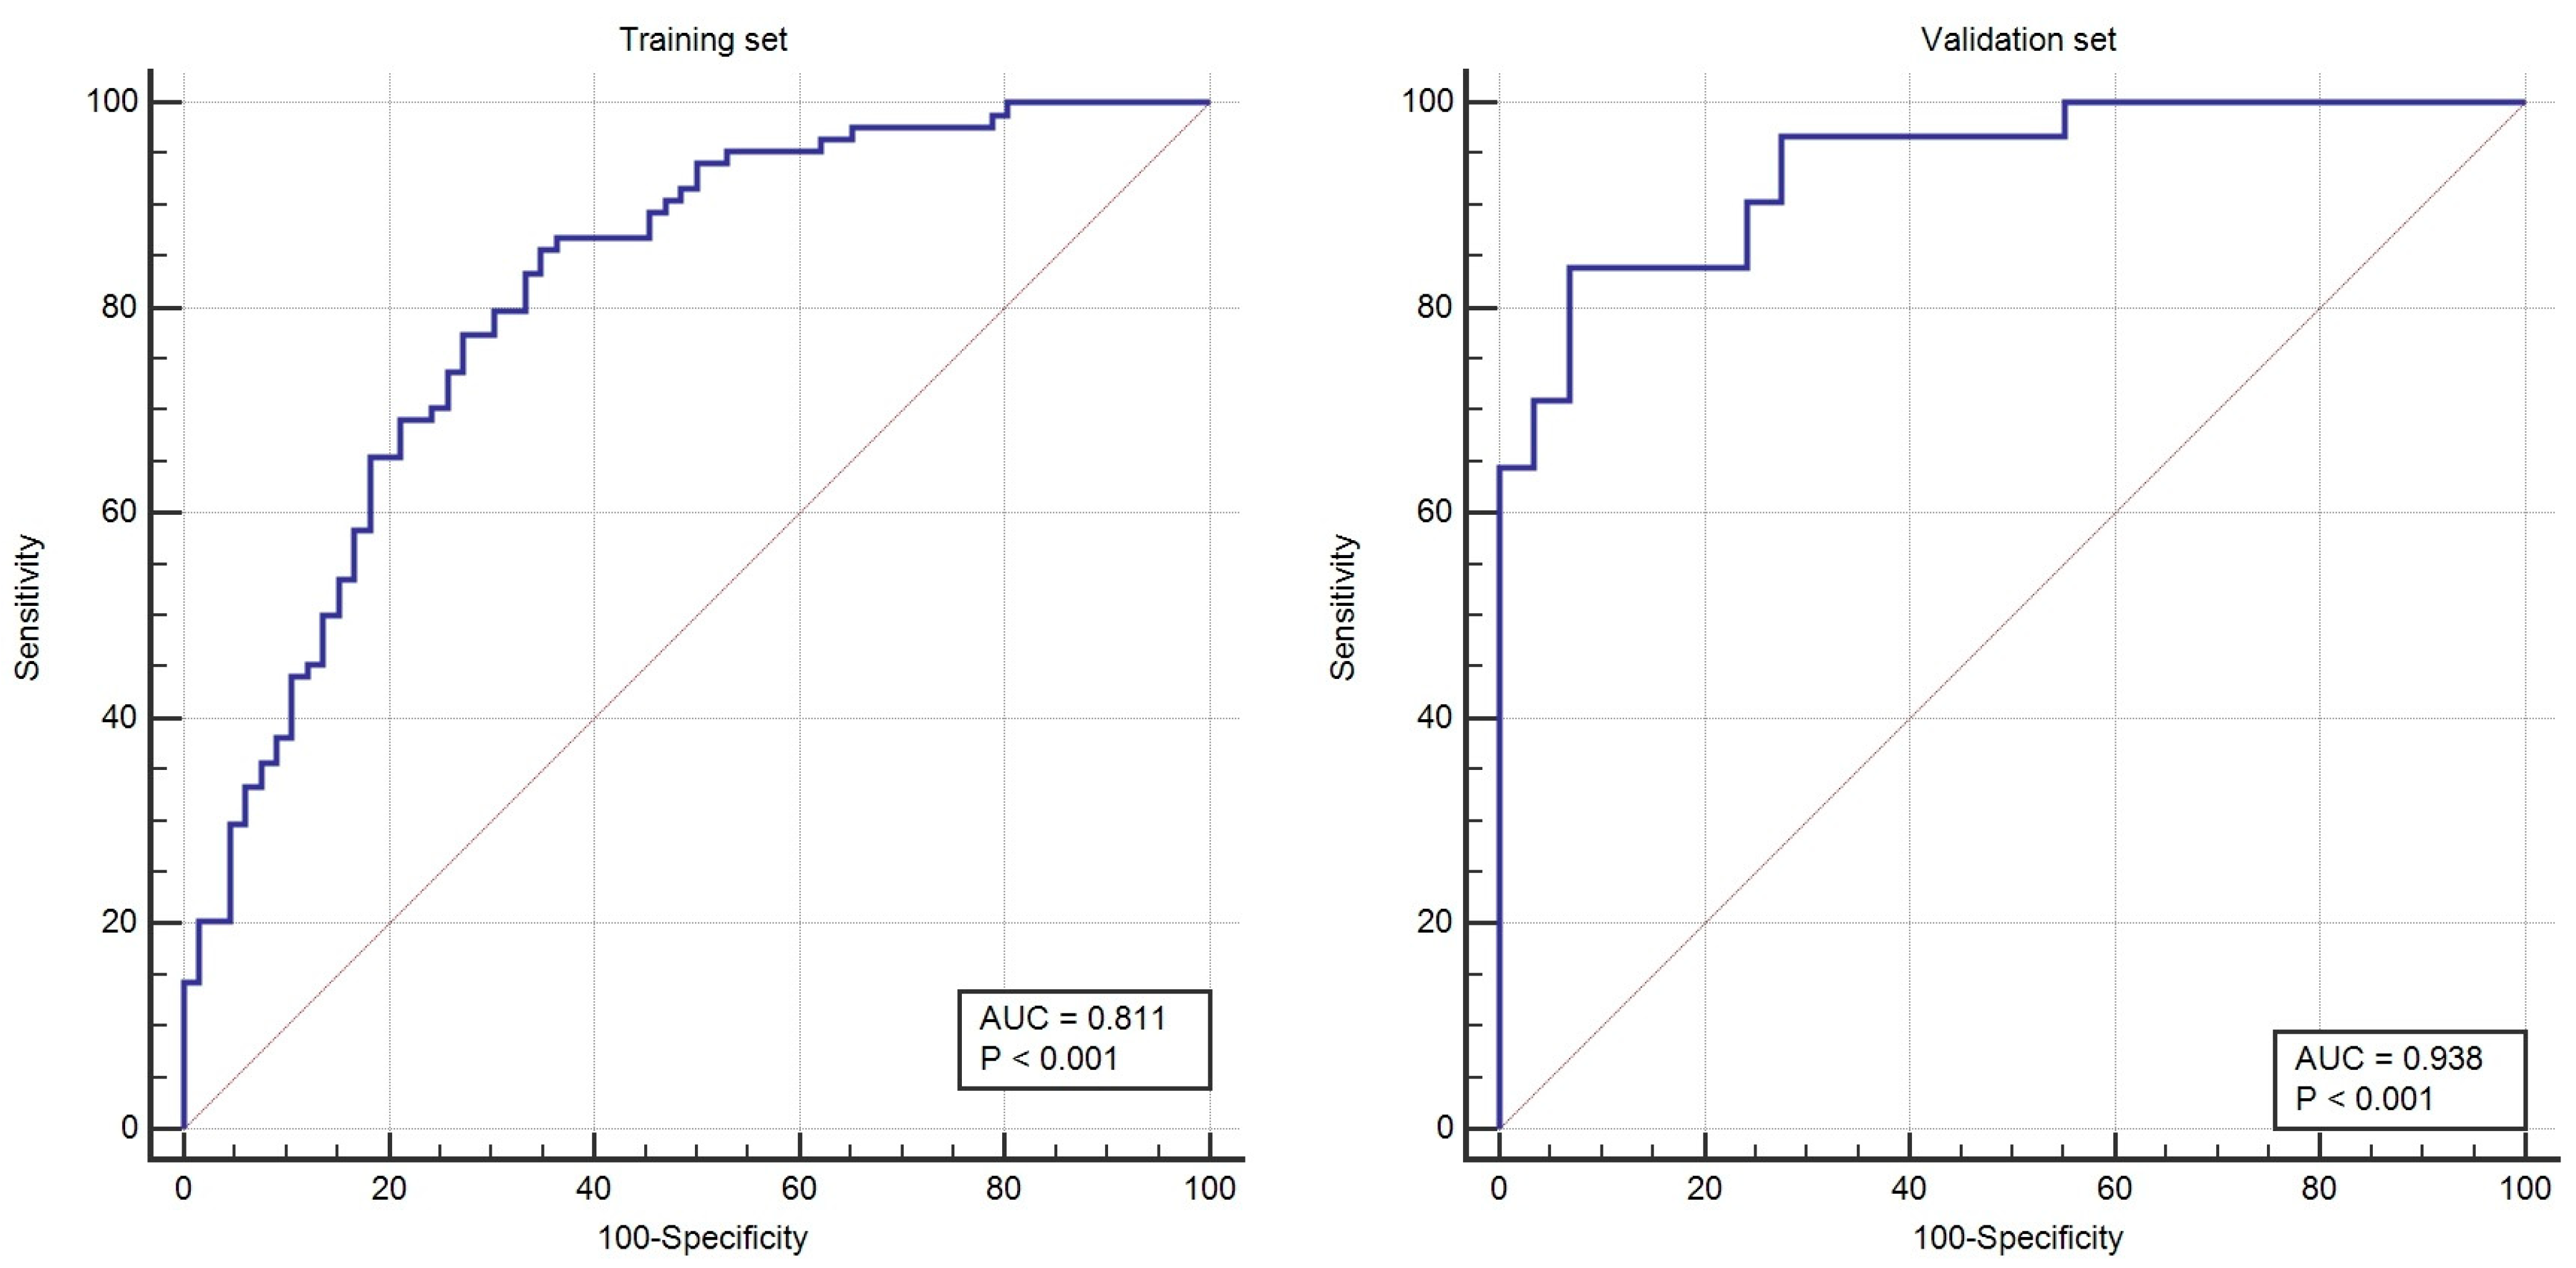
3.2. Feature Selection and Radiomics Score Construction: Training Set
3.3. Testing the Radiomics and Combined Model: Validation Set
4. Discussion
5. Conclusions
Author Contributions
Funding
Institutional Review Board Statement
Informed Consent Statement
Data Availability Statement
Conflicts of Interest
Appendix A

| Variable | Training Group | Validation Group | ||||
|---|---|---|---|---|---|---|
| ER/PR − (n = 66) | ER/PR + (n = 84) | p-Value | ER/PR − (n = 29) | ER/PR + (n = 31) | p-Value | |
| 10th percentile | 858.76 ± 152.69 | 703.54 ± 257.58 | <0.001 | 751.01 ± 236.85 | 618.69 ± 298.62 | 0.06 |
| 90th Percentile | 1404.14 ± 278.01 | 1147.33 ± 244.14 | <0.001 | 1271.67 ± 265.68 | 1146.55 ± 259.51 | 0.07 |
| Energy | 154,079,091.87 ± 187,947,003.67 | 64,601,088.59 ± 70,687,481.87 | 0.005 | 383,070,294.27 ± 640,219,396.08 | 100,544,142.77 ± 241,933,338.28 | 0.02 |
| Entropy | 4.27 ± 0.65 | 4.03 ± 0.65 | 0.05 | 4.61 ± 0.60 | 3.96 ± 0.97 | 0.003 |
| Interquartile Range | 296.92 ± 122.50 | 242.24 ± 124.70 | 0.003 | 278.17 ± 142.01 | 279.01 ± 167.82 | 0.98 |
| Kurtosis | 3.50 ± 1.20 | 3.31 ± 1.23 | 0.17 | 3.66 ± 1.25 | 2.88 ± 0.86 | 0.007 |
| Maximum | 1698.28 ± 424.94 | 1390.76 ± 336.63 | <0.001 | 1664.58 ± 361.44 | 1360.29 ± 322.37 | 0.001 |
| Mean Absolute Deviation | 182.88 ± 71.28 | 146.99 ± 67.02 | <0.001 | 168.64 ± 71.25 | 173.44 ± 87.70 | 0.81 |
| Mean | 1109.55 ± 181.18 | 915.11 ± 228.80 | <0.001 | 997.24 ± 230.44 | 873.56 ± 250.53 | 0.04 |
| Median | 1104.13 ± 191.24 | 902.88 ± 230.35 | <0.001 | 974.86 ± 207.09 | 873.66 ± 260.92 | 0.11 |
| Minimum | 598.79 ± 236.58 | 541.33 ± 297.31 | 0.09 | 497.65 ± 320.07 | 472.00 ± 341.73 | 0.76 |
| Range | 1119.47 ± 527.31 | 849.42 ± 389.35 | 0.001 | 1166.93 ± 500.50 | 888.29 ± 455.84 | 0.02 |
| Robust Mean Absolute Deviation | 116.80 ± 46.24 | 100.41 ± 49.95 | 0.009 | 117.56 ± 58.57 | 116.58 ± 67.18 | 0.95 |
| Root Mean Squared | 1153.30 ± 196.44 | 938.48 ± 222.09 | <0.001 | 1024.29 ± 217.98 | 908.51 ± 238.39 | 0.05 |
| Skewness | 0.028 ± 0.81 | 0.28 ± 0.56 | 0.06 | 0.46 ± 0.61 | 0.25 ± 0.62 | 0.19 |
| Total Energy | 2,405,590,407.93 ± 2,892,922,045.66 | 910,894,640.46 ± 839,674,754.21 | 0.002 | 6,238,029,521.44 ± 10,954,711,473.74 | 827,194,014.58 ± 1,298,673,230.16 | 0.008 |
| Uniformity | 0.067 ± 0.03 | 0.07 ± 0.04 | 0.04 | 0.05 ± 0.02 | 0.09 ± 0.07 | 0.006 |
| Variance | 66,273.47 ± 57,143.64 | 40,332.36 ± 38,935.60 | <0.001 | 52,022.41 ± 47,979.07 | 56,528.80 ± 58,645.87 | 0.74 |
| Variable | Training Group | Validation Group | ||||
|---|---|---|---|---|---|---|
| Coefficient | p-Value | Odds Ratio (95% CI) | Coefficient | p-Value | Odds Ratio (95% CI) | |
| 10th percentile | 0.000 | 0.975 | 1.00 (0.99–1.00) | 0.017 | 0.490 | 1.02 (0.96–1.06) |
| 90th Percentile | −0.002 | 0.56 | 0.99 (0.99–1.00) | 0.032 | 0.225 | 1.03 (0.98–1.08) |
| Energy | 0.000 | 0.379 | 1.00 (1.00–1.00) | 0.00 | 0.526 | 1.00 (1.00-1.00) |
| Interquartile Range | 0.000 | 0.977 | 0.9998 (0.98–1.01) | 0.005 | 0.869 | 1.005 (0.94–1.07) |
| Maximum | 0.004 | 0.031 | 1.00 (1.00–1.00) | 0.006 | 0.297 | 1.006 (0.99–1.02) |
| Mean Absolute Deviation | −0.019 | 0.118 | 0.98 (0.95–1.00) | 0.144 | 0.266 | 1.15 (0.89–1.49) |
| Mean | 0.002 | 0.567 | 1.00 (0.99–1.01) | −0.0002 | 0.998 | 0.99 (0.81–1.23) |
| Median | −0.002 | 0.493 | 0.99 (0.99–1.00) | 0.072 | 0.023 | 1.07 (1.00–1.14) |
| Range | −0.001 | 0.308 | 0.99 (0.99–1.00) | −0.012 | 0.065 | 0.98 (0.97–1.00) |
| Robust Mean Absolute Deviation | 0.026 | 0.094 | 1.02 (0.99–1.05) | −0.100 | 0.387 | 0.90 (0.71–1.13) |
| Root Mean Squared | −0.006 | 0.195 | 0.99 (0.98–1.00) | −0.136 | 0.177 | 0.98 (0.715–1.063) |
| Total Energy | 0.000 | 0.039 | 1.00 (1.00–1.00) | 0.00 | 0.440 | 1.00 (1.00–1.00) |
| Uniformity | −2.694 | 0.649 | 0.06(0.00–7446.19) | 42.990 | 0.185 | 4.68 × 10¹⁸ (1.01509 × 10⁻⁹–21.59172 × 1045) |
| Variance | 0.000 | 0.709 | 1.00 (1.00–1.00) | 0.00001 | 0.849 | 1.00 (0.99–1.00) |
| Constant | 4.454 | −0.9538 | ||||
References
- Carey, L.A.; Perou, C.M.; Livasy, C.A.; Dressler, L.G.; Cowan, D.; Conway, K.; Karaca, G.; Troester, M.A.; Tse, C.K.; Edmiston, S.; et al. Race, breast cancer subtypes, and survival in the Carolina breast cancer study. J. Am. Med. Assoc. 2006, 295, 2492–2502. [Google Scholar] [CrossRef] [PubMed]
- Lam, S.W.; Jimenez, C.R.; Boven, E. Breast cancer classification by proteomic technologies: Current state of knowledge. Cancer Treat Rev. 2014, 40, 129–138. [Google Scholar] [CrossRef]
- Mazurowski, M.A.; Zhang, J.; Grimm, L.J.; Yoon, S.C.; Silber, J.I. Radiogenomic analysis of breast cancer: Luminal B molecular subtype is associated with enhancement dynamics at MR imaging. Radiology 2014, 273, 365–372. [Google Scholar] [CrossRef] [PubMed]
- Goldhirsch, A.; Winer, E.P.; Coates, A.S.; Gelber, R.D.; Piccart-Gebhart, M.; Thürlimann, B.; Senn, H.J.; Panel Members. Personalizing the treatment of women with early breast cancer: Highlights of the St Gallen International Expert Consensus on the Primary Therapy of Early Breast Cancer 2013. Ann. Oncol. 2013, 24, 2206–2223. [Google Scholar] [CrossRef] [PubMed]
- Stevanovic, L.; Choschzick, M.; Moskovszky, L.; Varga, Z. Variability of predictive markers (hormone receptors, Her2, Ki67) and intrinsic subtypes of breast cancer in four consecutive years 2015–2018. J. Cancer Res. Clin. Oncol. 2019, 145, 2983–2994. [Google Scholar] [CrossRef]
- Parker, R.L.; Huntsman, D.G.; Lesack, D.W.; Cupples, J.B.; Grant, D.R.; Akbari, M.; Gilks, C.B. Assessment of interlaboratory variation in the immunohistochemical determination of estrogen receptor status using a breast cancer tissue microarray. Am. J. Clin. Pathol. 2002, 117, 723–728. [Google Scholar] [CrossRef] [PubMed]
- Li, H.; Zhu, Y.; Burnside, E.S.; Huang, E.; Drukker, K.; Hoadley, K.A.; Fan, C.; Conzen, S.D.; Zuley, M.; Net, J.M.; et al. Quantitative MRI radiomics in the prediction of molecular classifications of breast cancer subtypes in the TCGA/TCIA data set. NPJ Breast Cancer 2016, 2, 16012. [Google Scholar] [CrossRef]
- Grimm, L.J.; Zhang, J.; Mazurowski, M.A. Computational approach to radiogenomics of breast cancer: Luminal a and luminal B molecular subtypes are associated with imaging features on routine breast MRI extracted using computer vision algorithms. J. Magn. Reason. Imaging 2015, 42, 902–907. [Google Scholar] [CrossRef] [PubMed]
- Holli-Helenius, K.; Salminen, A.; Rinta-Kiikka, I.; Koskivuo, I.; Brück, N.; Boström, P.; Parkkola, R. MRI texture analysis in differentiating luminal a and luminal B breast cancer molecular subtypes—A feasibility study. BMC Med. Imaging 2017, 17, 69. [Google Scholar] [CrossRef]
- Zhong, S.; Wang, F.; Wang, Z.; Zhou, M.; Li, C.; Yin, J. Multiregional Radiomic Signatures Based on Functional Parametric Maps from DCE-MRI for Preoperative Identification of Estrogen Receptor and Progesterone Receptor Status in Breast Cancer. Diagnostics 2022, 12, 2558. [Google Scholar] [CrossRef]
- Ming, W.; Li, F.; Zhu, Y.; Bai, Y.; Gu, W.; Liu, Y.; Liu, X.; Sun, X.; Liu, H. Unsupervised Analysis Based on DCE-MRI Radiomics Features Revealed Three Novel Breast Cancer Subtypes with Distinct Clinical Outcomes and Biological Characteristics. Cancers 2022, 14, 5507. [Google Scholar] [CrossRef] [PubMed]
- Horvat, J.V.; Bernard-Davila, B.; Helbich, T.H.; Zhang, M.; Morris, E.A.; Thakur, S.B.; Ochoa-Albiztegui, R.E.; Leithner, D.; Marino, M.A.; Baltzer, P.A.; et al. Diffusion-weighted imaging (DWI) with apparent diffusion coefficient (ADC) mapping as a quantitative imaging biomarker for prediction of immunohistochemical receptor status, proliferation rate, and molecular subtypes of breast cancer. J. Magn. Reason. Imaging 2019, 50, 836–846. [Google Scholar] [CrossRef] [PubMed]
- Kim, J.Y.; Kim, J.J.; Hwangbo, L.; Lee, J.W.; Lee, N.K.; Nam, K.J.; Choo, K.S.; Kang, T.; Park, H.; Son, Y.; et al. Diffusion-weighted MRI of estrogen receptor-positive, HER2-negative, node-negative breast cancer: Association between intratumoral heterogeneity and recurrence risk. Eur. Radiol. 2020, 30, 66–76. [Google Scholar] [CrossRef]
- Fan, M.; He, T.; Zhang, P.; Cheng, H.; Zhang, J.; Gao, X.; Li, L. Diffusion-weighted imaging features of breast tumours and the surrounding stroma reflect intrinsic heterogeneous characteristics of molecular subtypes in breast cancer. NMR Biomed. 2018, 31, e3869. [Google Scholar] [CrossRef] [PubMed]
- Kim, S.Y.; Kim, E.K.; Moon, H.J.; Yoon, J.H.; Koo, J.S.; Kim, S.G.; Kim, M.J. Association among T2 signal intensity, necrosis, ADC and Ki-67 in estrogen receptor-positive and HER2-negative invasive ductal carcinoma. Magn. Reason. Imaging 2018, 54, 176–182. [Google Scholar] [CrossRef] [PubMed]
- Runge, V.M. Critical questions regarding gadolinium deposition in the brain and body after injections of the gadolinium-based contrast agents, safety, and clinical recommendations in consideration of the EMA’s pharmacovigilance and risk assessment committee recommendation for suspension of the marketing authorizations for 4 linear agents. Investig. Radiol. 2017, 52, 317–323. [Google Scholar]
- Chen, Q.; Xia, J.; Zhang, J. Identify the triple-negative and non-triple-negative breast cancer by using texture features of medicale ultrasonic image: A STROBE-compliant study. Medicine 2021, 100, e25878. [Google Scholar] [CrossRef]
- Surov, A.; Kim, J.Y.; Aiello, M.; Huang, W.; Yankeelov, T.E.; Wienke, A.; Pech, M. Associations Between Dynamic Contrast Enhanced Magnetic Resonance Imaging and Clinically Relevant Histopathological Features in Breast Cancer: A Multicenter Analysis. In Vivo 2022, 36, 398–408. [Google Scholar] [CrossRef]
- Yang, Z.; Chen, X.; Zhang, T.; Cheng, F.; Liao, Y.; Chen, X.; Dai, Z.; Fan, W. Quantitative Multiparametric MRI as an Imaging Biomarker for the Prediction of Breast Cancer Receptor Status and Molecular Subtypes. Front. Oncol. 2021, 11, 628824. [Google Scholar] [CrossRef]
- Horvat, J.V.; Iyer, A.; Morris, E.A.; Apte, A.; Bernard-Davila, B.; Martinez, D.F.; Leithner, D.; Sutton, O.M.; Ochoa-Albiztegui, R.E.; Giri, D.; et al. Histogram Analysis and Visual Heterogeneity of Diffusion-Weighted Imaging with Apparent Diffusion Coefficient Mapping in the Prediction of Molecular Subtypes of Invasive Breast Cancers. Contrast Media Mol. Imaging 2019, 2019, 2972189. [Google Scholar] [CrossRef]
- Leithner, D.; Bernard-Davila, B.; Martinez, D.F.; Horvat, J.V.; Jochelson, M.S.; Marino, M.A.; Avendano, D.; Ochoa-Albiztegui, R.E.; Sutton, E.J.; Morris, E.A.; et al. Radiomic Signatures Derived from Diffusion-Weighted Imaging for the Assessment of Breast Cancer Receptor Status and Molecular Subtypes. Mol. Imaging Biol. 2020, 22, 453–461. [Google Scholar] [CrossRef] [PubMed]
- Szep, M.; Pintican, R.; Boca, B.; Perja, A.; Duma, M.; Feier, D.; Fetica, B.; Eniu, D.; Dudea, S.M.; Chiorean, A. Multiparametric MRI Features of Breast Cancer Molecular Subtypes. Medicina 2022, 58, 1716. [Google Scholar] [CrossRef]
- Liu, H.L.; Zong, M.; Wei, H.; Wang, C.; Lou, J.J.; Wang, S.Q.; Zou, Q.G.; Jiang, Y.N. Added value of histogram analysis of apparent diffusion coefficient maps for differentiating triple-negative breast cancer from other subtypes of breast cancer on standard MRI. Cancer Manag. Res. 2019, 11, 8239–8247. [Google Scholar] [CrossRef] [PubMed]
- Guo, Y.; Kong, Q.C.; Li, L.Q.; Tang, W.J.; Zhang, W.L.; Ning, G.Y.; Xue, J.; Zhou, Q.W.; Liang, Y.Y.; Wu, M.; et al. Whole Volume Apparent Diffusion Coefficient (ADC) Histogram as a Quantitative Imaging Biomarker to Differentiate Breast Lesions: Correlation with the Ki-67 Proliferation Index. Biomed. Res. Int. 2021, 2021, 4970265. [Google Scholar] [CrossRef]
- Siviengphanom, S.; Gandomkar, Z.; Lewis, S.J.; Brennan, P.C. Mammography-based Radiomics in Breast Cancer: A Scoping Review of Current Knowledge and Future Needs. Acad. Radiol. 2022, 29, 1228–1247. [Google Scholar] [CrossRef] [PubMed]
- La Forgia, D.; Fanizzi, A.; Campobasso, F.; Bellotti, R.; Didonna, V.; Lorusso, V.; Moschetta, M.; Massafra, R.; Tamborra, P.; Tangaro, S.; et al. Radiomic Analysis in Contrast-Enhanced Spectral Mammography for Predicting Breast Cancer Histological Outcome. Diagnostics 2020, 10, 708. [Google Scholar] [CrossRef]
- Marino, M.A.; Pinker, K.; Leithner, D.; Sung, J.; Avendano, D.; Morris, E.A.; Jochelson, M. Contrast-enhanced mammography and radiomics analysis for noninvasive breast cancer characterization: Initial results. Mol. Imaging Biol. 2020, 22, 780–787. [Google Scholar] [CrossRef]
- Dominique, C.; Callonnec, F.; Berghian, A.; Defta, D.; Vera, P.; Modzelewski, R.; Decazes, P. Deep learning analysis of contrast-enhanced spectral mammography to determine histoprognostic factors of malignant breast tumours. Eur. Radiol. 2022, 32, 4834–4844. [Google Scholar] [CrossRef]
- Endrikat, J.; Schmidt, G.; Haverstock, D.; Weber, O.; Trnkova, Z.J.; Barkhausen, J. Sensitivity of Contrast-Enhanced Breast MRI vs X-ray Mammography Based on Cancer Histology, Tumor Grading, Receptor Status, and Molecular Subtype: A Supplemental Analysis of 2 Large Phase III Studies. Breast Cancer (Auckl.) 2022, 16, 11782234221092155. [Google Scholar] [CrossRef]
- Anestis, A.; Zoi, I.; Papavassiliou, A.G.; Karamouzis, M.V. Androgen Receptor in Breast Cancer-Clinical and Preclinical Research Insights. Molecules 2020, 25, 358. [Google Scholar] [CrossRef]
- Chawla, N.V.; Bowyer, K.W.; Hall, L.O.; Kegelmeyer, W.P. SMOTE: Synthetic minority over-sampling technique. J. Artif. Intell. Res. 2002, 16, 321–357. [Google Scholar] [CrossRef]
- Zhao, X.M.; Li, X.; Chen, L.; Aihara, K. Protein classification with imbalanced data. Proteins 2007, 70, 1125–1132. [Google Scholar] [CrossRef] [PubMed]
- Pelayo, L.; Dick, S. Applying novel resampling strategies to software defect prediction. In Proceedings of the Annual Meeting of the North American Fuzzy Information Processing Society, San Diego, CA, USA, 24–27 June 2007; IEEE: San Diego, CA, USA, 2007; pp. 69–72. [Google Scholar]
- Gu, Q.; Cai, Z.; Ziu, L. Classification of imbalanced data sets by using the hybrid re-sampling algorithm based on isomap. LNCS Adv. Comput. Intell. 2009, 5821, 287–296. [Google Scholar]
- Wang, K.J.; Makond, B.; Wang, K.M. An improved survivability prognosis of breast cancer by using sampling and feature selection technique to solve imbalanced patient classification data. BMC Med. Inform. Decis. Mak. 2013, 13, 124. [Google Scholar] [CrossRef] [PubMed]


| Variable | Training Group | Validation Group | ||||
|---|---|---|---|---|---|---|
| ER/PR − (n = 66) | ER/PR + (n = 84) | p-Value | ER/PR − (n = 29) | ER/PR + (n = 31) | p-Value | |
| Age | 44.87 ± 8.60 | 47.16 ± 8.48 | 0.09 | 44.37 ± 9.05 | 49.32 ± 8.88 | 0.03 |
| Size | 17.59 ± 4.39 | 17.25 ± 5.49 | 0.63 | 29.37 ± 15.56 | 14.41 ± 4.14 | <0.001 |
| Pathology | 0.04 | 0.73 | ||||
| NST 1 | 64 | 69 | 27 | 27 | ||
| Other | 2 | 15 | 2 | 4 | ||
| Ki67% | 50.69 ± 25.89 | 26.16 ± 21.24 | <0.001 | 60.89 ± 25.89 | 18.96 ± 18.05 | <0.001 |
| HER2 | 0.18 | 0.78 | ||||
| positive | 2 | 8 | 4 | 4 | ||
| negative | 64 | 76 | 25 | 27 | ||
| Histological grade | <0.001 | <0.001 | ||||
| 1 | 2 | 29 | 1 | 13 | ||
| 2 | 4 | 37 | 4 | 15 | ||
| 3 | 60 | 18 | 24 | 3 | ||
| Variable | Cut-Off Value | AUC (95% CI) | Sensitivity (95% CI) | Specificity (95% CI) | PPV (95% CI) | NPV (95% CI) |
|---|---|---|---|---|---|---|
| 10th Percentile | ≤764.4 | 0.716 (0.636–0.786) | 60.71 (49.5–71.2) | 74.24 (62.0–84.2) | 75.0 (63.0–84.7) | 59.8 (48.3–70.4) |
| 90th Percentile | ≤1389.8 | 0.763 (0.687–0.829) | 89.29 (80.6–95.0) | 54.55 (41.8–66.9) | 71.4 (61.8–79.8) | 80.0 (65.4–90.4) |
| Energy | ≤94,304,540 | 0.634 (0.552–0.711) | 83.33 (73.6–90.6) | 39.39 (27.6–52.2) | 63.6 (53.9–72.6) | 65.0 (48.3–79.4) |
| Interquartile Range | ≤264.25 | 0.639 (0.557–0.716) | 73.81 (63.1–82.8) | 60.61 (47.8–72.4) | 70.5 (59.8–79.7) | 64.5 (51.3–76.3) |
| Maximum | ≤1377 | 0.731 (0.652–0.800) | 57.14 (45.9–67.9) | 83.33 (72.1–91.4) | 81.4 (69.1–90.3) | 60.4 (49.6–70.5) |
| Mean | ≤1015 | 0.766 (0.690–0.832) | 76.19 (65.7–84.8) | 66.67 (54.0–77.8) | 74.4 (63.9–83.2) | 68.7 (55.9–79.8) |
| Mean Absolute Deviation | ≤122.1356 | 0.667 (0.585–0.741) | 50.00 (38.9–61.1) | 78.79 (67.0–87.9) | 75.0 (61.6–85.6) | 55.3 (44.7–65.6) |
| Median | ≤997 | 0.766 (0.690–0.832) | 71.43 (60.5–80.8) | 72.73 (60.4–83.0) | 76.9 (66.0–85.7) | 66.7 (54.6–77.3) |
| Range | ≤874 | 0.665 (0.584–0.740) | 60.71 (49.5–71.2) | 69.70 (57.1–80.4) | 71.8 (59.9–81.9) | 58.2 (46.6–69.2) |
| Robust Mean Absolute Deviation | ≤105.75 | 0.624 (0.541–0.702) | 69.05 (58.0–78.7) | 54.55 (41.8–66.9) | 65.9 (55.0–75.7) | 58.1 (44.8–70.5) |
| Root Mean Squared | ≤1037.9215 | 0.780 (0.705–0.844) | 77.38 (67.0–85.8) | 71.21 (58.7–81.7) | 77.4 (67.0–85.8) | 71.2 (58.7–81.7) |
| Total Energy | ≤502,487,200 | 0.649 (0.567–0.725) | 46.43 (35.5–57.6) | 80.30 (68.7–89.1) | 75.0 (61.1–86.0) | 54.1 (43.7–64) |
| Uniformity | >0.0455 | 0.596 (0.513–0.675) | 89.29 (80.6–95.0) | 28.79 (18.3–41.3) | 61.5 (52.2–70.1) | 67.9 (47.6–84.1) |
| Variance | ≤42,112.37 | 0.677 (0.595–0.751) | 70.24 (59.3–79.7) | 59.09 (46.3–71.0) | 68.6 (57.7–78.2) | 60.9 (47.9–72.9) |
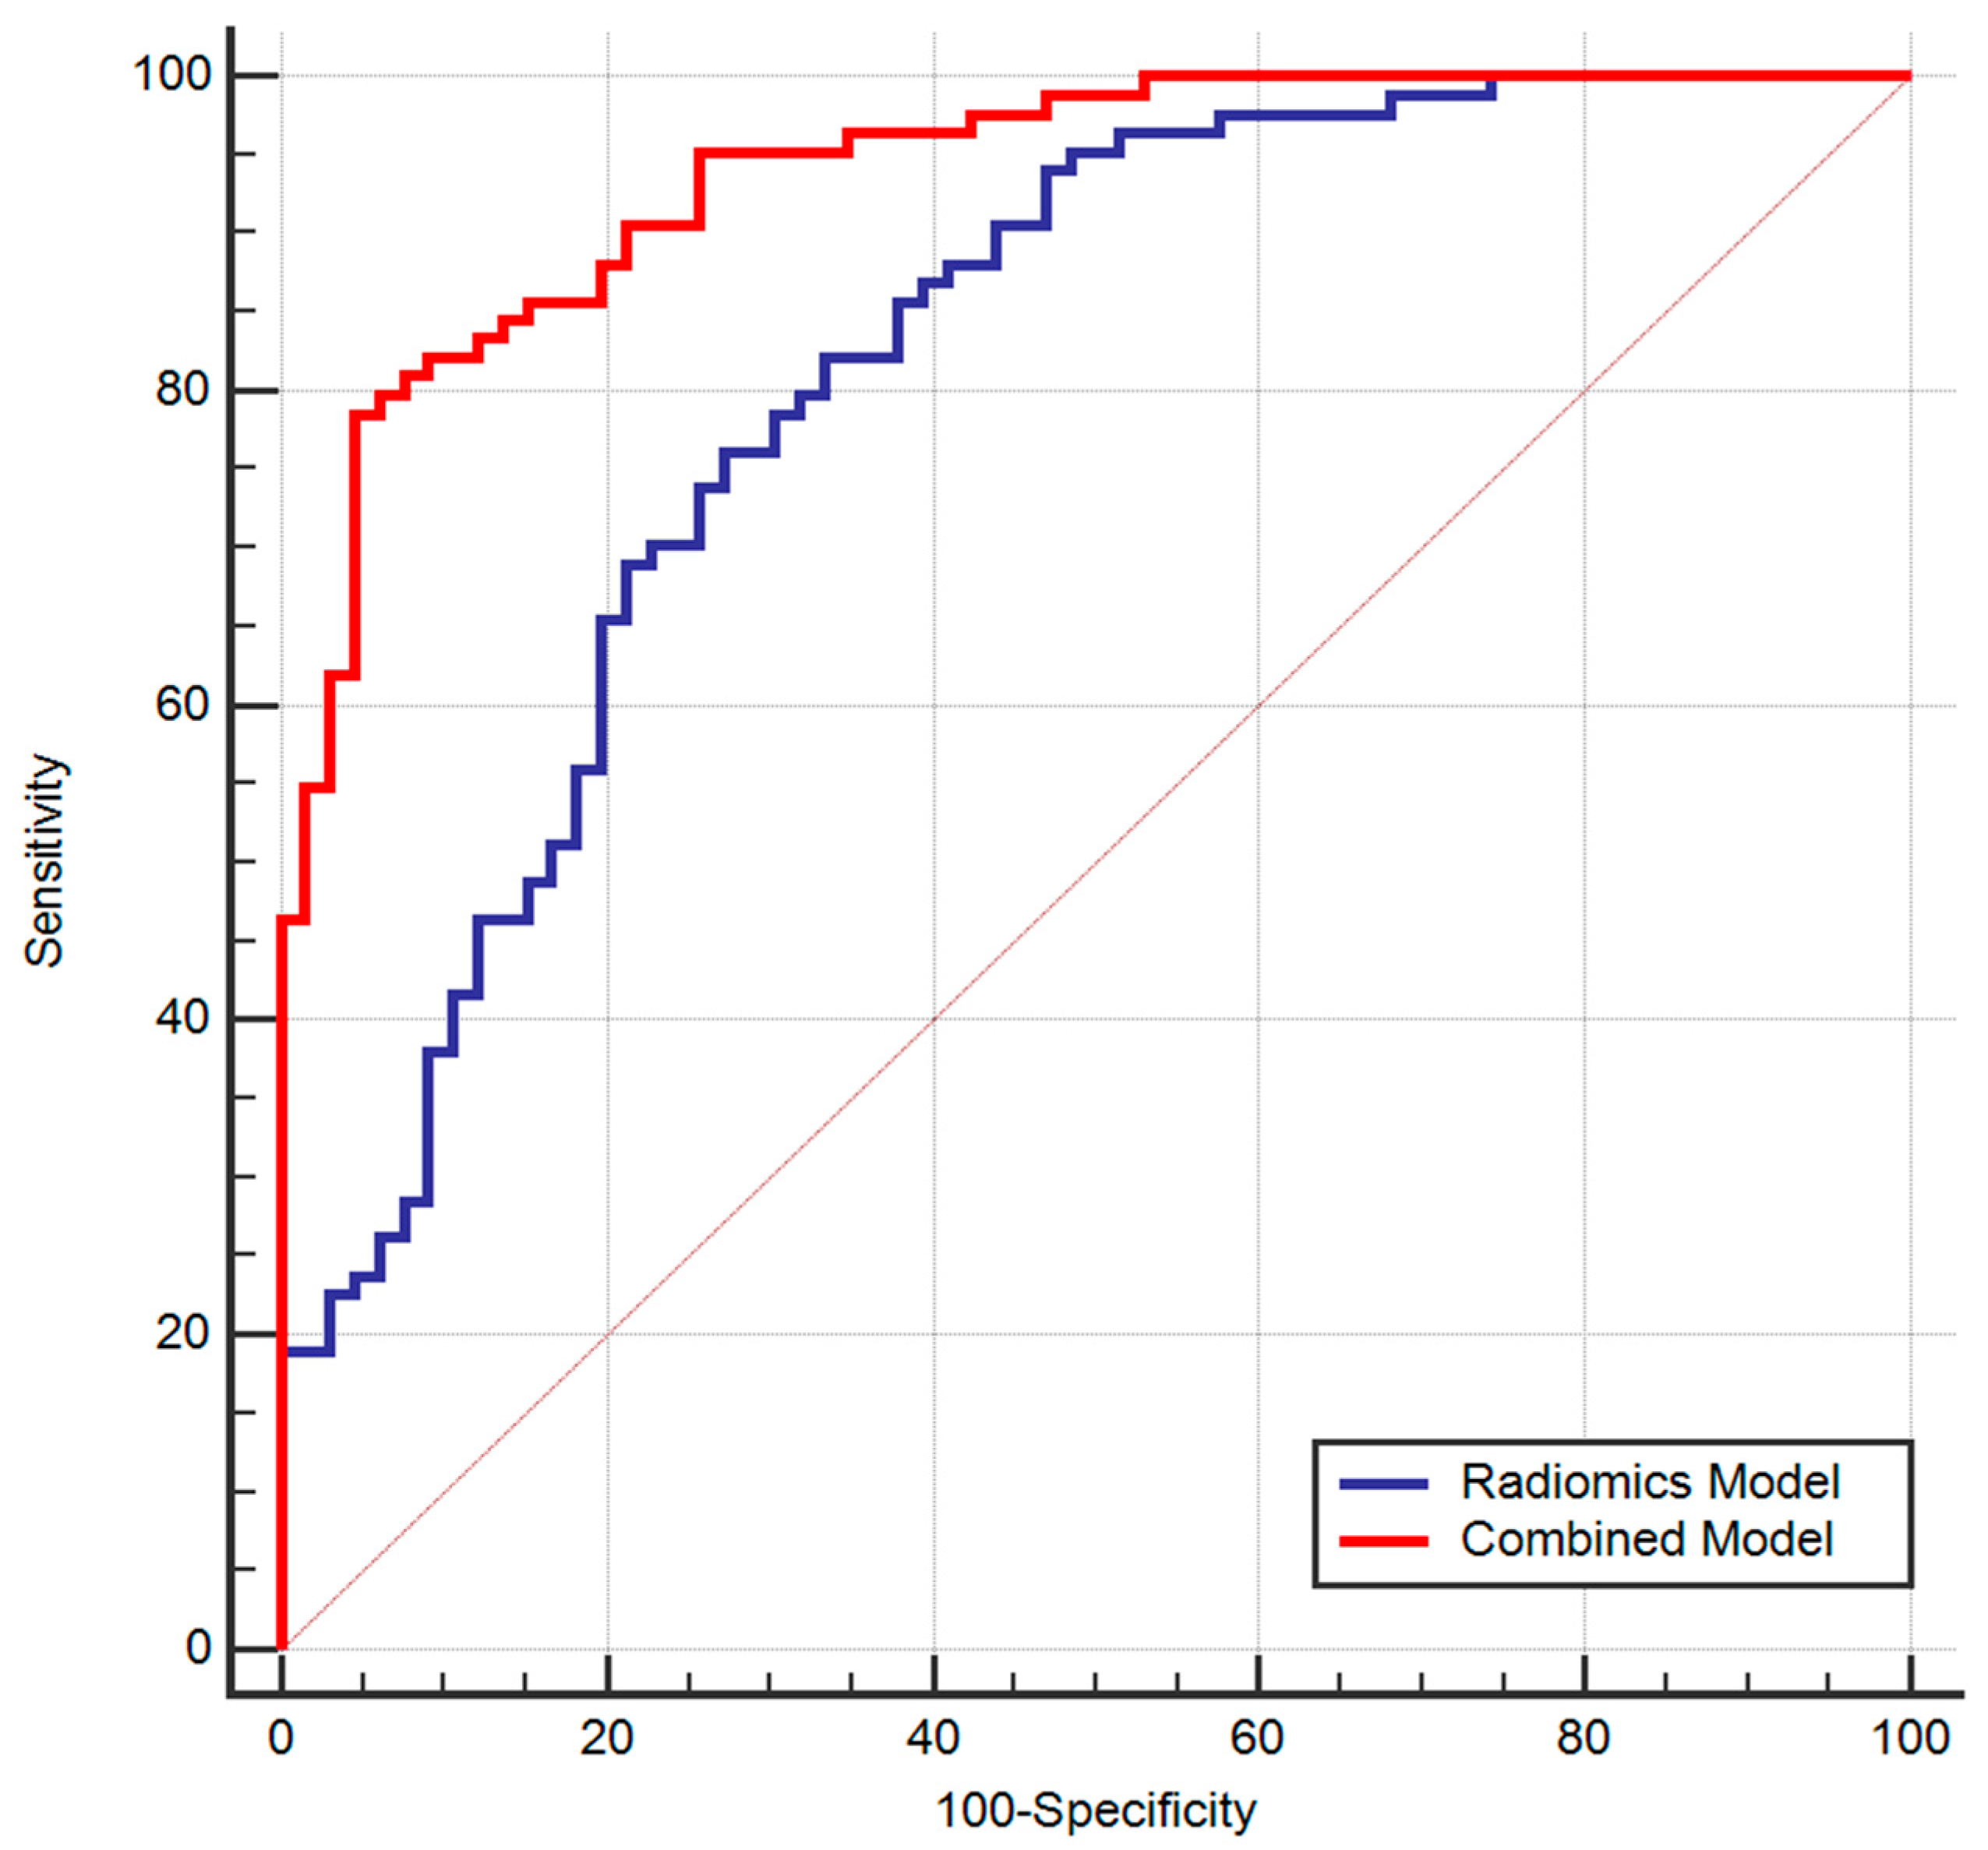
| Radiomics Model | >0.5699 | 0.811 (0.739–0.870) | 76.19 (65.7–84.8) | 72.73 (60.4–83.0) | 78.0 67.5–86.4 | 70.6 (58.3–81.0) |
| Combined Model | >0.6631 | 0.938 (0.887–0.971) | 78.57 (68.3–86.8) | 95.45 (87.3–99.1) | 95.7 (87.8–99.1) | 77.8 (67.2–86.3) |
Disclaimer/Publisher’s Note: The statements, opinions and data contained in all publications are solely those of the individual author(s) and contributor(s) and not of MDPI and/or the editor(s). MDPI and/or the editor(s) disclaim responsibility for any injury to people or property resulting from any ideas, methods, instructions or products referred to in the content. |
© 2023 by the authors. Licensee MDPI, Basel, Switzerland. This article is an open access article distributed under the terms and conditions of the Creative Commons Attribution (CC BY) license (https://creativecommons.org/licenses/by/4.0/).
Share and Cite
Szep, M.; Pintican, R.; Boca, B.; Perja, A.; Duma, M.; Feier, D.; Epure, F.; Fetica, B.; Eniu, D.; Roman, A.; et al. Whole-Tumor ADC Texture Analysis Is Able to Predict Breast Cancer Receptor Status. Diagnostics 2023, 13, 1414. https://doi.org/10.3390/diagnostics13081414
Szep M, Pintican R, Boca B, Perja A, Duma M, Feier D, Epure F, Fetica B, Eniu D, Roman A, et al. Whole-Tumor ADC Texture Analysis Is Able to Predict Breast Cancer Receptor Status. Diagnostics. 2023; 13(8):1414. https://doi.org/10.3390/diagnostics13081414
Chicago/Turabian StyleSzep, Madalina, Roxana Pintican, Bianca Boca, Andra Perja, Magdalena Duma, Diana Feier, Flavia Epure, Bogdan Fetica, Dan Eniu, Andrei Roman, and et al. 2023. "Whole-Tumor ADC Texture Analysis Is Able to Predict Breast Cancer Receptor Status" Diagnostics 13, no. 8: 1414. https://doi.org/10.3390/diagnostics13081414