
Non-Laboratory-Based Risk Prediction Tools for Undiagnosed Pre-Diabetes: A Systematic Review
 ,
,
Abstract
:1. Introduction
2. Materials and Methods
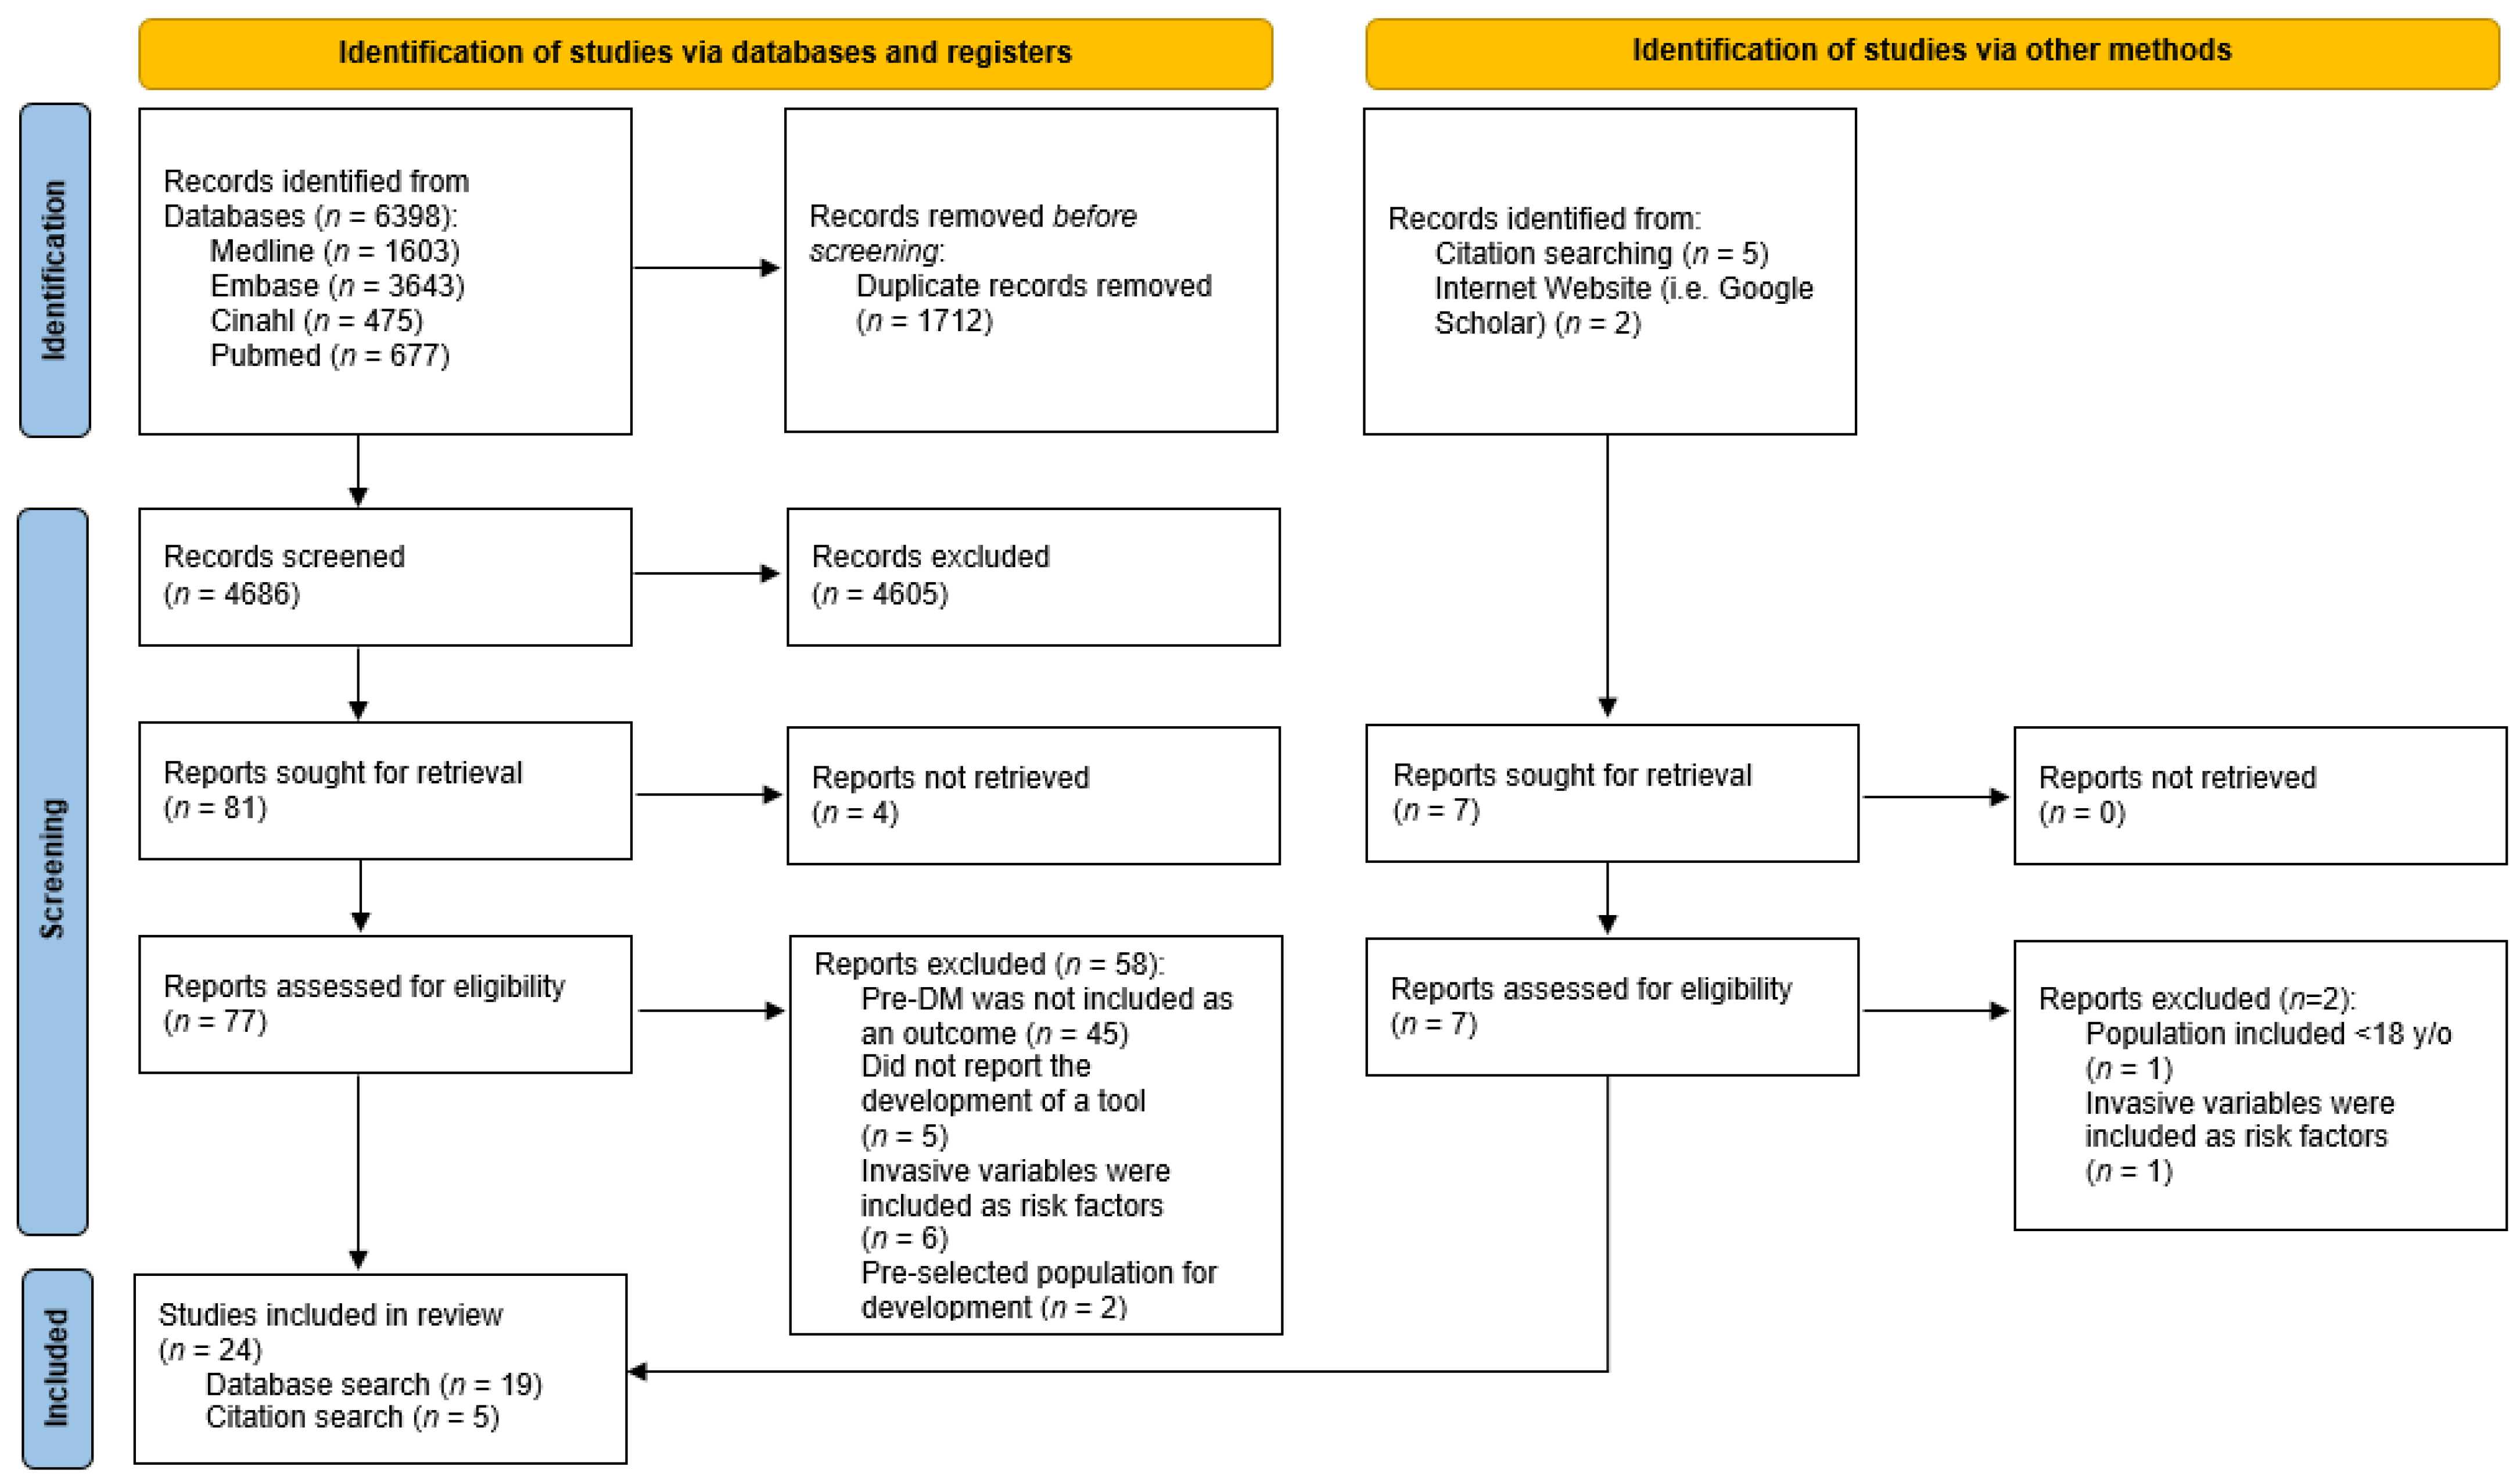
2.1. Search Strategy
2.2. Screening and Selection of Studies
- Included pre-DM as the only, or one of the, main outcome(s) of the risk prediction tool;
- Reported the main outcome using: (i) fasting glucose, (ii) 2-h post-prandial glucose, or (iii) haemoglobin A1c (HbA1c);
- Provided a detailed methodology for the development of their tool;
- Only utilised non-laboratory predictors as their prediction variables;
- Developed tools that were for adults (≥18 years old) in the general population;
- Published in the English language with full-text available.
- Included gestational DM or Type 1 DM as the outcome(s) of risk prediction;
- Only investigated associations between predictors and outcomes;
- Only aimed to develop or test theoretical algorithms without the intention of implementation in clinical practice;
- Utilised any laboratory or genetic predictors as their prediction variables;
- Developed the tool for a specific population, e.g., pregnant women, children, patients of a specific disease group, or older people;
- Commentaries, editorials, conference abstracts, and systematic reviews.
2.3. Data Extraction and Quality Assessment
3. Results
3.1. Quality of Included Studies
3.2. Outcomes of Risk Prediction Tools

| Development Sample | Outcome of the Tool | Predictors of the Tool | Article Quality | |||||||||
|---|---|---|---|---|---|---|---|---|---|---|---|---|
| Author, Year | Country/ Region | n | Age (Range/ Mean) | Data Source | Extent of Hyperglycaemia | Outcome Measured by | Definition(s) | Development Method(s) | No. of | Predictors Included | No. of CASP Criteria Met (Out of 11) | |
| Abbas, 2021 [18] | Qatar | 5814 | 40.6 | Population-based BioBank data | PDM | HbA1c | 5.7-6.4% | Multivariate LR model | 5 | - Age - BMI - HTN - Sex - WC | 8 | |
| Bahijri, 2020 [19] | Saudi Arabia | 1403 | 32.0 | Cluster sampling in healthcare centres | PDM/DM | HbA1c/ FPG/ 1-h PG | ≥5.7% ≥6.1 mmol/L ≥8.6 mmol/L | Multivariate LR model | 5 | - Age - Sex - WC - Hx of HG - Family Hx of DM | 8 | |
| Barengo, 2017 [32] | Colombia | 2060 | 47.2 | Age-stratified sampling among population-wide insurance users | PDM/DM | FPG/ 2-h PG | ≥5.6 mmol/L ≥7.8 mmol/L | Multivariate LR model | 4 | - Age - WC - HTN - Family Hx of DM | 9 | |
| Dong, 2022 [7] | Hong Kong | 1238 | 40.7 | Population-based health survey data | PDM/DM | HbA1c/ FPG | ≥5.7% ≥6.1 mmol/L | Multivariate LR model; Extreme Gradient Boosting ML model | 7; 8 | LR: - Age - BMI - WHR - Smoking - Sleep hours - Exercise - Fruit consumption. | ML: - Age - BMI - WHR - SBP - WC - Smoking - Sleep hours - Exercise | 10 |
| Fu, 2014 [10] | China | 7953 | 56.4 | Community-based health screening study | PDM/DM | 2-h PG | ≥7.8 mmol/L | Multivariate LR model | 9 | - Age - Height - BMI - WC - SBP - Pulse - HTN - DLP - Family Hx of DM | 9 | |
| Fujiati, 2017 [11] | Indonesia | 21,720 | >18 | Population-based health survey data | PDM | FPG/ 2-h PG | 5.6–6.9 mmol/L 7.8–11.0 mmol/L | Multivariate LR model | 8 | - Age - Sex - Education level - Family Hx of DM - Smoking - Exercise - BMI - HTN | 9 | |
| Gao, 2010 [12] | China | 1986 | 52.7 | Population-based health survey data | PDM | FPG/ 2-h PG | 6.1–6.9 mmol/L 7.8–11.0 mmol/L | Multivariate LR model | 3 | - Age - WC - Family Hx of DM | 10 | |
| Gray, 2010 [26] | UK | 6186 | 57.3 | Population-based screening study data | PDM/DM | FPG/ 2-h PG | ≥6.1 mmol/L ≥7.8 mmol/L | Multivariate LR model | 7 | - Age - Ethnicity - WC - BMI - Sex - Family Hx of DM - HTN | 10 | |
| Gray, 2012 [25] | UK | 6390 | 57.3 | Population-based screening study data | PDM/DM | FPG/ 2-h PG/HbA1c | ≥6.1 mmol/L≥7.8 mmol/L≥6.5% † | Multivariate LR model | 6 | - Age - Ethnicity - BMI - Sex - Family Hx of DM - HTN | 10 | |
| Gray, 2013 [24] | Portugal | 3374 | 51.5 | Cluster sampling in healthcare centres | PDM/DM | FPG | ≥5.6 mmol/L | Multivariate LR model | 4 | - Age - BMI - Sex - HTN | 9 | |
| Handlos, 2013 [20] | Middle East and North Africa | 6588 | 44.3 | Opportunity sampling in study locations | PDM/DM | HbA1c | ≥6.0% | Multivariate LR model | 7 | - Age - BMI - Sex - Family Hx of DM - Family Hx of DM (2) ‡ - Hx of GDM - Ethnicity | 8 | |
| Henjum, 2022 [23] | Algeria | 308 | ≥18 | Opportunity sampling in study locations | PDM/DM | HbA1c | ≥5.7% | Multivariate LR model | 3 | - Age - BMI - WC | 8 | |
| Hische, 2010 [27] | Germany | 1737 | 52.1 | Opportunity sampling in healthcare centres | PDM/DM | FPG/ 2-h PG | ≥6.1 mmol/L ≥7.8 mmol/L | Decision tree guided by ML | 2 | - Age - SBP | 9 | |
| Koopman, 2008 [29] | USA | 4045 | 20–64 | Population-based health survey data | PDM/DM | FPG | ≥5.6 mmol/L | Multivariate LR model | 6 | - Age - BMI - Sex - Family Hx of DM - Pulse - HTN | 10 | |
| Memish, 2015 [21] | Saudi Arabia | 1435 | ≥20 | Geographically stratified sampling in healthcare centres | PDM/DM | FPG/ 2-h PG | ≥5.6 mmol/L ≥7.8 mmol/L | Multivariate LR model | 4 | - Age - Hx of GDM - HTN - WC | 7 | |
| Rajput, 2019 [13] | India | 892 | 42.2 | Opportunity sampling in study locations | PDM | FPG/ 2-h PG | 5.6–6.9 mmol/L 7.8–11.0 mmol/L | Multivariate LR model | 4 | - Age - Family Hx of DM - Waist-to-height ratio - DBP | 8 | |
| Robinson, 2011 [30] | Canada | 4366 | 40–70 | Opportunity sampling in community clinics | PDM/DM | FPG/ 2-h PG | ≥6.1 mmol/L ≥7.8 mmol/L | Multivariate LR model | 12 | - Age - BMI - WC - Exercise - Fruit/Veg consumption. - HTN - Hx of HG - Family Hx of DM - Sex - Ethnicity - Macrosomia - Education level | 8 | |
| Sadek, 2022 [22] | Qatar | 1660 | 37 (median) | Population-based BioBank data | PDM/DM | HbA1c/ RPG | ≥5.7% ≥7.8 mmol/L | Multivariate LR model; 4 ML models using: (1) Random Forest, (2) Gradient Boosting Machine, (3) XgBoost, (4) Deep Learning | 7 | - Age - Sex - WHR - BMI - HTN - DLP - Education level | 8 | |
| Stiglic, 2018 [28] | Slovenia | 2073 | 54.9 | Population-wide electronic medical record dataset | PDM | FPG | 6.1–6.9 mmol/L | Multivariate LR model | 6 | - Age - Sex - WC - Hx of HG - Family Hx of DM - HTN | 9 | |
| Tan, 2016 [14] | Japan | 1054 | Not reported | Community-based health screening study | PDM | FPG/ 2-h PG | 6.1–6.9 mmol/L 7.8–11.0 mmol/L | Multivariate LR model | 5 | - Sex - WC - HTN - Hx of HG - Exercise | 9 | |
| Wang, 2015 [15] | South China | 6197 | 51.6 | Population-based health survey | PDM | FPG | 6.1–6.9 mmol/L | Multivariate LR model | 5; 4 | Men: - Age - WC - BMI - Family Hx of DM - HTN | Women: - Age - WC - BMI - Family Hx of DM | 10 |
| Xin, 2010 [16] | Rural China | LR: 1131 Tree: 893 | 52.4 | Population-based health survey | PDM/DM | FPG/ 2-h PG | ≥6.1 mmol/L ≥7.8 mmol/L | Multivariate LR model; Classification tree analysis | 6; 5 | LR: - Age - BMI - WHR - Family Hx of DM - HTN - HTN (2) § | Tree: - WHR - WC - HTN - Age - Family Hx of DM | 8 |
| Yu, 2010 [31] | USA | 3932 | ≥20 | Population-based health survey | PDM/DM | FPG | ≥5.6 mmol/L | Multivariate LR model; Support vector machine by ML | 10 | - Age - Sex - Family Hx of DM - Ethnicity - Weight - Height - WC - BMI - HTN - Exercise | 8 | |
| Yu, 2022 [17] | China | 40,381 | 44.0 | Population-based health survey | PDM | FPG/ 2-h PG | 6.1–6.9 mmol/L 7.8–11.0 mmol/L | Multivariate LR model | 6 | - Age - Education level - Family Hx of DM - WC - BMI - SBP | 9 | |
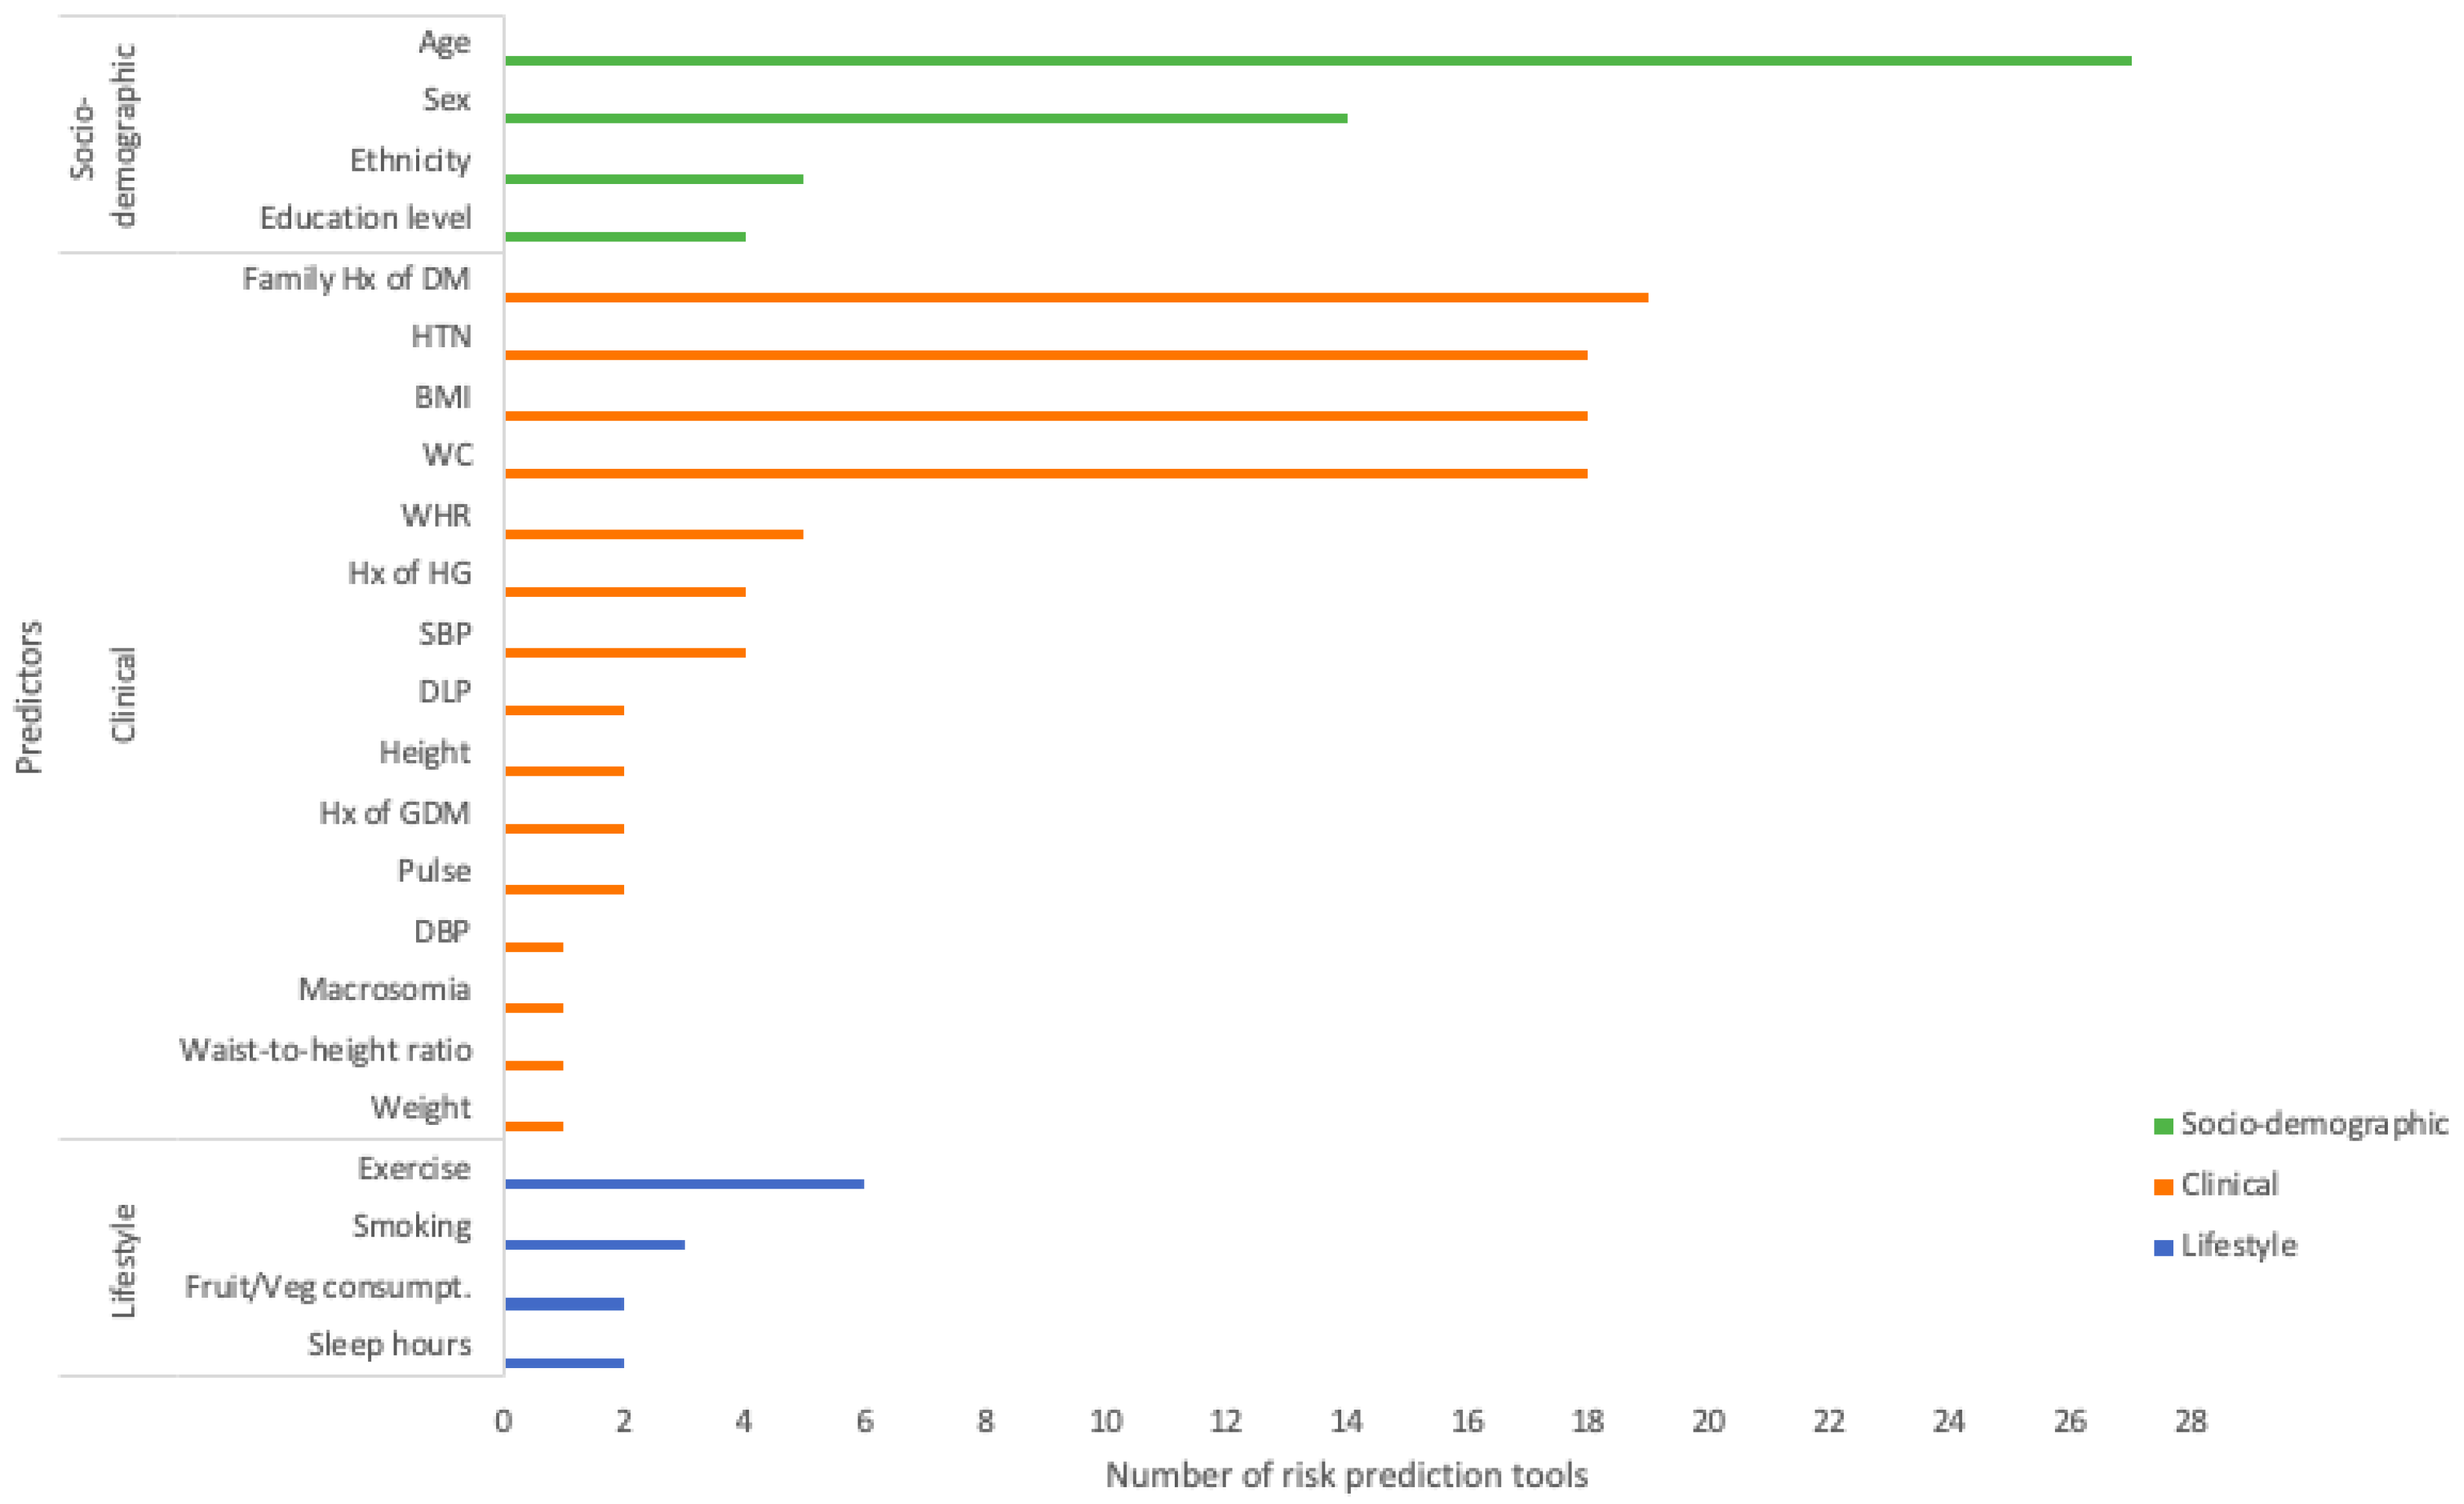
3.3. Predictors for Risk Prediction Tools
3.4. Methods for Tool Development
3.5. Performance of Risk Prediction Tools
4. Discussion
5. Conclusions
Supplementary Materials
Author Contributions
Funding
Institutional Review Board Statement
Informed Consent Statement
Data Availability Statement
Conflicts of Interest
References
- Sun, H.; Saeedi, P.; Karuranga, S.; Pinkepank, M.; Ogurtsova, K.; Duncan, B.B.; Stein, C.; Basit, A.; Chan, J.C.; Mbanya, J.C. IDF Diabetes Atlas: Global, regional and country-level diabetes prevalence estimates for 2021 and projections for 2045. Diabetes Res. Clin. Pract. 2022, 183, 109119. [Google Scholar] [CrossRef] [PubMed]
- Prediabetes—Your Chance to Prevent Type 2 Diabetes. Available online: https://www.cdc.gov/diabetes/basics/prediabetes.html (accessed on 13 August 2022).
- Diabetes Prevention Program Research Group. The Diabetes Prevention Program (DPP) description of lifestyle intervention. Diabetes Care 2002, 25, 2165–2171. [Google Scholar] [CrossRef] [PubMed] [Green Version]
- Barber, S.R.; Davies, M.J.; Khunti, K.; Gray, L.J. Risk assessment tools for detecting those with pre-diabetes: A systematic review. Diabetes Res. Clin. Pract. 2014, 105, 1–13. [Google Scholar] [CrossRef] [PubMed]
- Baliunas, D.O.; Taylor, B.J.; Irving, H.; Roerecke, M.; Patra, J.; Mohapatra, S.; Rehm, J. Alcohol as a Risk Factor for Type 2 Diabetes: A systematic review and meta-analysis. Diabetes Care 2009, 32, 2123–2132. [Google Scholar] [CrossRef] [PubMed] [Green Version]
- Cappuccio, F.P.; D’Elia, L.; Strazzullo, P.; Miller, M.A. Quantity and Quality of Sleep and Incidence of Type 2 Diabetes: A systematic review and meta-analysis. Diabetes Care 2010, 33, 414–420. [Google Scholar] [CrossRef] [Green Version]
- Dong, W.; Tse, T.Y.E.; Mak, L.I.; Wong, C.K.H.; Wan, Y.F.E.; Tang, H.M.E.; Chin, W.Y.; Bedford, L.E.; Yu, Y.T.E.; Ko, W.K.W.; et al. Non-laboratory-based risk assessment model for case detection of diabetes mellitus and pre-diabetes in primary care. J. Diabetes Investig. 2022, 13, 1374–1386. [Google Scholar] [CrossRef]
- CASP Clinical Prediction Rule Checklist. Available online: https://casp-uk.b-cdn.net/wp-content/uploads/2018/03/CASP-Clinical-Prediction-Rule-Checklist_2018_fillable_form.pdf (accessed on 13 August 2022).
- Page, M.J.; McKenzie, J.E.; Bossuyt, P.M.; Boutron, I.; Hoffmann, T.C.; Mulrow, C.D.; Shamseer, L.; Tetzlaff, J.M.; Akl, E.A.; Brennan, S.E. The PRISMA 2020 statement: An updated guideline for reporting systematic reviews. Syst. Rev. 2021, 10, 105906. [Google Scholar] [CrossRef] [PubMed]
- Fu, Q.; Sun, M.; Tang, W.; Wang, Z.; Cao, M.; Zhu, Z.; Lu, L.; Bi, Y.; Ning, G.; Yang, T. A Chinese risk score model for identifying postprandial hyperglycemia without oral glucose tolerance test. Diabetes/Metab. Res. Rev. 2014, 30, 284–290. [Google Scholar] [CrossRef]
- Fujiati, I.I.; Damanik, H.A.; Bachtiar, A.; Nurdin, A.A.; Ward, P. Development and validation of prediabetes risk score for predicting prediabetes among Indonesian adults in primary care: Cross-sectional diagnostic study. Interv. Med. Appl. Sci. 2017, 9, 76–85. [Google Scholar] [CrossRef]
- Gao, W.G.; Dong, Y.H.; Pang, Z.C.; Nan, H.R.; Wang, S.J.; Ren, J.; Zhang, L.; Tuomilehto, J.; Qiao, Q. A simple Chinese risk score for undiagnosed diabetes. Diabet. Med. 2010, 27, 274–281. [Google Scholar] [CrossRef]
- Rajput, R.; Garg, K.; Rajput, M. Prediabetes Risk Evaluation Scoring System [PRESS]: A simplified scoring system for detecting undiagnosed Prediabetes. Prim. Care Diabetes 2019, 13, 11–15. [Google Scholar] [CrossRef]
- Tan, C.; Sasagawa, Y.; Kamo, K.I.; Kukitsu, T.; Noda, S.; Ishikawa, K.; Yamauchi, N.; Saikawa, T.; Noro, T.; Nakamura, H.; et al. Evaluation of the Japanese Metabolic Syndrome Risk Score (JAMRISC): A newly developed questionnaire used as a screening tool for diagnosing metabolic syndrome and insulin resistance in Japan. Environ. Health Prev. Med. 2016, 21, 470–479. [Google Scholar] [CrossRef] [Green Version]
- Wang, H.; Liu, T.; Qiu, Q.; Ding, P.; He, Y.H.; Chen, W.Q. A simple risk score for identifying individuals with impaired fasting glucose in the Southern Chinese population. Int. J. Environ. Res. Public Health [Electron. Resour.] 2015, 12, 1237–1252. [Google Scholar] [CrossRef] [Green Version]
- Xin, Z.; Yuan, J.; Hua, L.; Ma, Y.H.; Zhao, L.; Lu, Y.; Yang, J.K. A simple tool detected diabetes and prediabetes in rural Chinese. J. Clin. Epidemiol. 2010, 63, 1030–1035. [Google Scholar] [CrossRef] [PubMed]
- Yu, L.P.; Dong, F.; Li, Y.Z.; Yang, W.Y.; Wu, S.N.; Shan, Z.Y.; Teng, W.P.; Zhang, B. Development and validation of a risk assessment model for prediabetes in China national diabetes survey. World J. Clin. Cases 2022, 10, 11789–11803. [Google Scholar] [CrossRef]
- Abbas, M.; Mall, R.; Errafii, K.; Lattab, A.; Ullah, E.; Bensmail, H.; Arredouani, A. Simple risk score to screen for prediabetes: A cross-sectional study from the Qatar Biobank cohort. J. Diabetes Investig. 2021, 12, 988–997. [Google Scholar] [CrossRef]
- Bahijri, S.; Al-Raddadi, R.; Ajabnoor, G.; Jambi, H.; Al Ahmadi, J.; Borai, A.; Barengo, N.C.; Tuomilehto, J. Dysglycemia risk score in Saudi Arabia: A tool to identify people at high future risk of developing type 2 diabetes. J. Diabetes Investig. 2020, 11, 844–855. [Google Scholar] [CrossRef] [Green Version]
- Handlos, L.N.; Witte, D.R.; Almdal, T.P.; Nielsen, L.B.; Badawi, S.E.; Sheikh, A.R.A.; Belhadj, M.; Nadir, D.; Zinai, S.; Vistisen, D. Risk scores for diabetes and impaired glycaemia in the Middle East and North Africa. Diabet. Med. 2013, 30, 443–451. [Google Scholar] [CrossRef] [PubMed]
- Memish, Z.A.; Chang, J.L.; Saeedi, M.Y.; Al Hamid, M.A.; Abid, O.; Ali, M.K. Screening for Type 2 Diabetes and Dysglycemia in Saudi Arabia: Development and Validation of Risk Scores. Diabetes Technol. Ther. 2015, 17, 693–700. [Google Scholar] [CrossRef] [PubMed]
- Sadek, K.; Abdelhafez, I.; Al-Hashimi, I.; Al-Shafi, W.; Tarmizi, F.; Al-Marri, H.; Alzohari, N.; Balideh, M.; Carr, A. Screening for diabetes and impaired glucose metabolism in Qatar: Models’ development and validation. Prim. Care Diabetes 2022, 16, 69–77. [Google Scholar] [CrossRef] [PubMed]
- Henjum, S.; Hjellset, V.T.; Andersen, E.; Flaaten, M.; Morseth, M.S. Developing a risk score for undiagnosed prediabetes or type 2 diabetes among Saharawi refugees in Algeria. BMC Public Health 2022, 22, 720. [Google Scholar] [CrossRef] [PubMed]
- Gray, L.J.; Barros, H.; Raposo, L.; Khunti, K.; Davies, M.J.; Santos, A.C. The development and validation of the Portuguese risk score for detecting type 2 diabetes and impaired fasting glucose. Prim. Care Diabetes 2013, 7, 11–18. [Google Scholar] [CrossRef] [Green Version]
- Gray, L.J.; Davies, M.J.; Hiles, S.; Taub, N.A.; Webb, D.R.; Srinivasan, B.T.; Khunti, K. Detection of impaired glucose regulation and/or type 2 diabetes mellitus, using primary care electronic data, in a multiethnic UK community setting. Diabetologia 2012, 55, 959–966. [Google Scholar] [CrossRef] [Green Version]
- Gray, L.J.; Taub, N.A.; Khunti, K.; Gardiner, E.; Hiles, S.; Webb, D.R.; Srinivasan, B.T.; Davies, M.J. The Leicester Risk Assessment score for detecting undiagnosed Type 2 diabetes and impaired glucose regulation for use in a multiethnic UK setting. Diabet. Med. 2010, 27, 887–895. [Google Scholar] [CrossRef]
- Hische, M.; Luis-Dominguez, O.; Pfeiffer, A.F.; Schwarz, P.E.; Selbig, J.; Spranger, J. Decision trees as a simple-to-use and reliable tool to identify individuals with impaired glucose metabolism or type 2 diabetes mellitus. Eur. J. Endocrinol. 2010, 163, 565–571. [Google Scholar] [CrossRef] [PubMed] [Green Version]
- Stiglic, G.; Kocbek, P.; Cilar, L.; Fijacko, N.; Stozer, A.; Zaletel, J.; Sheikh, A.; Povalej Brzan, P. Development of a screening tool using electronic health records for undiagnosed Type 2 diabetes mellitus and impaired fasting glucose detection in the Slovenian population. Diabet. Med. 2018, 35, 640–649. [Google Scholar] [CrossRef] [Green Version]
- Koopman, R.J.; Mainous, A.G., 3rd; Everett, C.J.; Carter, R.E.; Koopman, R.J.; Mainous, A.G., 3rd; Everett, C.J.; Carter, R.E. Tool to assess likelihood of fasting glucose impairment (TAG-IT). Ann. Fam. Med. 2008, 6, 555–561. [Google Scholar] [CrossRef] [PubMed] [Green Version]
- Robinson, C.A.; Agarwal, G.; Nerenberg, K. Validating the CANRISK prognostic model for assessing diabetes risk in Canada’s multi-ethnic population. Chronic Dis. Inj. Can. 2011, 32, 19–31. [Google Scholar] [CrossRef]
- Yu, W.; Liu, T.; Valdez, R.; Gwinn, M.; Khoury, M.J. Application of support vector machine modeling for prediction of common diseases: The case of diabetes and pre-diabetes. BMC Med. Inform. Decis. Mak. 2010, 10, 16. [Google Scholar] [CrossRef] [Green Version]
- Barengo, N.C.; Tamayo, D.C.; Tono, T.; Tuomilehto, J. A Colombian diabetes risk score for detecting undiagnosed diabetes and impaired glucose regulation. Prim. Care Diabetes 2017, 11, 86–93. [Google Scholar] [CrossRef]
- Hosmer, D.W., Jr.; Lemeshow, S.; Sturdivant, R.X. Applied Logistic Regression; John Wiley & Sons: Hoboken, NJ, USA, 2013. [Google Scholar]
- Vickers, A.J.; Elkin, E.B. Decision curve analysis: A novel method for evaluating prediction models. Med. Decis. Mak. 2006, 26, 565–574. [Google Scholar] [CrossRef] [Green Version]
- Kengne, A.P.; Beulens, J.W.J.; Peelen, L.M. Non-invasive risk scores for prediction of type 2 diabetes (EPIC-InterAct): A validation of existing models. Lancet Diabetes Endocrinol. 2014, 2, E11. [Google Scholar] [CrossRef] [Green Version]
- Wagner, R.; Thorand, B.; Osterhoff, M.A.; Müller, G.; Böhm, A.; Meisinger, C.; Kowall, B.; Rathmann, W.; Kronenberg, F.; Staiger, H.; et al. Family history of diabetes is associated with higher risk for prediabetes: A multicentre analysis from the German Center for Diabetes Research. Diabetologia 2013, 56, 2176–2180. [Google Scholar] [CrossRef] [PubMed] [Green Version]
- Harris, M.I.; Hadden, W.C.; Knowler, W.C.; Bennett, P.H. Prevalence of diabetes and impaired glucose tolerance and plasma glucose levels in U.S. population aged 20–74 Yr. Diabetes 1987, 36, 523–534. [Google Scholar] [CrossRef] [PubMed]
- Yaggi, H.K.; Araujo, A.B.; McKinlay, J.B. Sleep duration as a risk factor for the development of type 2 diabetes. Diabetes Care 2006, 29, 657–661. [Google Scholar] [CrossRef] [Green Version]
- Musa, A.B. Comparative study on classification performance between support vector machine and logistic regression. Int. J. Mach. Learn. Cyber. 2012, 4, 13–24. [Google Scholar] [CrossRef]
- Hotzy, F.; Theodoridou, A.; Hoff, P.; Schneeberger, A.R.; Seifritz, E.; Olbrich, S.; Jäger, M. Machine Learning: An Approach in Identifying Risk Factors for Coercion Compared to Binary Logistic Regression. Front. Psychiatry 2018, 9, 258. [Google Scholar] [CrossRef] [Green Version]
- Rudin C: Stop explaining black box machine learning models for high stakes decisions and use interpretable models instead. Nat. Mach. Intell. 2019, 1, 206–215. [CrossRef] [PubMed] [Green Version]
- Collins, G.S.; de Groot, J.A.; Dutton, S.; Omar, O.; Shanyinde, M.; Tajar, A.; Voysey, M.; Wharton, R.; Yu, L.-M.; Moons, K.G.; et al. External validation of multivariable prediction models: A systematic review of methodological conduct and reporting. BMC Med. Res. Methodol. 2014, 14, 40. [Google Scholar] [CrossRef] [Green Version]
- Piller, C. Dubious diagnosis. Science 2019, 363, 1026–1031. [Google Scholar] [PubMed] [Green Version]
- World Health Organization. Classification of Diabetes Mellitus; World Health Organization: Geneva, Switzerland, 2019. [Google Scholar]
- American Diabetes Association. 2. Classification and diagnosis of diabetes: Standards of medical care in diabetes—2019. Diabetes Care 2019, 42, S13–S28. [Google Scholar] [CrossRef] [PubMed] [Green Version]
- Van Calster, B.; McLernon, D.J.; van Smeden, M.; Wynants, L.; Steyerberg, E.W.; Bossuyt, P.; Collins, G.S.; MacAskill, P.; Moons, K.G.M.; Vickers, A.J. Calibration: The Achilles heel of predictive analytics. BMC Med. 2019, 17, 230. [Google Scholar] [CrossRef] [PubMed] [Green Version]


| Author, Year | Types of Validation (“I”/“E”) | Source of Validation Sample | Sample Size | Discriminative Performance (AUROC (95% CI)) | Predictive Power (Sen. (95% CI), Spe. (95% CI), PPV (95% CI), NPV (95% CI)) | ||
|---|---|---|---|---|---|---|---|
| Abbas, 2021 (LR Model) [18] | I | Same dataset as development data (20/80 split) | 1454 | 0.80 (0.78, 0.83) | 0.86 (0.83, 0.89), 0.58 (0.55, 0.61), 0.50 (0.46, 0.53), 0.90 (0.87, 0.92) | ||
| Bahijri, 2020 [19] | NA | No validation performed; performance data is from model development | - | 0.76 (0.73, 0.79) | 0.69, 0.69, 0.40, 0.88 | ||
| Barengo, 2017 (IGR model) [32] | NA | No validation performed; performance data is from model development | - | 0.72 (0.69, 0.74) | 0.57, 0.73, 0.58, 0.76 | ||
| Dong, 2022 [7] | I | Same dataset as development data (33/66 split) | 619 | LR: 0.81 (0.77, 0.85) ML: 0.82 (0.78, 0.86) | LR: 0.89, 0.62 0.31, 0.97 | ML: 0.79, 0.74 0.36, 0.95 | |
| Fu, 2014 (Non-invasive model) [10] | E | External community-based health survey dataset | 1455 | 0.65 | None reported for the non-invasive model | ||
| Fujiati, 2017 [11] | E | External population-based health survey dataset | 6933 | 0.65 (0.62, 0.67) | 0.55 (0.51, 0.59), 0.66 (0.65, 0.67), 0.12 (0.11, 0.13), 0.94 (0.94, 0.95) | ||
| Gao, 2010 (PDM as the model outcome) [12] | E | External population-based health survey dataset | 4336 | Men: 0.61 (0.58, 0.65) Women: 0.63 (0.61, 0.66) | Men: 0.86 (0.84, 0.87), 0.21 (0.19, 0.23), No PPV and NPV | Women: 0.76 (0.74, 0.77), 0.44 (0.42, 0.46), No PPV and NPV | |
| Gray, 2010 [26] | E | External population-based screening study dataset | 3171 | 0.72 (0.69, 0.74) | 0.81 (0.78, 0.84), 0.45 (0.43, 0.47), 0.29 (0.27, 0.31), 0.90 (0.88, 0.91) | ||
| Gray, 2012 (Validated by 2 definitions of outcome) [25] | E | External population-based screening study dataset | 3004 | OGTT † as outcome: 0.69 HbA1c ‡ as outcome: 0.67 | OGTT as outcome: 0.75 (0.71, 0.78), 0.52 (0.50, 0.54), 0.29 (0.26, 0.31), 0.89 (0.87, 0.91) | HbA1c as outcome: 0.75 (0.72, 0.78), 0.50 (0.48, 0.52), 0.37 (0.35, 0.40), 0.83 (0.81, 0.85) | |
| Gray, 2013 [24] | E | (1) External sampling by city-wide random digit dialling (2) External prospective 1-year follow-up data on the city-wide cohort | 2131 1304 | (1) 0.69 (2) 0.72 | (1): 0.73 (0.69, 0.78), 0.56 (0.53, 0.58), 0.27 (0.24, 0.30), 0.90 (0.88, 0.92) | (2): 0.69 (0.63, 0.74), 0.63 (0.60, 0.67), 0.38 (0.34, 0.42), 0.86 (0.83, 0.89) | |
| Handlos, 2013 [20] | I | Same dataset as development data (split into 3 datasets based on original country) | (1) 2155; (2) 2446; (3) 1987 | (1) 0.70 (0.67,0.72) (2) 0.70 (0.67,0.72) (3) 0.70 (0.67,0.73) | (1): 0.76 (0.72, 0.80), 0.50 (0.48, 0.52) | (2): 0.74 (0.70, 0.79), 0.54 (0.52, 0.57) | (3): 0.76 (0.72, 0.80), 0.52 (0.49, 0.54) |
| No PPV and NPV | No PPV and NPV | No PPV and NPV | |||||
| Henjum, 2022 [23] | I | Same dataset as development data | 308 | 0.81 | 0.89, 0.65, 0.28, 0.97 | ||
| Hische, 2010 [27] | E | External opportunity sampling in healthcare centres in another city | 1998 | None reported | 0.90, 0.32, 0.44, 0.85 | ||
| Koopman, 2008 [29] | E | External population-based health survey data | None reported | 0.74 | None reported for the external validation | ||
| Memish, 2015 (Dysglycemia model) [21] | I | Same dataset as development data | 50 | 0.68 (0.54, 0.82) | 0.76 (0.55, 0.90), 0.68 (0.47, 0.84) No PPV and NPV | ||
| Rajput, 2019 [13] | NA | No validation performed; performance data is from model development | - | 0.79 | 0.84 (0.78, 0.90), 0.58 (0.55, 0.62) 0.31 (0.27, 0.34), 0.94 (0.92, 0.96) | ||
| Robinson, 2011 [30] | I | Same dataset as development data (30/70 split) | 1857 | 0.75 (0.73, 0.78) | 0.70, 0.67, 0.35, 0.90 | ||
| Sadek, 2022 (IGM model) [22] | E | External population-based BioBank dataset | 930 | LR: 0.77 (0.74, 0.81) ML (1): 0.79 ML (2): 0.78 ML (3): 0.77 ML (4): 0.78 | LR: 0.78, 0.69 0.45, 0.91 (from Supplementary Materials) | ML (1–4): None reported | |
| Stiglic, 2018 (IFG model) [28] | NA | No validation performed; performance data is from model development | - | 0.84 (0.81, 0.87) | 0.73 (0.68, 0.79), 0.81 (0.74, 0.86), 0.60 (0.53, 0.67), 0.89 (0.87, 0.91) (from Supplementary Materials) | ||
| Tan, 2016 (PDM model) [14] | E | External opportunity sampling of individuals in the same region | 83 | None reported | 0.92, 0.66 No PPV and NPV | ||
| Wang, 2015 [15] | E | 3 External population-based health survey datasets from different regions of China | (1) 1186; (2) 3162; (3) 1289 | (1) Men: 0.75 (0.67, 0.83) Women: 0.77 (0.71, 0.83) (2) Men: 0.74 (0.61, 0.86) Women: 0.72 (0.65, 0.78) (3) Men: 0.31 (0.20, 0.43) Women: 0.50 (0.38, 0.61) | (1) Men: 0.73, 0.64, 0.13, 0.97 Women: 0.81, 0.60, 0.19, 0.96 | (2) Men: 0.79, 0.51, 0.06, 0.99 Women: 0.89, 0.42, 0.05, 0.99 | (3) Men: 0.31, 0.49, 0.02, 0.96 Women: 0.42, 0.59, 0.04, 0.96 |
| Xin, 2010 (PDM and T2DM model) [16] | I | Same dataset as development data (50/50 split) | 1130 | LR: 0.72 Tree: 0.69 | LR: None reported | Tree: 0.65, 0.73, 0.33, 0.91 | |
| Yu, 2010 (Classification scheme II) [31] | I | Same dataset as development data (20/80 split) | 983 | LR: 0.73 SVM: 0.73 | LR: None reported | SVM: 0.74, 0.63, 0.51, 0.82 | |
| Yu, 2022 [17] | E | 2 External population-based health survey datasets | (1) 1525; (2) 66,108 | (1) 0.71 (0.63, 0.79) (2) 0.73 (0.73, 0.74) | None reported for the external validation | ||
Disclaimer/Publisher’s Note: The statements, opinions and data contained in all publications are solely those of the individual author(s) and contributor(s) and not of MDPI and/or the editor(s). MDPI and/or the editor(s) disclaim responsibility for any injury to people or property resulting from any ideas, methods, instructions or products referred to in the content. |
© 2023 by the authors. Licensee MDPI, Basel, Switzerland. This article is an open access article distributed under the terms and conditions of the Creative Commons Attribution (CC BY) license (https://creativecommons.org/licenses/by/4.0/).
Share and Cite
Cheng, W.H.-G.; Mi, Y.; Dong, W.; Tse, E.T.-Y.; Wong, C.K.-H.; Bedford, L.E.; Lam, C.L.-K. Non-Laboratory-Based Risk Prediction Tools for Undiagnosed Pre-Diabetes: A Systematic Review. Diagnostics 2023, 13, 1294. https://doi.org/10.3390/diagnostics13071294
Cheng WH-G, Mi Y, Dong W, Tse ET-Y, Wong CK-H, Bedford LE, Lam CL-K. Non-Laboratory-Based Risk Prediction Tools for Undiagnosed Pre-Diabetes: A Systematic Review. Diagnostics. 2023; 13(7):1294. https://doi.org/10.3390/diagnostics13071294
Chicago/Turabian StyleCheng, Will Ho-Gi, Yuqi Mi, Weinan Dong, Emily Tsui-Yee Tse, Carlos King-Ho Wong, Laura Elizabeth Bedford, and Cindy Lo-Kuen Lam. 2023. "Non-Laboratory-Based Risk Prediction Tools for Undiagnosed Pre-Diabetes: A Systematic Review" Diagnostics 13, no. 7: 1294. https://doi.org/10.3390/diagnostics13071294