
Accurate Detection of Alzheimer’s Disease Using Lightweight Deep Learning Model on MRI Data
 , ,
, ,
Abstract
:1. Introduction
- Early or Preclinical stage: During this stage, the individual may have no symptoms or only mild memory problems.
- Mild Cognitive Impairment (MCI): In this stage, the individual may experience more noticeable memory problems but still has the ability to perform daily activities independently.
- Mild Dementia: During this stage, the individual may have trouble remembering recent events, completing familiar tasks, and communicating effectively. They may also experience confusion, disorientation, and mood swings.
- Moderate Dementia: In this stage, the individual may require assistance with daily activities and have difficulty recognizing friends and family members. They may also experience more severe memory loss, confusion, and changes in personality and behavior.
- Severe Dementia: During this stage, the individual is typically completely dependent on others for their care and may lose the ability to communicate and recognize loved ones.
- We propose a novel lightweight deep learning model using MRI images for the accurate detection of AD. The proposed model can be employed in real-time applications with high detection performance, unlike other previous models that needed deeper layers to obtain high detection accuracies.
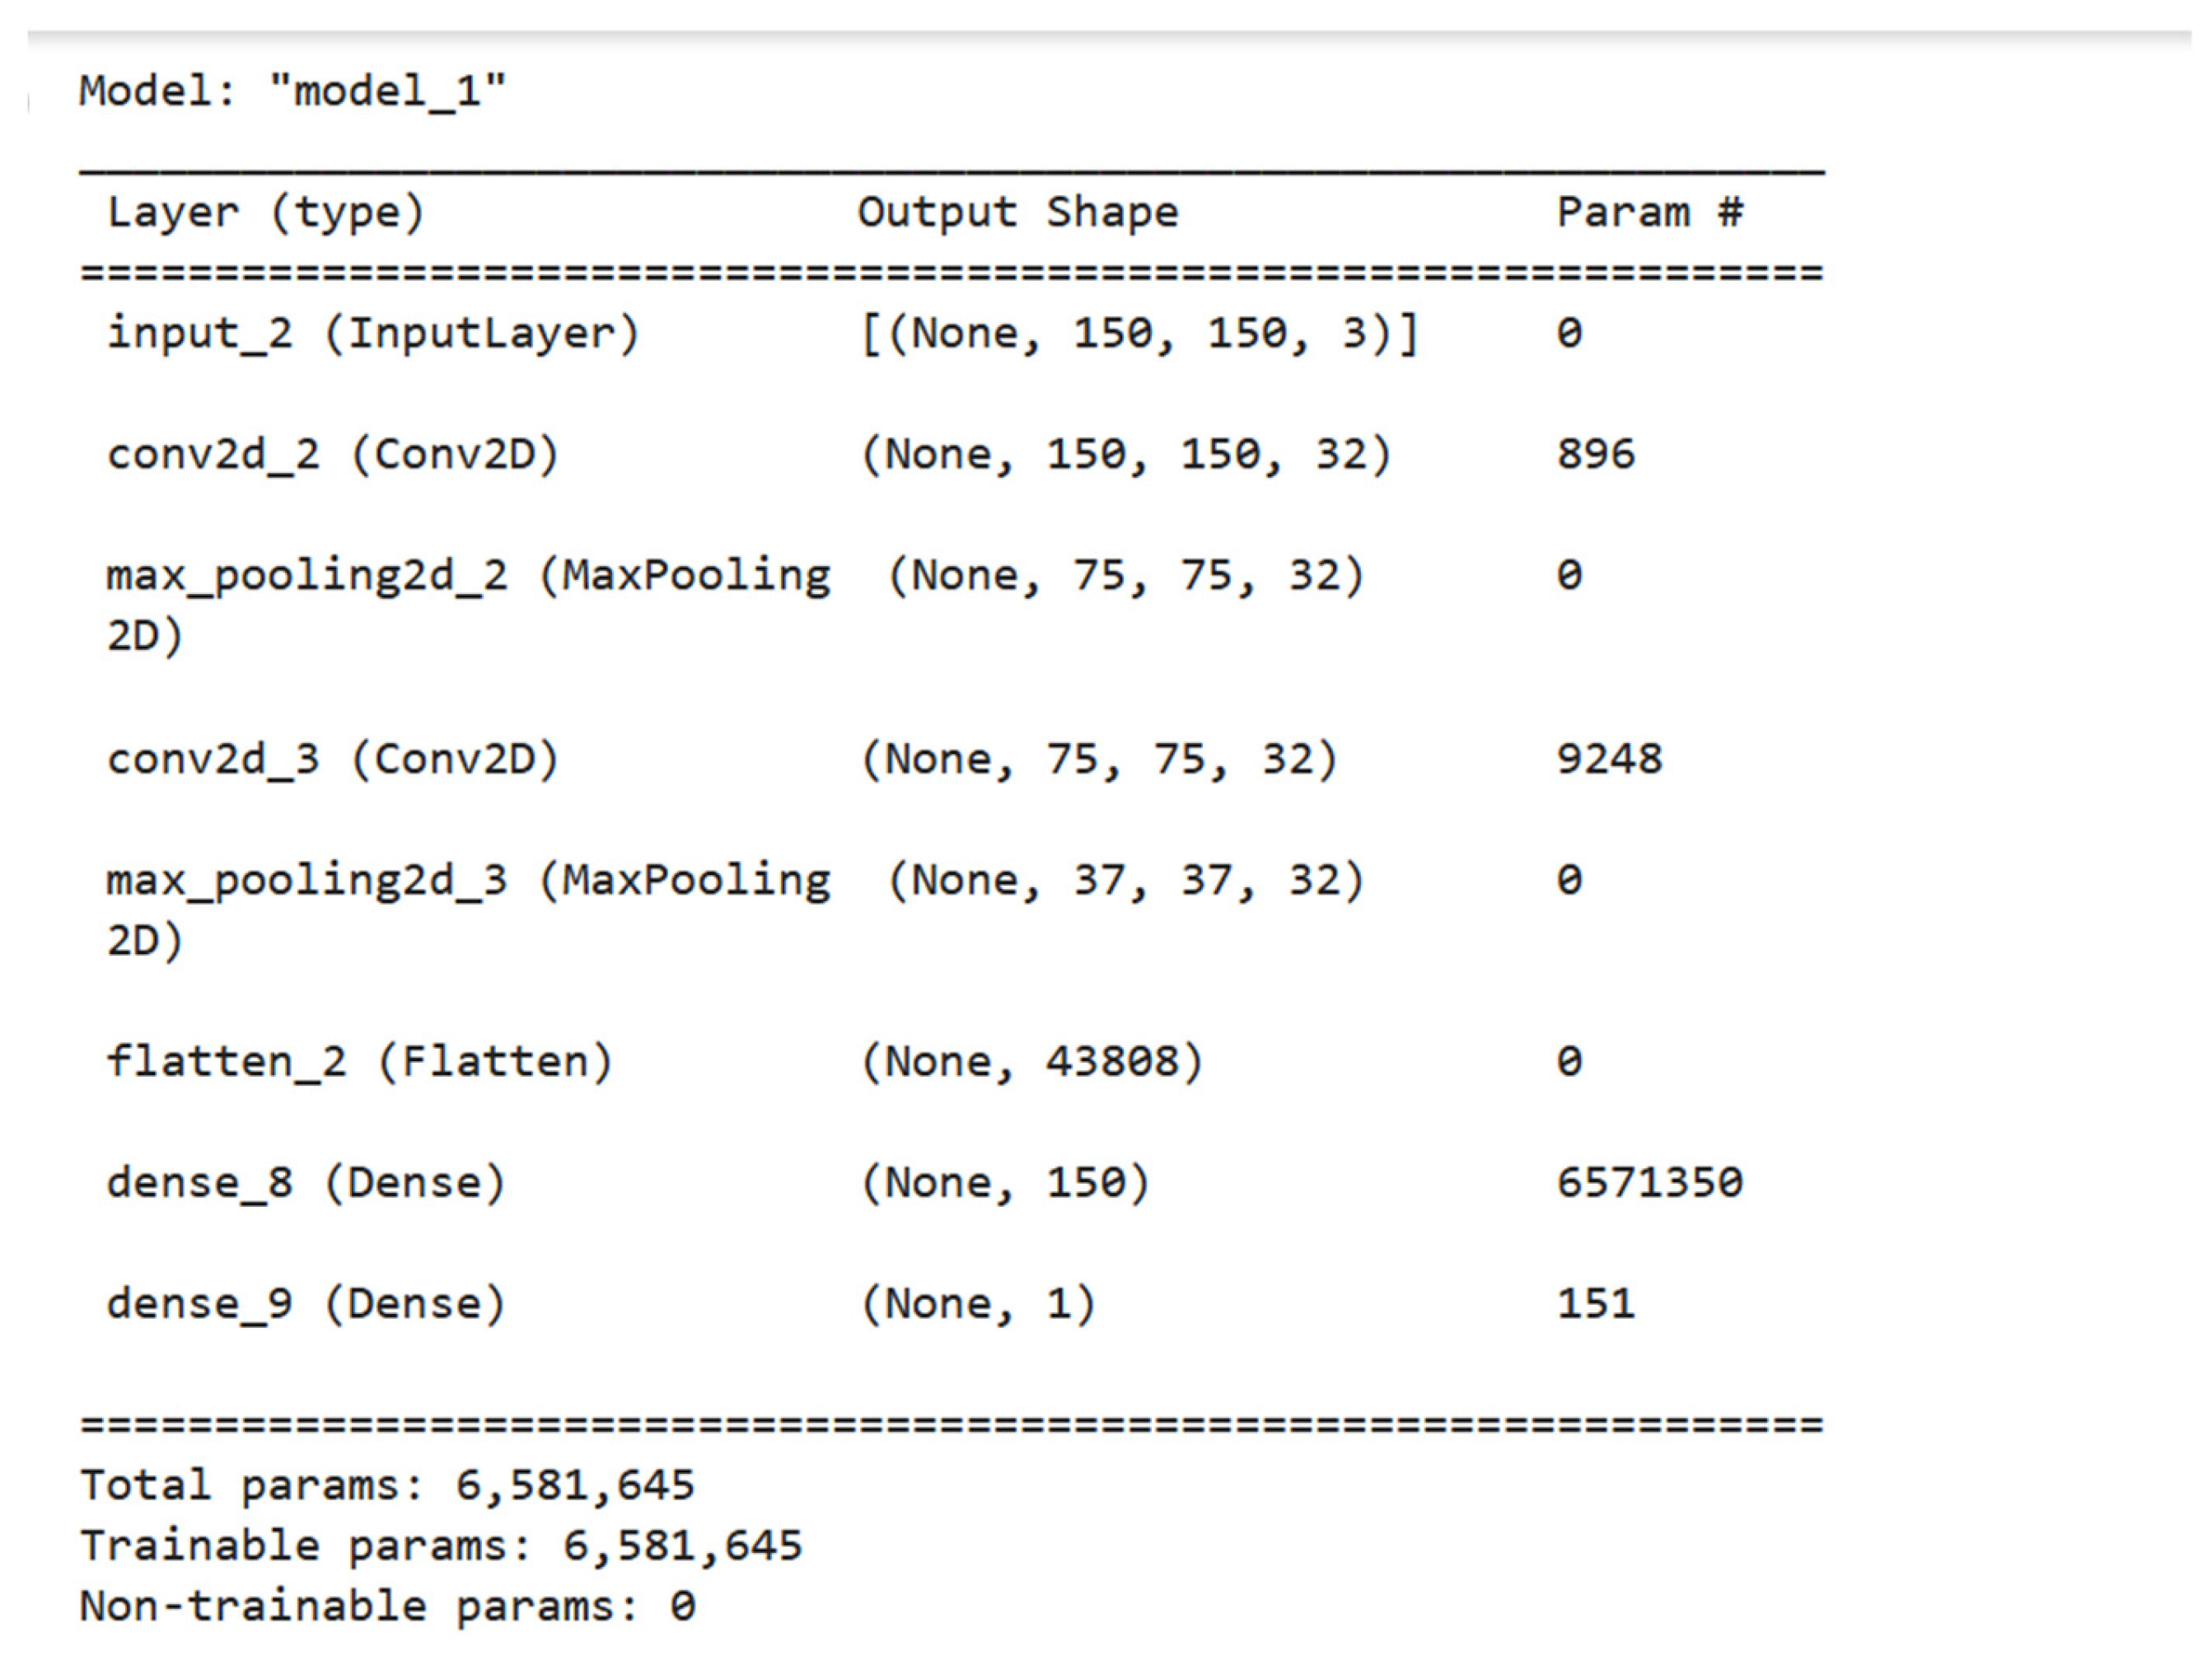
- The proposed model is an end-to-end model that eliminates the use of traditional methods such as feature extraction and classification and combines them all into one stage. In addition, the proposed method consists only of seven layers, which makes the system less complex than other previous deep models and less time-consuming to process.
- We introduce a model that works on binary classification and multi-classification tasks with higher performance than other previous models. Consequently, the proposed model is more robust than earlier deep learning techniques.
- This is the first study that reviews and combines all methods used in such datasets from Kaggle. This paper combines all previous methods that work on the same publicly available Kaggle dataset [29], allowing researchers to work on a dataset with new challenges. Unlike other previous methods that used other unpublished large-size datasets, which are approximately 1.5 Gigabytes with a small number of records, we employed a small-size dataset (only 36 Megabytes) with a large number of records.
2. Related Work
3. Dataset and Methodology
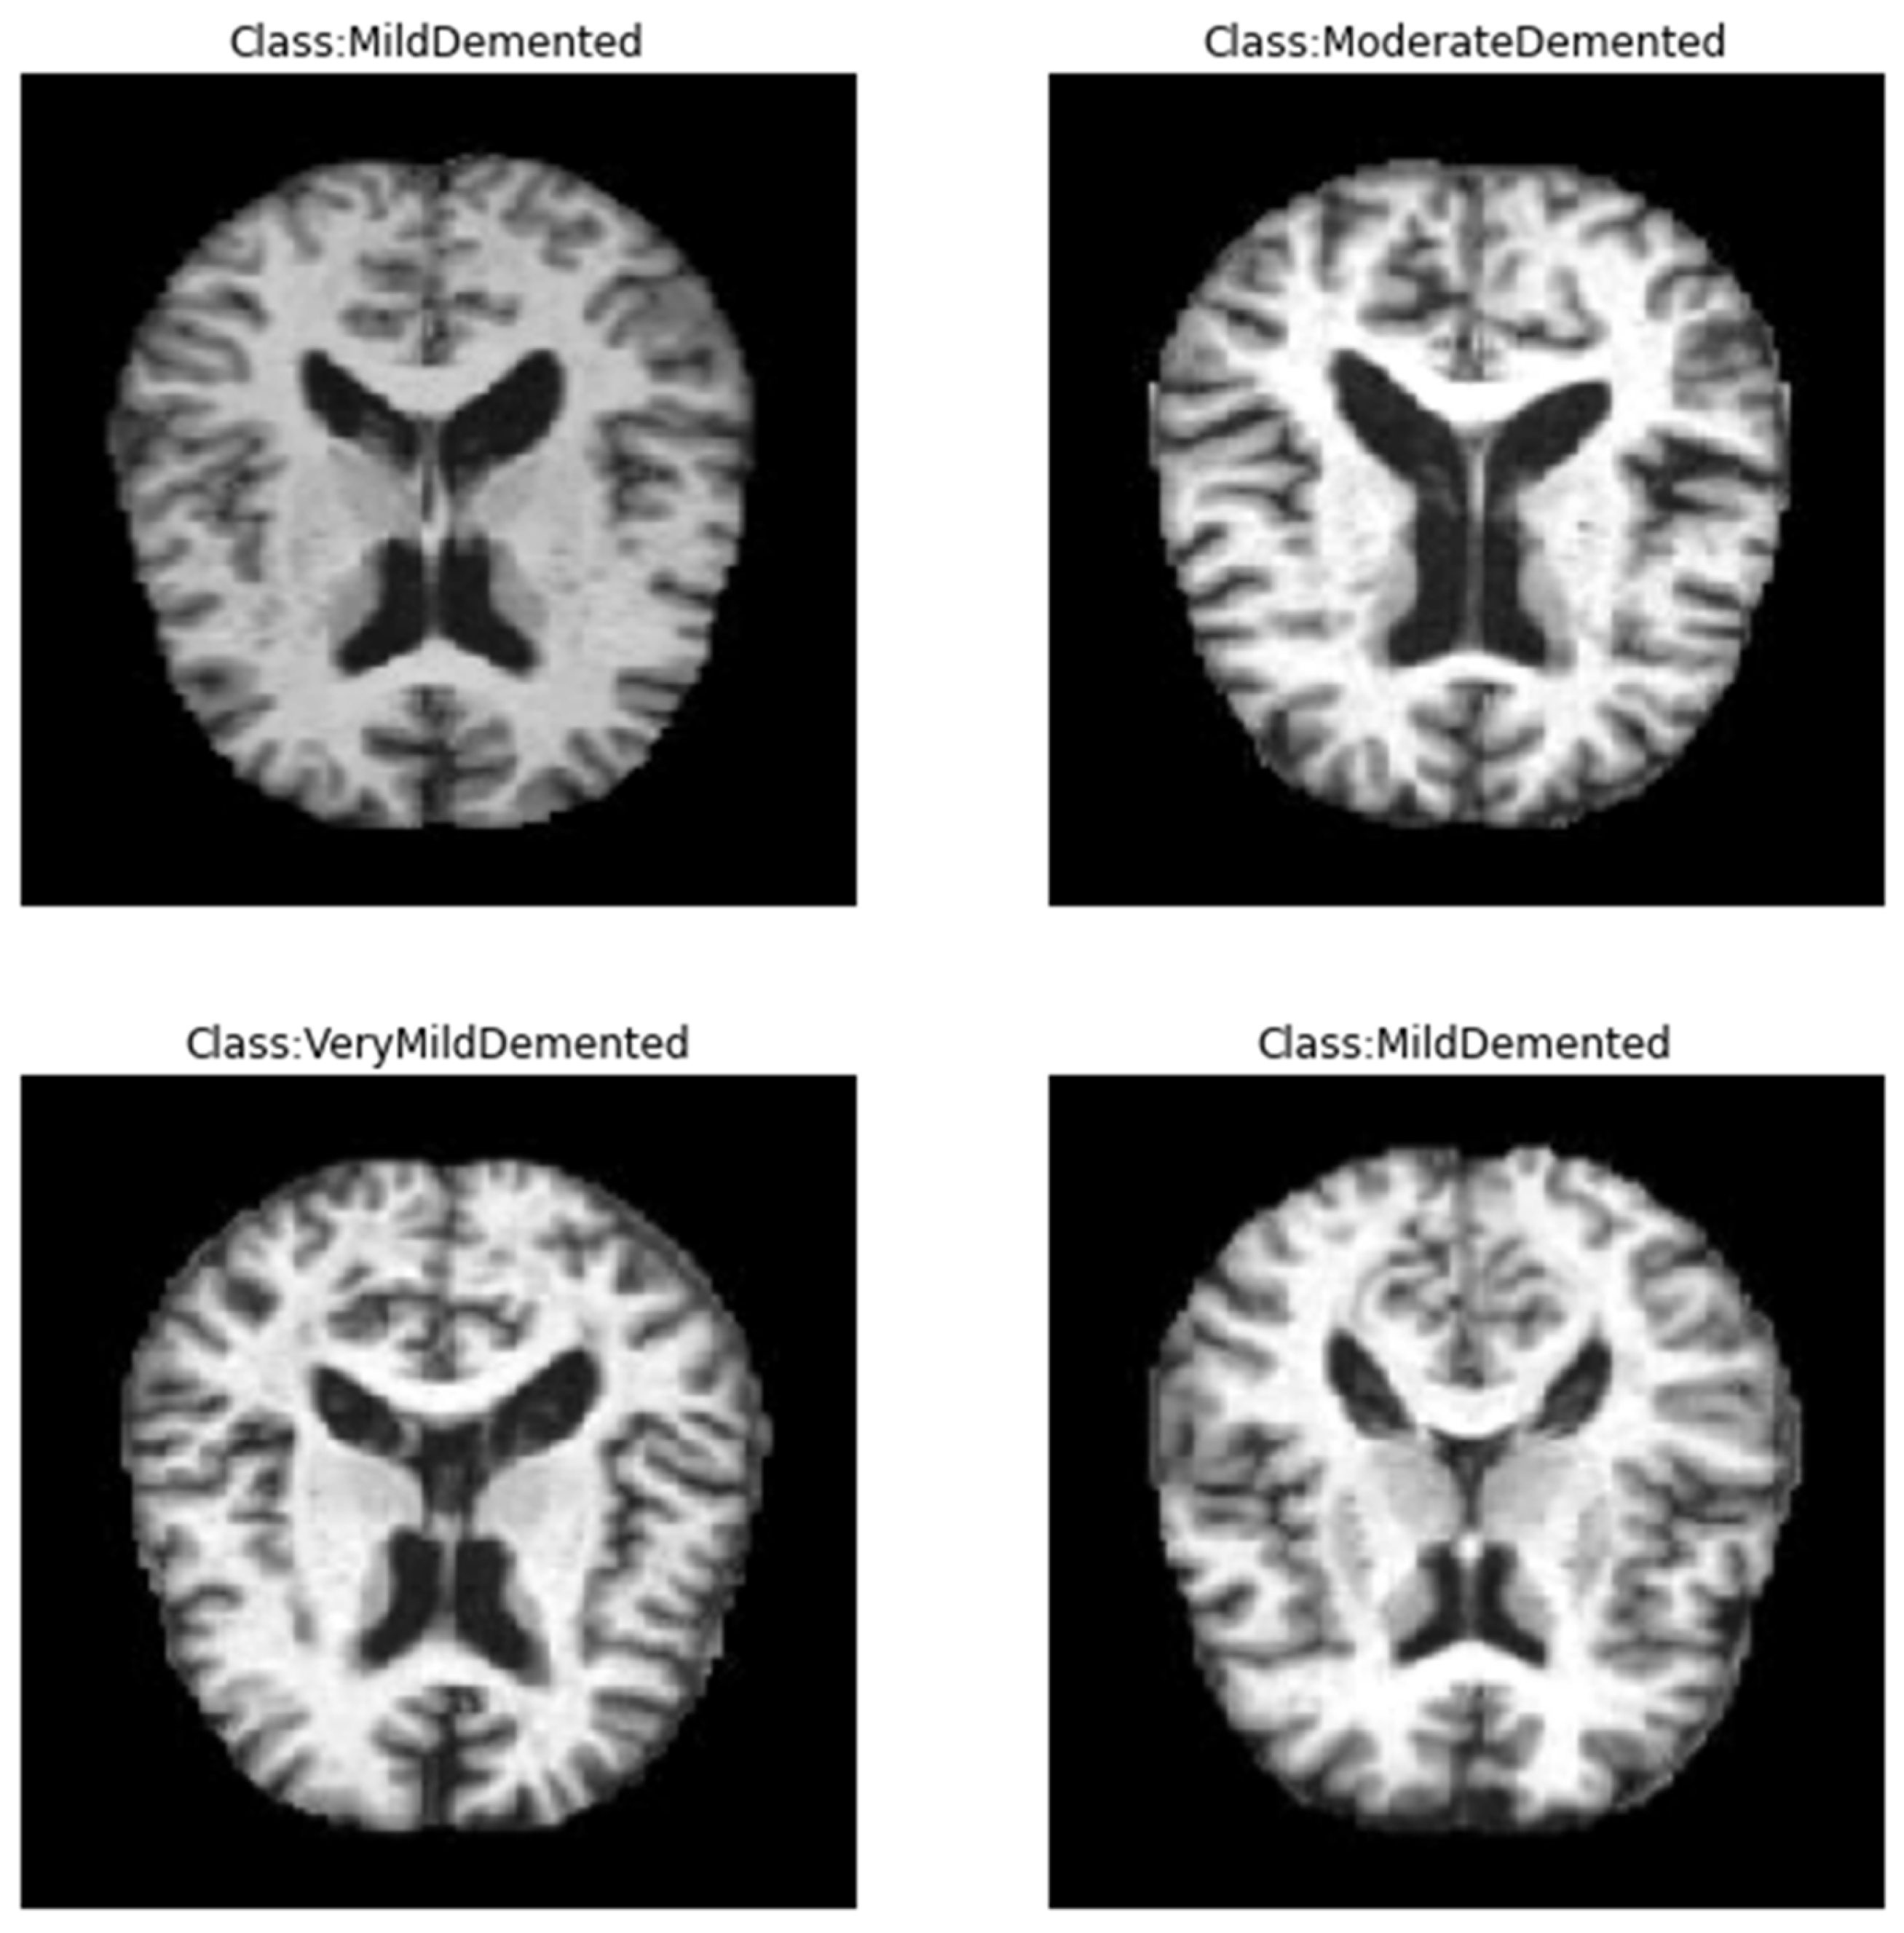
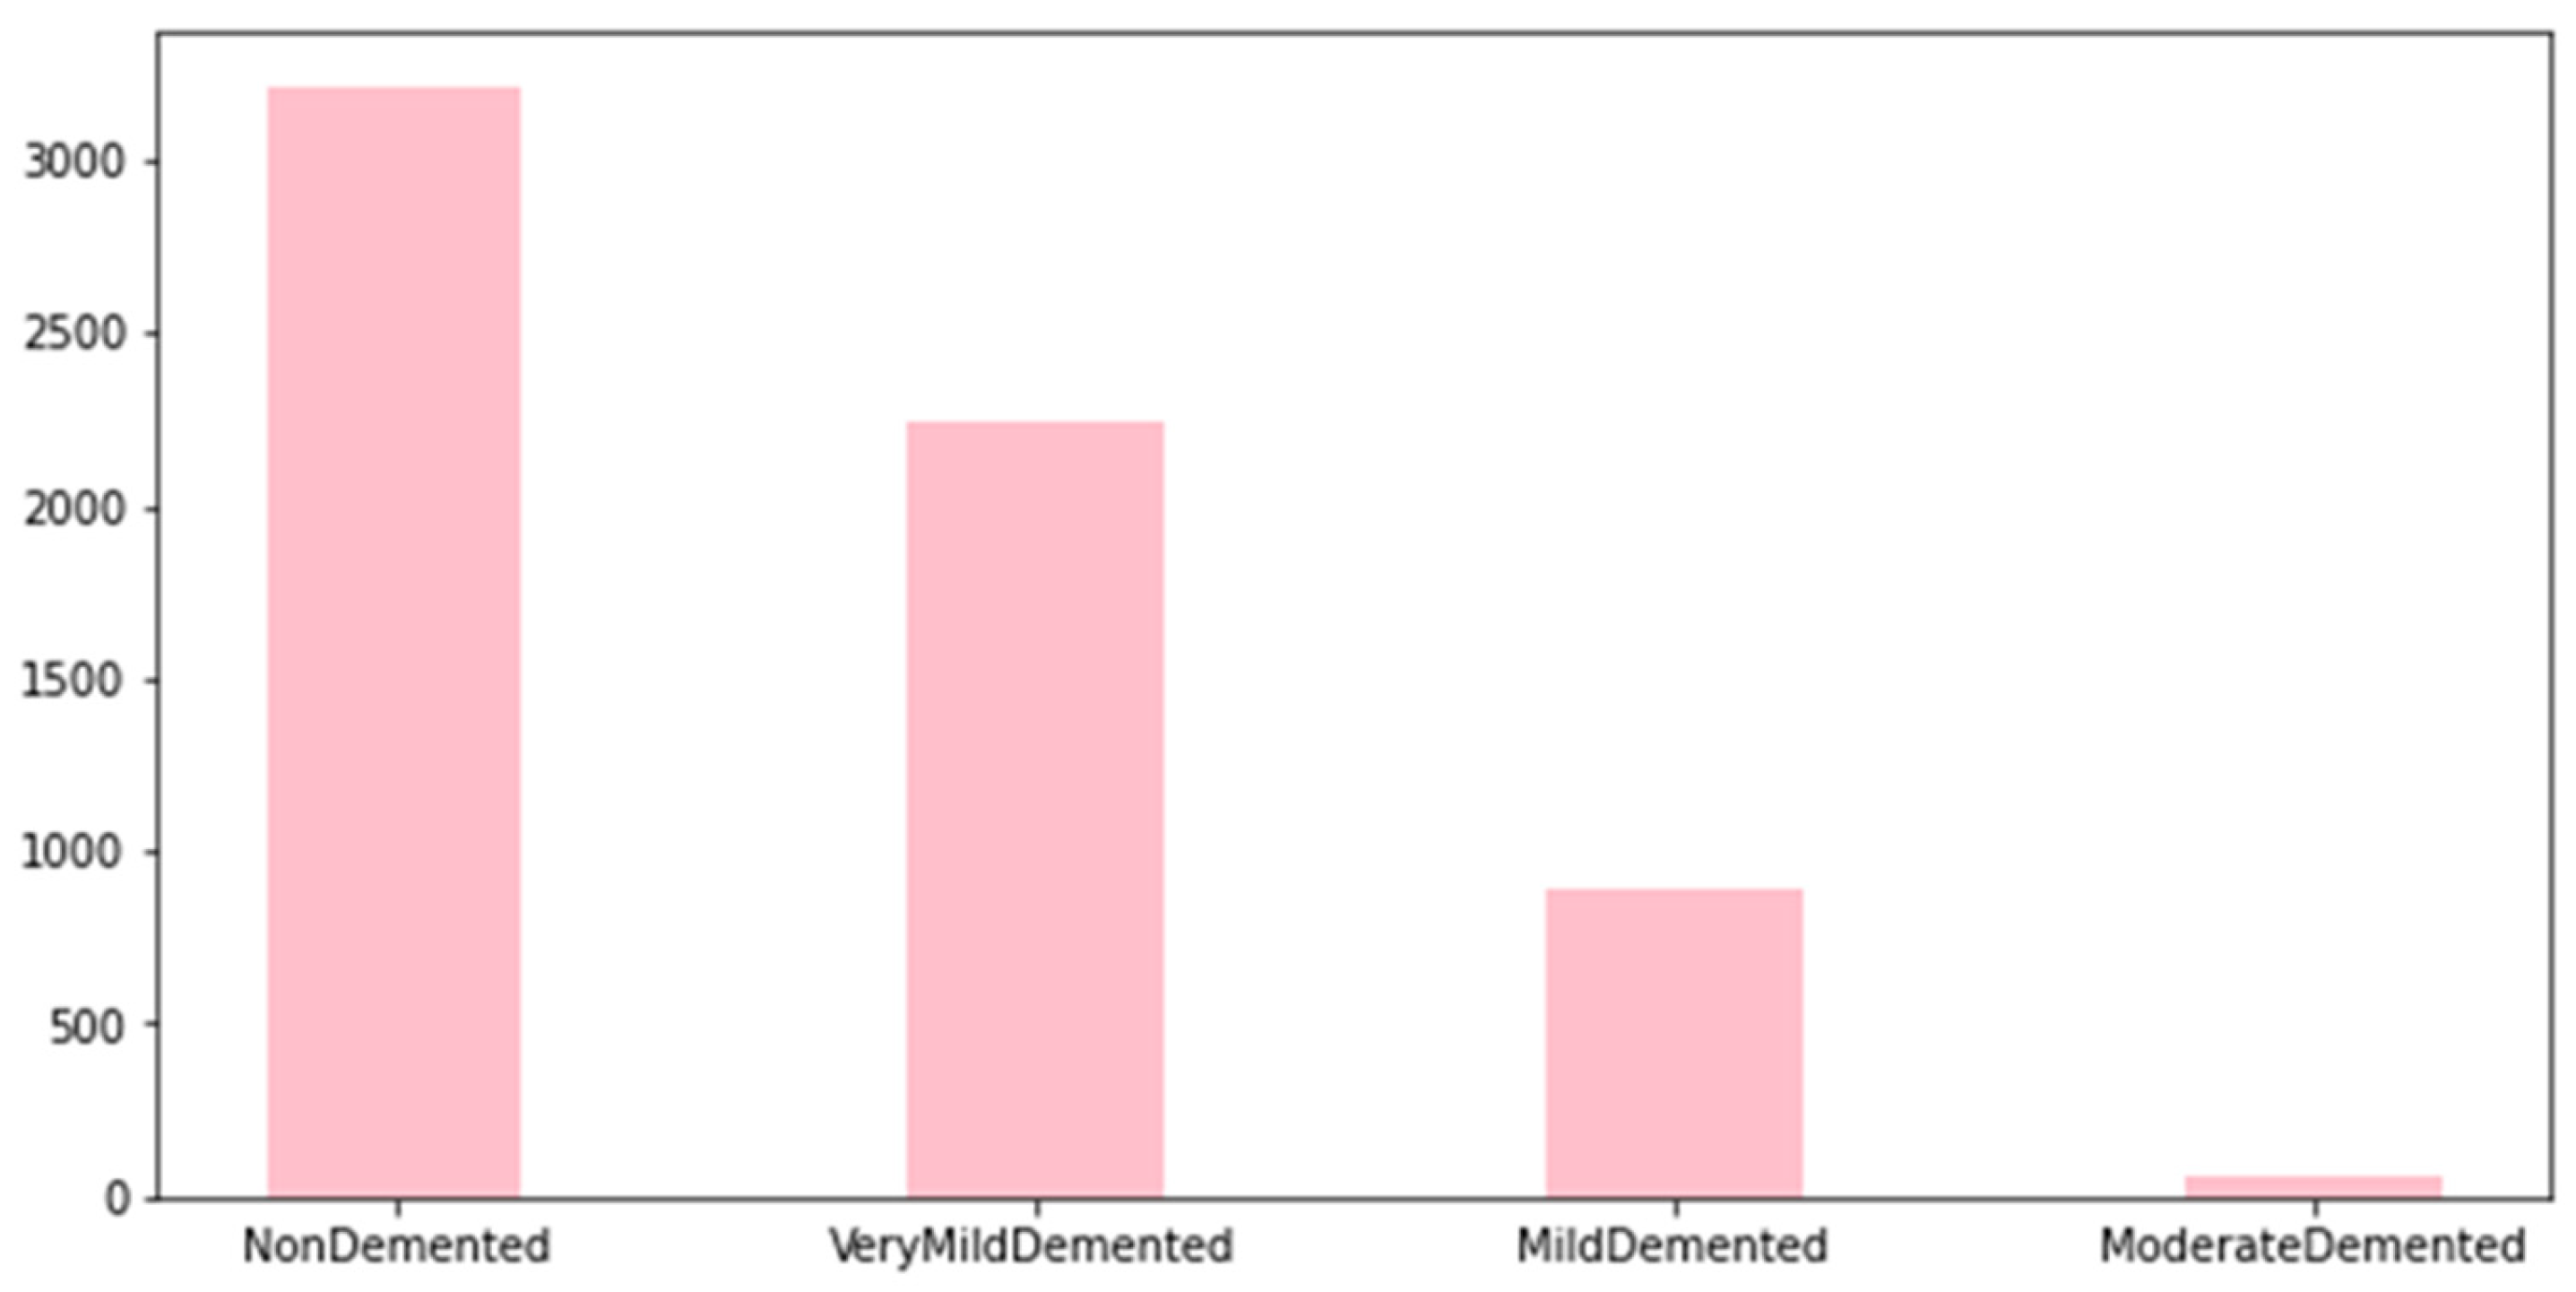
3.1. Dataset
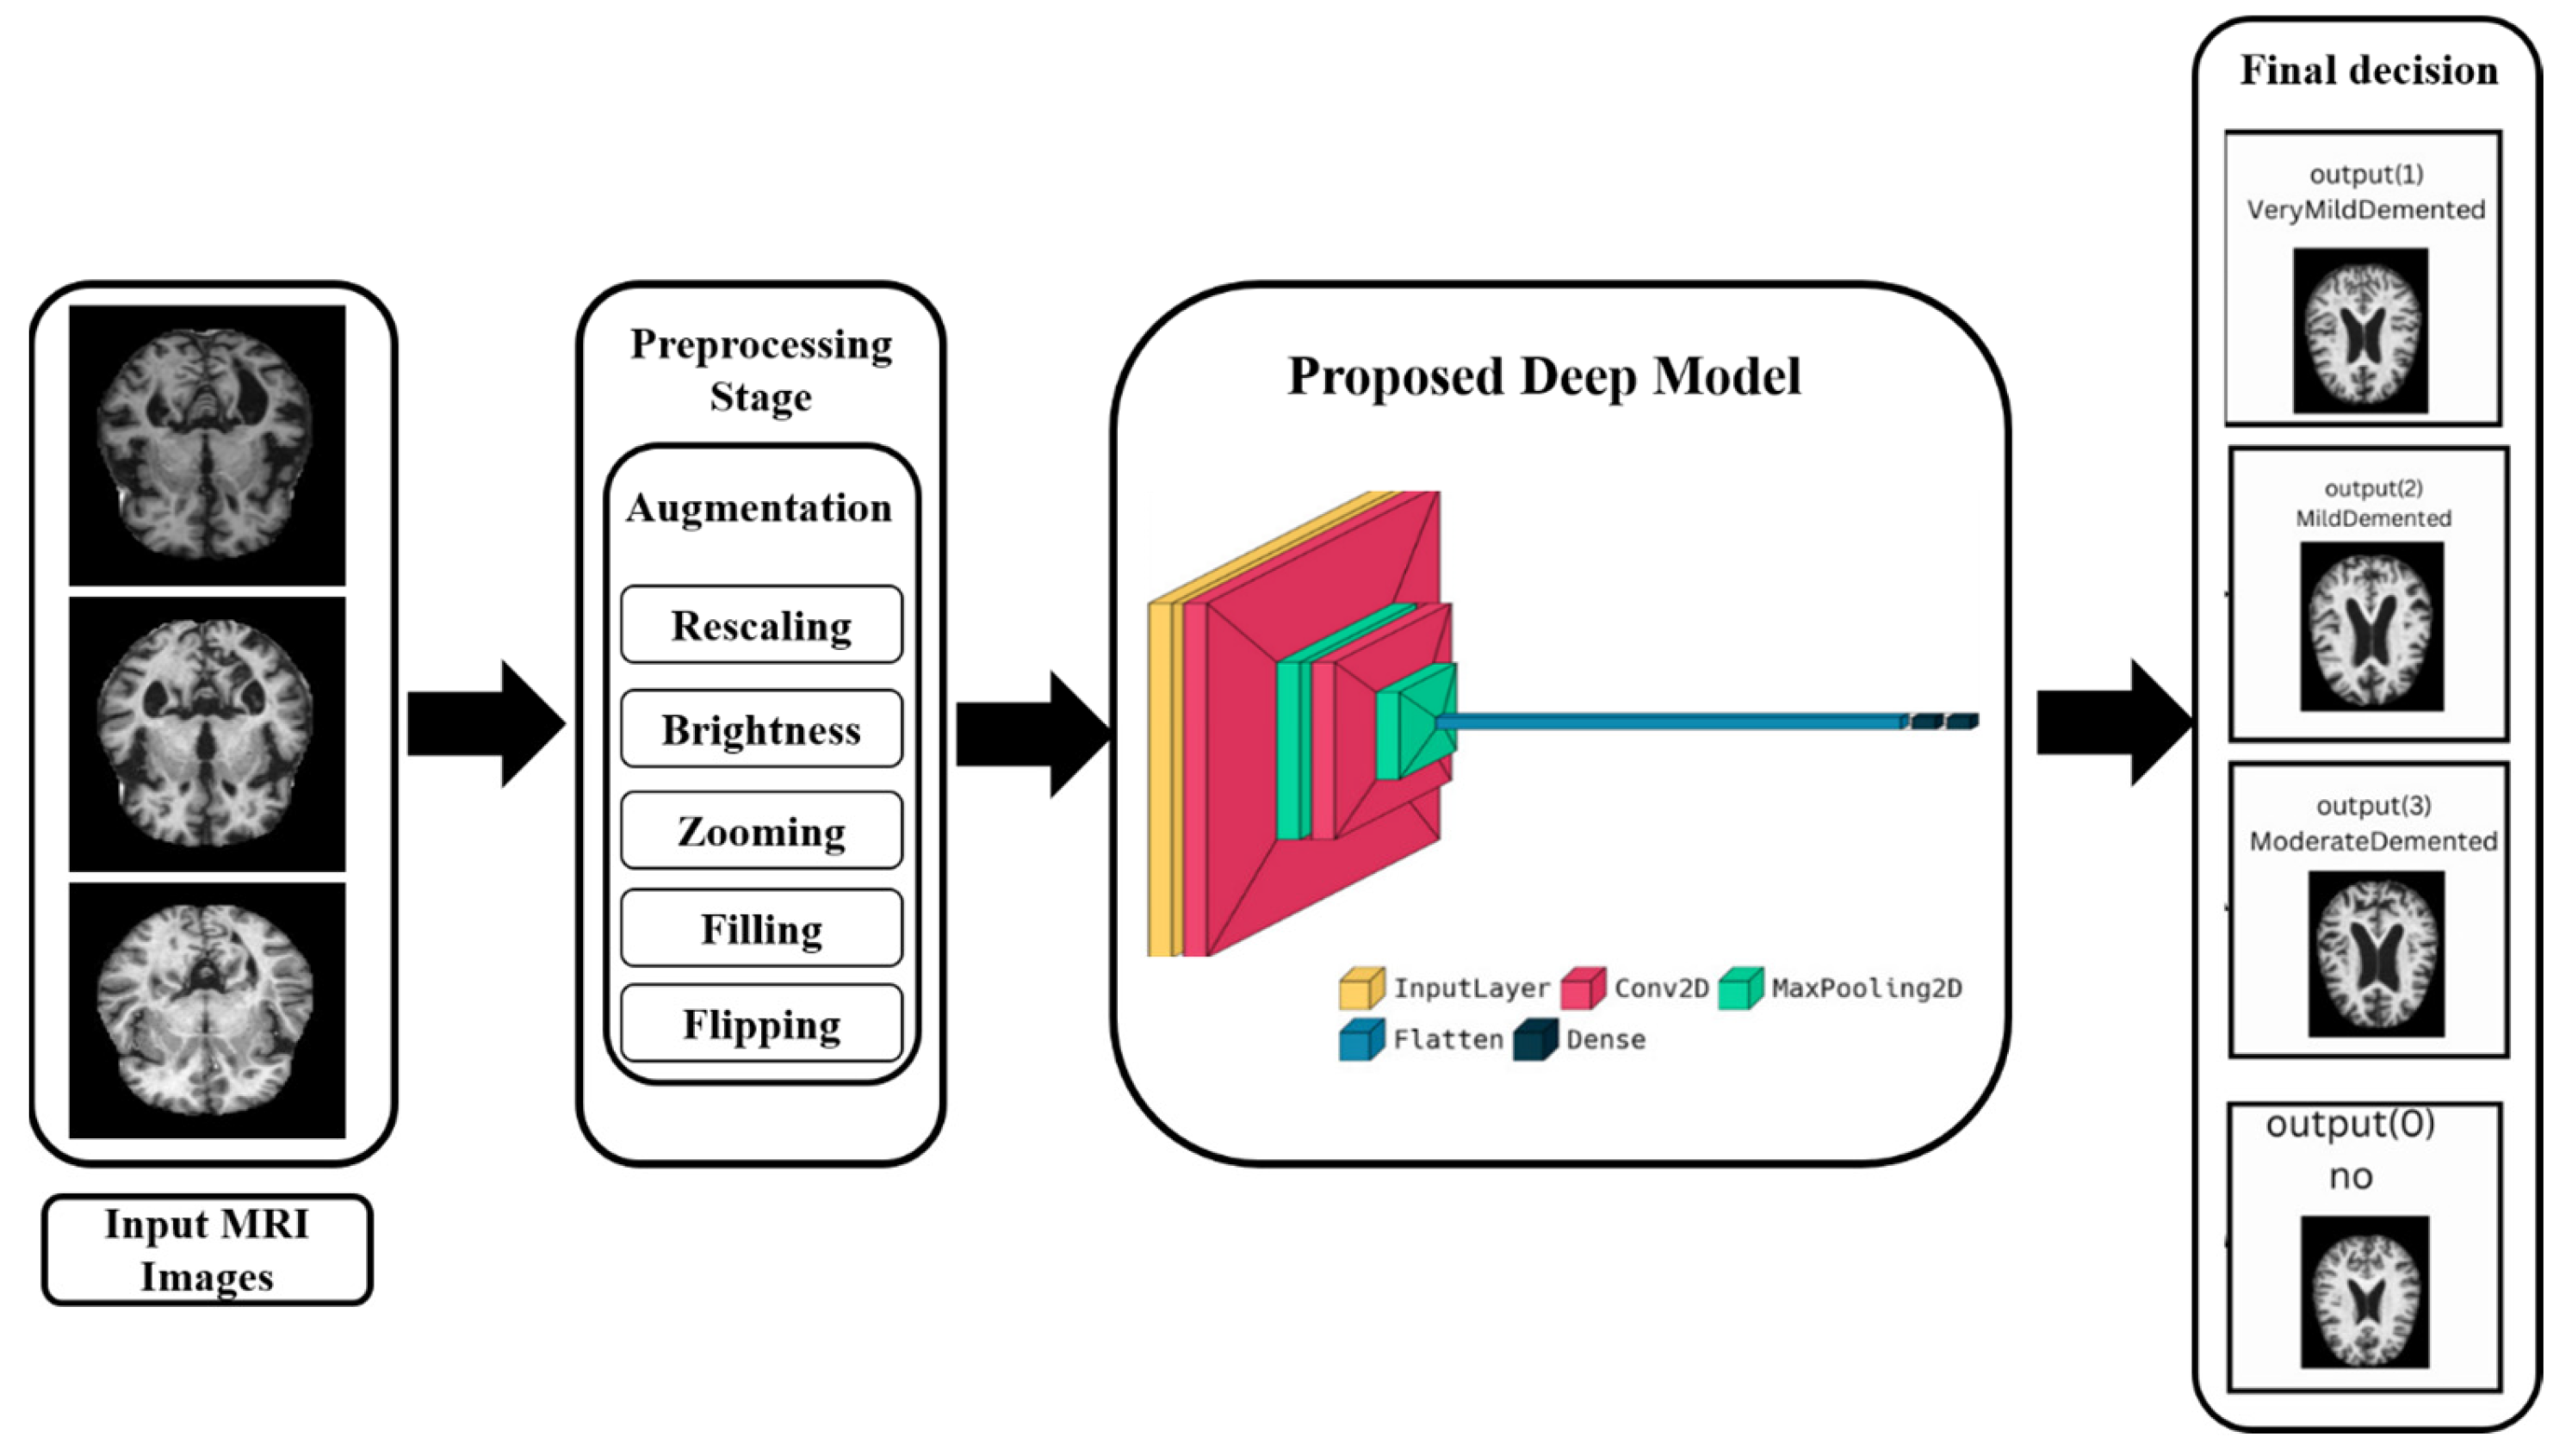
3.2. Preprocessing Stage
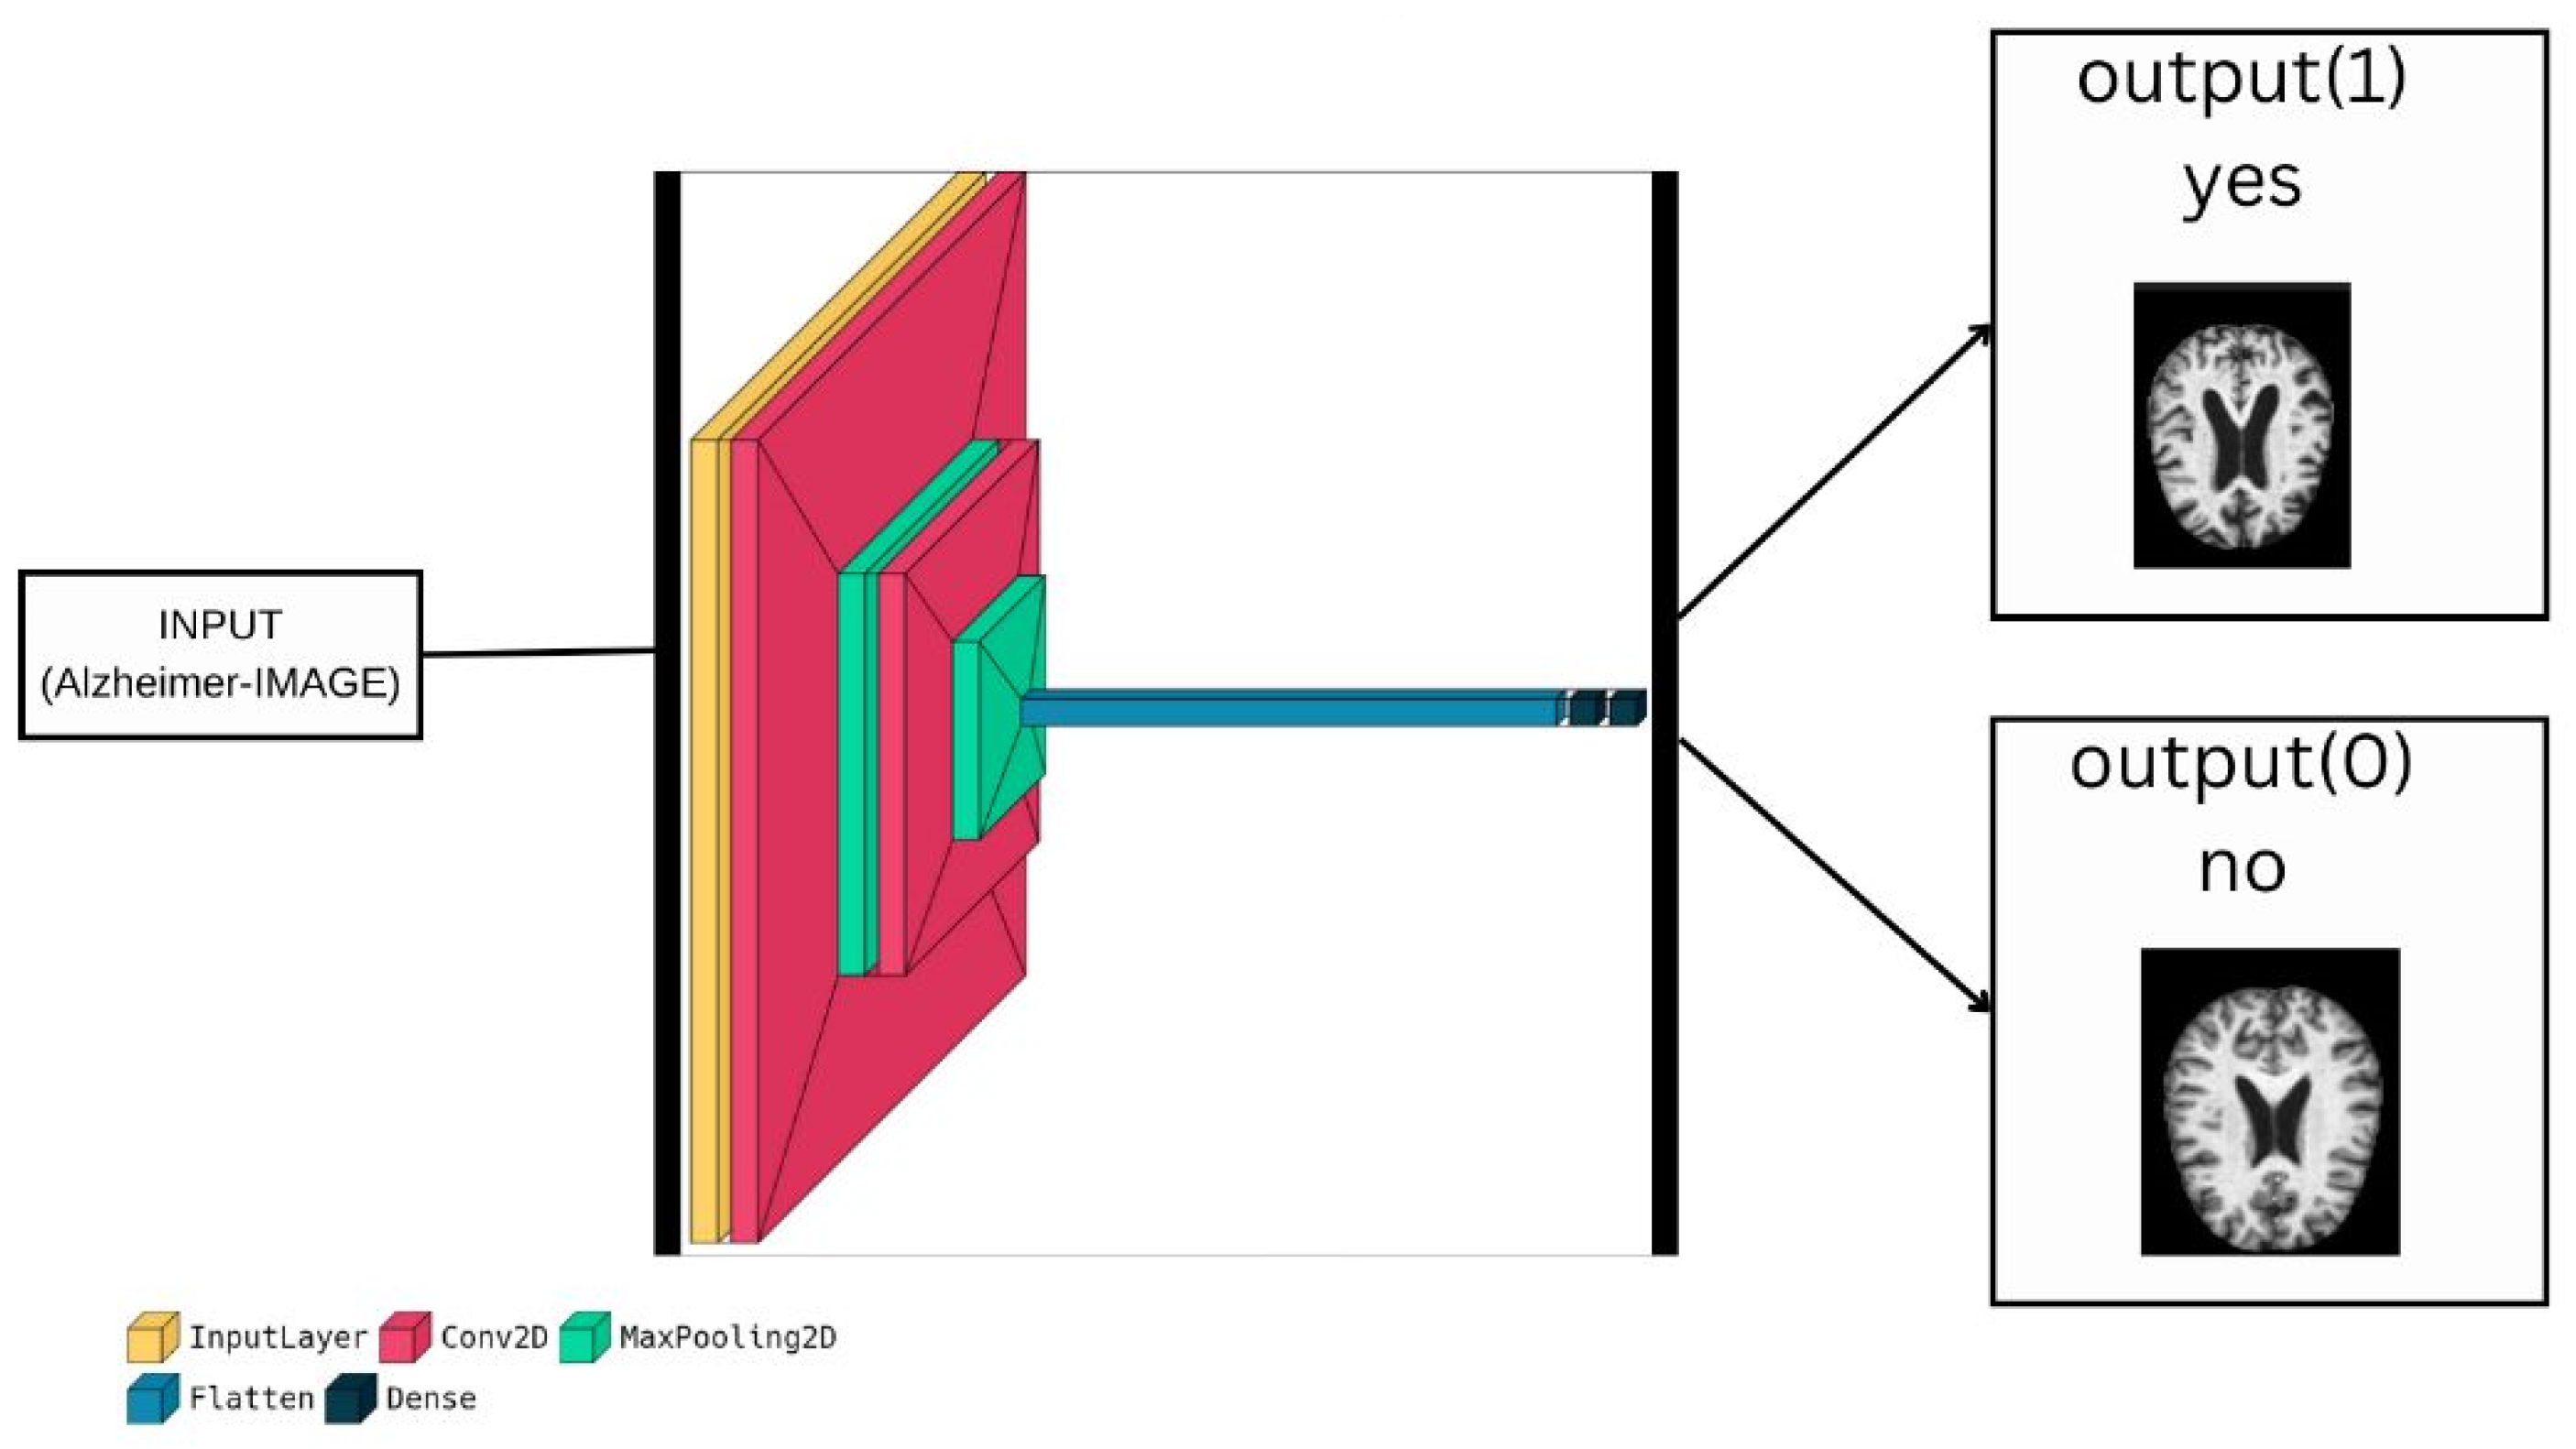
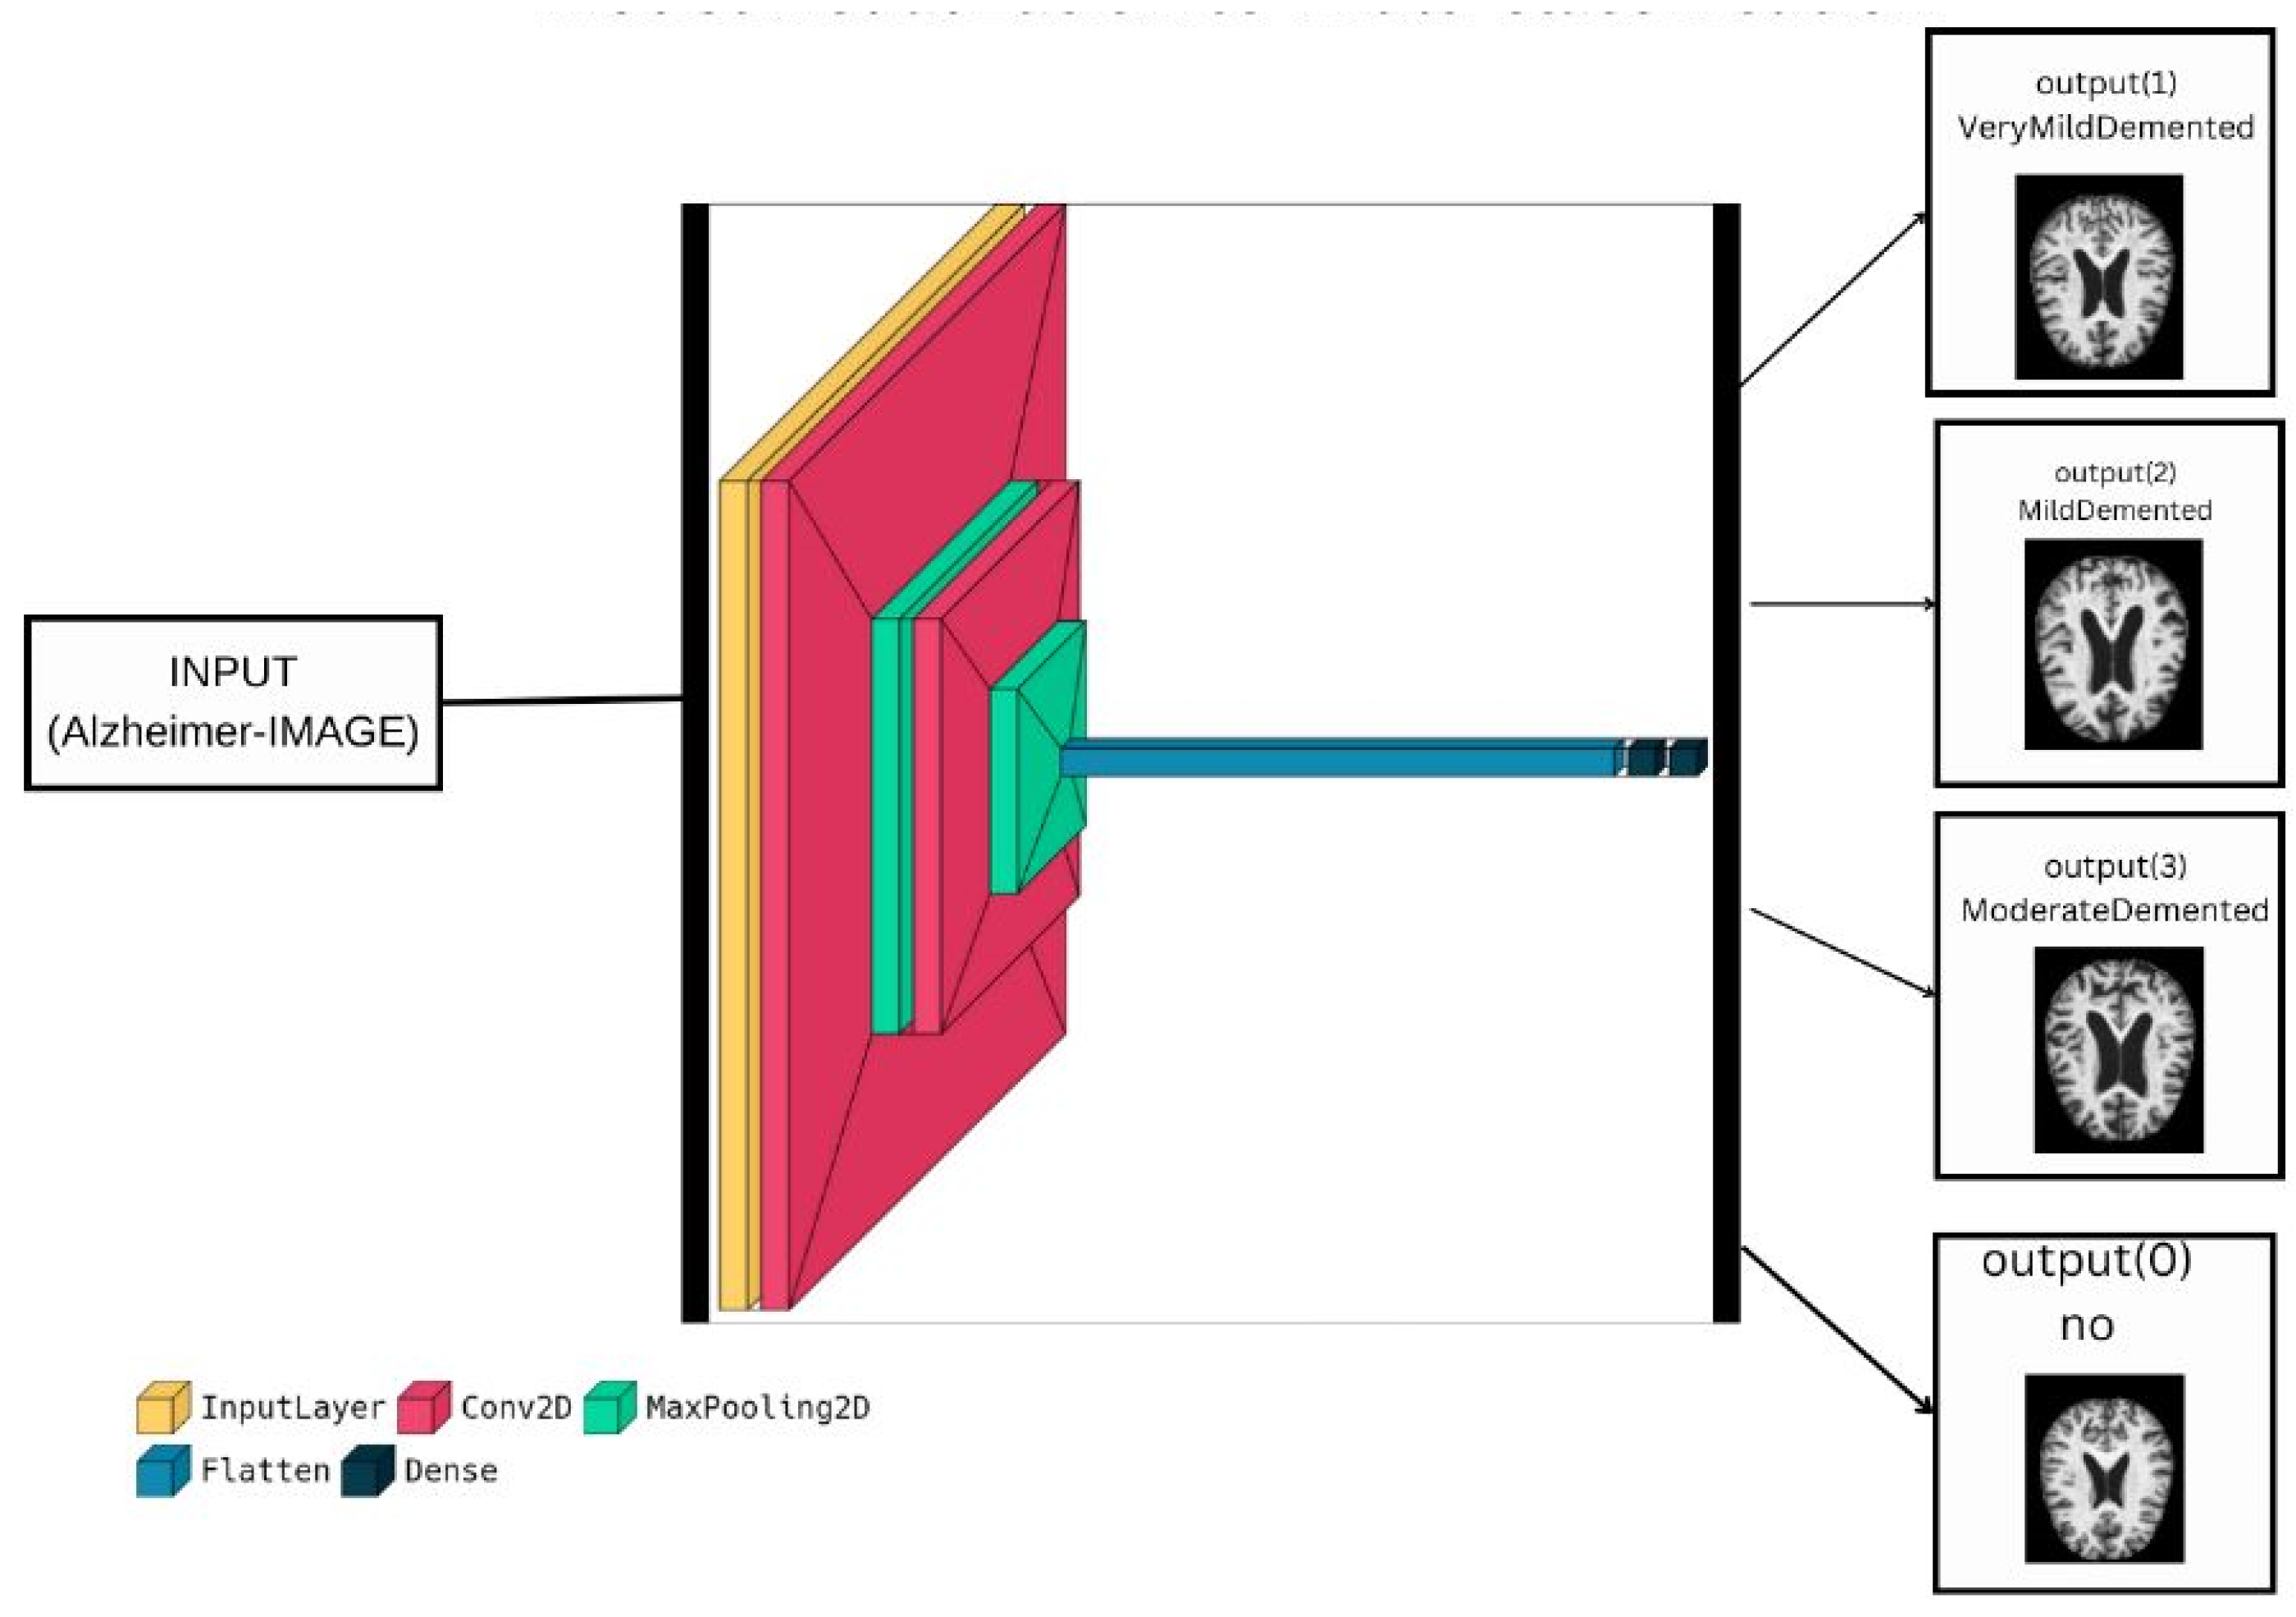
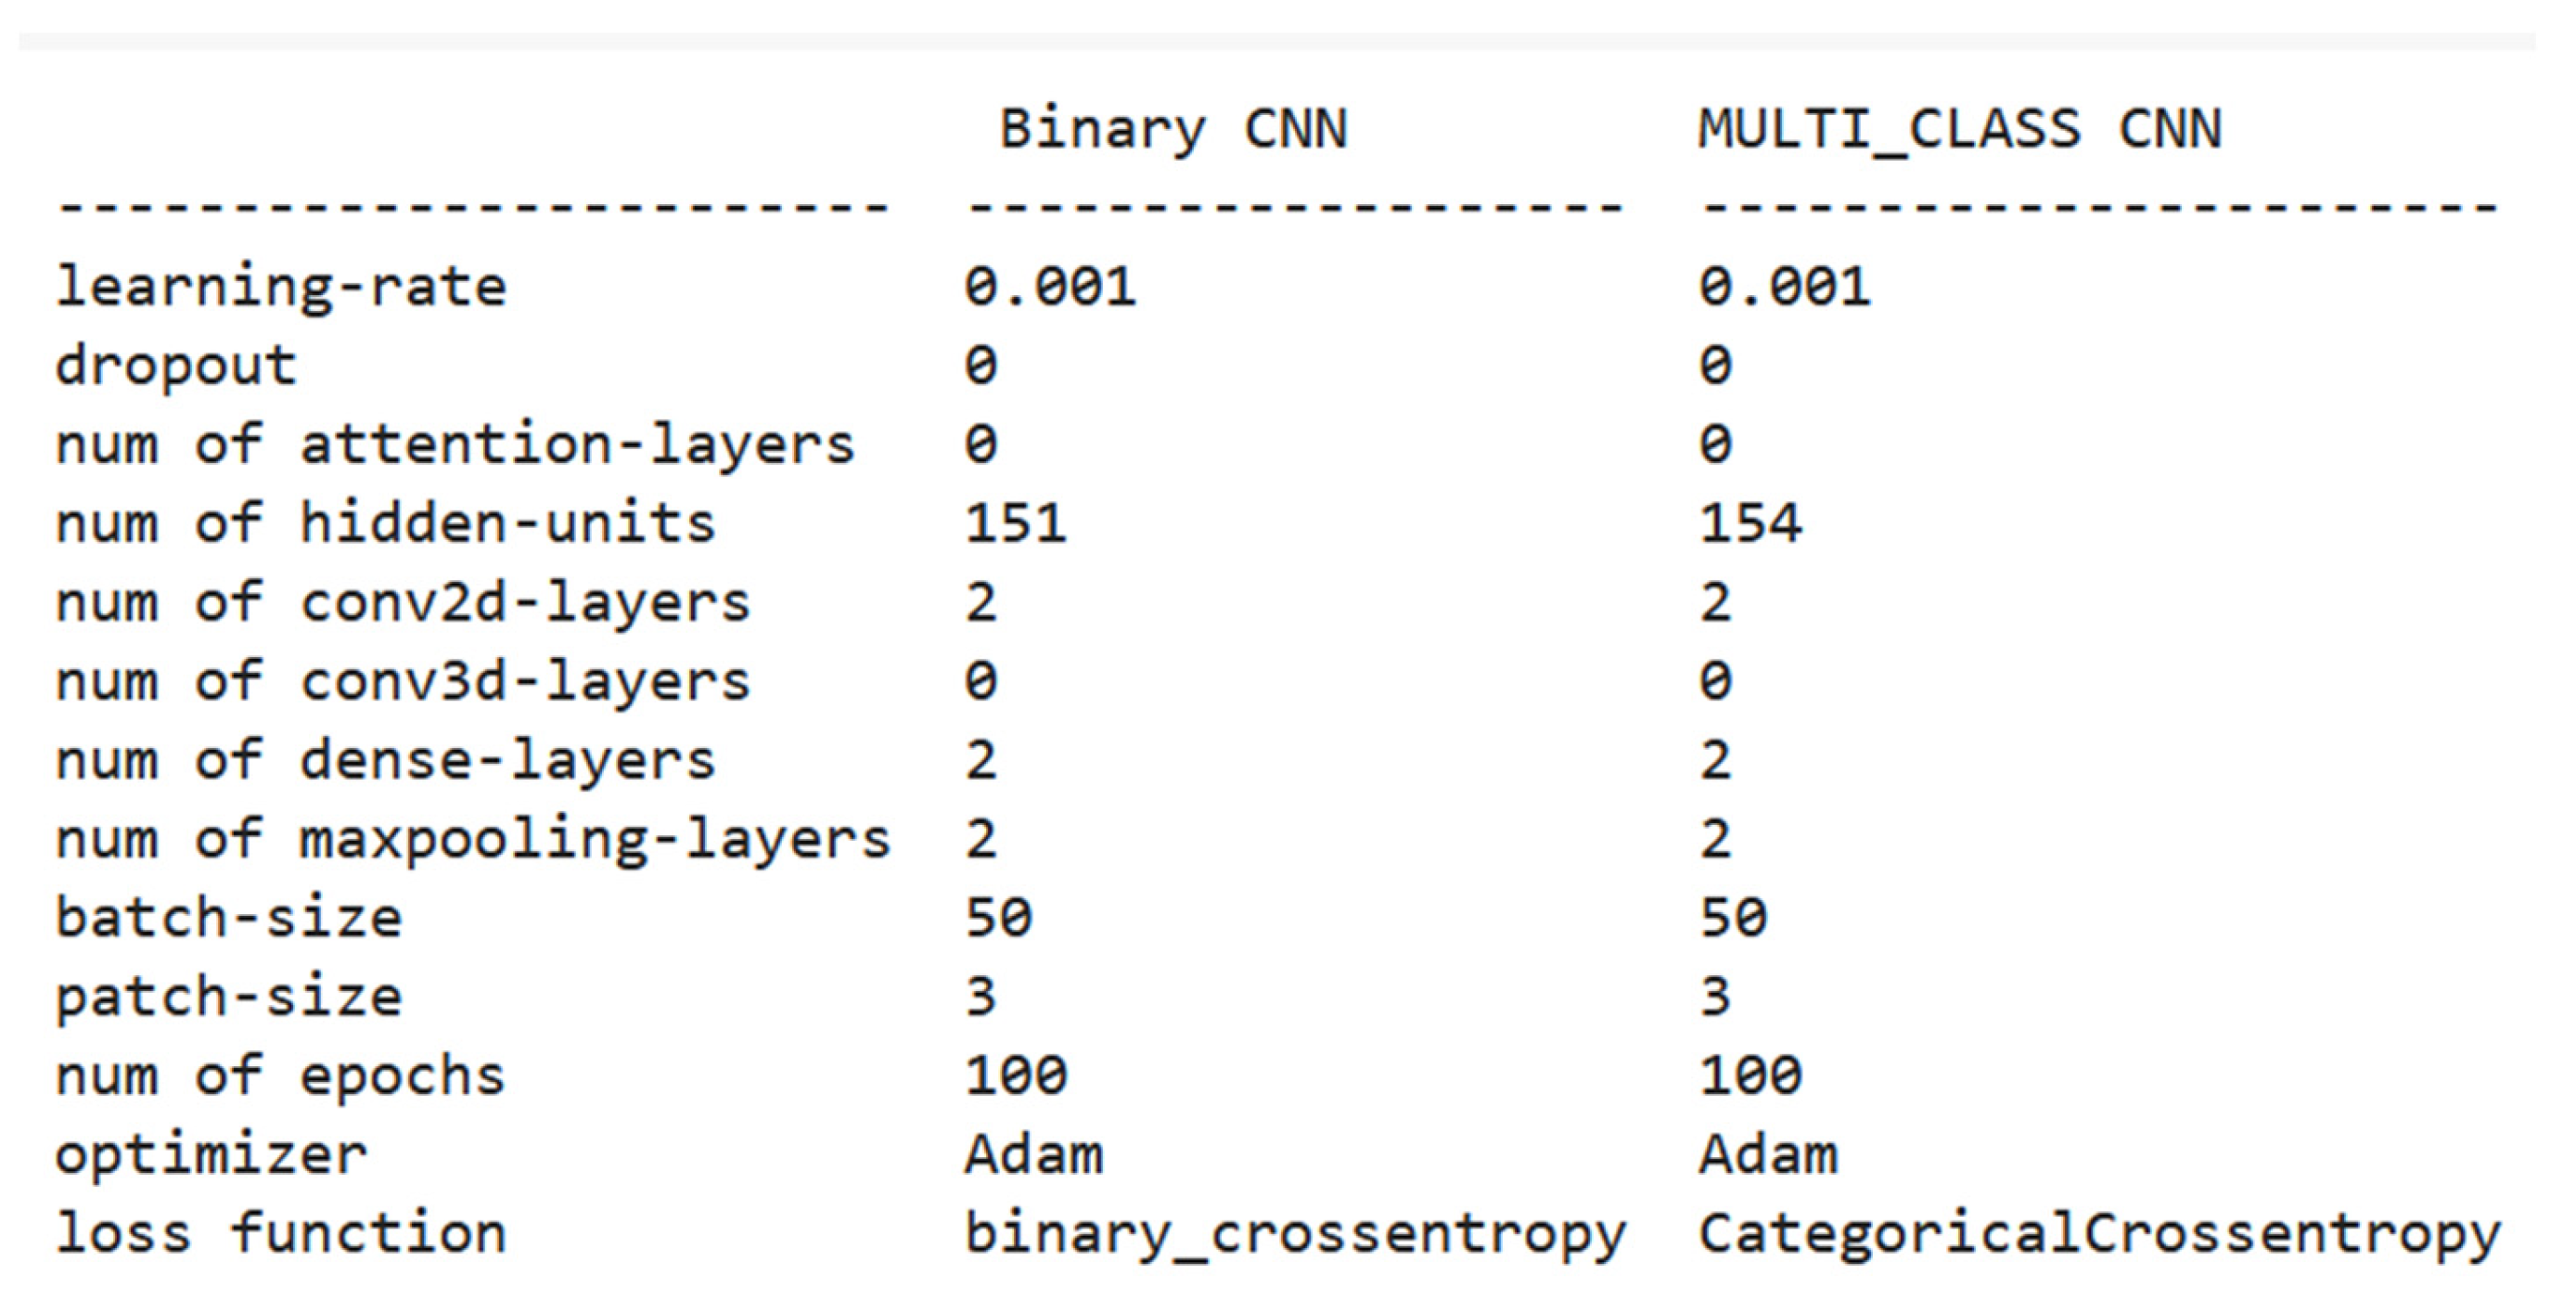
3.3. Proposed Deep Model for Binary-Classification
3.4. Proposed Deep Model for Multi-Classification
| Algorithm 1: The proposed algorithm (Summary of the proposed model) |
| 1. BEGIN |
| 2. INPUT: dataset_directory, training_percentage, image_augmentation_parameters, model_parameters, optimizer, loss_function, performance_metrics. |
| 3. Load input dataset from dataset_directory |
| 4. Split the dataset into training set and validation set with training_percentage |
| 5. Instantiate an ImageDataGenerator object with image_augmentation_parameters |
| 6. IF model_parameters is a pre-trained model THEN |
| 7. Load pre-trained model |
| 8. ELSE |
| 9. Define a deep learning model using Keras with model_parameters |
| 10. ENDIF |
| 11. Compile the model using optimizer and loss_function |
| 12. Train the model on the training set for a number of epochs with the compiled model and ImageDataGenerator object |
| 13. FOR each epoch in the training process DO |
| 14. Evaluate the model on the validation set using performance_metrics |
| 15. IF the validation accuracy is not improving THEN |
| 16. Reduce learning rate |
| 17. ENDIF |
| 18. ENDFOR |
| 19. Test the final model on a separate test set to evaluate its generalization performance using performance_metrics |
| 20. OUTPUT: the performance_metrics of the proposed method and existing methods for comparison |
| 21. END |
4. Results and Discussion
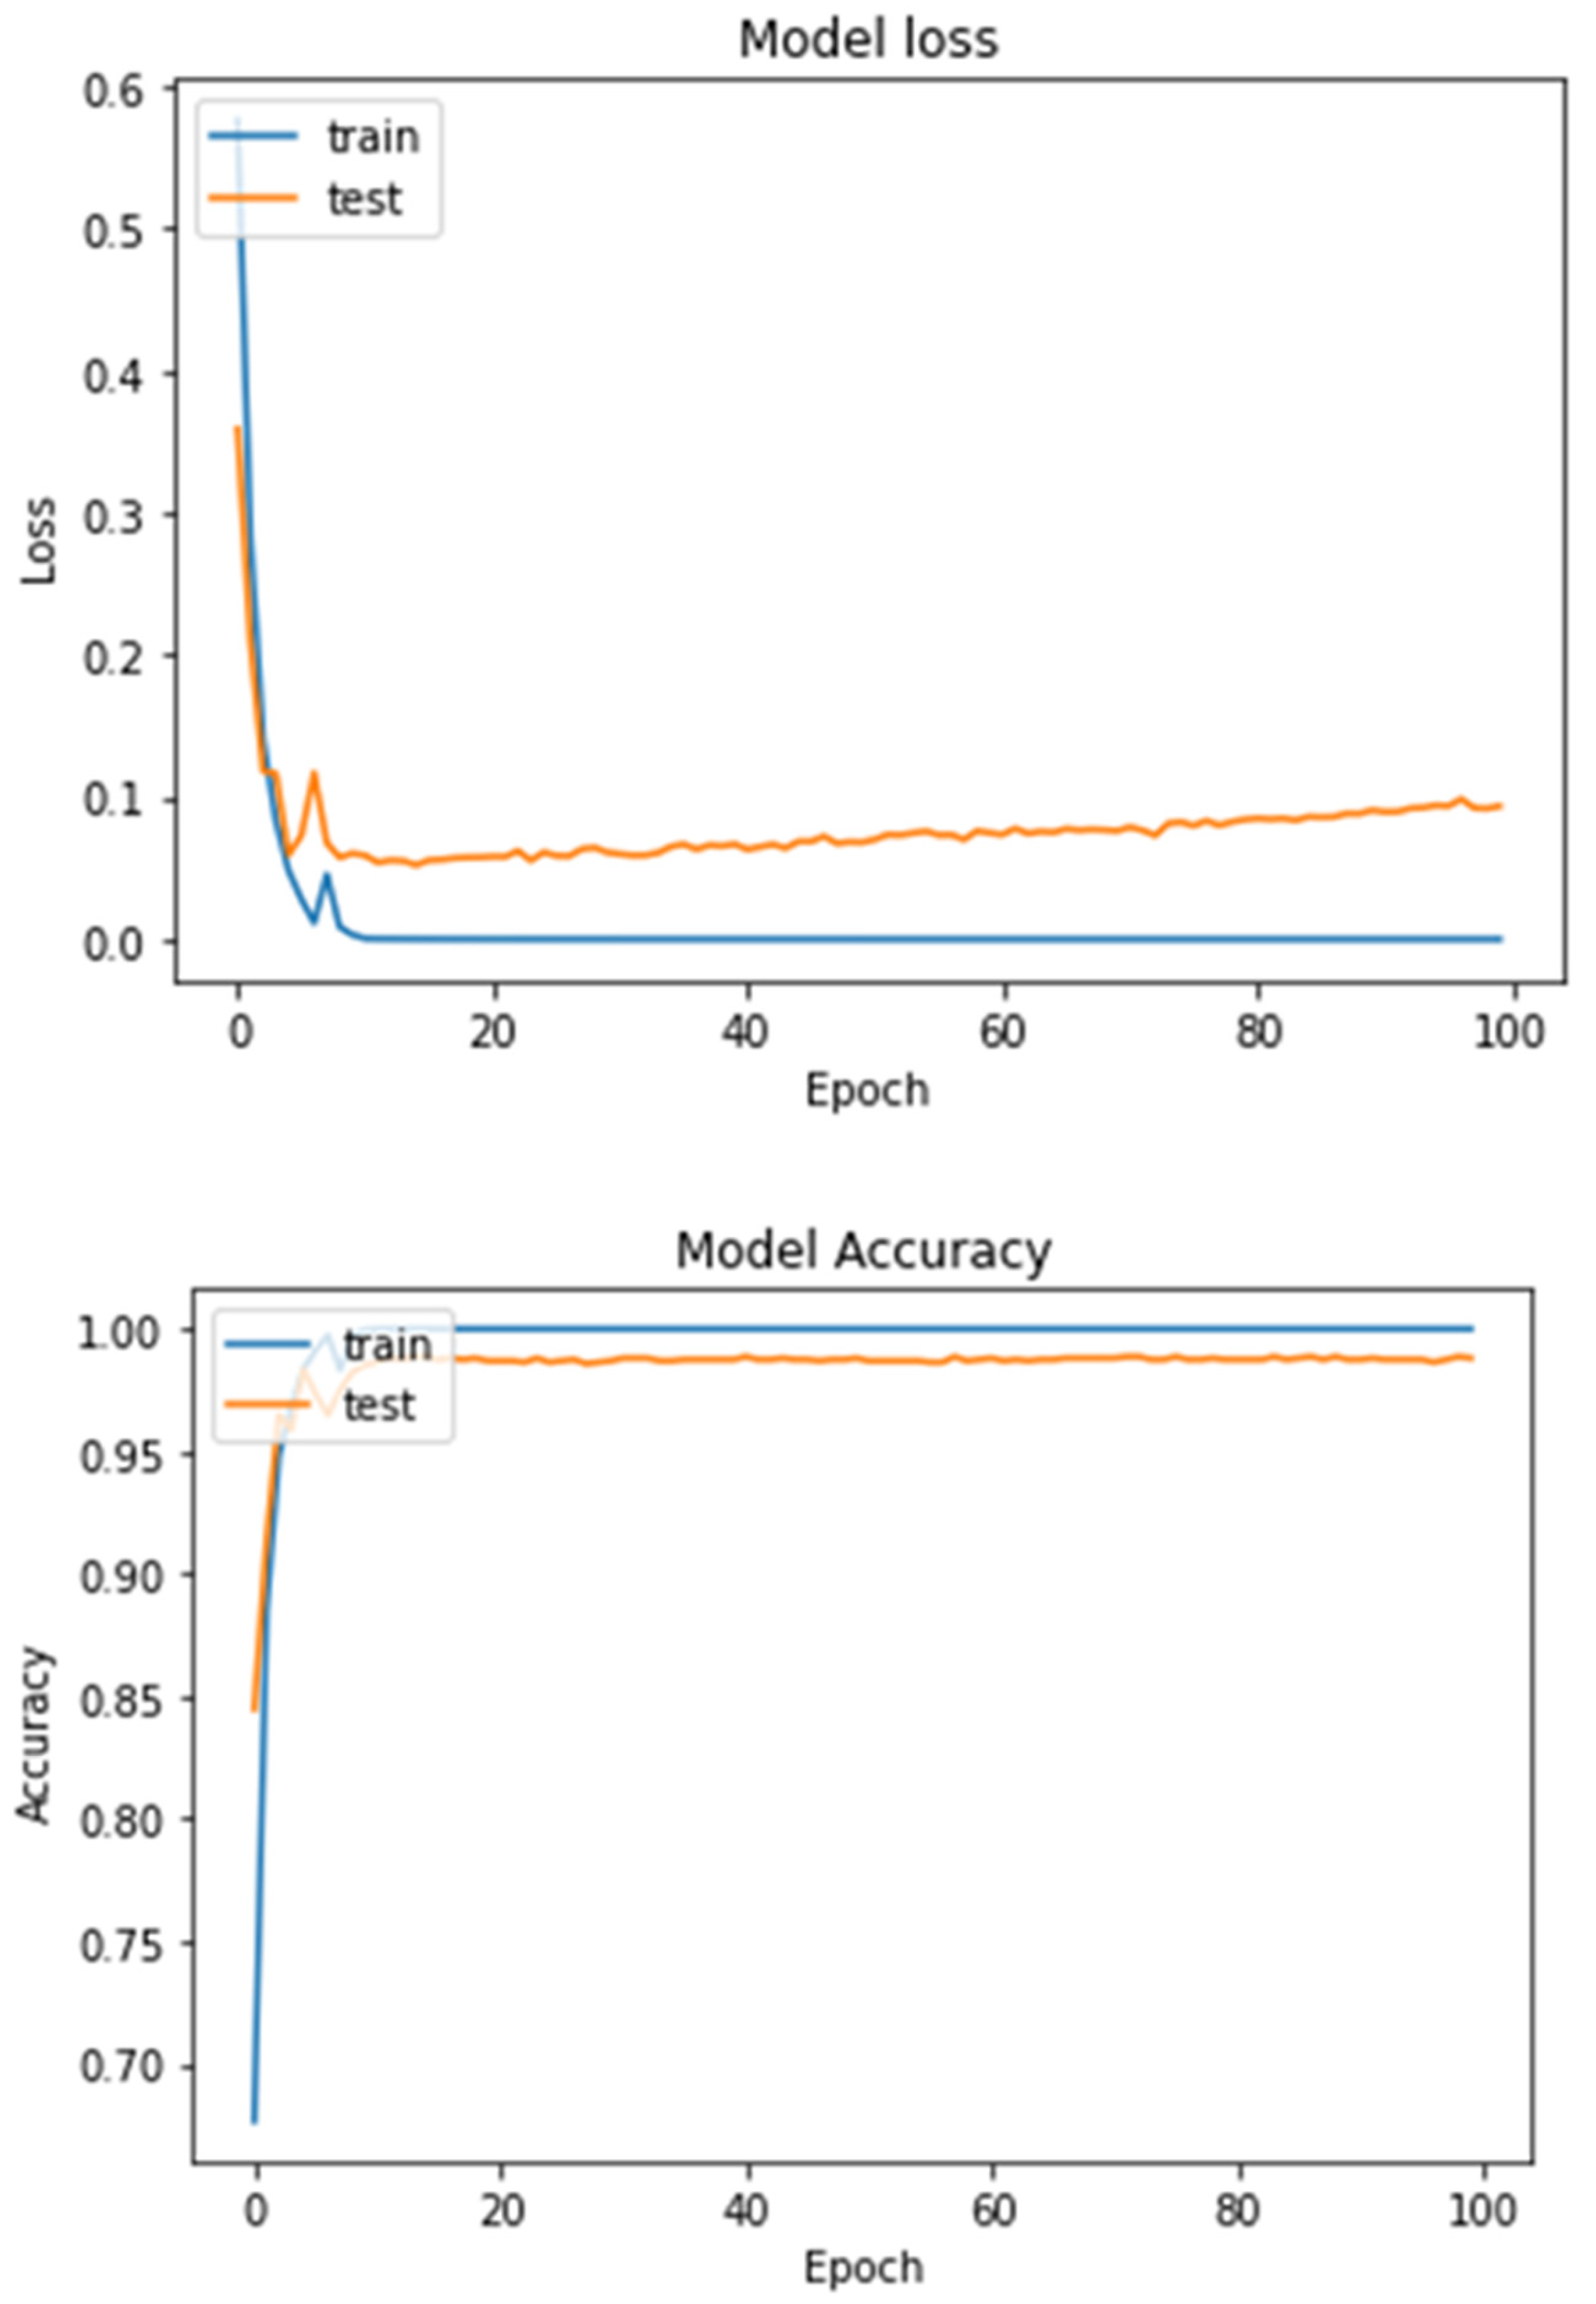
4.1. Experimental Analysis
- A.
- The first experiment
- B.
- The second experiment
4.2. Comparison with Other State-of-the-Art Deep Models
4.3. Computational Complexity
5. Conclusions
Author Contributions
Funding
Institutional Review Board Statement
Informed Consent Statement
Data Availability Statement
Acknowledgments
Conflicts of Interest
References
- DeTure, M.A.; Dickson, D.W. The Neuropathological Diagnosis of Alzheimer’s Disease. Mol. Neurodegener. 2019, 14, 32. [Google Scholar] [CrossRef] [Green Version]
- Kocaelli, H.; Yaltirik, M.; Yargic, L.I.; Özbas, H. Alzheimer’s Disease and Dental Management. Oral Surg. Oral Med. Oral Pathol. Oral Radiol. Endod. 2002, 93, 521–524. [Google Scholar] [CrossRef]
- Chassain, C.; Cladiere, A.; Tsoutsos, C.; Pereira, B.; Boumezbeur, F.; Debilly, B.; Marques, A.-R.; Thobois, S.; Durif, F. Evaluation of Common and Rare Variants of Alzheimer’s Disease-Causal Genes in Parkinson’s Disease. Park. Relat. Disord. 2022, 97, 8–14. [Google Scholar] [CrossRef]
- Kalaria, R. Similarities between Alzheimer’s Disease and Vascular Dementia. J. Neurol. Sci. 2002, 203, 29–34. [Google Scholar] [CrossRef]
- Sarasso, E.; Gardoni, A.; Piramide, N.; Volontè, M.A.; Canu, E.; Tettamanti, A.; Filippi, M.; Agosta, F. A Multiparametric MRI Study of Structural Brain Damage in Dementia with Lewy Bodies: A Comparison with Alzheimer’s Disease. Park. Relat. Disord. 2021, 91, 154–161. [Google Scholar] [CrossRef]
- Simic, G.; Stanic, G.; Mladinov, M.; Jovanov-Milosevic, N.; Kostovic, I.; Hof, P. Does Alzheimer’s Disease Begin in the Brainstem? Neuropathol. Appl. Neurobiol. 2009, 35, 532–554. [Google Scholar] [CrossRef] [Green Version]
- Desai, A.K.; Grossberg, G.T. Diagnosis and Treatment of Alzheimer’s Disease. Neurology 2005, 64 (Suppl. 3), S34–S39. [Google Scholar] [CrossRef]
- Menagadevi, M.; Mangai, S.; Madian, N.; Thiyagarajan, D. Automated Prediction System for Alzheimer Detection Based on Deep Residual Autoencoder and Support Vector Machine. Optik 2023, 272, 170212. [Google Scholar] [CrossRef]
- Murugan, S.; Venkatesan, C.; Sumithra, M.G.; Gao, X.Z.; Elakkiya, B.; Akila, M.; Manoharan, S. DEMNET: A Deep Learning Model for Early Diagnosis of Alzheimer Diseases and Dementia from MR Images. IEEE Access 2021, 9, 90319–90329. [Google Scholar] [CrossRef]
- Loddo, A.; Buttau, S.; Di Ruberto, C. Deep Learning Based Pipelines for Alzheimer’s Disease Diagnosis: A Comparative Study and a Novel Deep-Ensemble Method. Comput. Biol. Med. 2022, 141, 105032. [Google Scholar] [CrossRef]
- Sharma, S.; Gupta, S.; Gupta, D.; Altameem, A.; Saudagar, A.K.J.; Poonia, R.C.; Nayak, S.R. HTLML: Hybrid AI Based Model for Detection of Alzheimer’s Disease. Diagnostics 2022, 12, 1833. [Google Scholar] [CrossRef] [PubMed]
- Mohammed, B.A.; Senan, E.M.; Rassem, T.H.; Makbol, N.M.; Alanazi, A.A.; Al-Mekhlafi, Z.G.; Ghaleb, F.A. Multi-Method Analysis of Medical Records and MRI Images for Early Diagnosis of Dementia and Alzheimer’s Disease Based on Deep Learning and Hybrid Methods. Electronics 2021, 10, 2860. [Google Scholar] [CrossRef]
- Balasundaram, A.; Srinivasan, S.; Prasad, A.; Malik, J.; Kumar, A. Hippocampus Segmentation-Based Alzheimer’s Disease Diagnosis and Classification of MRI Images. Arab. J. Sci. Eng. 2023, 1–17, online ahead of print. [Google Scholar] [CrossRef] [PubMed]
- Bangyal, W.H.; Rehman, N.U.; Nawaz, A.; Nisar, K.; Ibrahim, A.A.A.; Shakir, R.; Rawat, D.B. Constructing Domain Ontology for Alzheimer Disease Using Deep Learning Based Approach. Electronics 2022, 11, 1890. [Google Scholar] [CrossRef]
- Ahmed, G.; Er, M.J.; Fareed, M.M.S.; Zikria, S.; Mahmood, S.; He, J.; Aslam, M. DAD-Net: Classification of Alzheimer’s Disease Using ADASYN Oversampling Technique and Optimized Neural Network. Molecules 2022, 27, 7085. [Google Scholar] [CrossRef]
- Tuvshinjargal, B.; Hwang, H. VGG-C Transform Model with Batch Normalization to Predict Alzheimer’s Disease through MRI Dataset. Electronics 2022, 11, 2601. [Google Scholar] [CrossRef]
- Varalakshmi, P.; Priya, B.T.; Rithiga, B.A.; Bhuvaneaswari, R.; Sundar, R.S.J. Diagnosis of Parkinson’s Disease from Hand Drawing Utilizing Hybrid Models. Park. Relat. Disord. 2022, 105, 24–31. [Google Scholar] [CrossRef]
- Inguanzo, A.; Sala-Llonch, R.; Segura, B.; Erostarbe, H.; Abos, A.; Campabadal, A.; Uribe, C.; Baggio, H.; Compta, Y.; Marti, M.; et al. Hierarchical Cluster Analysis of Multimodal Imaging Data Identifies Brain Atrophy and Cognitive Patterns in Parkinson’s Disease. Park. Relat. Disord. 2021, 82, 16–23. [Google Scholar] [CrossRef]
- Liu, C.; Huang, F.; Qiu, A.; Alzheimer’s Disease Neuroimaging Initiative. Monte Carlo Ensemble Neural Network for the Diagnosis of Alzheimer’s Disease. Neural Netw. 2023, 159, 14–24. [Google Scholar] [CrossRef]
- Lahmiri, S. Integrating Convolutional Neural Networks, kNN, and Bayesian Optimization for Efficient Diagnosis of Alzheimer’s Disease in Magnetic Resonance Images. Biomed. Signal Process. Control 2023, 80, 104375. [Google Scholar] [CrossRef]
- Abbas, S.Q.; Chi, L.; Chen, Y.P.P. Transformed Domain Convolutional Neural Network for Alzheimer’s Disease Diagnosis Using Structural MRI. Pattern Recognit. 2023, 133, 109031. [Google Scholar] [CrossRef]
- Hu, Z.; Wang, Z.; Jin, Y.; Hou, W. VGG-TSwinformer: Transformer-Based Deep Learning Model for Early Alzheimer’s Disease Prediction. Comput. Methods Programs Biomed. 2023, 229, 107291. [Google Scholar] [CrossRef] [PubMed]
- Marwa, E.G.; Moustafa, H.E.D.; Khalifa, F.; Khater, H.; AbdElhalim, E. An MRI-Based Deep Learning Approach for Accurate Detection of Alzheimer’s Disease. Alex. Eng. J. 2023, 63, 211–221. [Google Scholar] [CrossRef]
- Hammad, M.; Abd El-Latif, A.A.; Hussain, A.; Abd El-Samie, F.E.; Gupta, B.B.; Ugail, H.; Sedik, A. Deep Learning Models for Arrhythmia Detection in IoT Healthcare Applications. Comput. Electr. Eng. 2022, 100, 108011. [Google Scholar] [CrossRef]
- Hammad, M.; Bakrey, M.; Bakhiet, A.; Tadeusiewicz, R.; Abd El-Latif, A.A.; Pławiak, P. A Novel End-to-End Deep Learning Approach for Cancer Detection Based on Microscopic Medical Images. Biocybern. Biomed. Eng. 2022, 42, 737–748. [Google Scholar] [CrossRef]
- Jabeen, F.; Rehman, Z.U.; Shah, S.; Alharthy, R.D.; Jalil, S.; Khan, I.A.; Almohammedi, A.; Alhumaidi, A.S.; Abd El-Latif, A.A. Deep Learning-Based Prediction of Inhibitors Interaction with Butyrylcholinesterase for the Treatment of Alzheimer’s Disease. Comput. Electr. Eng. 2023, 105, 108475. [Google Scholar] [CrossRef]
- Hammad, M.; Meshoul, S.; Dziwiński, P.; Pławiak, P.; Elgendy, I.A. Efficient Lightweight Multimodel Deep Fusion Based on ECG for Arrhythmia Classification. Sensors 2022, 22, 9347. [Google Scholar] [CrossRef] [PubMed]
- Wani, M.A.; ELAffendi, M.A.; Shakil, K.A.; Imran, A.S.; Abd El-Latif, A.A. Depression Screening in Humans with AI and Deep Learning Techniques. IEEE Trans. Comput. Soc. Syst. 2022. [Google Scholar] [CrossRef]
- Dubey, S. Alzheimer’s Dataset (4 Class of Images); Kaggle: San Francisco, CA, USA, 2020; Available online: https://www.kaggle.com/datasets/tourist55/alzheimers-dataset-4-class-of-images (accessed on 12 February 2023).
- Ghasemi Darehnaei, S.A.; Amiri, A.R.; Karimipour, H.; Huang, Y. SI-EDTL: Swarm intelligence ensemble deep transfer learning for multiple vehicle detection in UAV images. Concurr. Comput. Pract. Exp. 2022, 34, e6726. [Google Scholar] [CrossRef]
- Shokouhifar, M.; Bagheri, M.; Jahani, S. Multivariate time-series blood donation/demand forecasting for resilient supply chain management during COVID-19 pandemic. Clean. Logist. Supply Chain. 2022, 5, 100078. [Google Scholar] [CrossRef]
- Hammad, M.; Iliyasu, A.M.; Elgendy, I.A.; Abd El-Latif, A.A. End-to-end data authentication deep learning model for securing IoT configurations. Hum.-Cent. Comput. Inf. Sci. 2022, 12, 4. [Google Scholar] [CrossRef]
- Hazarika, R.A.; Maji, A.K.; Kandar, D.; Jasinska, E.; Krejci, P.; Leonowicz, Z.; Jasinski, M. An Approach for Classification of Alzheimer’s Disease Using Deep Neural Network and Brain Magnetic Resonance Imaging (MRI). Electronics 2023, 12, 676. [Google Scholar] [CrossRef]
- Balaji, P.; Chaurasia, M.A.; Bilfaqih, S.M.; Muniasamy, A.; Alsid, L.E.G. Hybridized Deep Learning Approach for Detecting Alzheimer’s Disease. Biomedicines 2023, 11, 149. [Google Scholar] [CrossRef]
- Gamberger, D.; Ženko, B.; Mitelpunkt, A.; Shachar, N.; Lavrač, N. Clusters of Male and Female Alzheimer’s Disease Patients in the Alzheimer’s Disease Neuroimaging Initiative (ADNI) Database. Brain Inf. 2016, 3, 169–179. [Google Scholar] [CrossRef] [Green Version]
- Kurdi, B.; Lozano, S.; Banaji, M.R. Introducing the Open Affective Standardized Image Set (OASIS). Behav. Res. Methods 2017, 49, 457–470. [Google Scholar] [CrossRef] [PubMed]
- Manaswi, N.K.; Manaswi, N.K. Understanding and Working with Keras. In Deep Learning with Applications Using Python: Chatbots and Face, Object, and Speech Recognition with TensorFlow and Keras; Apress: Berkeley, CA, USA, 2018; pp. 31–43. [Google Scholar]
- Zhang, Z. Improved Adam Optimizer for Deep Neural Networks. In Proceedings of the 2018 IEEE/ACM 26th International Symposium on Quality of Service (IWQoS), Banff, AB, Canada, 4–6 June 2018; pp. 1–2. [Google Scholar]
- van der Gaag, M.; Hoffman, T.; Remijsen, M.; Hijman, R.; de Haan, L.; van Meijel, B.; van Harten, P.N.; Valmaggia, L.; de Hert, M.; Cuijpers, P.; et al. The Five-Factor Model of the Positive and Negative Syndrome Scale II: A Ten-Fold Cross-Validation of a Revised Model. Schizophr. Res. 2006, 85, 280–287. [Google Scholar] [CrossRef] [PubMed]
- Sethuraman, S.K.; Malaiyappan, N.; Ramalingam, R.; Basheer, S.; Rashid, M.; Ahmad, N. Predicting Alzheimer’s Disease Using Deep Neuro-Functional Networks with Resting-State fMRI. Electronics 2023, 12, 1031. [Google Scholar] [CrossRef]
- Shojaei, S.; Abadeh, M.S.; Momeni, Z. An evolutionary explainable deep learning approach for Alzheimer’s MRI classification. Expert Syst. Appl. 2023, 220, 119709. [Google Scholar] [CrossRef]


| Authors and Reference | Methodology | Disadvantages |
|---|---|---|
| Menagadevi et al. [8] (2023) | Pooling residual autoencoder + ELM |
|
| Murugan et al. [9] (2021) | Preprocessing + CNN + RMS |
|
| Loddo et al. [10] (2022) | Pretrained models + Ensemble classifier |
|
| Sharma et al. [11] (2022) | Pretrained models + SVM |
|
| Mohammed et al. [12] (2021) | Pretrained models + SVM | |
| Balasundaram et al. [13] (2023) | Segmentation + Pretrained models |
|
| Bangyal et al. [14] (2022) | CNN |
|
| Ahmed et al. [15] (2022) | Preprocessing + CNN + optimization method |
|
| Tuvshinjargal and Hwang [16] (2022) | Preprocessing + pretrained model |
|
| Hazarika et al. [33] (2023) | Preprocessing + 2D CNN and 3D CNN |
|
| Balaji et al. [34] (2023) | 3D CNN + LSTM |
|
| Hu et al. [22] (2023) | Pretrained model + CNN |
|
| Mild Demented | Moderate Demented | Non-Demented | Very Mild Demented | |
|---|---|---|---|---|
| Train | 717 | 52 | 2560 | 1792 |
| Test | 179 | 12 | 640 | 448 |
| Dataset | Number of Subjects | Number of Classes | Size on Desktop | Availability |
|---|---|---|---|---|
| ADNI [35] | 822 | 3 | 5 GB | Need Access |
| OASIS [36] | 416 | 2 | 1.5 GB | Need Access |
| Kaggle [29] | 6400 | 4 | 32 MB | Publicly Available |
| Precision | Recall | F1-Score | |
|---|---|---|---|
| 0 | 98.81% | 99.63% | 99.21% |
| 1 | 99.63% | 98.81% | 99.21% |
| Accuracy | 99.22% | ||
| Macro Avg | 99.22% | ||
| Weighted Avg | 99.22% | ||
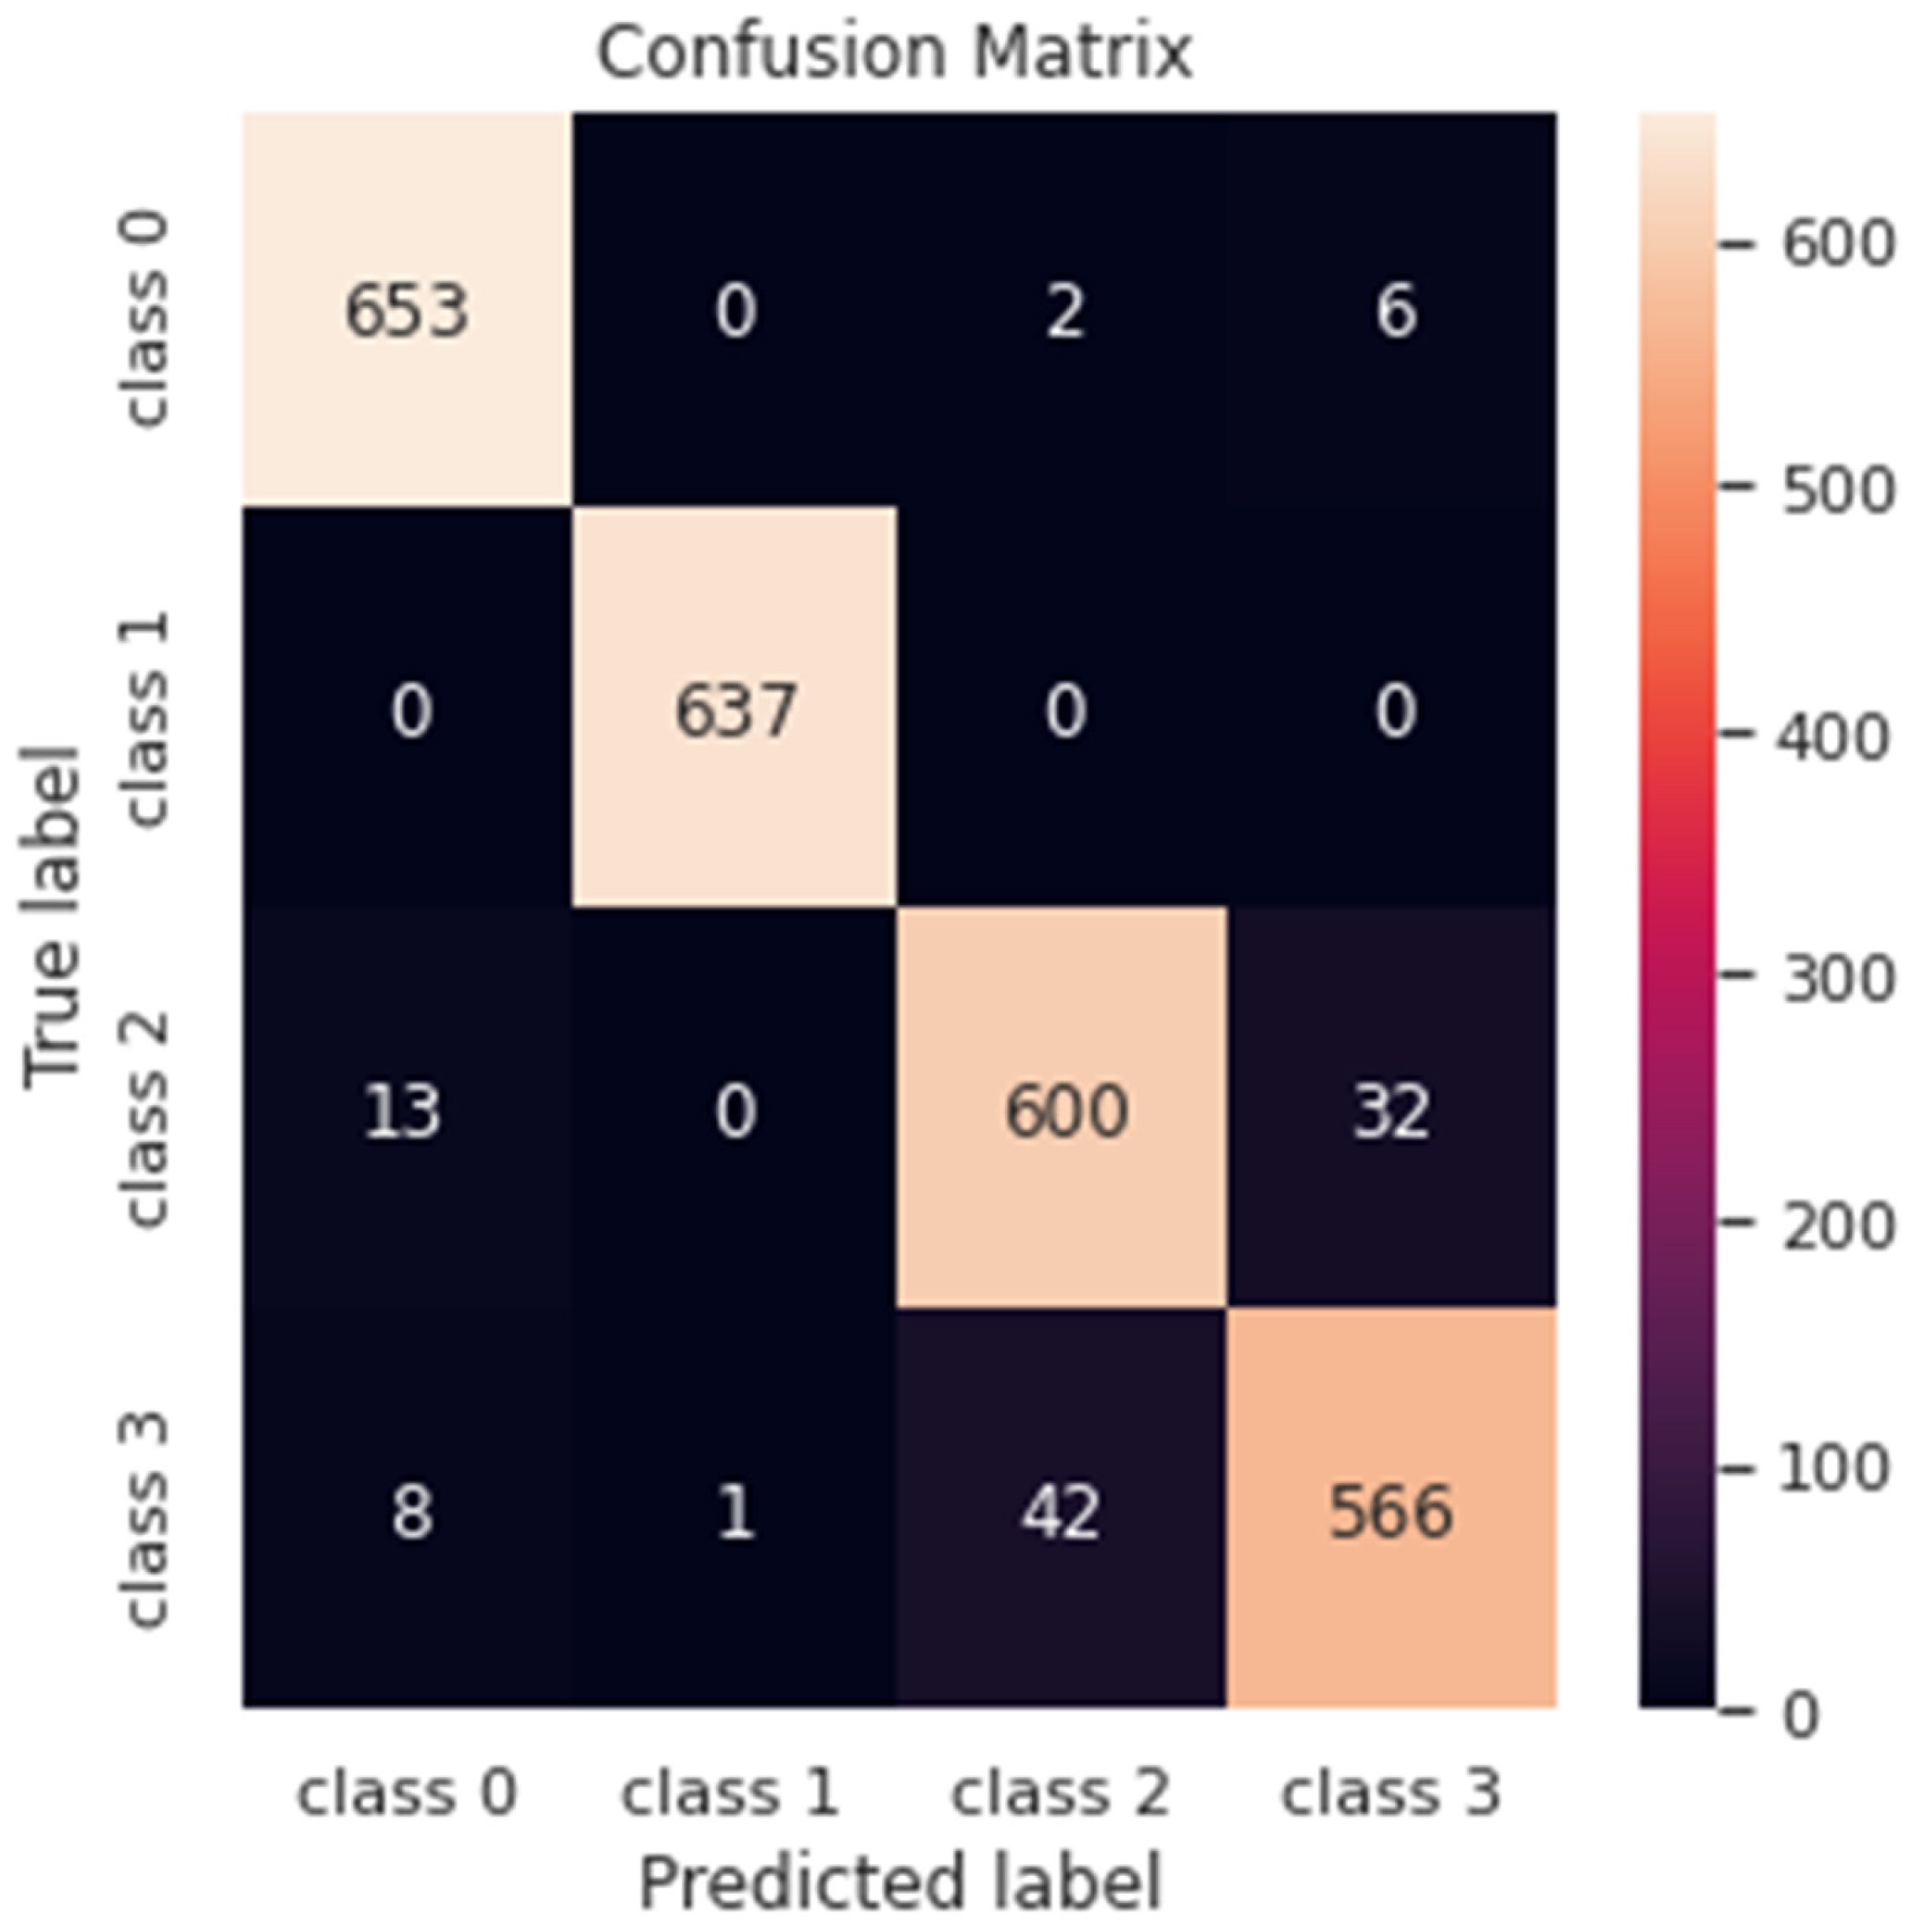
| Precision | Recall | F1-Score | |
|---|---|---|---|
| 0 | 96.88% | 98.78% | 97.82% |
| 1 | 100% | 100% | 100% |
| 2 | 93.16% | 93.02% | 93.08% |
| 3 | 93.70% | 91.73% | 92.70% |
| Accuracy | 95.93% | ||
| Macro Avg | 95.93% | ||
| Weighted Avg | 95.93% | ||
| Reference/Author | Methodology | Performance |
|---|---|---|
| Menagadevi et al. [8] (2023) | Deep residual autoencoder + ELM | Accuracy = 98.97% |
| Loddo et al. [10] (2022) | Deep-Ensemble | Accuracy = 96.57% Sensitivity = 96.57% Specificity = 98.28% F1-score = 96.57% |
| Tuvshinjargal and Hwang [16] (2022) | Pretrained model | Accuracy = 0.774 Precision = 0.774 Recall = 0.785 F1-score = 0.779 |
| Proposed (2023) | Lightweight deep model | Accuracy = 99.22% Precision = 99.22% Recall = 99.22% F1-score = 99.21% |
| Reference/Author | Methodology | Performance |
|---|---|---|
| Murugan et al. [9] (2021) | CNN | Accuracy = 95.23% Precision = 96% Recall = 95% F1-score = 95.27% |
| Loddo et al. [10] (2022) | Deep ensemble | Accuracy = 97.71% Sensitivity = 96.67% Specificity = 98.22% |
| Sharma et al. [11] (2022) | Pretrained deep models | Accuracy = 91.75% |
| Mohammed et al. [12] (2021) | Pretrained deep model + SVM | Accuracy = 94.80% Sensitivity = 93% Specificity = 97.75% |
| Balasundaram et al. [13] (2023) | Pretrained deep models | Accuracy = 94.10% Precision = 96.50% Recall = 94.75% F1-score = 95.5% |
| Bangyal et al. [14] (2022) | CNN | Accuracy = 94.63% Precision = 94.75% Recall = 94.75% F1-score = 94.50% |
| Ahmed et al. [15] (2022) | CNN | Accuracy = 90% Precision = 91.34% Recall = 87.34% F1-score = 88.09% |
| Proposed (2023) | Lightweight deep model | Accuracy = 95.93% Precision = 95.93% Recall = 95.88% F1-score = 95.90% |
| Reference/Authors | Methodology | Database | Classification Task | Performance |
|---|---|---|---|---|
| Hazarika et al. [33] (2023) | Hybrid pretrained models | ADNI [35] | Multi-classification | Accuracy = 88% Precision = 92% Recall = 90% F1-score = 91% |
| Balaji et al. [34] (2023) | CNN + LSTM | Kaggle [29] | Binary classification | Accuracy = 98.50% Precision = 94.80% Recall = 98% |
| Hu et al. [22] (2023) | Pretrain model + Transformer | ADNI [35] | Multi-classification | Accuracy = 77.20% Sensitivity = 79.97% Specificity = 71.59% |
| Sethuraman et al. [40] (2023) | Hybrid pretrained models | ADNI [35] | Binary classification | Accuracy = 96.61% Sensitivity = 94.34% Specificity = 94.96% |
| Shojaei et al. [41] (2023) | 3D CNN | ADNI [35] | Binary classification | Accuracy = 96.60% |
| EL-Geneedy et al. [23] (2023) | CNN | OASIS [36] | Binary classification | Accuracy = 99.68% |
| Proposed | Lightweight CNN | Kaggle [29] | Binary classification and multi-classification | For binary classification: Accuracy = 99.22% Precision = 99.22% Recall = 99.22% F1-score = 99.21% For multi-classification: Accuracy = 95.93% Precision = 95.93% Recall = 95.88% F1-score = 95.90% |
| Steps | Complexity in Big-O Notation |
|---|---|
| Handling the unbalanced problem of the dataset | Depends on the size of the data, which is not more than O(n) |
| The inner steps (number of parameters and layers) | O(m) ∗ O(1) Where O(1) is the time required for each layer of the proposed model |
| Training the deep learning model | O(m ∗ n), where m is the number of training examples and n is the number of pixels in each input image |
| The total big-O | O(m ∗ n) |
Disclaimer/Publisher’s Note: The statements, opinions and data contained in all publications are solely those of the individual author(s) and contributor(s) and not of MDPI and/or the editor(s). MDPI and/or the editor(s) disclaim responsibility for any injury to people or property resulting from any ideas, methods, instructions or products referred to in the content. |
© 2023 by the authors. Licensee MDPI, Basel, Switzerland. This article is an open access article distributed under the terms and conditions of the Creative Commons Attribution (CC BY) license (https://creativecommons.org/licenses/by/4.0/).
Share and Cite
El-Latif, A.A.A.; Chelloug, S.A.; Alabdulhafith, M.; Hammad, M. Accurate Detection of Alzheimer’s Disease Using Lightweight Deep Learning Model on MRI Data. Diagnostics 2023, 13, 1216. https://doi.org/10.3390/diagnostics13071216
El-Latif AAA, Chelloug SA, Alabdulhafith M, Hammad M. Accurate Detection of Alzheimer’s Disease Using Lightweight Deep Learning Model on MRI Data. Diagnostics. 2023; 13(7):1216. https://doi.org/10.3390/diagnostics13071216
Chicago/Turabian StyleEl-Latif, Ahmed A. Abd, Samia Allaoua Chelloug, Maali Alabdulhafith, and Mohamed Hammad. 2023. "Accurate Detection of Alzheimer’s Disease Using Lightweight Deep Learning Model on MRI Data" Diagnostics 13, no. 7: 1216. https://doi.org/10.3390/diagnostics13071216