
Diabetic Retinopathy and Diabetic Macular Edema Detection Using Ensemble Based Convolutional Neural Networks
 , , and
Abstract
:1. Introduction
- To minimize the noise level in the input image by performing effective preprocessing of the image;
- To maximize the precise identification of features from the preprocessed image by enhancing the contrast level;
- To maximize the accuracy of detection by incorporating the segmentation of lesions in the blood vessels;
- Effectively classify the images into three classes based on the extraction of significant features;
- To determine the severity of the disease based on the variation in the intensity of the features for diagnosis.
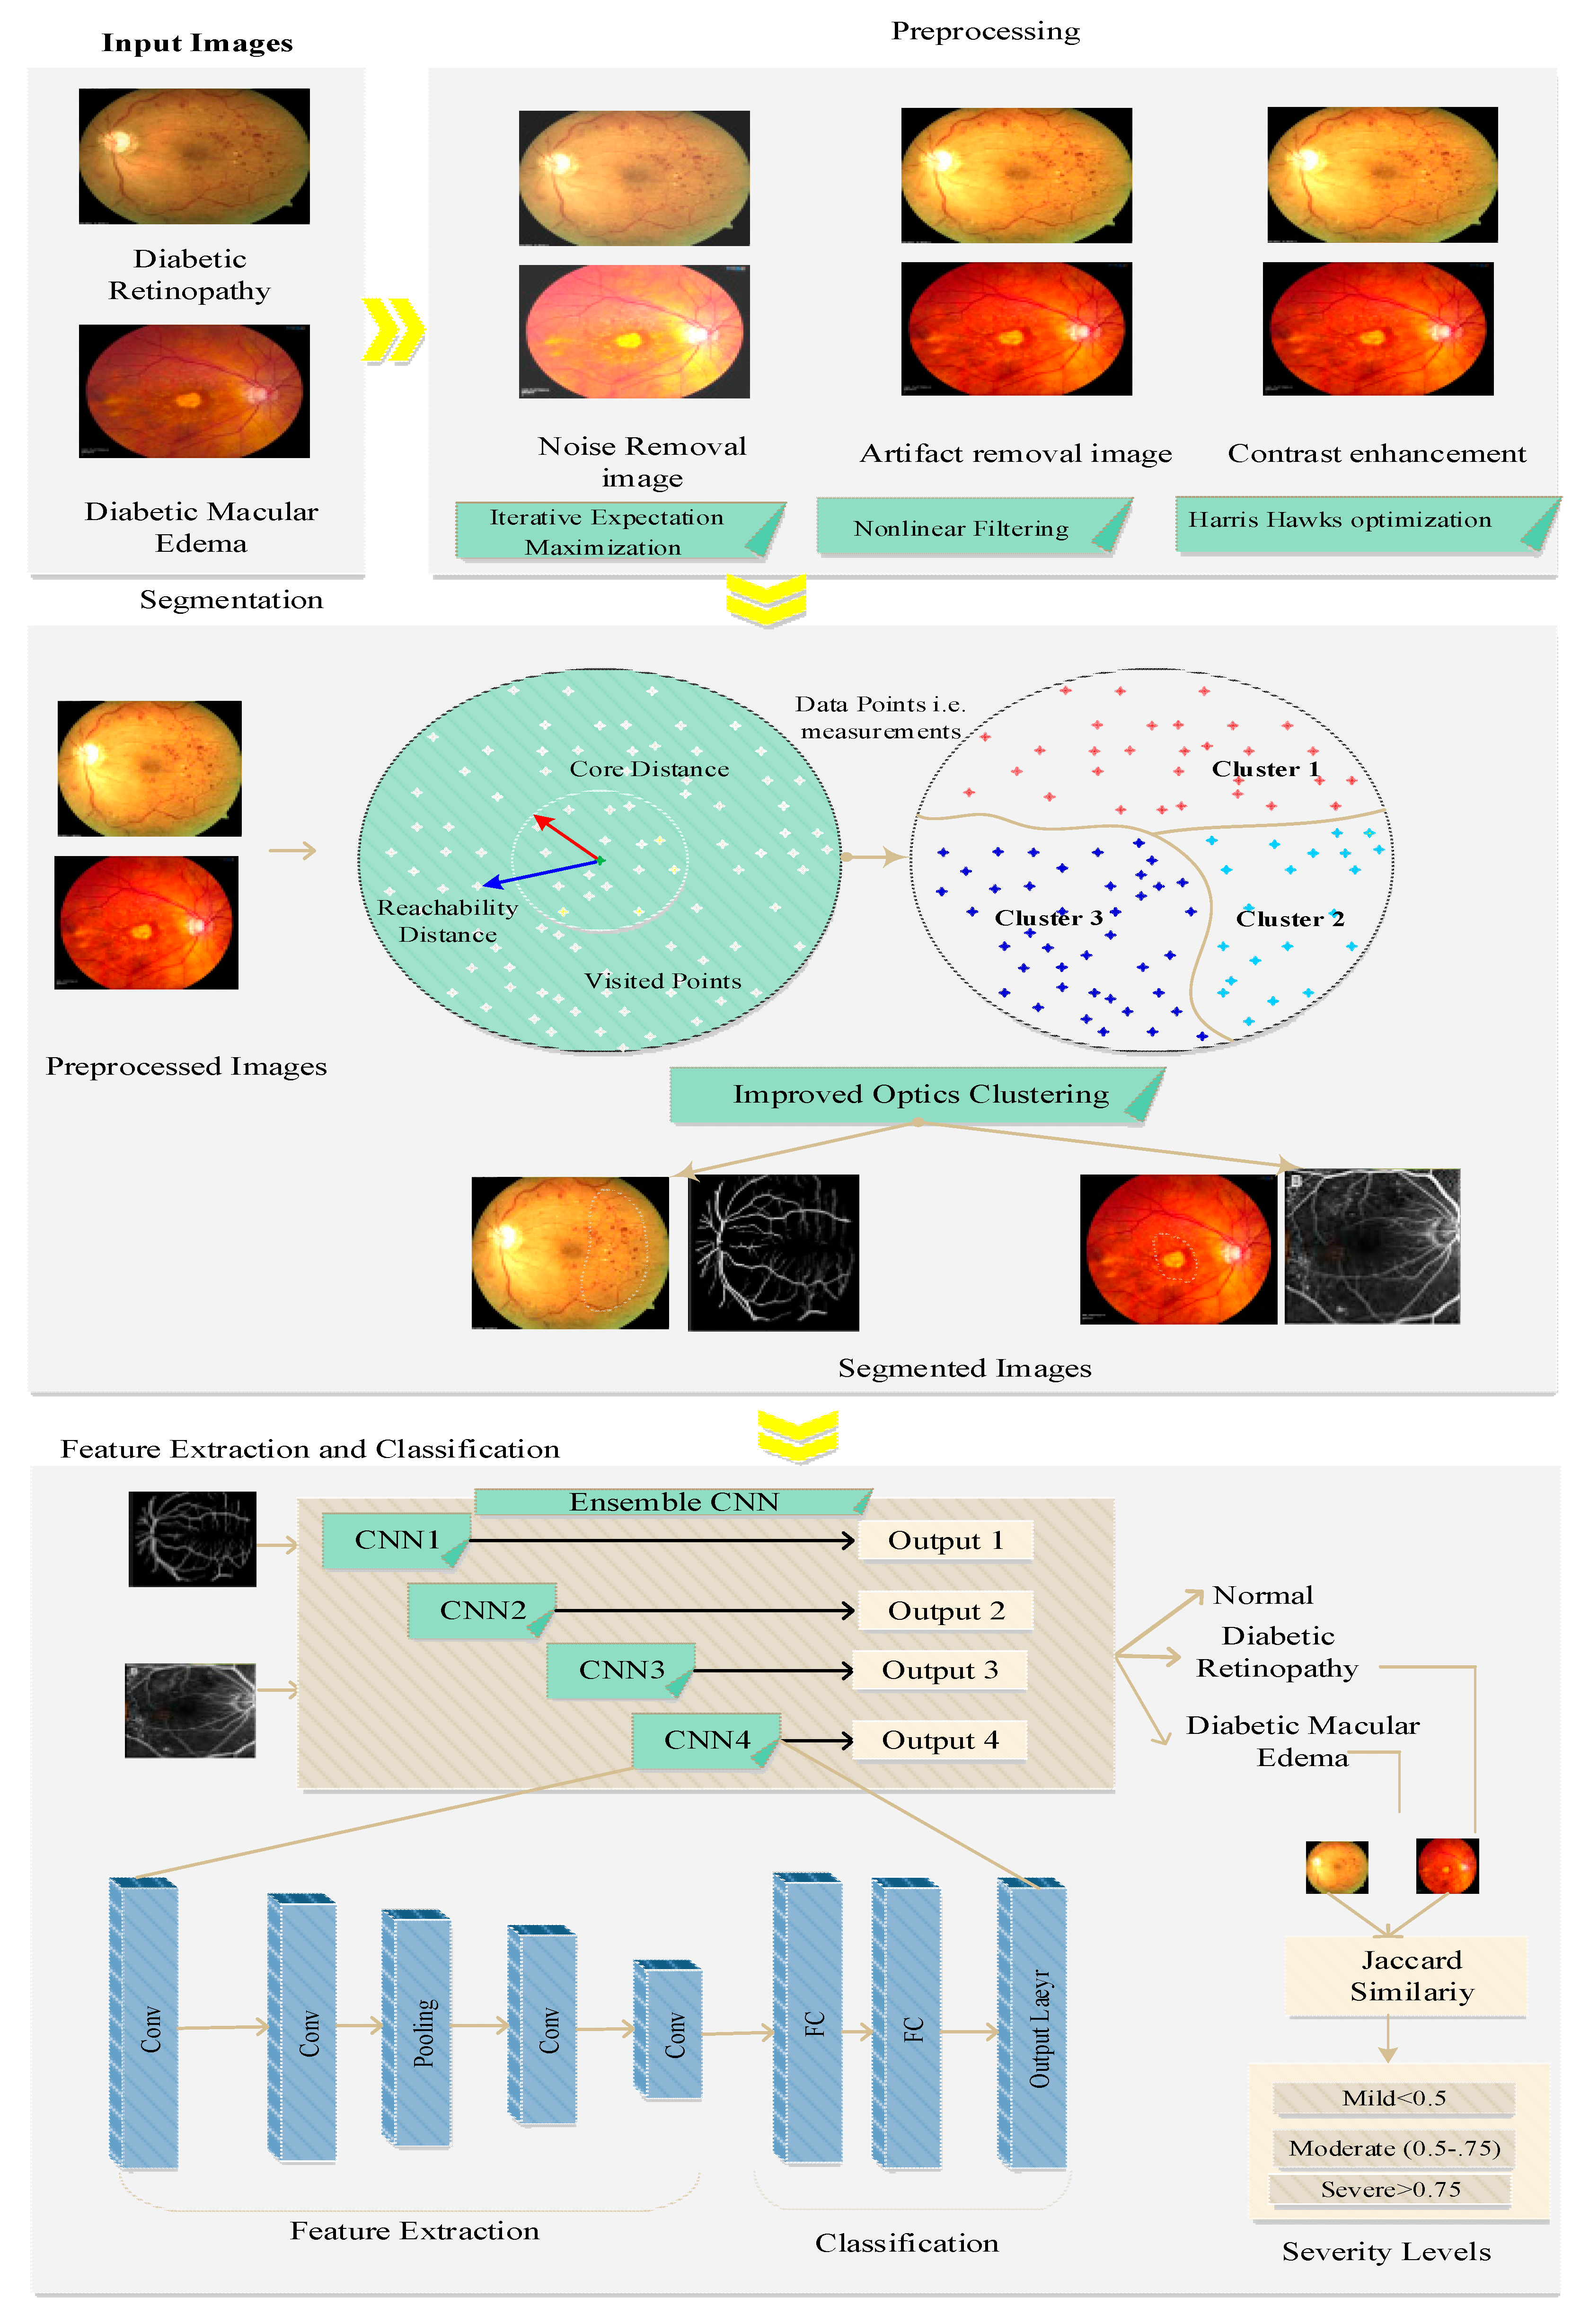
- In our work, we performed preprocessing that included three processes such as noise removal using iterative expectation maximization, artifact removal using nonlinear filtering, and contrast enhancement using Harris hawks optimization; the preprocessed image was used to enhance the quality of the images, which led to high segmentation and detection accuracy. Preprocessing was performed to reduce noise and artifacts and improve the contrast, which increased the efficiency of feature extraction and reduced the false detection rate.
- Segmentation was performed before feature extraction and classification, which increased the detection accuracy. For segmentation, we proposed improved OPTICS clustering, which considers particular regions of interest and takes less time for segmentation, thus reducing latency and increasing the disease detection accuracy.
- Improved OPTICS clustering overcomes misalignment problems due to considering the particular region of interest, thus increasing the segmentation and detection accuracy.
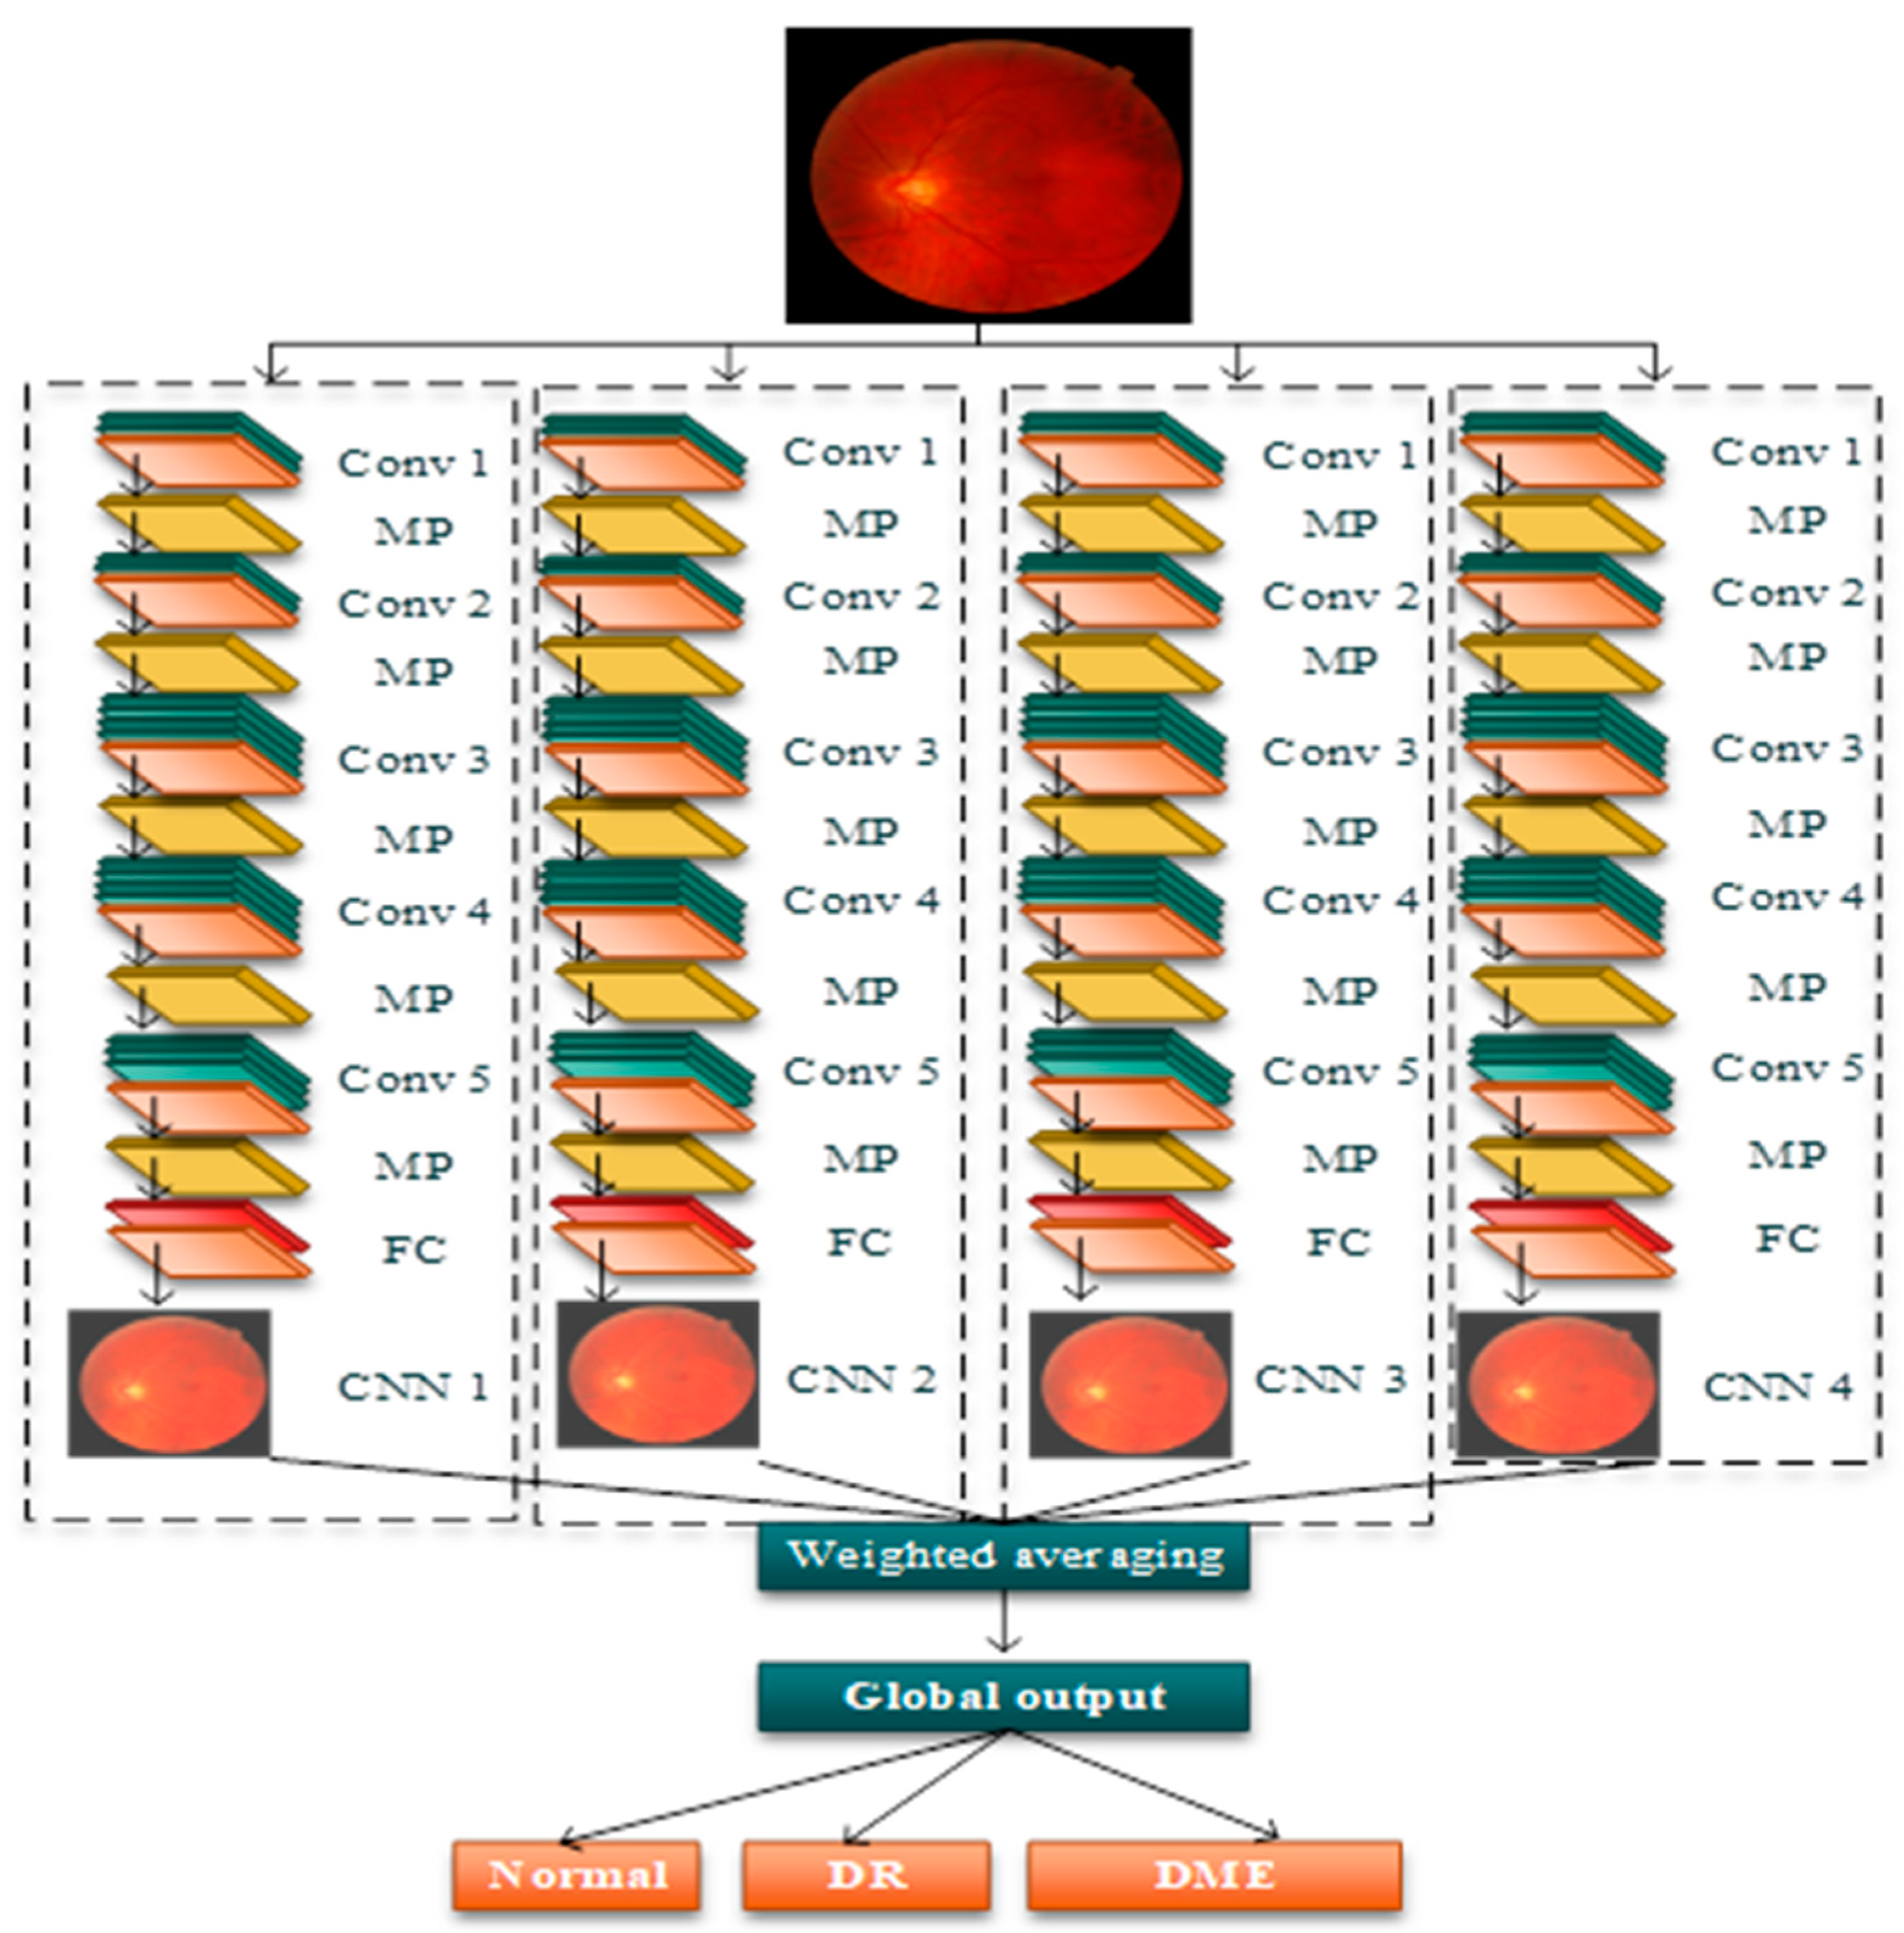
- The extraction of features was carried out in the segmented images obtained from the previous process. Features such as micro-aneurysms, hemorrhages, and hard exudates, collectively termed as structural features, are considered the essential features; along with this, the shape features, orientation features, and color features are also considered for the classification of DR and DME. The ensemble CNN architecture was implemented for this purpose, which outperformed the ensemble CNN class prediction. From this, the classification of images was carried out in several classes, namely, normal, DR, and DME. Furthermore, the severity of the disease was computed by using conditional entropy in which the number of lesions is considered for the threshold generation. Based on the threshold, the severity level of the disease was classified into three classes: mid, moderate, and severe.
- The proposed research work is evaluated in terms of performance metrics such as accuracy, precision, recall, F-score, computation time, and error rate.
2. Related Work
3. Problem Statement
- Difficulty in feature differentiation: The detection of DR and DME is based on various features such as hard exudates, hemorrhages, and micro-aneurysms, but the differentiation of these minute features from each other is a hard task, which degrades the computation of the accurate severity of diseases.
- Class Overlapping: Current techniques also consider illness severity; however, the sparse training data for each severity leads to class imbalance issues that degrade the classification accuracy.
- Inadequate preprocessing: Using the current methods for effective contrast enhancement with traditional preprocessing leads to difficulties distinguishing features from the background.
- Here, preprocessing was performed to enhance the quality of the retinal images; however, the retina image still has noise due to the implementation of traditional contrast enhancement techniques, thus reducing the image quality, which leads to a high false detection and reduced detection accuracy.
- DCNN is used for feature extraction and the detection of nonproliferated diabetic retinopathy. Still, DCNN focuses on the whole image for the extraction of features without any particular region of interest, thus increasing the high latency for feature detection.
- The PCA algorithm was used to reduce the dimensionality, but the number of principal components must be selected otherwise it may cause information loss, thus reducing the detection accuracy.
- Here, the Otsu thresholding method was used for vessel segmentation, which performed well; however, it did not provide an optimal result for noisy images. First, the noise is removed from the images, and then the thresholding is applied; otherwise, this method will fail, thus reducing the performance of vessel segmentation.
- The detection of diabetic retinopathy was carried out by performing the segmentation of neovessels in the retina. However, performing detection based on a single feature results in a high false detection rate.
- Here, the U-Net algorithm was also used for vessel segmentation, which takes a lot of time to learn the vessels from the retinal images at the middle layers, thus leading to high latency.
- Here, raw images were considered for the localization and segmentation process, thus reducing segmentation and detection accuracy due to low contrast and the presence of noise in the retinal images.
- Faster RCNN was implemented for the extraction of features but the lack of pixel-to-pixel alignment in the region of interest caused misalignment, resulting in the degradation of the detection accuracy.
- The proposed approach was used for diabetic-based disease detection in the eye, but the detection of various diseases from the limited number of trained images resulted in class imbalances.
- Here, the features were extracted from the noisy images, thus reducing the quality of the images and leading to poor feature extraction, thus increasing the macular edema’s false detection rate.
- The integration of the genetic algorithm and binary particle swarm optimization was used to determine the subset size. However, implementing these two algorithms increases the complexity and time consumption, thereby increasing the latency.
- DCNN was used for feature extraction and the detection of nonproliferated diabetic retinopathy, however, DCNN focuses on the whole image for the extraction of features without any particular region of interest, thus increasing the high latency for feature detection.
4. Proposed Model
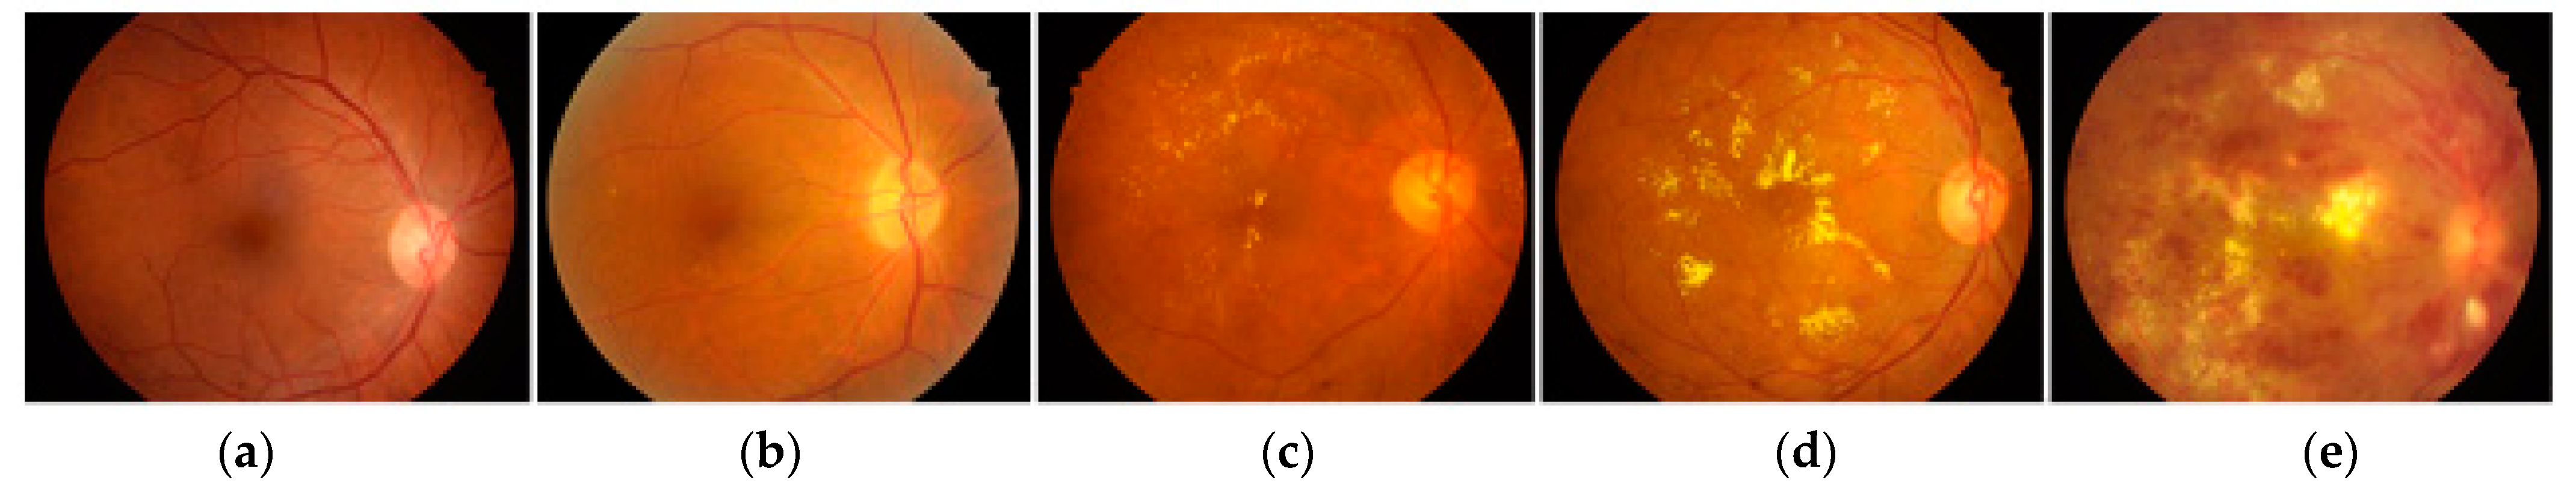
- IDRiD: Based on the presence of DR and DME disease, 516 images were loaded in the dataset. In addition, images were acquired through the field of view and stored in JPG format, and the size of each image was 800 KB. This dataset contained 81 color fundus images with the sign of DR. With this dataset, hard exudates (EX), microaneurysms (MA), soft exudates (SE), and hemorrhage (HE) based images are stored.
- MESSIDOR: This dataset was used, whose scope is to develop the DR and DME detection of images. In total, 1200 eye fundus images were used with the multiple pixel rates of 1440 × 960, 2240 × 1488, and 2304 × 1536.
4.1. Preprocessing
- E-step—This step determines the current estimate of parameters by creating a function for the expectation of log-likelihood. The expectation step is the base of the proposed IEM algorithm.
- M-step—This step is the final step that computes the parameters in such a way that the expected log-likelihood function can be maximized (i.e., the likelihood function determined in the E-step is maximized to calculate the parameters.
| Algorithm 1 Pseudocode for H2O |
Output: Optimal Threshold |
| Begin ); While (Stopping Condition Not Met) do Compute → fitness function )do using Equation (8); End For )Then Update position using Equation (9); End If )Then ) Update → position using Equation (10); )Then Update → position using Equation (11); )Then Update → position using Equation (12); )Then Update → position using Equation (13); End If End If End While End |
4.2. Blood Vessel Segmentation
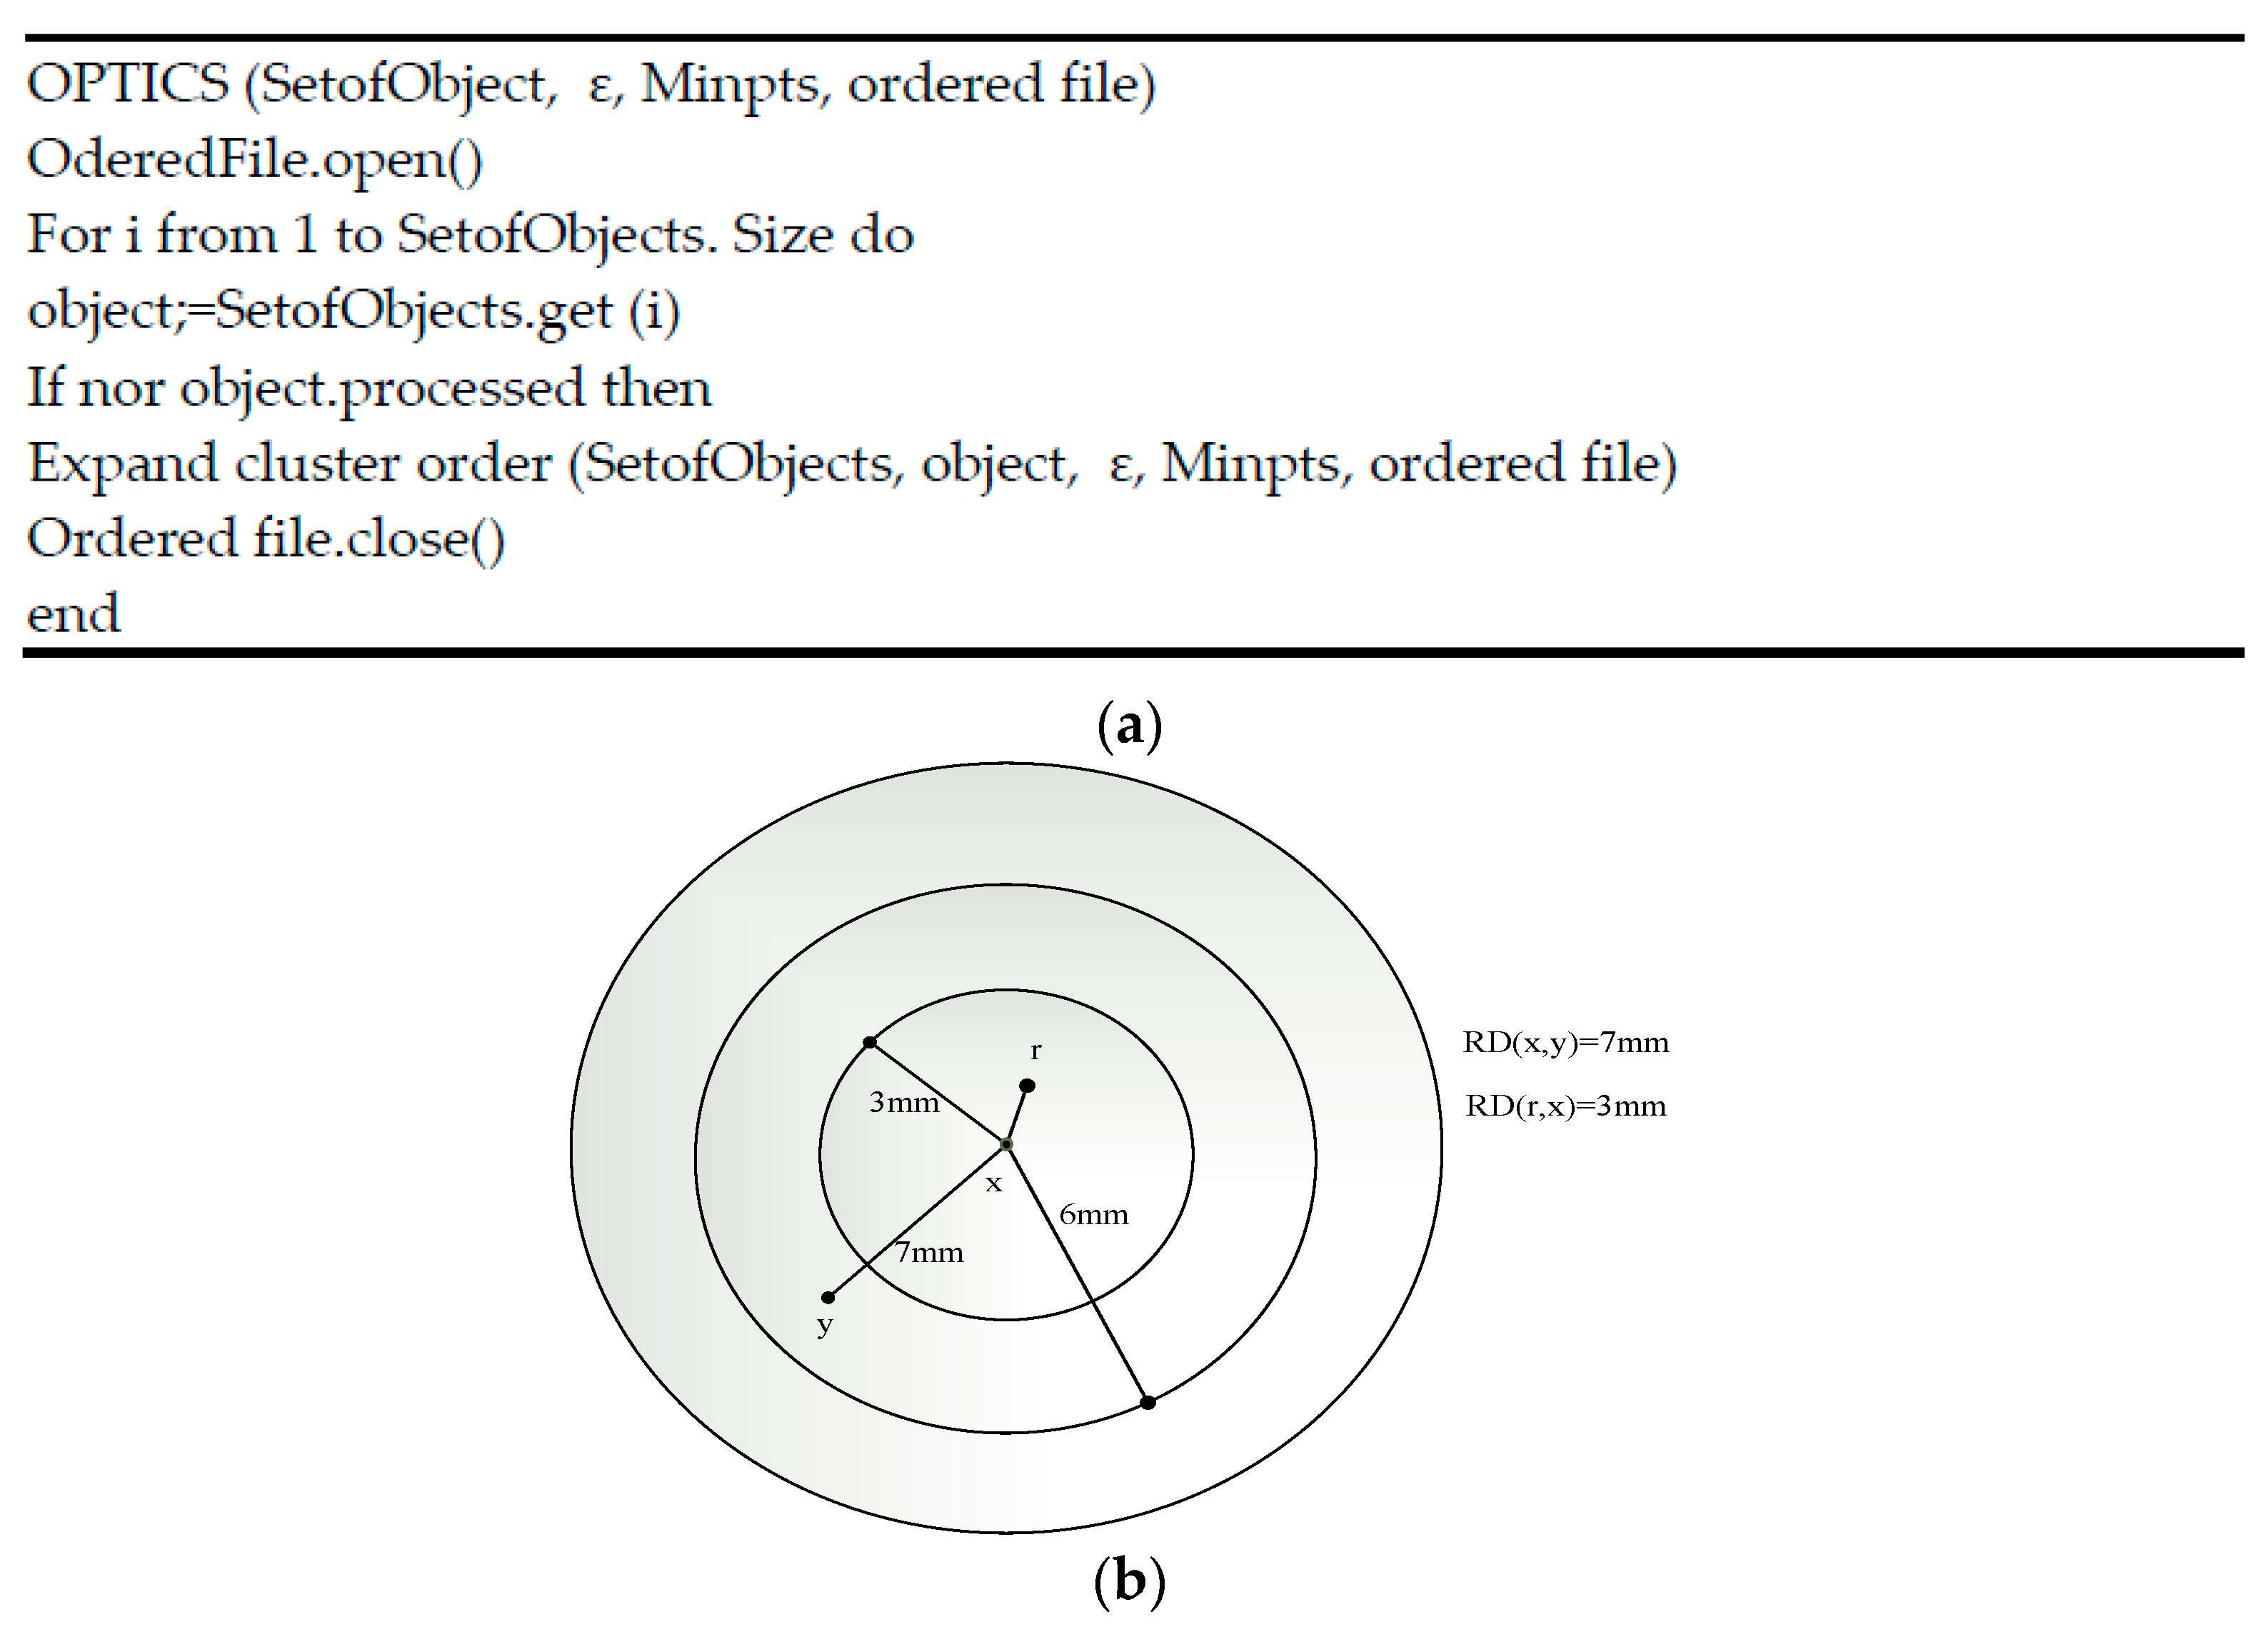
- Core distance: This represents the minimum values of the radius essential to classify the given point as a core point. If the considered point is not a core point, then its core distance is indeterminate.
- Reachability distance: This is represented with respect to another cluster data point. The reachability distance between two points (x,y) is the highest of the core distance and then the Euclidean distance between the two points (x, y). The reachability distance is not defined if the y point is not a core point. Figure 3 represents the calculation of the reachability distance. The general procedure of M-OPTICS is defined as follows:
5. Results and Discussion
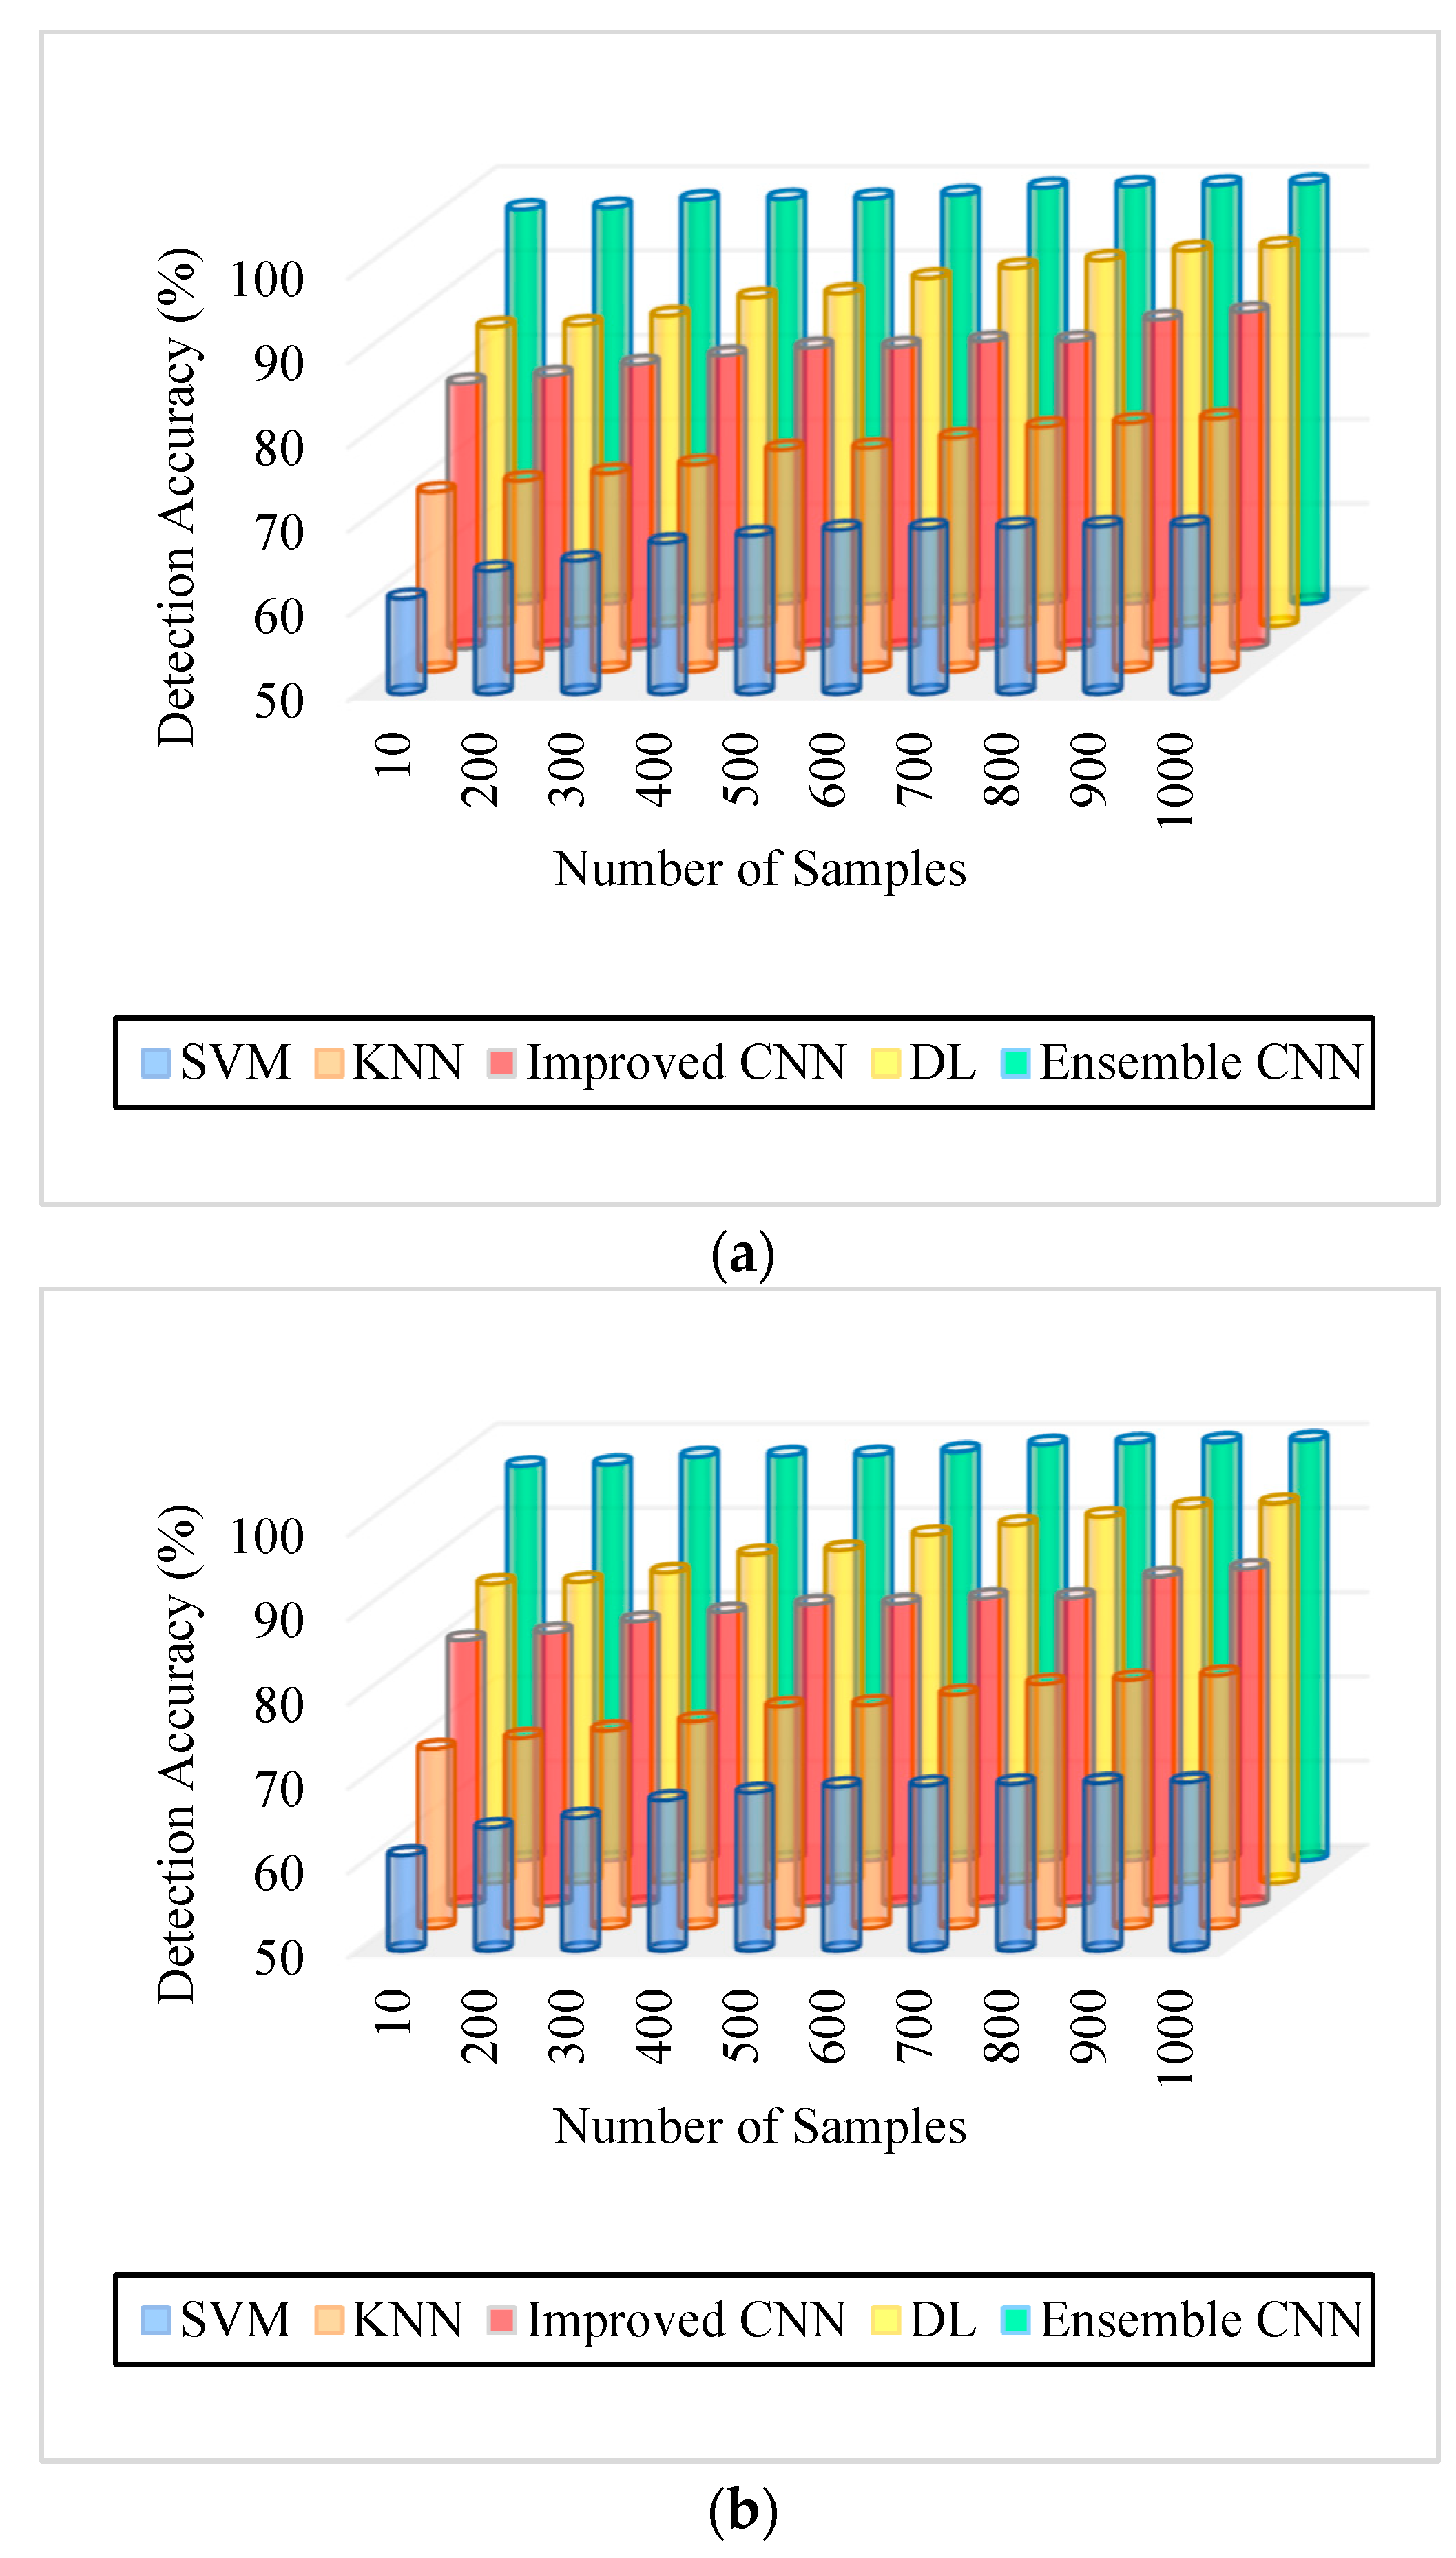
5.1. Accuracy
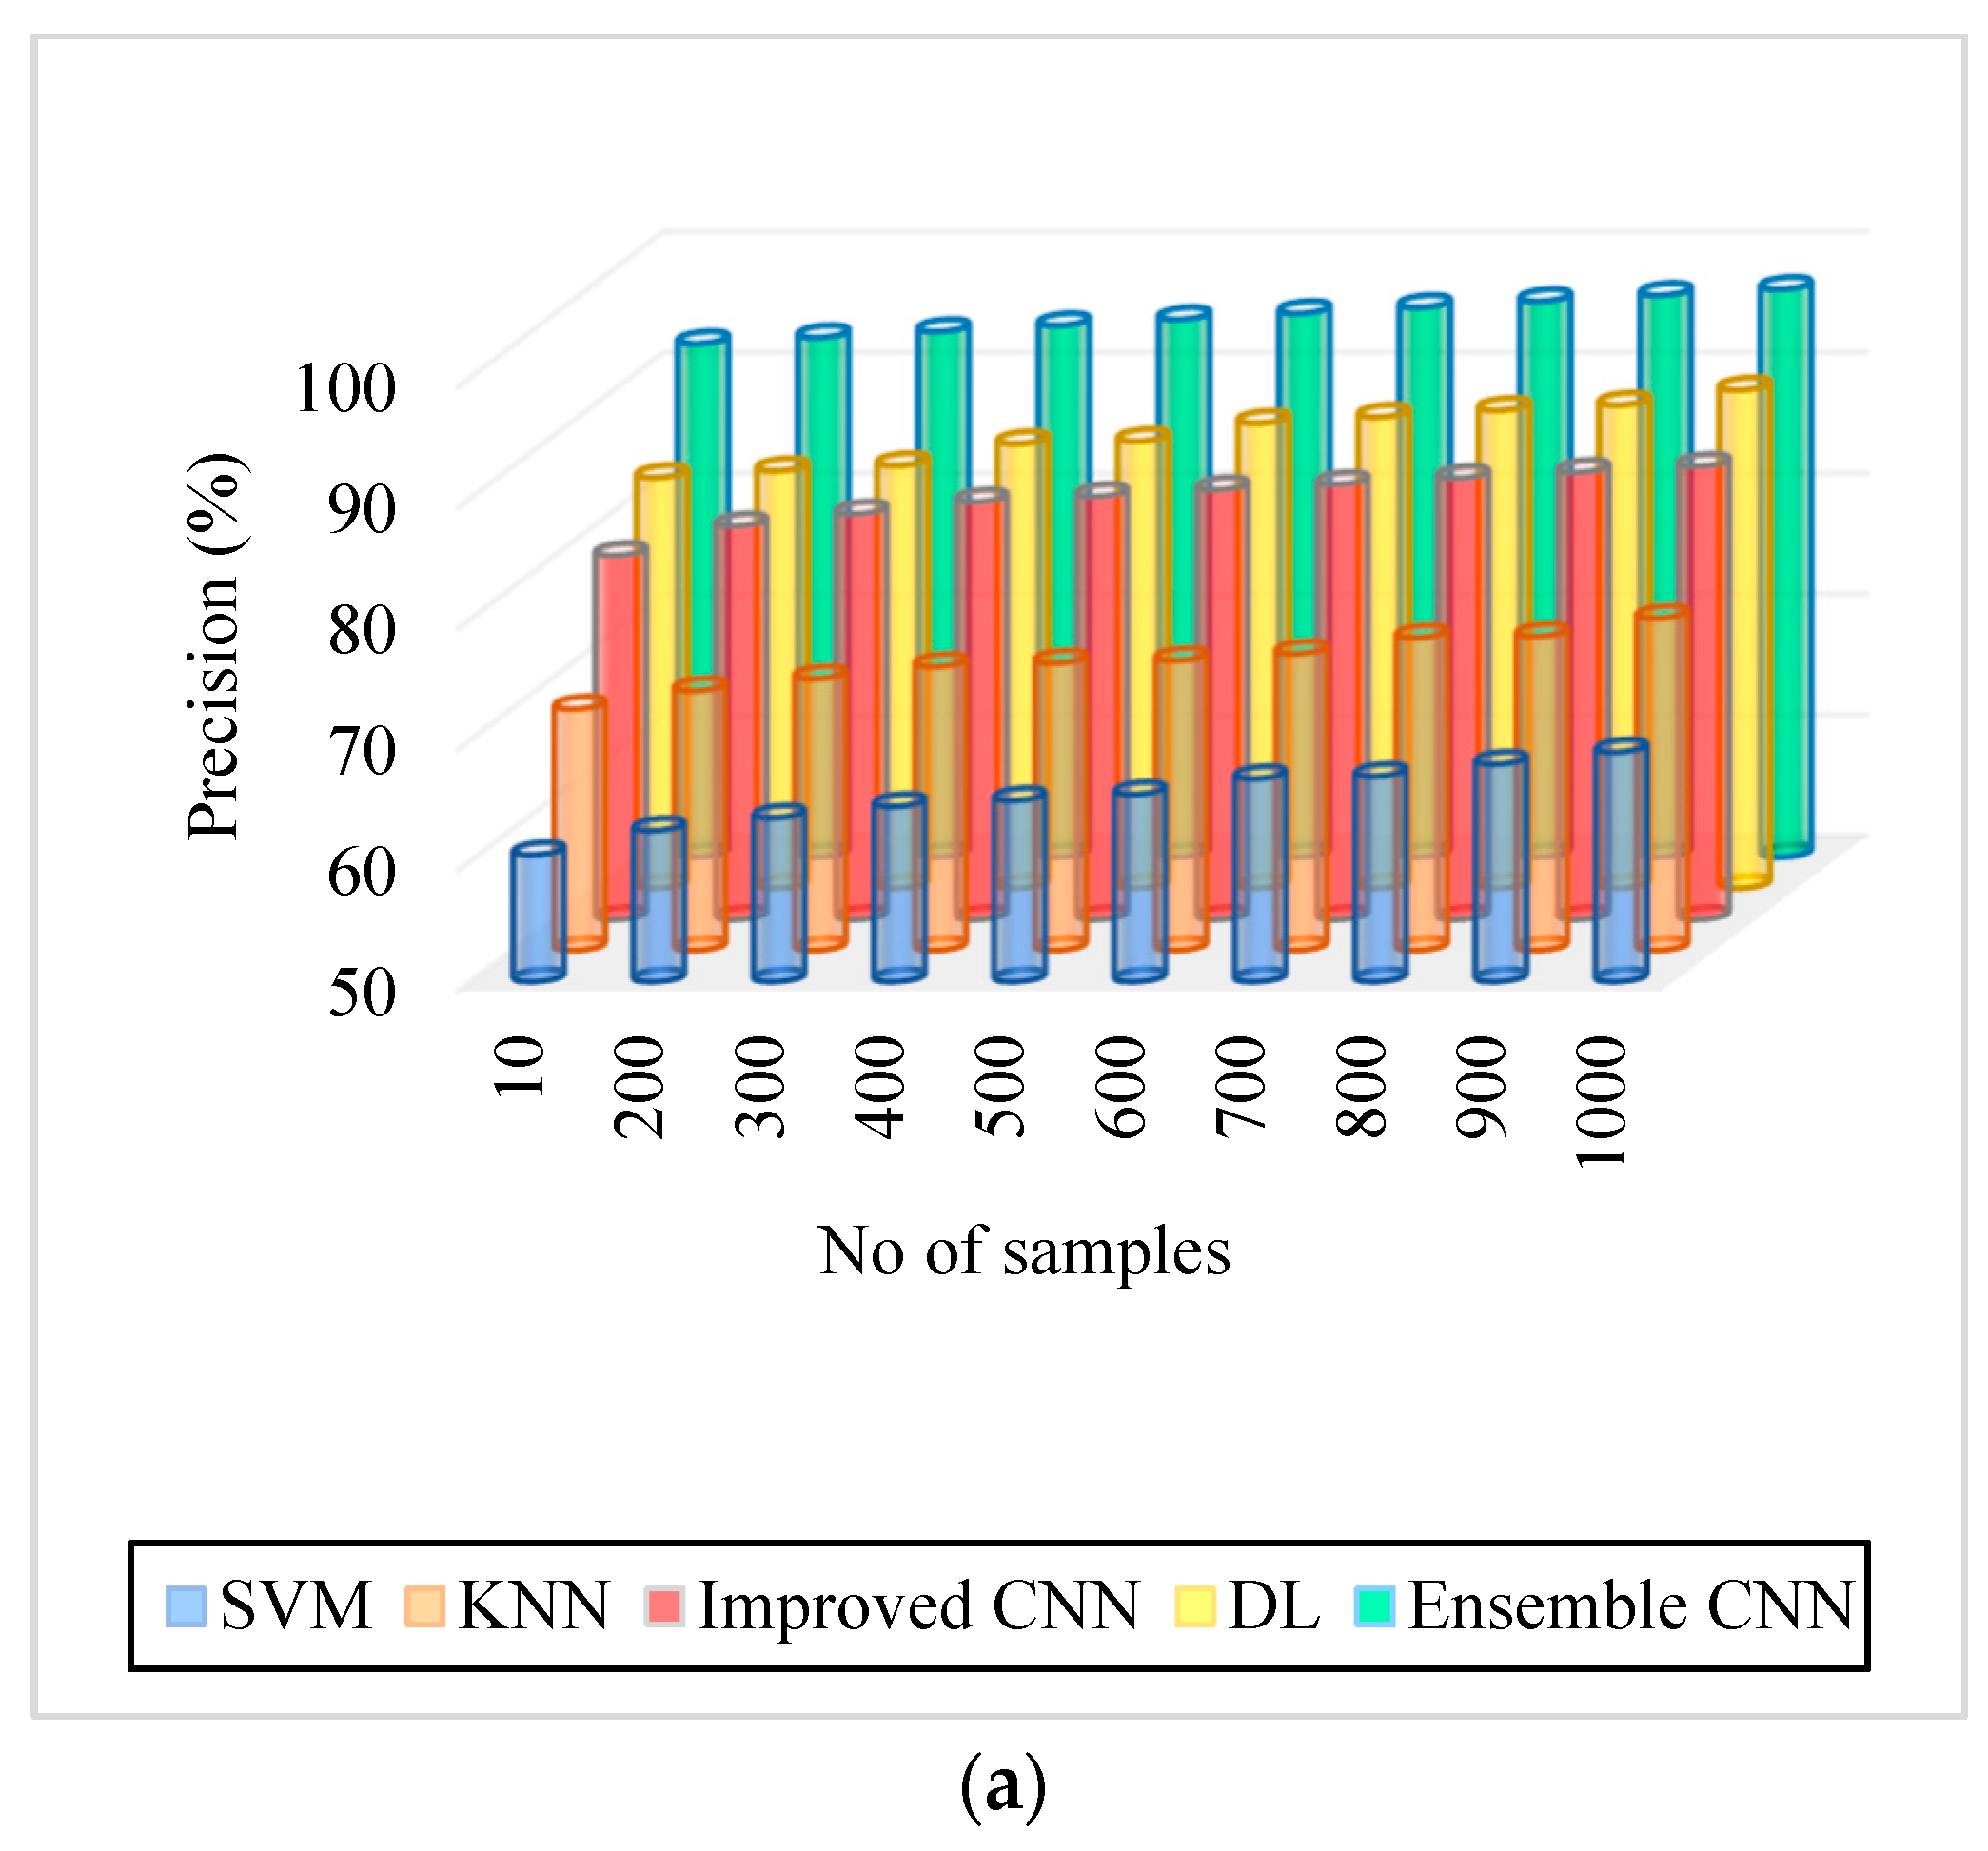
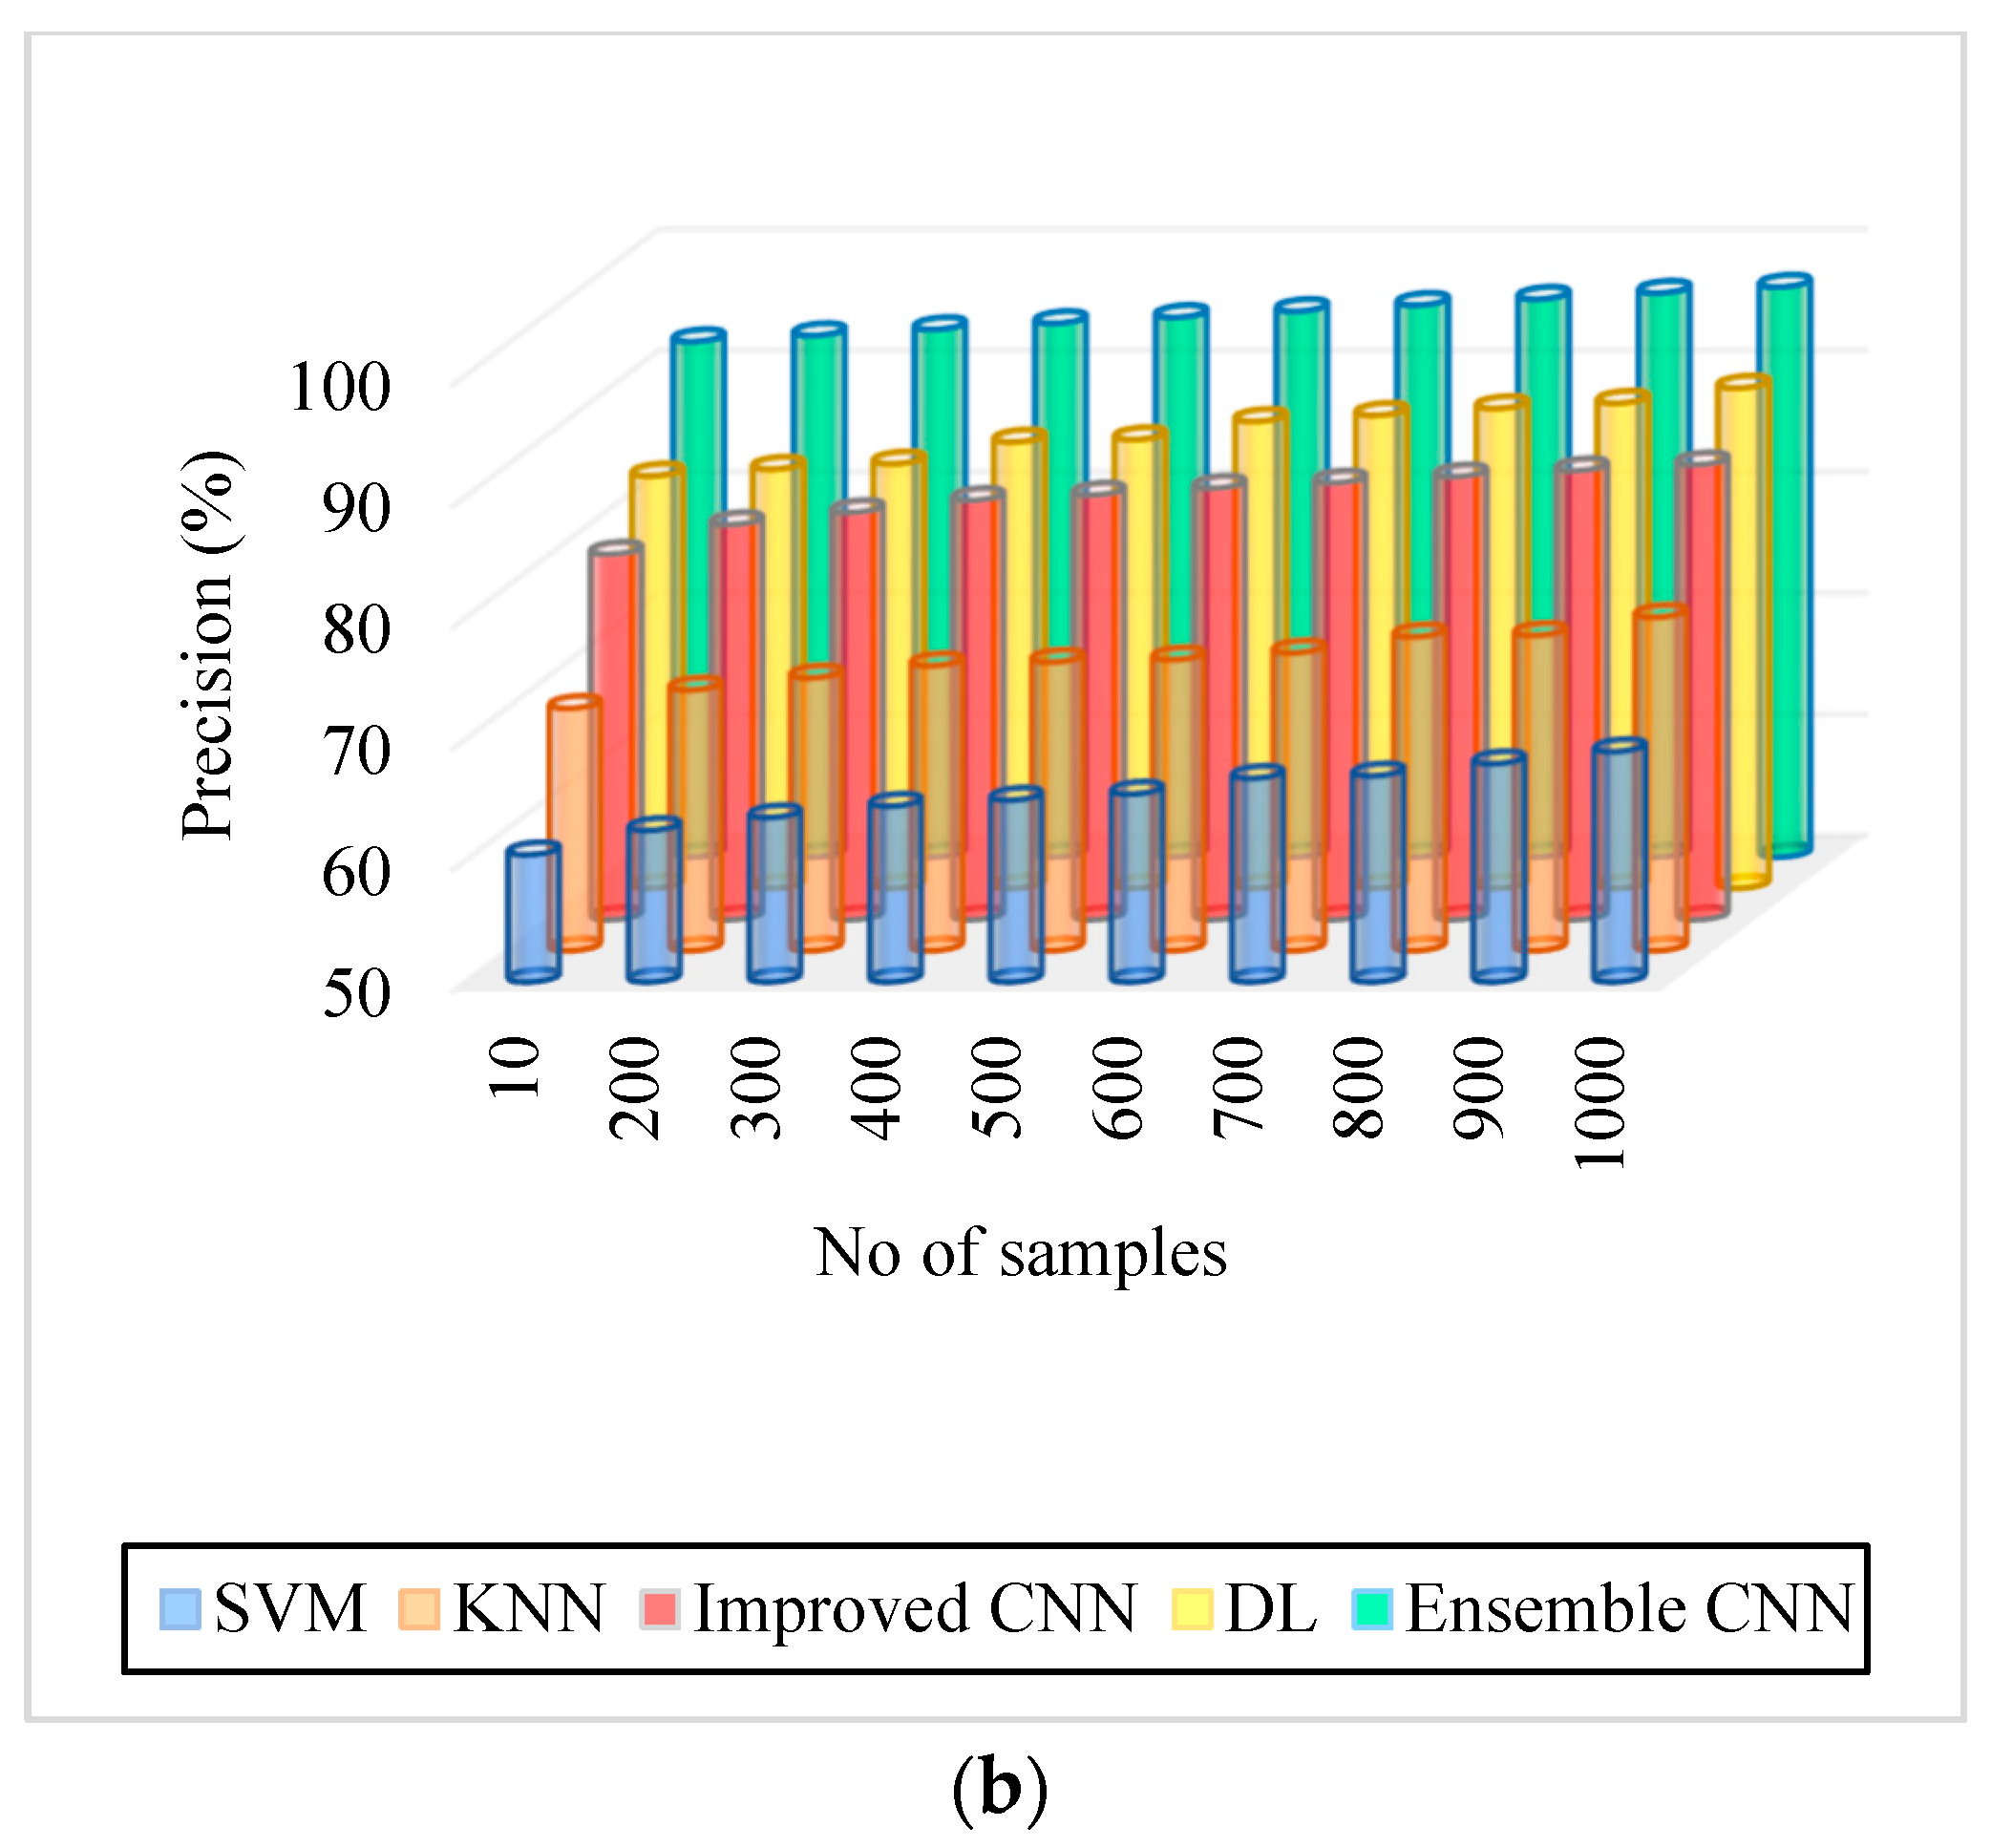
5.2. Precision
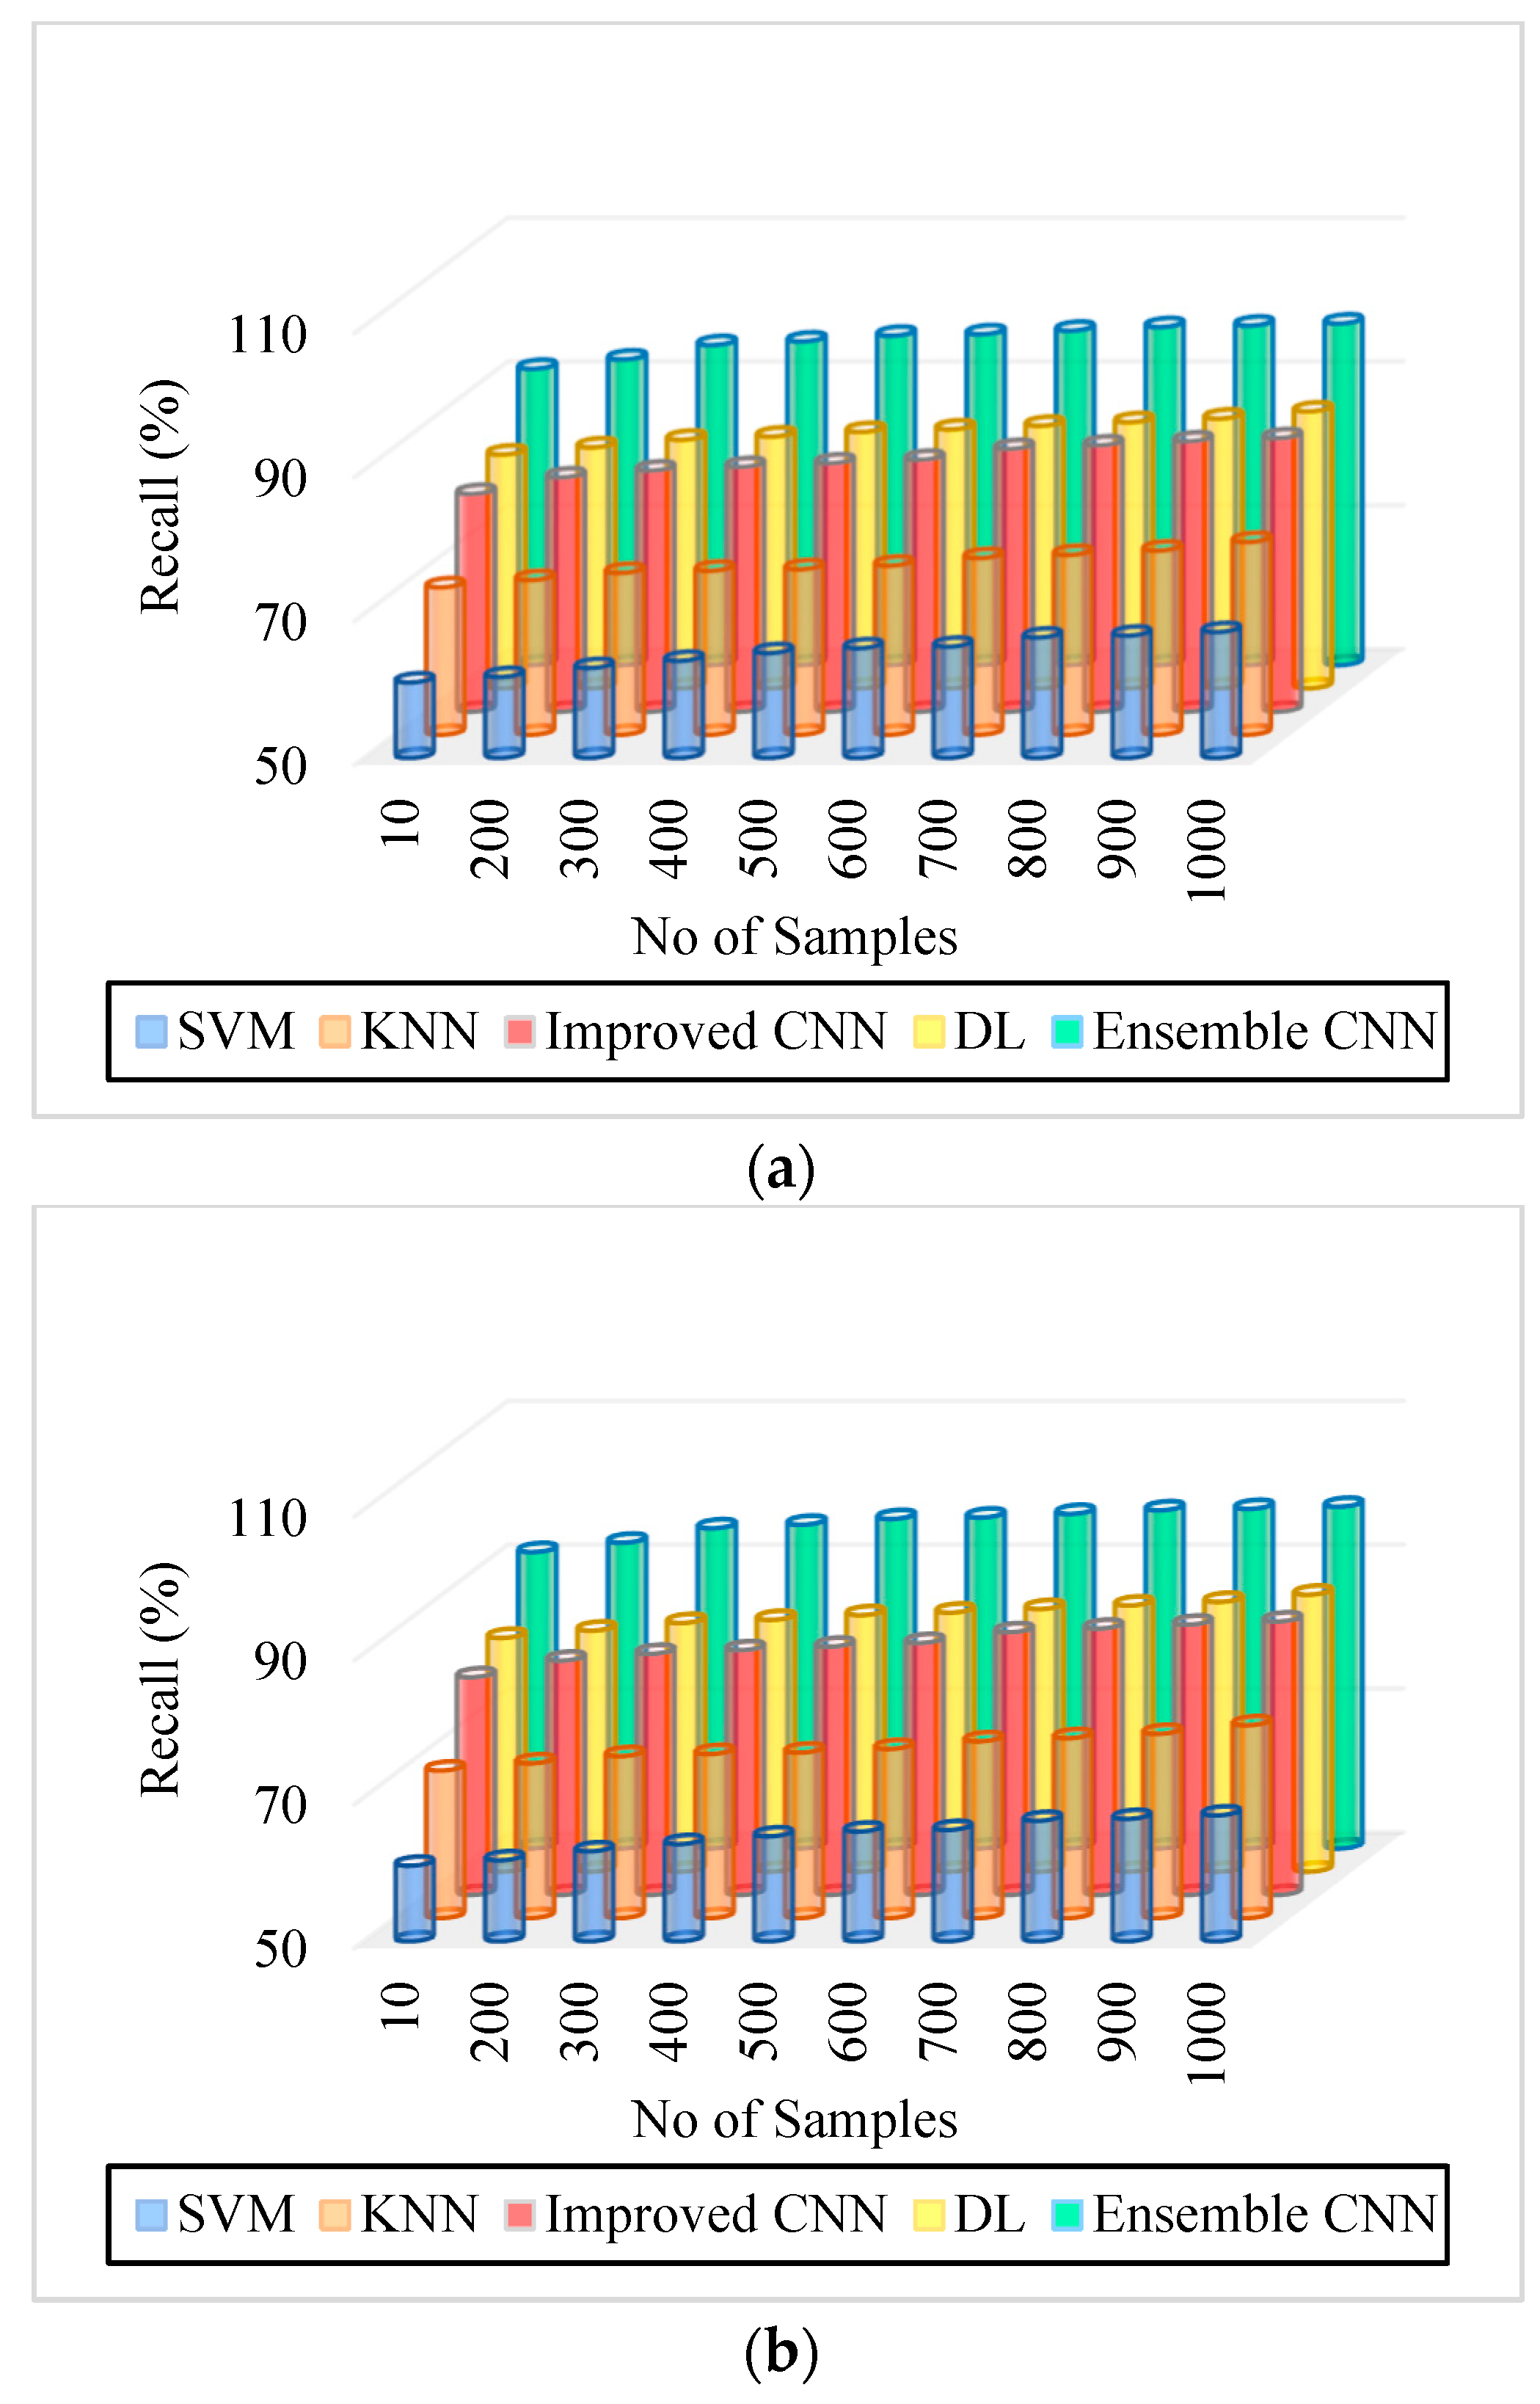
5.3. Recall
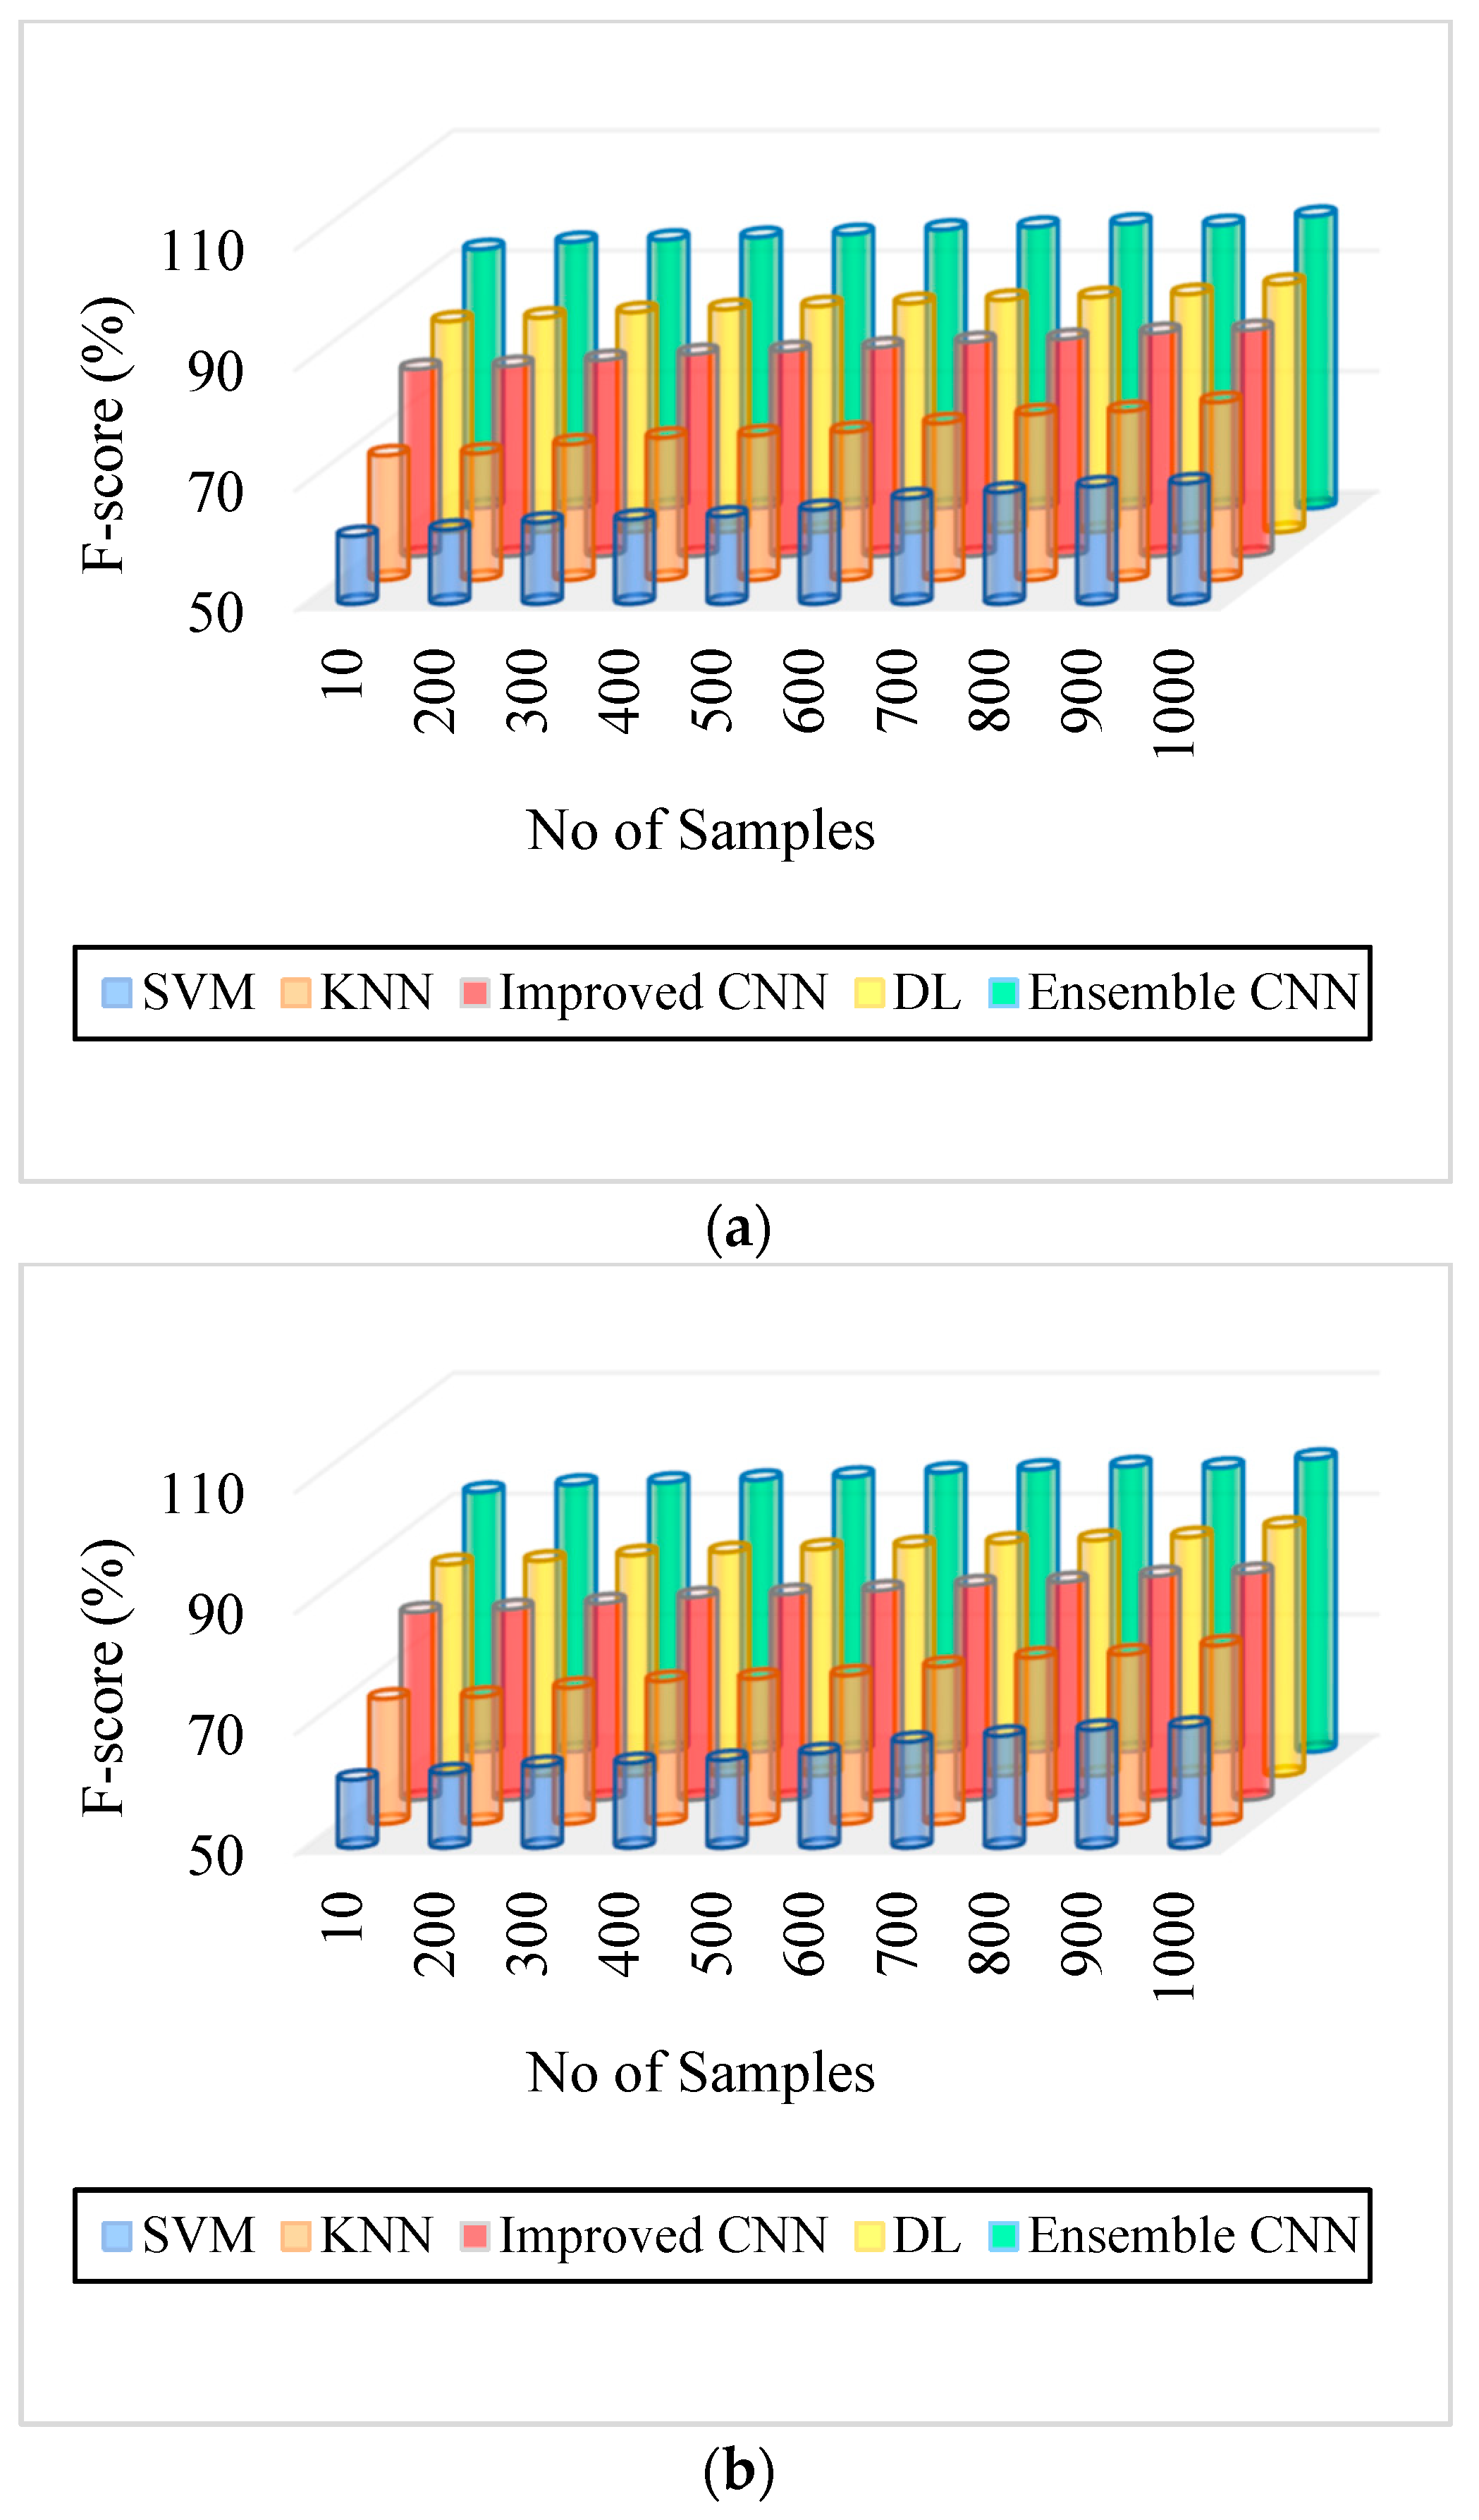
5.4. F-Score
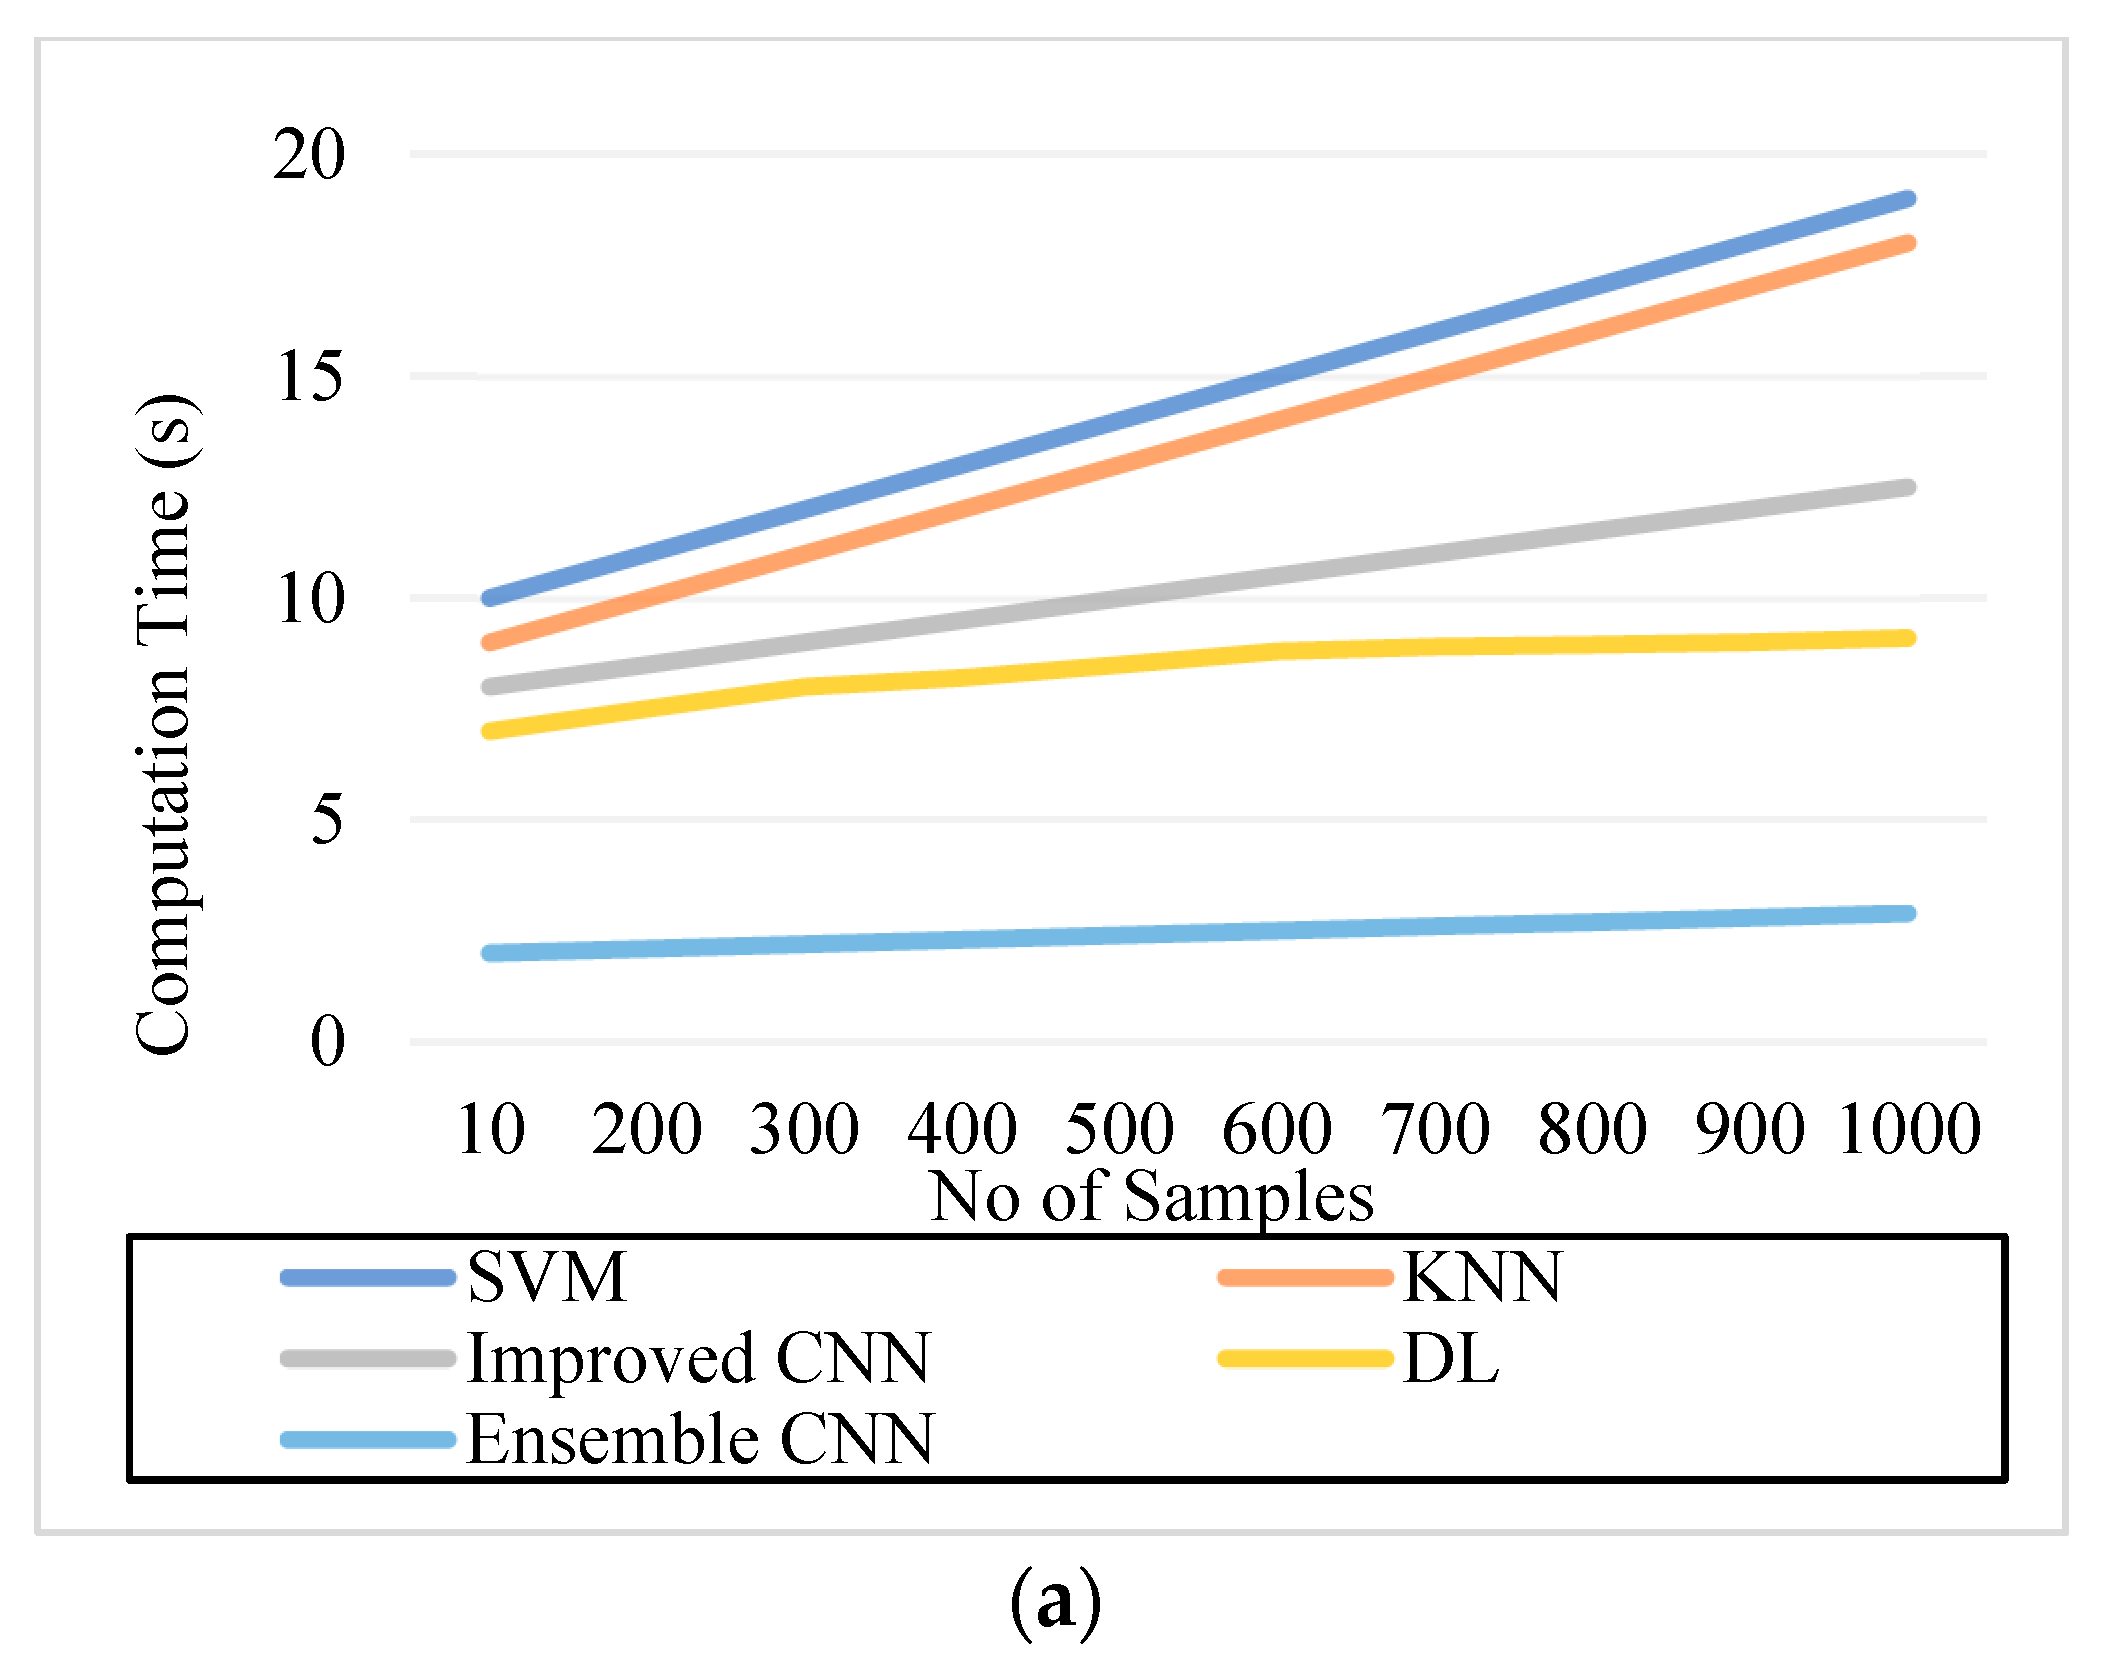
5.5. Computation Time
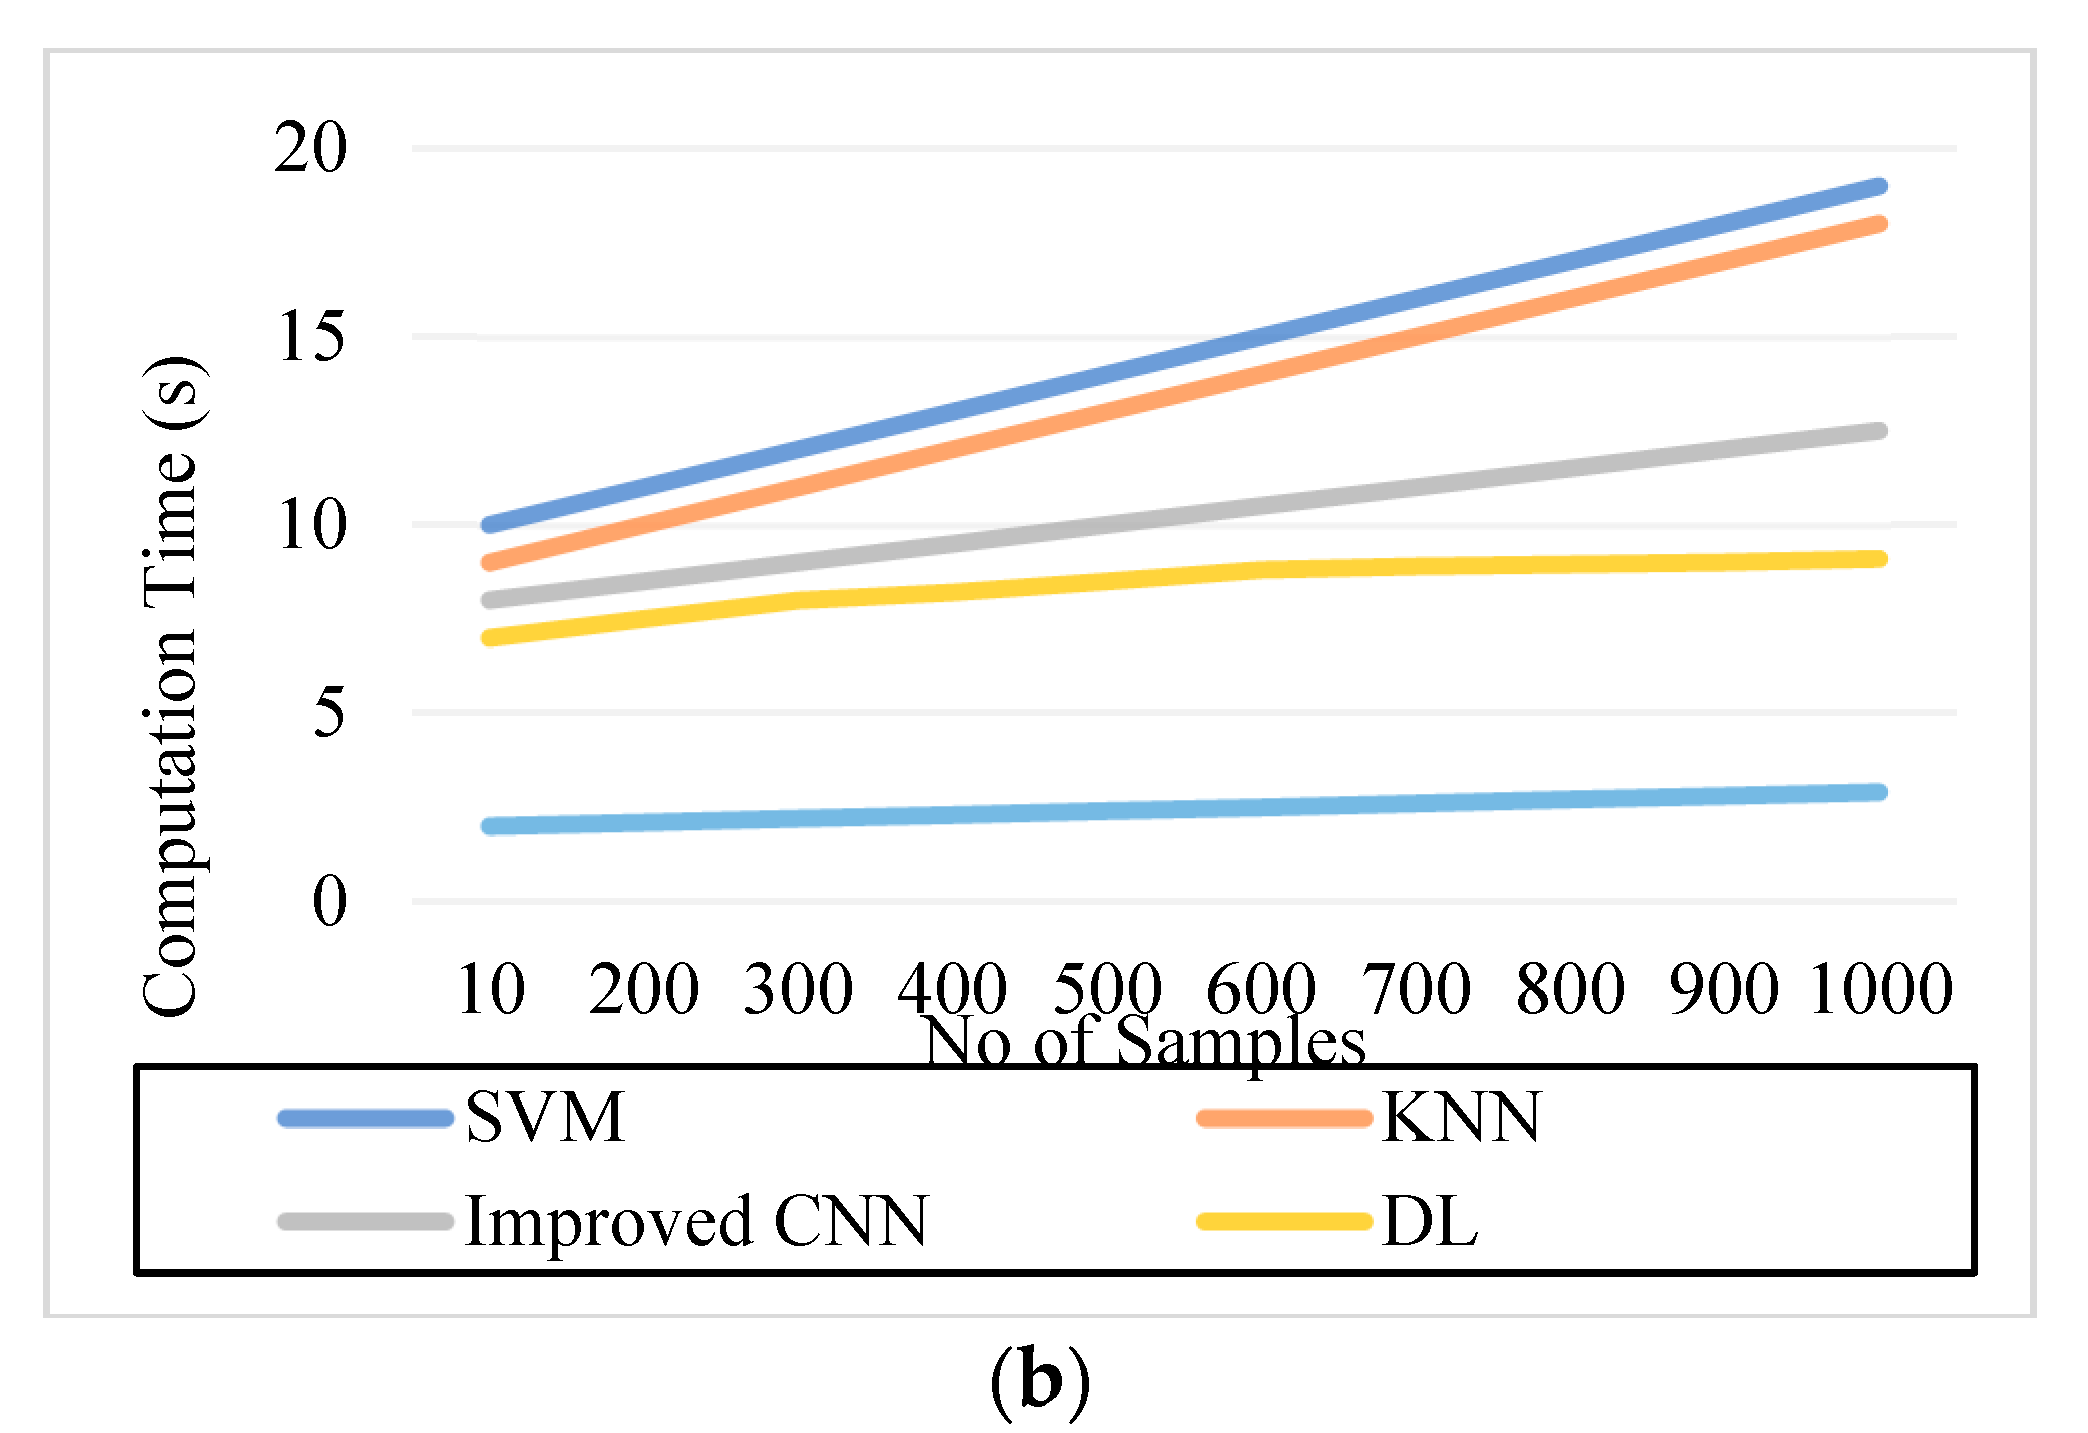
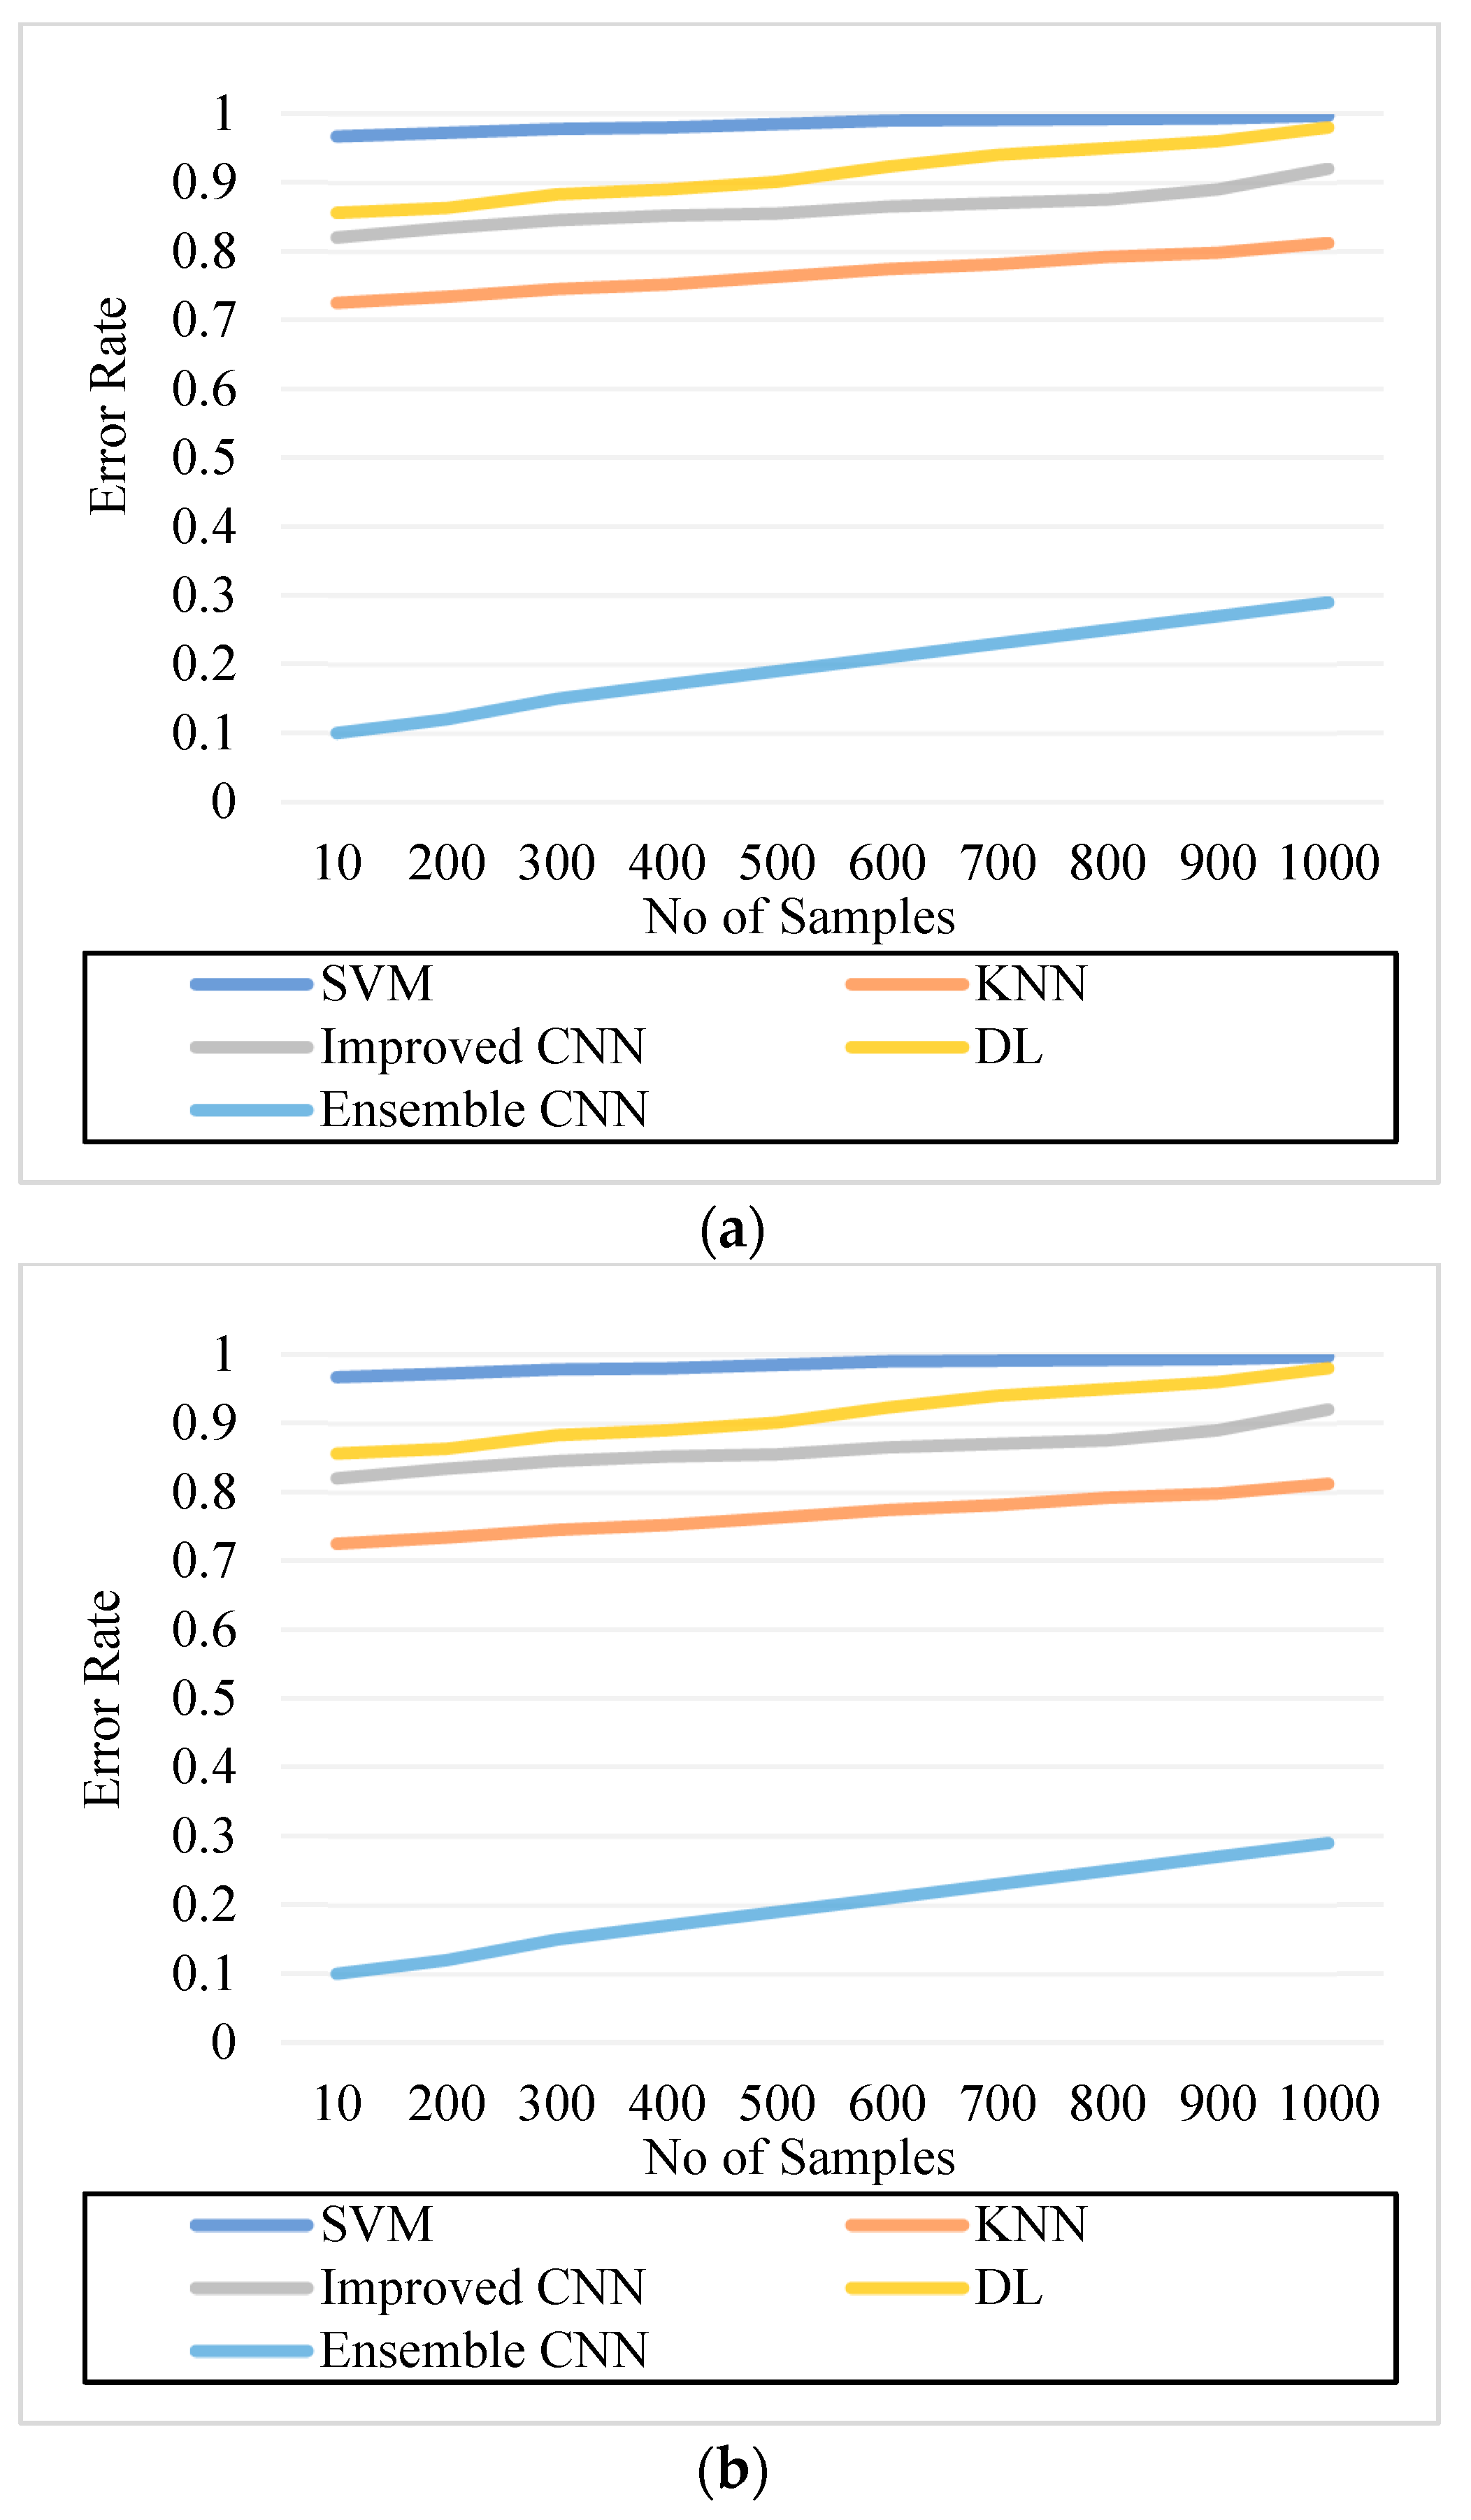
5.6. Error Rate
6. Conclusions
Author Contributions
Funding
Institutional Review Board Statement
Informed Consent Statement
Data Availability Statement
Acknowledgments
Conflicts of Interest
References
- Thiagarajan, A.S.; Adikesavan, J.; Balachandran, S.; Ramamoorthy, B.G. Diabetic Retinopathy Detection using Deep Learning Techniques. J. Comput. Sci. 2020, 16, 305–313. [Google Scholar] [CrossRef] [Green Version]
- Skariah, S.M.; Arun, K.S. A Deep Learning Based Approach for Automated Diabetic Retinopathy Detection and Grading. In Proceedings of the 2021 4th Biennial International Conference on Nascent Technologies in Engineering (ICNTE), Navi Mumbai, India, 15–16 January 2021; pp. 1–6. [Google Scholar]
- Chowdhury, P.; Islam, M.R.; Based, M.A.; Chowdhury, P. Transfer Learning Approach for Diabetic Retinopathy Detection using Efficient Network with 2 Phase Training. In Proceedings of the 2021 6th International Conference for Convergence in Technology (I2CT), Maharashtra, India, 2–4 April 2021; pp. 1–6. [Google Scholar]
- Feng, L.; Wang, Y.; Xu, T.; Dong, L.; Yan, L.; Jiang, M.; Zhang, X.; Jiang, H.; Wu, Z.; Zou, H. Deep learning-based automated detection for diabetic retinopathy and diabetic macular oedema in retinal fundus photographs. Eye 2022, 36, 1433–1441. [Google Scholar]
- Bhardwaj, C.; Jain, S.; Sood, M. Deep Learning–Based Diabetic Retinopathy Severity Grading System Employing Quadrant Ensemble Model. J. Digit. Imaging 2021, 34, 440–457. [Google Scholar] [CrossRef] [PubMed]
- Snehil, K. Diabetic Retinopathy Diagnosis with Ensemble Deep-Learning. In Proceedings of the 3rd International Conference on Vision, Image and Signal Processing, Vancouver, BC, Canada, 26–28 August 2019; pp. 1–5. [Google Scholar]
- Orlando, J.I.; Prokofyeva, E.; Fresno, M.D.; Blaschko, M.B. Learning to Detect Red Lesions in Fundus Photographs: An Ensemble Approach based on Deep Learning. arXiv 2017, arXiv:abs/1706.03008. [Google Scholar]
- Yan, Y.; Gong, J.; Liu, Y. A Novel Deep Learning Method for Red Lesions Detection Using Hybrid Feature. In Proceedings of the 2019 Chinese Control And Decision Conference (CCDC), Nanchang, China, 3–5 June 2019; pp. 2287–2292. [Google Scholar]
- Safwan, M.; Chennamsetty, S.S.; Kori, A.; Alex, V.; Krishnamurthi, G. Classification of Breast Cancer and Grading of Diabetic Retinopathy & Macular Edema using Ensemble of Pre-Trained Convolutional Neural Networks. In Lecture Notes in Computer Science Book Series; Spring: Berlin/Heidelberg, Germany, 2018; Volume 10882. [Google Scholar]
- Harangi, B.; Tóth, J.; Hajdu, A. Fusion of Deep Convolutional Neural Networks for Microaneurysm Detection in Color Fundus Images. In Proceedings of the 2018 40th Annual International Conference of the IEEE Engineering in Medicine and Biology Society (EMBC), Honolulu, HI, USA, 18–21 July 2018; pp. 3705–3708. [Google Scholar]
- Ramchandre, S.; Patil, B.; Pharande, S.; Javali, K.; Pande, H. A Deep Learning Approach for Diabetic Retinopathy detection using Transfer Learning. In Proceedings of the 2020 IEEE International Conference for Innovation in Technology (INOCON), Bangalore, India, 6–8 November 2020; pp. 1–5. [Google Scholar]
- Shorfuzzaman, M.; Hossain, M.S.; El Saddik, A. An Explainable Deep Learning Ensemble Model for Robust Diagnosis of Diabetic Retinopathy Grading. ACM Trans. Multimed. Comput. Commun. Appl. 2021, 17, 1–24. [Google Scholar] [CrossRef]
- Rajkumar, R.S.; Jagathishkumar, T.; Ragul, D.; Selvarani, A.G. Transfer Learning Approach for Diabetic Retinopathy Detection using Residual Network. In Proceedings of the 2021 6th International Conference on Inventive Computation Technologies (ICICT), Coimbatore, India, 20–22 January 2021; pp. 1189–1193. [Google Scholar]
- Al-Smadi, M.; Hammad, M.M.; Baker, Q.B.; Al-Zboon, S.A. A transfer learning with deep neural network approach for diabetic retinopathy classification. Int. J. Electr. Comput. Eng. 2021, 11, 3492–3501. [Google Scholar] [CrossRef]
- Dela Pava, M.; R’ios, H.; Rodr’iguez, F.J.; Perdomo, O.J.; Gonz’alez, F.A. A deep learning model for classification of diabetic Retinopathy in eye fundus images based on retinal lesion detection. In Proceedings of the Symposium on Medical Information Processing and Analysis, Mexico City, Mexico, 17–19 November 2021. [Google Scholar]
- Chetoui, M.; Akhloufi, M.A. Explainable end-to-end deep Learning for diabetic retinopathy detection across multiple datasets. J. Med. Imaging 2020, 7, 044503. [Google Scholar] [CrossRef]
- Mohamed, E.; Elmohsen, M.N.; Basha, T.A. Improved Automatic Grading of Diabetic Retinopathy Using Deep Learning and Principal Component Analysis. In Proceedings of the 2021 43rd Annual International Conference of the IEEE Engineering in Medicine & Biology Society (EMBC), Scotland, UK, 1–5 November 2021; pp. 3898–3901. [Google Scholar]
- Khan, A.A.; Kulkarni, N.; Kumar, A.; Kamat, A. D-CNN and Image Processing Based Approach for Diabetic Retinopathy Classification. In Advances in Intelligent Systems and Computing; Springer: Berlin/Heidelberg, Germany, 2021. [Google Scholar]
- Han, Y.; Tao, M.; Zheng, X. Ensembling Learning for Automated Detection of Diabetic Retinopathy. In Proceedings of 2021 International Conference on Medical Imaging and Computer-Aided Diagnosis (MICAD 2021) Medical Imaging and Computer-Aided Diagnosis; Springer: Singapore, 2022. [Google Scholar]
- Afrin, R.; Shill, P.C. Automatic Lesions Detection and Classification of Diabetic Retinopathy Using Fuzzy Logic. In Proceedings of the 2019 International Conference on Robotics, Electrical and Input Image Processing Techniques (ICREST), Dhaka, Bangladesh, 10–12 January 2019; pp. 527–532. [Google Scholar]
- Chaudhary, S.; Ramya, H.R. Detection of Diabetic Retinopathy using Machine Learning Algorithm. In Proceedings of the 2020 IEEE International Conference for Innovation in Technology (INOCON), Bangaluru, India, 6–8 November 2020; pp. 1–5. [Google Scholar]
- Ali, A.; Qadri, S.; Mashwani, W.K.; Kumam, W.; Kumam, P.; Naeem, S.; Göktas, A.; Jamal, F.; Chesneau, C.; Anam, S.; et al. Machine Learning Based Automated Segmentation and Hybrid Feature Analysis for Diabetic Retinopathy Classification Using Fundus Image. Entropy 2020, 22, 567. [Google Scholar] [CrossRef]
- Kumar, K.; Megha, P.; Meenakshy, K. Diabetic Retinopathy Detection & Classification Techniques: A Review. Int. J. Sci. Technol. Res. 2020, 9, 1621–1628. [Google Scholar]
- Ammal, M.; Gladis, D. Perception of hard exudates using Fuzzy Optimization and Discrete Wavelet Transformation in Fundus Image. In Proceedings of the 2021 Third International Conference on Intelligent Communication Technologies and Virtual Mobile Networks (ICICV), Tirunelveli, India, 4–6 February 2021; pp. 1034–1039. [Google Scholar]
- Tala, E.B.; Thabet, B. Diabetic Retinopathy Recognition System based on GLDM Features and Feed Forward Neural Network Classifier. Al-Qadisiyah J. Pure Sci. 2022, 27, comp1-16. [Google Scholar] [CrossRef]
- Patil, S.; Kulkarni, P. Diabetic Retinopathy Detection: Methods and Challenges. In Proceedings of the 2019 IEEE Pune Section International Conference (PuneCon), Pune, India, 18–20 December 2019; Volume 2022, pp. 1–3. [Google Scholar]
- Qiao, L.; Zhu, Y.; Zhou, H. Diabetic Retinopathy Detection Using Prognosis of Microaneurysm and Early Diagnosis System for Nonproliferative Diabetic Retinopathy Based on Deep Learning Algorithms. IEEE Access 2020, 8, 104292–104302. [Google Scholar] [CrossRef]
- Araújo, T.; Aresta, G.; Mendonça, L.; Penas, S.; Maia, C.; Carneiro, Â.; Mendonça, A.M.; Campilho, A. Data Augmentation for Improving Proliferative Diabetic Retinopathy Detection in Eye Fundus Images. IEEE Access 2020, 8, 182462–182474. [Google Scholar] [CrossRef]
- Nazir, T.; Irtaza, A.; Javed, A.; Malik, H.; Hussain, D.; Naqvi, R.A. Retinal Image Analysis for Diabetes-Based Eye Disease Detection Using Deep Learning. Appl. Sci. 2020, 10, 6185. [Google Scholar] [CrossRef]
- Chalakkal, R.J.; Hafiz, F.M.; Abdulla, W.; Swain, A. An Efficient Framework for Automated Screening of Clinically Significant Macular Edema. Comput. Biol. Med. 2021, 130, 104128. [Google Scholar] [CrossRef] [PubMed]
- Sikder, N.; Masud, M.; Bairagi, A.; Arif, A.S.; Nahid, A.; Alhumyani, H. Severity Classification of Diabetic Retinopathy Using an Ensemble Learning Algorithm through Analyzing Retinal Images. Symmetry 2021, 13, 670. [Google Scholar] [CrossRef]
- AbdelMaksoud, E.; Barakat, S.; Elmogy, M.M. A comprehensive diagnosis system for early signs and different diabetic retinopathy grades using fundus retinal images based on pathological changes detection. Comput. Biol. Med. 2020, 126, 104039. [Google Scholar] [CrossRef]
- Singh, N.; Kaur, L.; Singh, K. Histogram equalization techniques for enhancement of low radiance retinal images for early detection of diabetic Retinopathy. Eng. Sci. Technol. Int. J. 2019, 22, 736–745. [Google Scholar] [CrossRef]
- Li, X.; Hu, X.; Yu, L.; Zhu, L.; Fu, C.; Heng, P. CANet: Cross-Disease Attention Network for Joint Diabetic Retinopathy and Diabetic Macular Edema Grading. IEEE Trans. Med. Imaging 2020, 39, 1483–1493. [Google Scholar] [CrossRef] [Green Version]
- Wang, J.; Bai, Y.; Xia, B. Simultaneous Diagnosis of Severity and Features of Diabetic Retinopathy in Fundus Photography Using Deep Learning. IEEE J. Biomed. Health Inform. 2020, 24, 3397–3407. [Google Scholar] [CrossRef]
- Aurangzeb, K.; Aslam, S.; Alhussein, M.A.; Naqvi, R.A.; Arsalan, M.; Haider, S.I. Contrast Enhancement of Fundus Images by Employing Modified PSO for Improving the Performance of Deep Learning Models. IEEE Access 2021, 9, 47930–47945. [Google Scholar] [CrossRef]
- Rajput, G.G.; Reshmi, B.; Rajesh, I. Automatic detection and grading of diabetic maculopathy using fundus images. Procedia Comput. Sci. 2020, 167, 57–66. [Google Scholar] [CrossRef]
- Ahn, S.; Pham, Q.T.; Shin, J.; Song, S.J. Future Image Synthesis for Diabetic Retinopathy Based on the Lesion Occurrence Probability. Electronics 2021, 10, 726. [Google Scholar] [CrossRef]
- Qummar, S.; Khan, F.G.; Shah, S.; Khan, A.; Shamshirband, S.; Rehman, Z.U.; Ahmed Khan, I.; Jadoon, W. A Deep Learning Ensemble Approach for Diabetic Retinopathy Detection. IEEE Access 2019, 7, 150530–150539. [Google Scholar] [CrossRef]
- Nazir, T.; Nawaz, M.; Rashid, J.; Mahum, R.; Masood, M.F.; Mehmood, A.; Ali, F.; Kim, J.; Kwon, H.; Hussain, A. Detection of Diabetic Eye Disease from Retinal Images Using a Deep Learning based CenterNet Model. Sensors 2021, 21, 5283. [Google Scholar] [CrossRef] [PubMed]


| Operational Layer | Filters | Filter Size | Stride | Padding | Output Image Size | |
|---|---|---|---|---|---|---|
| Preprocessed image | - | - | - | - | 224 × 224 × 3 | |
| Convolutional layer (2 times) | Convolutional | 64 | 3 × 3 × 3 | 1 × 1 | 1 × 1 | 224 × 224 × 64 |
| ReLU | - | - | - | - | 224 × 224 × 64 | |
| Pooling layer | Max pooling | 1 | 2 × 2 | 2 × 2 | 0 | 112 × 112 × 64 |
| Convolutional layer (2 times) | Convolutional | 128 | 3 × 3 × 64 | 1 × 1 | 1 × 1 | 112 × 112 × 128 |
| ReLU | - | - | - | - | 112 × 112 × 128 | |
| Pooling layer | Max pooling | 1 | 2 × 2 | 2 × 2 | 0 | 56 × 56 × 128 |
| Convolutional layer (4 times) | Convolutional | 256 | 3 × 3 × 128 | 1 × 1 | 1 × 1 | 56 × 56 × 256 |
| ReLU | - | - | - | - | 56 × 56 × 256 | |
| Pooling layer | Max pooling | 1 | 2 × 2 | 2 × 2 | 0 | 28 × 28 × 256 |
| Convolutional layer (4 times) | Convolutional | 512 | 3 × 3 × 256 | 1 × 1 | 1 × 1 | 28 × 28 × 512 |
| ReLU | - | - | - | - | 28 × 28 × 512 | |
| Pooling layer | Max pooling | 1 | 2 × 2 | 2 × 2 | 0 | 14 × 14 × 512 |
| Convolutional layer (4 times) | Convolutional | 512 | 3 × 3 × 512 | 1 × 1 | 1 × 1 | 14 × 14 × 512 |
| ReLU | - | - | - | - | 14 × 14 × 512 | |
| Pooling layer | Max pooling | 1 | 2 × 2 | 2 × 2 | 0 | 7 × 7 × 512 |
| Inner product layer | Fully connected | - | - | - | - | 4096 |
| ReLU | - | - | - | - | 4096 | |
| Figures | SVM | KNN | Improved CNN | DL | E-CNN |
|---|---|---|---|---|---|
| Figure 5. Detection Accuracy. (a) IDRiR | 61.3–69.96% | 65–71% | 79–83% | 83–91% | 94–98% |
| Figure 5. Detection Accuracy. (b) Messidor | 54–59% | 65–71% | 79–84% | 84–92% | 96–98% |
| Figure 6. Precision. (a) IDRiR | 60.5–69% | 70–77.5% | 80.12–87.5% | 84–91.25% | 92.5–97% |
| Figure 6. Precision, (b) Messidor. | 60.5–69% | 70–77.5% | 80.12–87.5% | 84–91.25% | 92.5–97% |
| Figure 7. Recall. (a) IDRiR | 60.5–67.5% | 70.5–76.8% | 80.25–88% | 82.5–88.5% | 91.2–97.5% |
| Figure 7. Recall. (b) Messidor. | 60.5–67.5% | 70.5–76.8% | 80.25–88% | 82.5–88.5% | 91.2–97.6% |
| Figure 8. F-Score. (a) IDRiR | 61.25–70% | 70.69–79.5% | 81–87.5% | 85–91.2% | 93–98.5% |
| Figure 8. F-Score. (b) Messidor | 61.25–70% | 70.69–79.5% | 81–87.5% | 85–91.2% | 93–98.5% |
| Figure 9. Computation Time. (a) IDRiR (seconds) | 11 | 14 | 10.5 | 8.8 | 2.6 |
| Figure 9. Computation Time. (b) Messidor (seconds) | 14 | 11 | 9.5 | 8.2 | 2.4 |
| Figure 10. Error Rate. (a) IDRiR | 0.985 | 0.774 | 0.865 | 0.923 | 0.15 |
| Figure 10. Error Rate. (b) Messidor | 0.99 | 0.792 | 0.865 | 0.923 | 0.19 |
Disclaimer/Publisher’s Note: The statements, opinions and data contained in all publications are solely those of the individual author(s) and contributor(s) and not of MDPI and/or the editor(s). MDPI and/or the editor(s) disclaim responsibility for any injury to people or property resulting from any ideas, methods, instructions or products referred to in the content. |
© 2023 by the authors. Licensee MDPI, Basel, Switzerland. This article is an open access article distributed under the terms and conditions of the Creative Commons Attribution (CC BY) license (https://creativecommons.org/licenses/by/4.0/).
Share and Cite
Sundaram, S.; Selvamani, M.; Raju, S.K.; Ramaswamy, S.; Islam, S.; Cha, J.-H.; Almujally, N.A.; Elaraby, A. Diabetic Retinopathy and Diabetic Macular Edema Detection Using Ensemble Based Convolutional Neural Networks. Diagnostics 2023, 13, 1001. https://doi.org/10.3390/diagnostics13051001
Sundaram S, Selvamani M, Raju SK, Ramaswamy S, Islam S, Cha J-H, Almujally NA, Elaraby A. Diabetic Retinopathy and Diabetic Macular Edema Detection Using Ensemble Based Convolutional Neural Networks. Diagnostics. 2023; 13(5):1001. https://doi.org/10.3390/diagnostics13051001
Chicago/Turabian StyleSundaram, Swaminathan, Meganathan Selvamani, Sekar Kidambi Raju, Seethalakshmi Ramaswamy, Saiful Islam, Jae-Hyuk Cha, Nouf Abdullah Almujally, and Ahmed Elaraby. 2023. "Diabetic Retinopathy and Diabetic Macular Edema Detection Using Ensemble Based Convolutional Neural Networks" Diagnostics 13, no. 5: 1001. https://doi.org/10.3390/diagnostics13051001