
The Need for Artificial Intelligence Based Risk Factor Analysis for Age-Related Macular Degeneration: A Review

Abstract
:1. Introduction
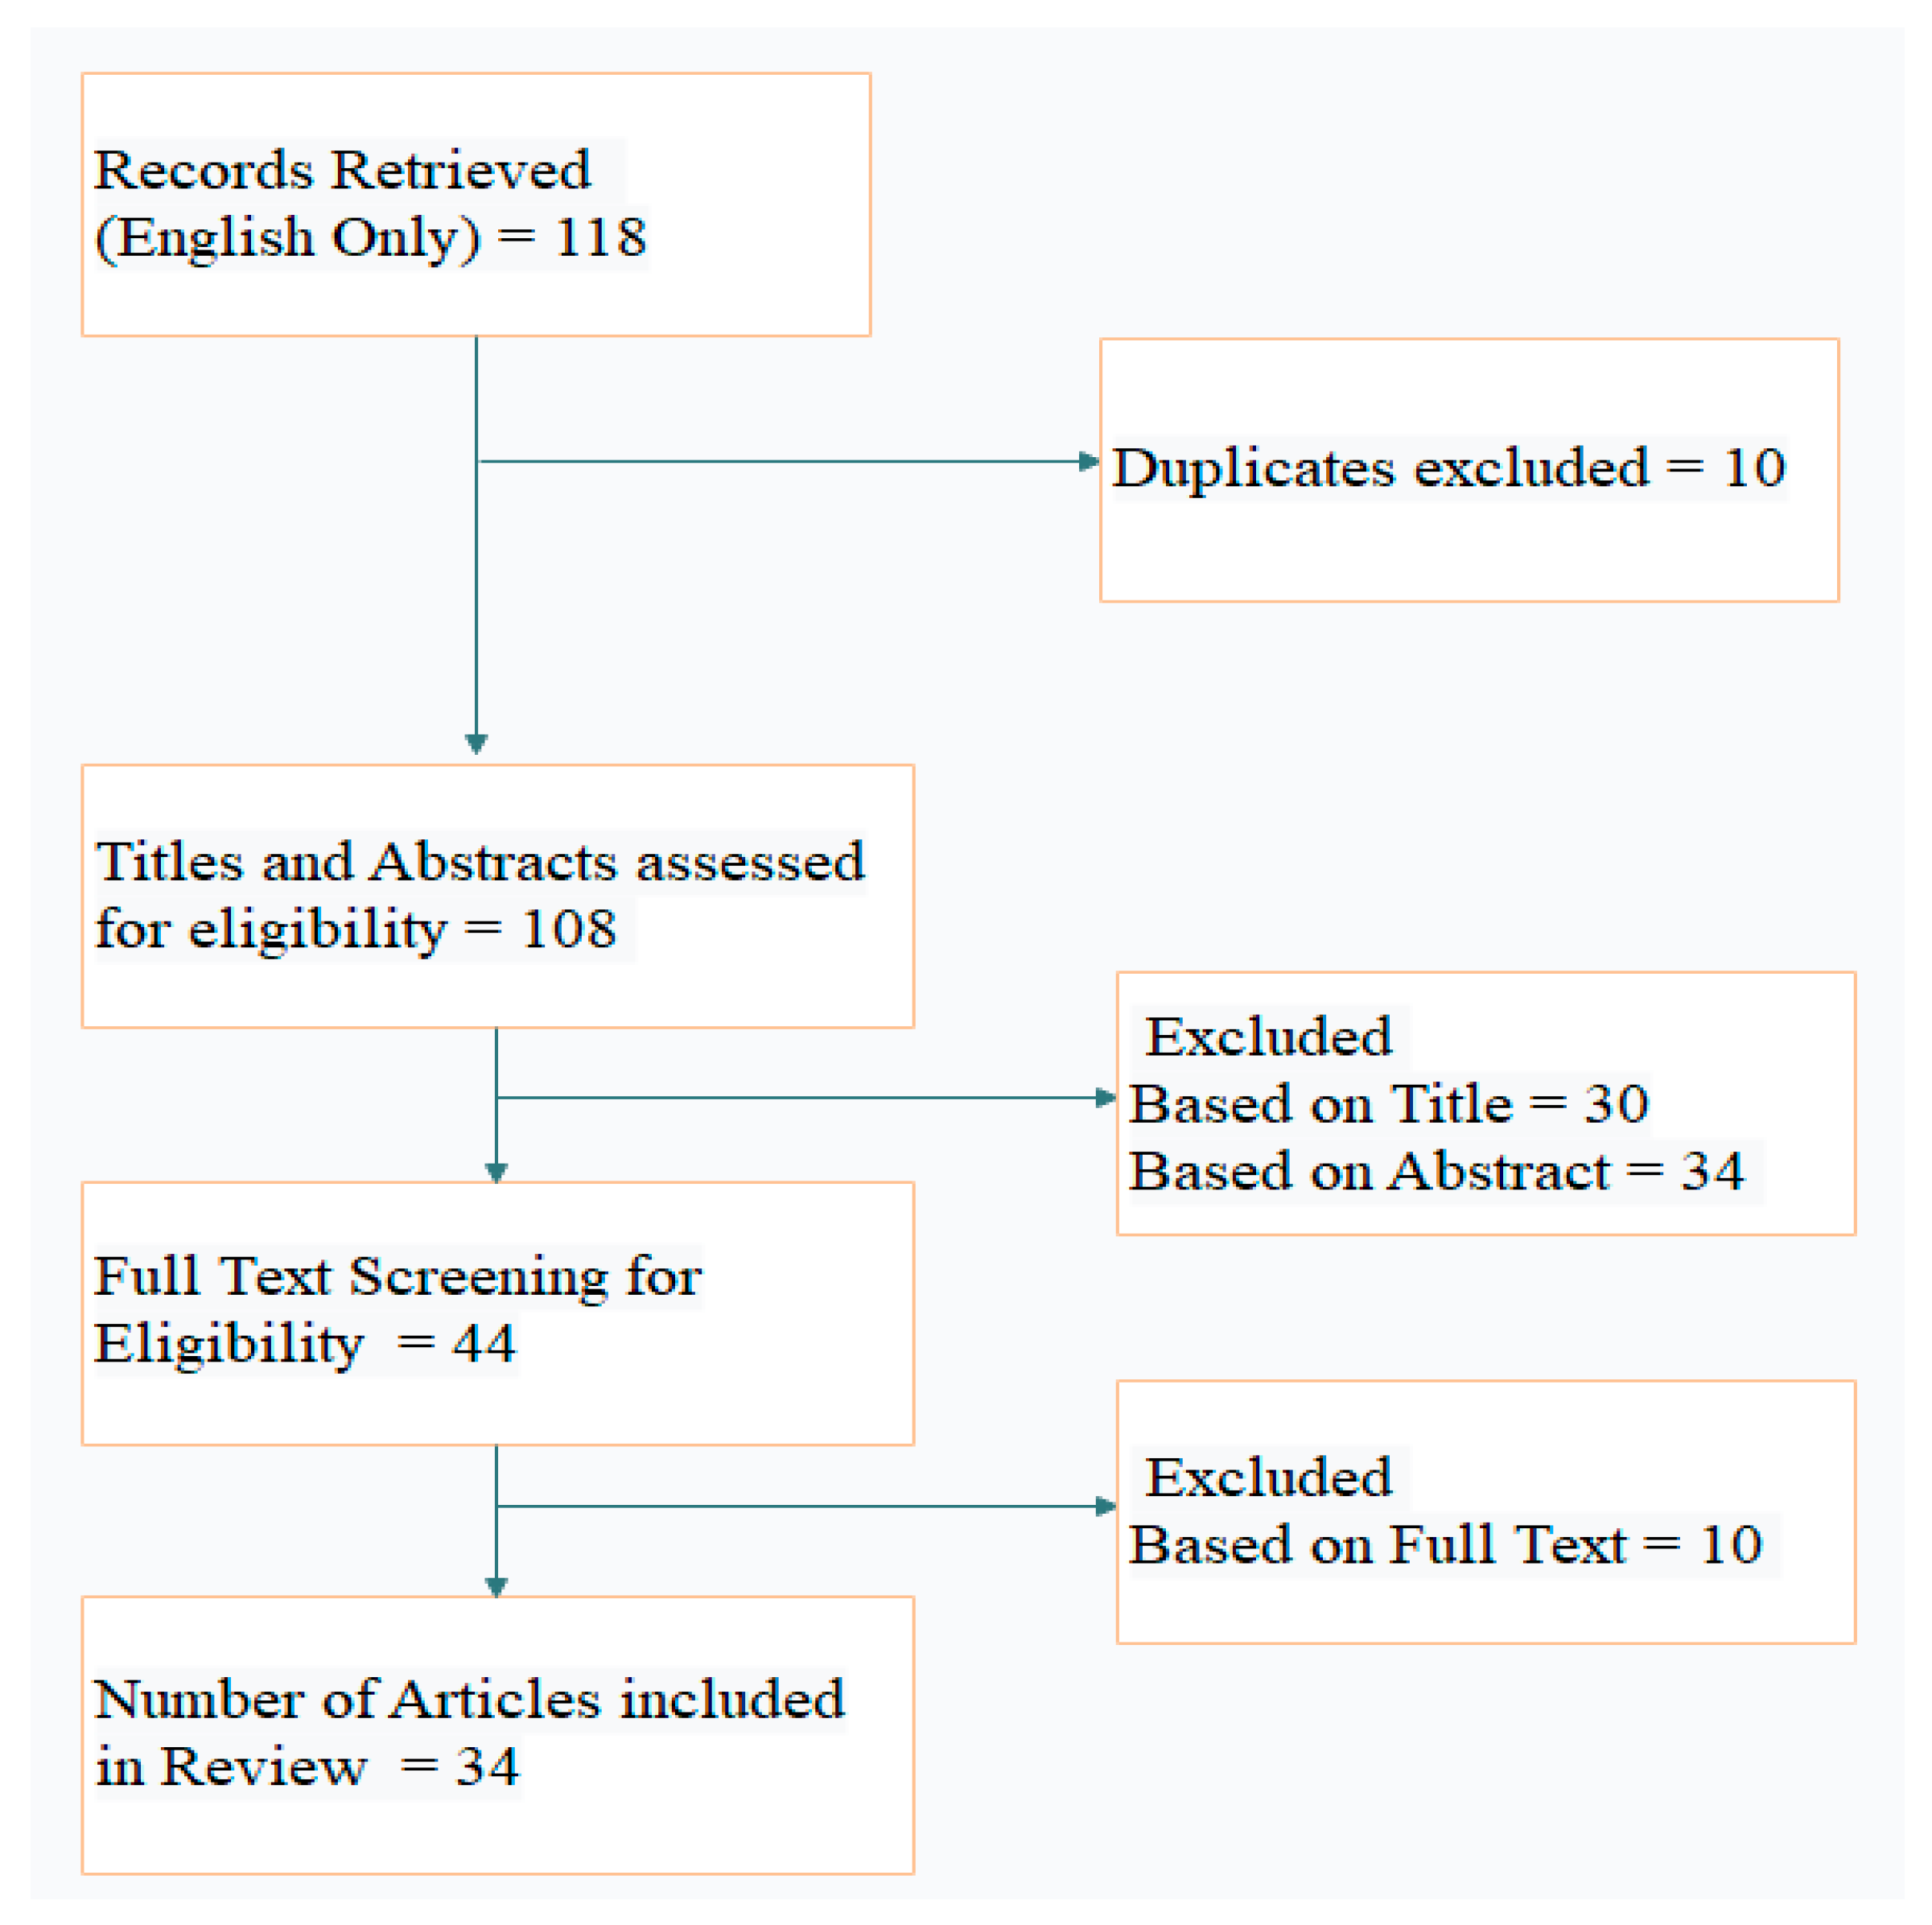
2. Methods
2.1. Study Selection
Search Terms
2.2. Inclusion and Exclusion Criteria
2.3. Selecting Studies
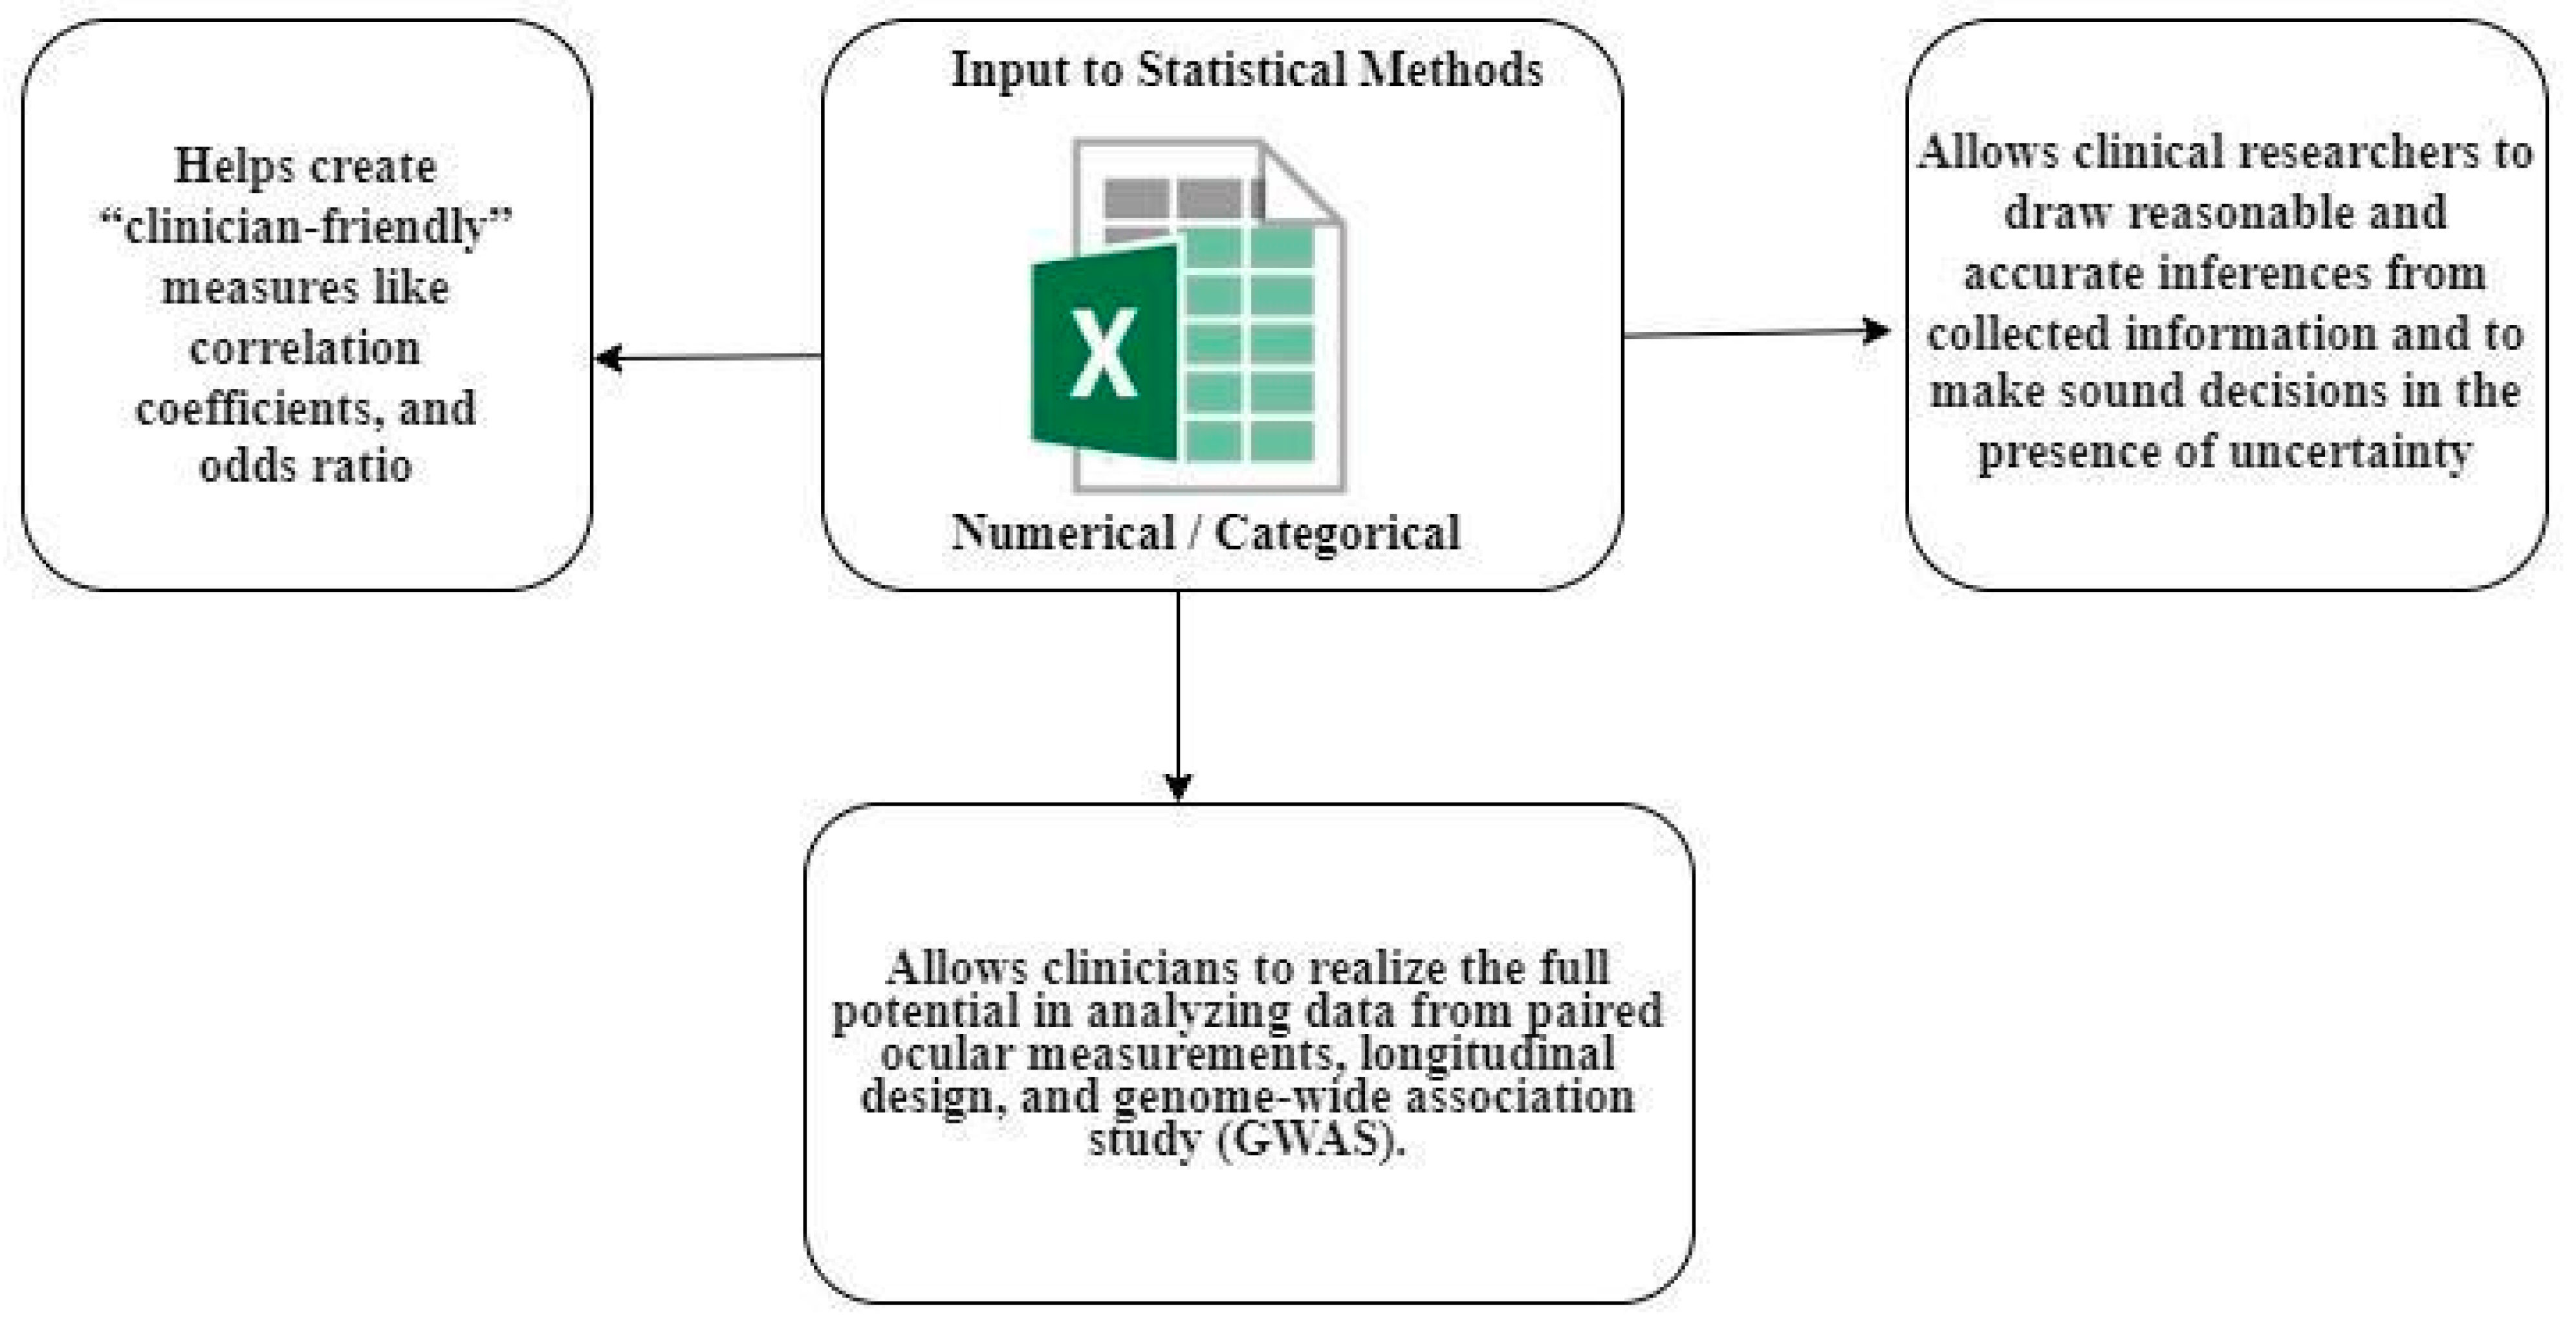
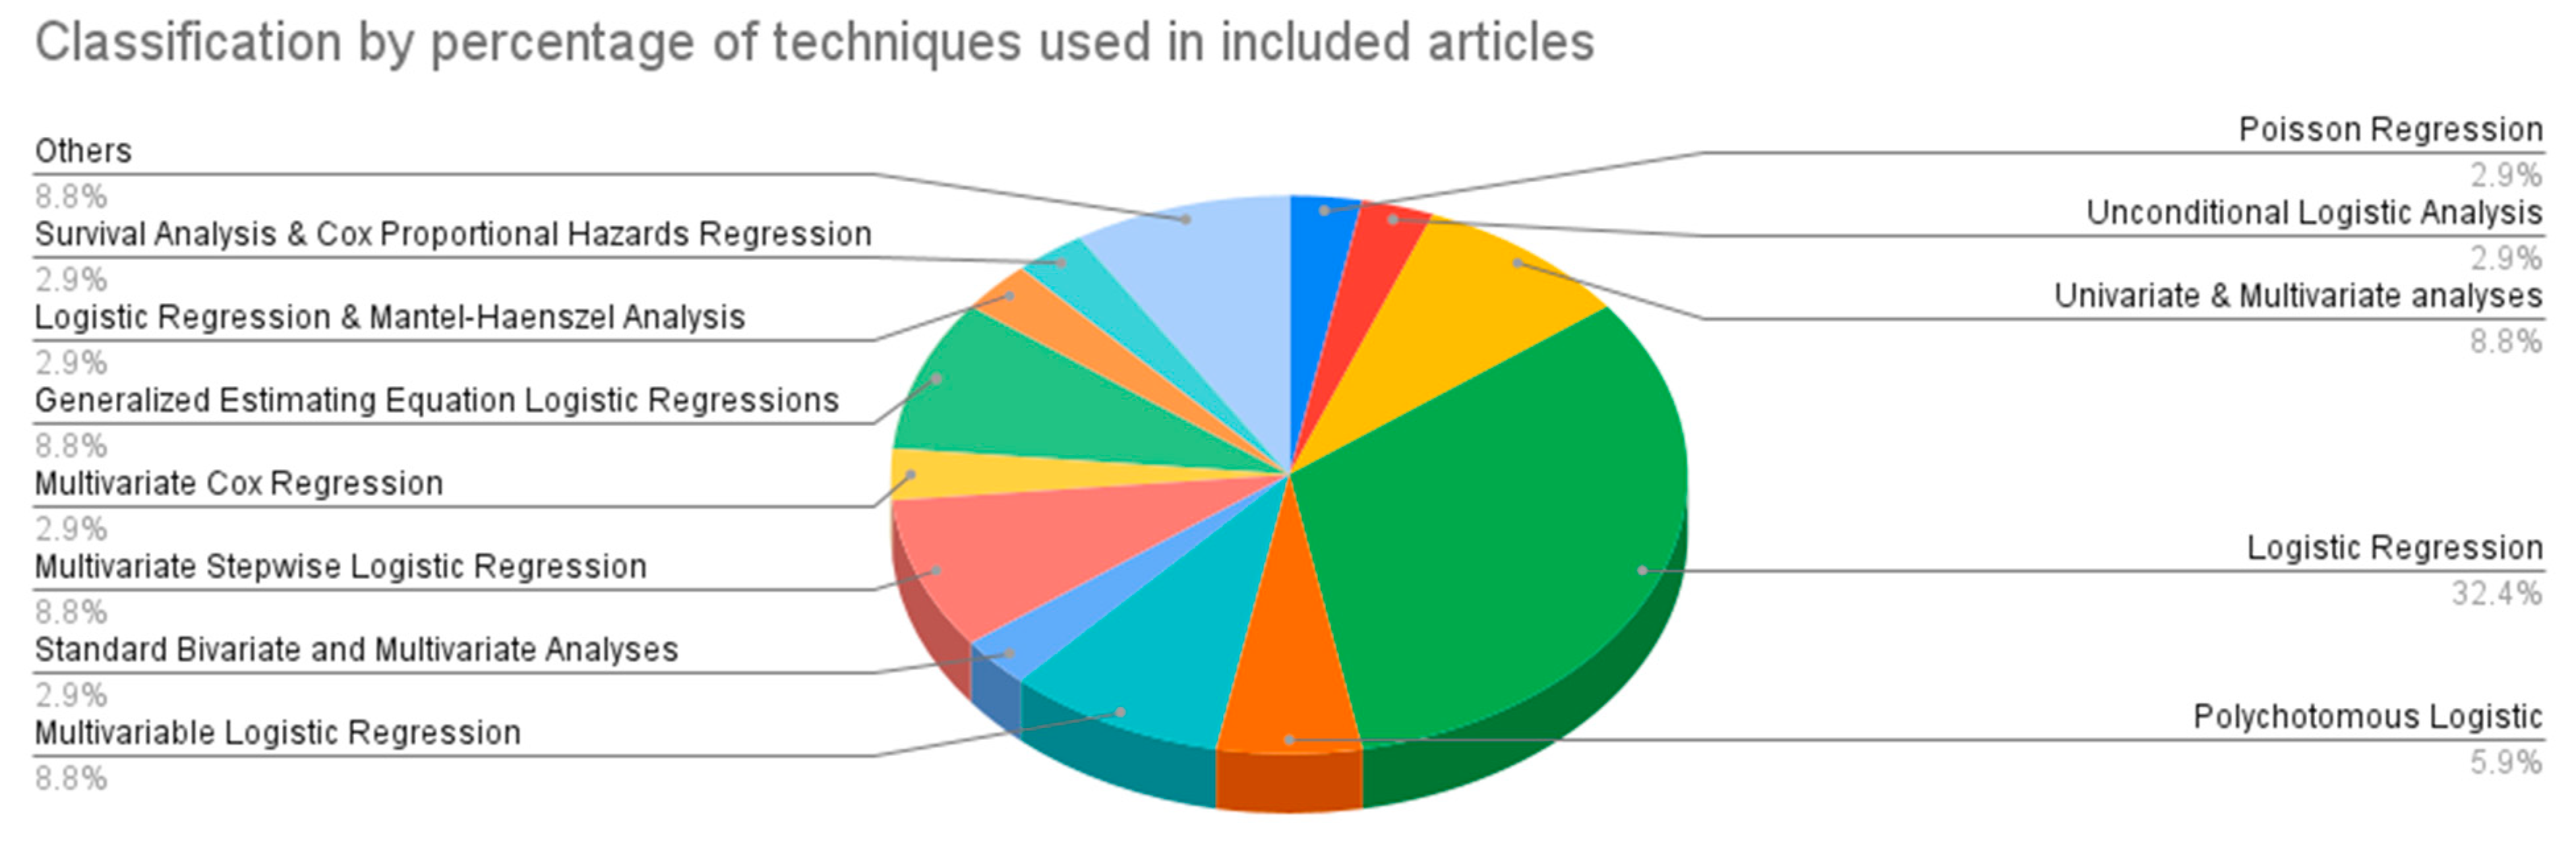
3. Statistical Techniques for Risk Factor Identification
4. Artificial Intelligence in AMD
4.1. Lesion Detection, Quantification, and Extraction
4.2. Automated Image Segmentation
4.3. AMD Classification
5. Significance of AI over Traditional Statistical Methods
Open Problems
6. Discussion
7. Conclusions
Author Contributions
Funding
Institutional Review Board Statement
Informed Consent Statement
Data Availability Statement
Conflicts of Interest
References
- Imran, A.; Li, J.; Pei, Y.; Akhtar, F.; Mahmood, T.; Li, Z. Fundus image-based cataract classification using a hybrid convolutional and recurrent neural network. Vis. Comput. 2021, 37, 2407–2417. [Google Scholar] [CrossRef]
- Imran, A.; Li, J.; Pei, Y.; Akhtar, F.; Yang, J.J.; Dang, Y. Automated identification of cataract severity using retinal fundus images. Comput. Methods Biomech. Biomed. Eng. Imaging Vis. 2020, 8, 691–698. [Google Scholar] [CrossRef]
- Imran, A.; Li, J.; Pei, Y.; Akhtar, F.; Yang, J.J.; Wang, Q. Cataract detection and grading with retinal images using SOM-RBF neural network. In Proceedings of the 2019 IEEE Symposium Series on Computational Intelligence (SSCI), Xiamen, China, 6–9 December 2019; IEEE: Piscataway, NJ, USA, 2019; pp. 2626–2632. [Google Scholar]
- Imran, A.; Li, J.; Pei, Y.; Mokbal, F.M.; Yang, J.J.; Wang, Q. Enhanced intelligence using collective data augmentation for CNN based cataract detection. In International Conference on Frontier Computing; Springer: Singapore, 2019; pp. 148–160. [Google Scholar]
- Latif, J.; Tu, S.; Xiao, C.; Ur Rehman, S.; Imran, A.; Latif, Y. ODGNet: A deep learning model for automated optic disc localization and glaucoma classification using fundus images. SN Appl. Sci. 2022, 4, 98. [Google Scholar] [CrossRef]
- Bilal, A.; Sun, G.; Mazhar, S.; Imran, A.; Latif, J. A Transfer Learning and U-Net-based automatic detection of diabetic retinopathy from fundus images. Comput. Methods Biomech. Biomed. Eng. Imaging Vis. 2022, 10, 663–674. [Google Scholar] [CrossRef]
- Bilal, A.; Sun, G.; Mazhar, S.; Imran, A. Improved Grey Wolf Optimization-Based Feature Selection and Classification Using CNN for Diabetic Retinopathy Detection. In Evolutionary Computing and Mobile Sustainable Networks; Springer: Singapore, 2022; pp. 1–14. [Google Scholar]
- Mitchell, P.; Liew, G.; Gopinath, B.; Wong, T.Y. Age-related macular degeneration. The Lancet 2018, 392, 1147–1159. [Google Scholar] [CrossRef] [PubMed]
- Ammar, M.J.; Hsu, J.; Chiang, A.; Ho, A.C.; Regillo, C.D. Age-related macular degeneration therapy: A review. Curr. Opin. Ophthalmol. 2020, 31, 215–221. [Google Scholar] [CrossRef]
- World Report on Vision; World Health Organization: Geneva, Switzerland, 2019.
- Li, J.Q.; Welchowski, T.; Schmid, M.; Mauschitz, M.M.; Holz, F.G.; Finger, R.P. Prevalence and incidence of age-related macular degeneration in Europe: A systematic review and meta-analysis. Br. J. Ophthalmol. 2020, 104, 1077–1084. [Google Scholar] [CrossRef]
- Pujol-Lereis, L.M.; Liebisch, G.; Schick, T.; Lin, Y.; Grassmann, F.; Uchida, K.; Zipfel, P.F.; Fauser, S.; Skerka, C.; Weber, B.H. Evaluation of serum sphingolipids and the influence of genetic risk factors in age-related macular degeneration. PLoS ONE 2018, 13, e0200739. [Google Scholar] [CrossRef] [Green Version]
- Bhuachalla, B.N.; McGarrigle, C.A.; O’Leary, N.; Akuffo, K.O.; Peto, T.; Beatty, S.; Kenny, R.A. Orthostatic hypertension as a risk factor for age-related macular degeneration: Evidence from the Irish longitudinal study on ageing. Exp. Gerontol. 2018, 106, 80–87. [Google Scholar] [CrossRef]
- Seddon, J.M.; Widjajahakim, R.; Rosner, B. Rare and common genetic variants, smoking, and body mass index: Progression and earlier age of developing advanced age-related macular degeneration. Investig. Ophthalmol. Vis. Sci. 2020, 61, 32. [Google Scholar] [CrossRef]
- Jaisankar, D.; Swaminathan, G.; Roy, R.; Kulothungan, V.; Sharma, T.; Raman, R. Association of obesity and age-related macular degeneration in Indian population. Indian J. Ophthalmol. 2018, 66, 976. [Google Scholar]
- Roddy, G.W.; Rosa, R.H.; Viker, K.B.; Holman, B.H.; Hann, C.R.; Krishnan, A.; Gores, G.J.; Bakri, S.J.; Fautsch, M.P. Diet mimicking “fast food” causes structural changes to the retina relevant to age-related macular degeneration. Curr. Eye Res. 2020, 45, 726–732. [Google Scholar] [CrossRef] [PubMed]
- Patel, S.N.; Wu, C.; Obeid, A.; Sivalingam, M.; Gervasio, K.; Wibbelsman, T.D.; Levin, H.; Xu, D.; Regillo, C.D.; Hsu, J.; et al. Sociodemographic factors in neovascular age-related macular degeneration. Ophthalmology 2020, 127, 280–282. [Google Scholar] [CrossRef] [PubMed]
- Mahr, M.A.; Hodge, D.O.; Erie, J.C. Racial differences in age-related macular degeneration and associated anti–Vascular Endothelial Growth Factor Intravitreal injections among Medicare beneficiaries. Ophthalmol. Retin. 2018, 2, 1188–1195. [Google Scholar] [CrossRef] [PubMed]
- Sasaki, M.; Harada, S.; Kawasaki, Y.; Watanabe, M.; Ito, H.; Tanaka, H.; Takeuchi, A.; Tsubota, K.; Takebayashi, T.; Nishiwaki, Y.; et al. Gender-specific association of early age-related macular degeneration with systemic and genetic factors in a Japanese population. Sci. Rep. 2018, 8, 785. [Google Scholar] [CrossRef] [Green Version]
- Van Asten, F.; Simmons, M.; Singhal, A.; Keenan, T.D.; Ratnapriya, R.; Agrón, E.; Clemons, T.E.; Swaroop, A.; Lu, Z.; Chew, E.Y.; et al. A deep phenotype association study reveals specific phenotype associations with genetic variants in age-. Theycular degeneration: Age-Related Eye Disease Study 2 (AREDS2) report no. 14. Ophthalmology 2018, 125, 559–568. [Google Scholar] [CrossRef]
- Warwick, A.; Lottery, A. Genetics and genetic testing for age-related macular degeneration. Eye 2018, 32, 849–857. [Google Scholar] [CrossRef]
- Lorés-Motta, L.; de Jong, E.K.; den Hollander, A.I. Exploring the use of molecular biomarkers for precision medicine in age-related macular degeneration. Mol. Diagn. Ther. 2018, 22, 315–343. [Google Scholar] [CrossRef] [Green Version]
- Desmettre, T.J. Epigenetics in age-related macular degeneration (AMD). J. Français D’ophtalmologie 2018, 41, e407–e415. [Google Scholar] [CrossRef]
- Zhou, H.; Zhang, H.; Yu, A.; Xie, J. Association between sunlight exposure and risk of age-related macular degeneration: A meta-analysis. BMC Ophthalmol. 2018, 18, 331. [Google Scholar] [CrossRef] [Green Version]
- Dinu, M.; Pagliai, G.; Casini, A.; Sofi, F. Food groups and risk of age-related macular degeneration: A systematic review with meta-analysis. Eur. J. Nutr. 2019, 58, 2123–2143. [Google Scholar] [CrossRef] [PubMed]
- De Guimaraes, T.A.C.; Georgiou, M.; Bainbridge, J.W.B.; Michaelides, M. Gene therapy for neovascular age-related macular degeneration: Rationale, clinical trials and future directions. Br. J. Ophthalmol. 2021, 105, 151–157. [Google Scholar] [CrossRef] [PubMed] [Green Version]
- De Guimaraes, T.A.C.; Varela, M.D.; Georgiou, M.; Michaelides, M. Treatments for dry age-related macular degeneration: Therapeutic avenues, clinical trials and future directions. Br. J. Ophthalmol. 2022, 106, 297–304. [Google Scholar] [CrossRef] [PubMed]
- Cheung, R.; Chun, J.; Sheidow, T.; Motolko, M.; Malvankar-Mehta, M.S. Diagnostic accuracy of current machine learning classifiers for age-related macular degeneration: A systematic review and meta-analysis. Eye 2022, 36, 994–1004. [Google Scholar] [CrossRef] [PubMed]
- Holz, F.G.; Wolfensberger, T.J.; Piguet, B.; Gross-Jendroska, M.; Wells, J.A.; Minassian, D.C.; Chisholm, I.H.; Bird, A.C. Bilateral macular drusen in age-related macular degeneration. Prognosis and risk factors. Ophthalmology 1994, 101, 8090455. [Google Scholar] [CrossRef] [PubMed]
- Tamakoshi, A.; Yuzawa, M.; Matsui, M.; Uyama, M.; Fujiwara, N.K.; Ohno, Y. Smoking and neovascular form of age-related macular degeneration in late middle-aged males: Findings from a case-control study in Japan. Research Committee on Chorioretinal Degenerations. Br. J. Ophthalmol. 1997, 81, 1722029. [Google Scholar] [CrossRef] [Green Version]
- Klein, R.; Klein, B.E.; Jensen, S.C. The relation of cardiovascular disease and its risk factors to the 5-year incidence of age-related maculopathy: The Beaver Dam Eye Study. Ophthalmology 1997, 104, 1804–1812. [Google Scholar] [CrossRef]
- Buch, H.; Vinding, T.; La Cour, M.; Jensen, G.B.; Prause, J.U.; Nielsen, N.V. Risk factors for age-related maculopathy in a 14-year follow-up study: The Copenhagen City Eye Study. Acta Ophthalmol. Scand. 2005, 83, 409–427. [Google Scholar] [CrossRef]
- Klein, R.; Deng, Y.; Klein, B.E.; Hyman, L.; Seddon, J.; Frank, R.N.; Wallace, R.B.; Hendrix, S.L.; Kuppermann, B.D.; Langer, R.D.; et al. Cardiovascular disease, its risk factors and treatment, and age-related macular degeneration: Women’s Health Initiative Sight Exam ancillary study. Am. J. Ophthalmol. 2007, 143, 2812860. [Google Scholar] [CrossRef] [Green Version]
- Chaine, G.; Hullo, A.; Sahel, J.; Soubrane, G.; Espinasse-Berrod, M.A.; Schutz, D.; Bourguignon, C.; Harpey, C.; Brault, Y.; Coste, M.; et al. Case-control study of the risk factors for age-related macular degeneration. France-DMLA Study Group. Br. J. Ophthalmol. 1998, 82, 1722735. [Google Scholar] [CrossRef] [Green Version]
- Delcourt, C.; Michel, F.; Colvez, A.; Lacroux, A.; Delage, M.; Vernet, M.H. Pola Study Vernet, and Group. Associations of cardiovascular disease and its risk factors with age-related macular degeneration: The POLA study. Ophthalmic Epidemiol. 2001, 8, 237–286. [Google Scholar] [CrossRef] [PubMed]
- Vine, A.K.; Stader, J.; Branham, K.; Musch, D.C.; Swaroop, A. Biomarkers of cardiovascular disease as risk factors for age-related macular degeneration. Ophthalmology 2005, 112, 16225921. [Google Scholar] [CrossRef] [PubMed]
- Clemons, T.E.; Milton, R.C.; Klein, R.; Seddon, J.M.; Ferris, F.L., 3rd. Age-Related Eye Disease Study Research Group. Risk factors for the incidence of Advanced Age-Related Macular Degeneration in the Age-Related Eye Disease Study (AREDS) AREDS report no. 19. Ophthalmology 2005, 112, 1513667. [Google Scholar]
- Fraser-Bell, S.; Wu, J.; Klein, R.; Azen, S.P.; Varma, R. Smoking, alcohol intake, estrogen use, and age-related macular degeneration in Latinos: The Los Angeles Latino Eye Study. Am. J. Ophthalmol. 2006, 141, 79–87. [Google Scholar] [CrossRef] [PubMed]
- Cheung, C.M.G.; Li, X.; Cheng, C.Y.; Zheng, Y.; Mitchell, P.; Wang, J.J.; Jonas, J.B.; Nangia, V.; Wong, T.Y. Prevalence and risk factors for age-related macular degeneration in Indians: A comparative study in Singapore and India. Am. J. Ophthalmol. 2012, 155, 23246273. [Google Scholar]
- Yip, J.L.; Khawaja, A.P.; Chan, M.P.; Broadway, D.C.; Peto, T.; Tufail, A.; Luben, R.; Hayat, S.; Bhaniani, A.; Wareham, N.J.; et al. Cross-Sectional and Longitudinal Associations between Cardiovascular Risk Factors and Age-Related Macular Degeneration in the EPIC-Norfolk Eye Study. PLoS ONE 2015, 10, e0132565. [Google Scholar] [CrossRef] [Green Version]
- Raman, R.; Pal, S.S.; Ganesan, S.; Gella, L.; Vaitheeswaran, K.; Sharma, T. The prevalence and risk factors for age-related macular degeneration in rural-urban India, Sankara Nethralaya Rural-Urban Age-related Macular degeneration study, Report No. 1. Eye 2016, 30, 688–697. [Google Scholar] [CrossRef] [Green Version]
- McGuinness, M.B.; Karahalios, A.; Kasza, J.; Guymer, R.H.; Finger, R.P.; Simpson, J.A. Survival Bias When Assessing Risk Factors for Age-Related Macular Degeneration: A Tutorial with Application to the Exposure of Smoking. Ophthalmic Epidemiol. 2017, 24, 229–238. [Google Scholar] [CrossRef]
- Connolly, E.; Rhatigan, M.; O’Halloran, A.M.; Muldrew, K.A.; Chakravarthy, U.; Cahill, M.; Kenny, R.A.; Doyle, S.L. Prevalence of age-related macular degeneration associated genetic risk factors and 4-year progression data in the Irish population. Br. J. Ophthalmol. 2018, 102, 1691–1695. [Google Scholar] [CrossRef]
- Butt, A.L.; Lee, E.T.; Klein, R.; Russell, D.; Ogola, G.; Warn, A.; Kingsley, R.M.; Yeh, J. Prevalence and risks factors of age-related macular degeneration in Oklahoma Indians: The Vision Keepers Study. Ophthalmology 2011, 118, 1380–1385. [Google Scholar] [CrossRef] [Green Version]
- Hyman, L.; Schachat, A.P.; He, Q.; Leske, M.C. Hypertension, cardiovascular disease, and age-related macular degeneration. Arch. Ophthalmol. 2000, 118, 351–359. [Google Scholar] [CrossRef] [Green Version]
- Age-Related Eye Disease Study Research Group. Risk factors associated with age-related macular degeneration. A case-control study in the age-related eye disease study: Age-Related Eye Disease Study Report Number 3. Ophthalmology 2000, 107, 2224–2232. [Google Scholar]
- Klein, R.; Cruickshanks, K.J.; Nash, S.D.; Krantz, E.M.; Nieto, F.J.; Huang, G.H.; Pankow, J.S.; Klein, B.E. The prevalence of age-related macular degeneration and associated risk factors. Arch Ophthalmol. 2010, 128, 750–758. [Google Scholar] [CrossRef] [PubMed] [Green Version]
- Shim, S.H.; Kim, S.G.; Bae, J.H.; Yu, H.G.; Song, S.J. Risk Factors for Progression of Early Age-Related Macular Degeneration in Koreans. Ophthalmic Epidemiol. 2016, 23, 80–87. [Google Scholar] [CrossRef] [PubMed]
- Erke, M.G.; Bertelsen, G.; Peto, T.; Sjølie, A.K.; Lindekleiv, H.; Njølstad, I. Cardiovascular risk factors associated with age-related macular degeneration: The Tromsø Study. Acta Ophthalmol. 2014, 92, 662–669. [Google Scholar] [CrossRef]
- Krishnaiah, S.; Das, T.; Nirmalan, P.K.; Nutheti, R.; Shamanna, B.R.; Rao, G.N.; Thomas, R. Risk factors for age-related macular degeneration: Findings from the Andhra Pradesh eye disease study in South India. Investig. Ophthalmol. Vis. Sci. 2005, 46, 4442–4451. [Google Scholar] [CrossRef] [Green Version]
- Choudhury, F.; Varma, R.; McKean-Cowdin, R.; Klein, R.; Azen, S.P. Risk factors for four-year incidence and progression of age-related macular degeneration: The Los Angeles Latino eye study. Am. J. Ophthalmol. 2011, 152, 385–395. [Google Scholar] [CrossRef] [Green Version]
- Jonasson, F.; Fisher, D.E.; Eiriksdottir, G.; Sigurdsson, S.; Klein, R.; Launer, L.J.; Harris, T.; Gud-nason, V.; Cotch, M.F. Five-year incidence, progression, and risk factors for age-related macular degeneration: The age, gene/environment susceptibility study. Ophthalmology 2014, 121, 1766–1772. [Google Scholar] [CrossRef] [Green Version]
- Saunier, V.; Merle, B.M.; Delyfer, M.N.; Cougnard-Grégoire, A.; Rougier, M.B.; Amouyel, P.; Lambert, J.C.; Dartigues, J.F.; Korobelnik, J.F.; Delcourt, C. Incidence of and Risk Factors Associated With Age-Related Macular Degeneration: Four-Year Follow-up From the ALIENOR Study. JAMA Ophthalmol. 2018, 136, 473–481. [Google Scholar] [CrossRef]
- Lechanteur, Y.T.; van de Ven, J.P.; Smailhodzic, D.; Boon, C.J.; Klevering, B.J.; Fauser, S.; Groenewoud, J.M.; Van Der Wilt, G.J.; Hollander, A.I.; Hoyng, C.B. Genetic, behavioural, and sociodemographic risk factors for second eye progression in age-related macular degeneration. Investig. Ophthalmol. Vis. Sci. 2012, 53, 5846–5852. [Google Scholar] [CrossRef] [Green Version]
- Cougnard-Gregoire, A.; Delyfer, M.N.; Korobelnik, J.F.; Rougier, M.B.; Le Goff, M.; Dartigues, J.F.; Barberger-Gateau, P.; Delcourt, C. Elevated high-density lipoprotein cholesterol and age-related macular degeneration: The Alienor study. PLoS ONE 2014, 9, e90973. [Google Scholar] [CrossRef] [PubMed] [Green Version]
- Foo, V.H.X.; Yanagi, Y.; Nguyen, Q.D.; Sabanayagam, C.; Lim, S.H.; Neelam, K.; Wang, J.J.; Mitchell, P.; Cheng, C.Y.; Wong, T.Y.; et al. Six-Year Incidence and Risk Factors of Age-Related Macular Degeneration in Singaporean Indians: The Singapore Indian Eye Study. Sci. Rep. 2018, 8, 8868. [Google Scholar] [CrossRef] [PubMed] [Green Version]
- Wang, J.J.; Foran, S.; Smith, W.; Mitchell, P. Risk of age-related macular degeneration in eyes with macular drusen or hyperpigmentation: The Blue Mountains Eye Study cohort. Arch Ophthalmol. 2003, 121, 658–663. [Google Scholar] [CrossRef] [Green Version]
- Aoki, A.; Tan, X.; Yamagishi, R.; Shinkai, S.; Obata, R.; Miyaji, T.; Yamaguchi, T.; Numaga, J.; Ito, H.; Yanagi, Y. Risk Factors for Age-Related Macular Degeneration in an Elderly Japanese Population: The Hatoyama Study. Investig. Ophthalmol. Vis. Sci. 2015, 56, 2580–2585. [Google Scholar] [CrossRef] [PubMed]
- Hallak, J.A.; de Sisternes, L.; Osborne, A.; Yaspan, B.; Rubin, D.L.; Leng, T. Imaging, Genetic, and Demographic Factors Associated With Conversion to Neovascular Age-Related Macular Degeneration: Secondary Analysis of a Randomized Clinical Trial. JAMA Ophthalmol. 2019, 137, 738–744. [Google Scholar] [CrossRef] [PubMed]
- Hammond, B.R., Jr.; Wooten, B.R.; Snodderly, D.M. Cigarette smoking and retinal carotenoids: Implications for age-related macular degeneration. Vision Res. 1996, 36, 3003–3009. [Google Scholar] [CrossRef] [Green Version]
- Abalain, J.H.; Carre, J.L.; Leglise, D.; Robinet, A.; Legall, F.; Meskar, A.; Floch, H.H.; Colin, J. Is age-related macular degeneration associated with serum lipoprotein and lipoparticle levels? Clin. Chim. Acta 2002, 326, 97–104. [Google Scholar] [CrossRef]
- Tomany, S.C.; Wang, J.J.; Van Leeuwen, R.; Klein, R.; Mitchell, P.; Vingerling, J.R.; Klein, B.E.; Smith, W.; De Jong, P.T. Risk factors for incident age-related macular degeneration: Pooled findings from 3 continents. Ophthalmology 2004, 111, 1280–1287. [Google Scholar] [CrossRef]
- Yan, Q. Genome-wide analysis of disease progression in age-related macular degeneration. Hum. Mol. Genet. 2018, 27, 929–940. [Google Scholar] [CrossRef] [Green Version]
- van Grinsven, M.J.; Lechanteur, Y.T.; van de Ven, J.P.; van Ginneken, B.; Hoyng, C.B.; Theelen, T.; Sánchez, C.I. Automatic drusen quantification and risk assessment of age-related macular degeneration on colour fundus images. Investig. Ophthalmol. Vis. Sci. 2013, 54, 3019–3027. [Google Scholar] [CrossRef] [Green Version]
- Van Grinsven, M.J.; Buitendijk, G.H.; Brussee, C.; van Ginneken, B.; Hoyng, C.B.; Theelen, T.; Klaver, C.C.W. Automatic identification of reticular pseudodrusen using multimodal retinal image analysis. Investig. Ophthalmol. Vis. Sci. 2015, 56, 633–639. [Google Scholar] [CrossRef] [PubMed]
- Liefers, B.; Taylor, P.; Alsaedi, A.; Bailey, C.; Balaskas, K.; Dhingra, N.; Egan, C.A.; Rodrigues, F.G.; Gonzalo, C.G.; Heeren, T.F.; et al. Quantification of key retinal features in early and late age-related macular degeneration using deep learning. Am. J. Ophthalmol. 2021, 226, 1–12. [Google Scholar] [CrossRef] [PubMed]
- Schmidt-Erfurth, U.; Bogunovic, H.; Sadeghipour, A.; Clare, B.; Konstantinos, B.; Narendra, D.; Osborne, A.; Waldstein, S.M. Machine learning to analyze the prognostic value of current imaging biomarkers in neovascular age-related macular degeneration. Ophthalmol. Retin. 2018, 2, 24–30. [Google Scholar] [CrossRef] [PubMed]
- Schmidt-Erfurth, U.; Vogl, W.D.; Jampol, L.M.; Bogunović, H. Application of automated quantification of fluid volumes to anti–VEGF therapy of neovascular age-related macular degeneration. Ophthalmology 2020, 127, 1211–1219. [Google Scholar] [CrossRef]
- Keenan, T.D.L.; Chakravarthy, U.; Loewenstein, A.; Chew, E.Y.; Schmidt-Erfurth, U. Automated quantitative assessment of retinal fluid volumes as important biomarkers in neovascular age-related macular degeneration. Am. J. Ophthalmol. 2021, 224, 267–281. [Google Scholar] [CrossRef]
- Lee, H.; Kang, K.E.; Chung, H.; Kim, H.C. Automated segmentation of lesions, including subretinal hyperreflective material in neovascular age-related macular degeneration. Am. J. Ophthalmol. 2018, 191, 64–75. [Google Scholar] [CrossRef]
- Yim, J.; Chopra, R.; Spitz, T.; Winkens, J.; Obika, A.; Kelly, C.; Askham, H.; Lukic, M.; Huemer, J.; Fasler, K.; et al. Predicting conversion to wet age-related macular degeneration using deep learning. Nat. Med. 2020, 26, 892–899. [Google Scholar] [CrossRef]
- Yan, Q.; Weeks, D.E.; Xin, H.; Swaroop, A.; Chew, E.Y.; Huang, H.; Ding, Y.; Chen, W. Deep-learning-based prediction of late age-related macular degeneration progression. Nat. Mach. Intell. 2020, 2, 141–150. [Google Scholar] [CrossRef]
- Peng, Y.; Keenan, T.D.; Chen, Q.; Agrón, E.; Allot, A.; Wong, W.T.; Chew, E.Y.; Lu, Z. Predicting risk of late age-related macular degeneration using deep learning. NPJ Digit. Med. 2020, 3, 111. [Google Scholar] [CrossRef]
- Ajana, S.; Cougnard-Grégoire, A.; Colijn, J.M.; Merle, B.M.; Verzijden, T.; de Jong, P.T.; Hofman, A.; Vingerling, J.R.; Hejblum, B.P.; Korobelnik, J.-F.; et al. Predicting progression to advanced age-related macular degeneration from clinical, genetic and lifestyle factors using machine learning. Ophthalmology 2020, 128, 587–597. [Google Scholar] [CrossRef]
- Ikram, M.A.; Brusselle, G.G.; Murad, S.D.; van Duijn, C.M.; Franco, O.H.; Goedegebure; Klaver, C.C.W.; Nijsten, T.E.C.; Peeters, R.P.; Stricker, B.H.; et al. The Rotterdam Study: 2018 update on objectives, design and main results. Eur. J. Epidemiol. 2017, 32, 807–850. [Google Scholar] [CrossRef] [PubMed] [Green Version]
- Delcourt, C.; Korobelnik, J.F.; Barberger-Gateau, P.; Delyfer, M.N.; Rougier, M.B.; Le Goff, M.; Malet, F.; Colin, J.; Dartigues, J.F. Nutrition and Age-Related Eye Dis- eases: The ALIENOR (Antioxydants, Lipides Essentiels, Nutrition et Maladies Oculaires) Study. J. Nutr. Health Aging 2010, 14, 854–861. [Google Scholar] [CrossRef] [PubMed]
- Seddon, J.M.; Reynolds, R.; Maller, J.; Fagerness, J.A.; Daly, M.J.; Rosner, B. Prediction model for prevalence and incidence of advanced age-related macular degeneration based on genetic, demographic, and environmental variables. Investig. Ophthalmol. Vis. Sci. 2008, 50, 2044–2053. [Google Scholar] [CrossRef] [PubMed]
- D’Agostino, R.B.; Grundy, S.; Sullivan, L.M.; Wilson, P.; CHD Risk Prediction Group. Validation of the Framingham coronary heart disease prediction scores: Results of a multiple ethnic groups investigation. JAMA 2001, 286, 180–187. [Google Scholar] [CrossRef] [Green Version]
- Seddon, J.M.; Reynolds, R.; Yu, Y.; Daly, M.J.; Rosner, B. Risk models for progression to advanced age-related macular degeneration using demographic, environmental, genetic, and ocular factors. Ophthalmology 2011, 118, 2203–2211. [Google Scholar] [CrossRef] [Green Version]
- Klein, M.L.; Francis, P.J.; Ferris, F.L.; Hamon, S.C.; Clemons, T.E. Risk assessment model for the development of advanced age-related macular degeneration. Arch. Ophthalmol. 2011, 129, 1543–1550. [Google Scholar] [CrossRef]
- Seddon, J.M.; Silver, R.E.; Kwong, M.; Rosner, B. Risk Prediction for Progression of Macular Degeneration: 10 Common and Rare Genetic Variants, Demographic, Environmental, and Macular Covariates. Investig. Ophthalmol. Vis. Sci. 2015, 56, 2192–2202. [Google Scholar] [CrossRef]
- Spencer, K.L.; Olson, L.M.; Schnetz-Boutaud, N.; Gallins, P.; Agarwal, A.; Iannaccone, A.; Kritchevsky, S.B.; Garcia, M.; Nalls, M.A.; Newman, A.B.; et al. Using genetic variation and environmental risk factor data to identify individuals at high risk for age-related macular degeneration. PLoS ONE 2011, 6, e17784. [Google Scholar] [CrossRef] [Green Version]
- Fraccaro, P.; Nicolo, M.; Bonetto, M.; Giacomini, M.; Weller, P.; Traverso, C.E.; Prosperi, M. Combining macula clinical signs and patient characteristics for age-related macular degeneration diagnosis: A machine learning approach. BMC Ophthalmol. 2015, 15, 10. [Google Scholar] [CrossRef] [Green Version]
- Shin, K.U.; Song, S.J.; Bae, J.H.; Lee, M.Y. Risk Prediction Model for Progression of Age-Related Macular Degeneration. Ophthalmic. Res. 2017, 57, 32–36. [Google Scholar] [CrossRef]
- Verlato, G.; Marrelli, D.; Accordini, S.; Bencivenga, M.; Di Leo, A.; Marchet, A.; Petrioli, R.; Zoppini, G.; Muggeo, M.; Roviello, F.; et al. Short-term and long-term risk factors in gastric cancer. World J. Gastroenterol. 2015, 21, 6434–6443. [Google Scholar] [CrossRef] [PubMed]
- Verlato, G.; Giacopuzzi, S.; Bencivenga, M.; Morgagni, P.; De Manzoni, G. Problems faced by evidence-based medicine in evaluating lymphadenectomy for gastric cancer. World J. Gastroenterol. 2014, 20, 12883–12891. [Google Scholar] [CrossRef]
- Fabris, A.; Bruschi, M.; Santucci, L.; Candiano, G.; Granata, S.; Dalla Gassa, A.; Antonucci, N.; Petretto, A.; Ghiggeri, G.M.; Gambaro, G.; et al. Proteomic-based research strategy identified laminin subunit alpha 2 as a potential urinary-specific biomarker for the medullary sponge kidney disease. Kidney Int. 2017, 91, 459–468. [Google Scholar] [CrossRef] [PubMed]
- De Manzoni, G.; Marrelli, D.; Verlato, G.; Morgagni, P.; Roviello, F. Western perspective and epidemiology of gastric cancer. In Gastric Cancer: Principles and Practice; Springer International Publishing: Cham, Switzerland, 2015; pp. 111–123. ISBN 9783319158266. [Google Scholar]
- Bencivenga, M.; Verlato, G.; Mengardo, V.; Scorsone, L.; Sacco, M.; Torroni, L.; Giacopuzzi, S.; de Manzoni, G. Is There Any Role for Super-Extended Limphadenectomy in Advanced Gastric Cancer? Results of an Observational Study from a Western High Volume Center. J. Clin. Med. 2019, 8, 1799. [Google Scholar] [CrossRef]
- Ngiam, K.Y.; Khor, I.W. Big data and machine learning algorithms for healthcare delivery. Lancet Oncol. 2019, 20, e262–e273. [Google Scholar] [CrossRef] [PubMed]
- Saha, S.; Nassisi, M.; Wang, M.; Lindenberg, S.; Sadda, S.; Hu, Z.J. Automated detection and classification of early AMD biomarkers using deep learning. Sci. Rep. 2019, 9, 10990. [Google Scholar] [CrossRef] [Green Version]
- Gulshan, V.; Peng, L.; Coram, M.; Stumpe, M.C.; Wu, D.; Narayanaswamy, A.; Venugopalan, S.; Widner, K.; Madams, T.; Cuadros, J.; et al. Development and validation of a deep learning algorithm for detection of diabetic retinopathy in retinal fundus photographs. JAMA 2016, 316, 2402–2410. [Google Scholar] [CrossRef]
- Abràmoff, M.D.; Lou, Y.; Erginay, A.; Clarida, W.; Amelon, R.; Folk, J.C.; Niemeijer, M. Improved automated detection of diabetic retinopathy on a publicly available dataset through integration of deep learning. Investig. Ophthalmol. Vis. Sci. 2016, 57, 5200–5206. [Google Scholar] [CrossRef] [Green Version]
- Garcia, R.; Leng, T. Automated identification of diabetic retinopathy using deep learning. Ophthalmology 2017, 124, 962–969. [Google Scholar] [CrossRef]
- Ting, D.S.W.; Cheung, C.Y.L.; Lim, G.; Tan, G.S.W.; Quang, N.D.; Gan, A.; Hamzah, H.; Garcia-Franco, R.; Yeo, I.Y.S.; Lee, S.Y.; et al. Development and validation of a deep learning system for diabetic retinopathy and related eye diseases using retinal images from multiethnic populations with diabetes. JAMA 2017, 318, 2211–2223. [Google Scholar] [CrossRef]
- Ramanishka, V.; Das, A.; Zhang, J. Top-down visual saliency guided by captions. arXiv 2016, arXiv:1612.07360. [Google Scholar]
- Jenkins, A.J.; Joglekar, M.V.; Hardikar, A.A.; Keech, A.C.; O’Neal, D.N.; Januszewski, A.S. Biomarkers in diabetic retinopathy. Rev. Diabet. Stud. RDS 2015, 12, 159. [Google Scholar] [CrossRef] [PubMed] [Green Version]
- Bianchetti, G.; Viti, L.; Scupola, A.; Di Leo, M.; Tartaglione, L.; Flex, A.; De Spirito, M.; Pitocco, D.; Maulucci, G. Erythrocyte membrane fluidity as a marker of diabetic retinopathy in type 1 diabetes mellitus. Eur. J. Clin. Investig. 2021, 51, e13455. [Google Scholar] [CrossRef]
- Bianchetti, G.; Ciccarone, F.; Ciriolo, M.R.; De Spirito, M.; Pani, G.; Maulucci, G. Label-free metabolic clustering through unsupervised pixel classification of multiparametric fluorescent images. Anal. Chim. Acta 2021, 1148, 238173. [Google Scholar] [CrossRef]
- Loo, J.; Kriegel, M.F.; Tuohy, M.M.; Kim, K.H.; Prajna, V.; Woodward, M.A.; Farsiu, S. Open-source automatic segmentation of ocular structures and biomarkers of microbial keratitis on slit-lamp photography images using deep learning. IEEE J. Biomed. Health Inform. 2020, 25, 88–99. [Google Scholar] [CrossRef]


| Technique | Source | Study Type | Country | Sex (%male) | Age Range (Years) | AMD Type | Classification Criteria | Adjustment | Risk Factors Identified |
|---|---|---|---|---|---|---|---|---|---|
| Poisson Regression Analysis | Holz et al. [29] | Prospective | London | 46.8 | Older than 50 years of age | AMD | Standardized grading scheme | Age, sex and smoking | Focal hyperpigmentation, slow choroidal filling and degree of confluence of drusen |
| Unconditional logistic analysis | Tamakoshi et al. [30] | Case-control | Japan | 100 | Aged 50 to 69 years | Neovascular AMD | NR | Age, sex | Cigarette smoking |
| Univariate and multivariate analyses | Klein et al. [31] | Population-based | United States | NR | 43–86 years of age | ARM | WARMGS | Age and gender | (No strong relation between cardiovascular disease and most of its risk factors with the incidence of lesions associated with age-related maculopathy) |
| Buch et al. [32] | Population-based cohort | Denmark | 36.2 | Between 60 and 80 years | ARM | Modification of WARMGS | Age and gender | Age, cataract, family history, alcohol consumption, the apolipoproteins A1 and B | |
| Women’s Health Initiative Sight Exam ancillary study [33] | Ancillary | United States | 0 | 63 years and older. | Late AMD | WARMGS | Age | Smoking, use of calcium channel blockers, diabetes, and obesity | |
| Logistic Regression | Chaine et al. [34] | Case-control | France | 31 | 50–85 years | AMD | NR | NR | Arterial hypertension, coronary disease, hyperopia, light-coloured irises, lens opacities and previous cataract surgery |
| POLA study [35] | Prospective | France | 43.8 | 60 years or over | AMD | International classification * | Age and gender | (No significant association of late AMD with a history of cardiovascular disease, diabetes, and hypertension) | |
| Vine et al. [36] | Case-control | United States | 41.8 | ≥65 Year old | AMD | NR | Age, CRP, and homocysteine level | CRP and homocysteine level | |
| AREDS study [37] | Clinic-based prospective cohort | NR | NR | 55 to 80 years | Neovascular AMD | NR | Age, gender, and AREDS treatment | Smoking, race, and BMI | |
| Fraser-Bell et al. [38] | Population-based, cross-sectional | United States | 42 | 40 years old | Early and advanced AMD | Modified WARMGS | Age, sex and smoking status | Smoking and heavy alcohol consumption | |
| Gemmy et al. [39] | Population-based, cross-sectional | Singapore and India | 50.2 (Singapore) & 47.3 (India) | 40–83 years | Early AMD | International classification of the Wisconsin age-related maculopathy | Age, BMI, sex, cholesterol, myocardial infarction, hypertension, central corneal thickness axial length, and IOP. | Shorter axial length higher BMI, previous cataract surgery, lower cholesterol and hypertension. | |
| Yip et al. [40] | Prospective cohort | United Kingdom | 43.1 | 44–91 years | AMD | Modified Wisconsin protocol * | Sex, education, smoking, and SBP. | Older age, baseline CRP, and a higher baseline and follow-up levels of HDL. | |
| Raman et al. [41] | Population-based cross-sectional | India | NR | ≥60 years | Early and late AMD | International ARM epidemiological study group | Age and gender | Age per year increase, middle socioeconomic status, and smokeless tobacco | |
| Myra et al. [42] | Observational | Australia | 40 | 47–85 years | Late AMD | NR | Sex, age at fundus photography, index of relative socioeconomic disadvantage, and the Mediterranean diet score | Current smokers | |
| Connolly et al. [43] | Cohort | Ireland | 44 | ≥50 years | AMD | A modified version of the international classification and grading system for AMD | Age, sex, education and CFH | Older age, the presence of ARMS2 and CFH risk alleles | |
| Butt et al. [44] | Cross-sectional | United States | NR | 45 to 74 years | Early and late AMD | University of Wisconsin ocular epidemiology reading center | NR | Age and HDL cholesterol | |
| Polychotomous logistic regression analyses | Hyman et al. [45] | Case-control | United States | 40 | Between the age of 50 and 79 years | Neovascular AMD | Independent graders at the reading center | Age, sex, and energy intake. | Moderate to severe hypertension |
| AREDS study [46] | Case-control | United States | 44.2 | Aged 60 to 80 years | AMD | The Wisconsin age-related maculopathy grading system # | Age and gender | Smoking, hypertension, lens opacities, hyperopia, female gender, less education, white race, and increased BMI | |
| Multivariable logistic regression models | Klein et al. [47] | Cohort | United States | 45.6 | Aged 21 to 84 years | AMD | WARMGS | Age and sex | Smoking and serum HDL cholesterol |
| Shim et al. [48] | Prospective cohort | South Korea | 60.5 | Older than 50 years | Early AMD progression | International age-related maculopathy (ARM) epidemiological study group and WARMGS | Age, alcohol consumption, smoking status, BMI, BP, HDL cholesterol, and total cholesterol | An increasing number of drusen, central drusen location, hypertension, and current smoking. | |
| Erke et al. [49] | Population-based, cross-sectional | Norway | 43 | 65–87 years | AMD and late AMD | International classification system * | Age, sex, smoking and SBP | Smoking, higher SBP, physical inactivity, overweight and obesity in women | |
| Standard Bivariate and Multivariate Analyses | Krishnaiah et al. [50] | Population-based, cross-sectional | India | 47 | Aged 40 to 102 years | AMD | International classification and grading system | Age, area and gender | Ageing, smoking, prior cataract surgery, and presence of cortical cataract. |
| Multivariate stepwise logistic regression | Choudhury et al. [51] | Population-based prospective cohort | United States | 39.1 | Aged 40 or older | Any AMD and progression of AMD | Modified WARMGS | Age | Older age, current smoking and higher pulse pressure |
| Jonasson et al. [52] | Population-based prospective cohort | Iceland | 42.4 | Aged 67 years and older | AMD | Modification of WARMGS | Age and sex | Age, smoking, plasma HDL cholesterol, BMI and female sex | |
| Saunier et al. [53] | Population-based cohort | France | 37.3 | 73 years or older | Early to advanced AMD | International classification * and to a modification of the grading scheme used in the multi-ethnic study of atherosclerosis @ | Age and sex | Fellow eye, smoking, plasma HDL cholesterol concentration, and CFH Y402H genotype | |
| Multivariate Cox regression survival analysis | Lechanteur et al. [54] | Retrospective | Netherlands | 34.3 | 54.3–93.4 years. | End-stage AMD | NR | Age, education, sex, baseline AMD grade, smoking, BMI, six genetic variants and associated genotypes, and treatment groups | Sex, smoking status, age, to a lesser extent BMI, CFI (rs10033900) and LPL (rs12678919) |
| Generalized estimating equation logistic regressions | Cougnard et al. [55] | Population-based | France | 38.1 | 65 years and older | Early and any AMD | International classification *@ | Age, educational level, sex, BMI, smoking, lipid-lowering medication use for all relevant genetic polymorphisms, cardiovascular disease and diabetes, | HDL, TC, LDL, higher HDL, and TG |
| Foo et al. [56] | Population-based cohort | Singapore | 49.7 | NR | Early AMD | WARMGS | Age, gender, hypertension, total cholesterol, cardiovascular disease, BMI categories, smoking status, alcohol consumption frequency, serum CRP and ARMS2 genetic loci. | Heavy alcohol drinking, underweight BMI, ARMS2 rs3750847 homozygous genetic loci carrier, and cardiovascular disease history. | |
| Wang et al. [57] | Population-based cohort | Australia | 39.2 | 49 years or older | AMD | WARMGS | Age, sex, smoking status and the correlation between eyes | Eyes with indistinct soft drusen, large drusen, hyperpigmentation or a large area of the macula covered by drusen. | |
| Logistic regression analyses and Mantel-Haenszel analysis | Aoki et al. [58] | Cross-sectional | Japan | 60 | 65–74 years and 75–84 years | AMD | Simplified severity scale for AMD from the AREDS | Age | CFH I62V and ARMS2 A69S variant |
| Survival analysis and Cox proportional hazards regression | Hallak et al. [59] | Retrospective, post hoc secondary analysis | United States | 40.8 | 50 years or older | Neovascular AMD | NR | NR | Mean drusen reflectivity, the total en-face area of the drusen restricted to a circular area of 3 mm from the fovea and one genetic variant (rs61941274) |
| Others | Hammond et al. [60] | Case-control | United States | 47 | NR | Neovascular AMD | NR | NR | Smokers |
| Alain et al. [61] | Case-control | France | 22.6 | Mean age 77 years | AMD | WARMGS | NR | Perturbations of HDL metabolism | |
| Tomany et al. [62] | Population-based cohort | Australia, Netherlands, and the United States | 43 | 43–95 years | AMD | Wisconsin and international age-related maculopathy grading systems | Age, gender (when appropriate), data source, and follow-up time | Smoking |
| Source | Technique | Dataset | Metrics | Disease |
|---|---|---|---|---|
| Grinsven et al. [64] | Supervised machine learning algorithm | A total of 407 images of different eyes with nonadvanced stages of AMD (i.e., stages 1, 2, and 3 according to the criteria shown in Table 1), with sufficient grading quality for human graders, were selected consecutively from the European genetic database (EUGENDA), a large multicenter database for clinical and molecular analysis of AMD. | AUROC values of 0.948 and 0.954 | AMD risk assessment |
| Grinsven et al. [65] | Machine learning algorithm | A set of subjects with and without RPD were selected from the Rotterdam Study. A prospective cohort study aimed to investigate risk factors for chronic diseases in the elderly. | AUROC value of 0.941 | Reticular pseudo drusen (RPD) detection |
| Liefers et al. [66] | Deep learning model | This study’s imaging data (OCT B scans) were obtained from 30,337 patients at five centres in the UK (NRES Committee London, City Road and Hampstead, London). | On 11 of 13 features, the model obtained a mean Dice score of 0.63 ± 0.15, compared with 0.61 ± 0.17 for the observers. ICC was 0.66 ± 0.22, compared with 0.62 ± 0.21 for the observers | Feature segmentation associated with neovascular and atrophic AMD |
| Schmidt-Erfuth et al. [67] | Random forest regression algorithm | Data (spectral-domain (SD) OCT volume scans) of 614 evaluable patients receiving intravitreal ranibizumab monthly or pro re nata according to protocol-specified criteria in the HARBOR trial were studied. | At baseline, OCT features and BCVA were correlated with R2 = 0.21. | Predict best-corrected visual acuity (BCVA) outcomes |
| Schmidt-Erfuth et al. [68] | Deep learning method (convolutional neural network (CNN)) | SD-OCT scans of 1095 patients enrolled in the HARBOR trial | NR | Measure fluid response to anti-vascular endothelial growth factor (VEGF) treatment in neovascular AMD |
| Keenan et al. [69] | Artificial Intelligence Algorithms | Data from (a) the HARBOR trial, (b) a tertiary referral retinal centre in the United Kingdom, (c) a tertiary referral retinal centre in Israel, and (d) the AREDS2 10-year follow-up. were studied, | Large ranges that differed by population were observed at the treatment-naive stage: 0–3435 nL (IRF), 0–5018 nL (SRF), and 0–10,022 nL (PED). | Validation of retinal fluid volumes (IRF, SRF and PED) |
| Lee et al. [70] | Automated segmentation algorithm with a CNN | A dataset including 930 B-scans from 93 eyes of 93 patients with nAMD. | Dice coefficients for segmentation of IRF, SRF, SHRM, and PED were 0.78, 0.82, 0.75, and 0.80 | To quantify and detect intraretinal fluid (IRF), subretinal fluid (SRF), pigment epithelial detachment (PED), and subretinal hyperreflective material (SHRM) with nAMD |
| Yim et al. [71] | Artificial intelligence system | A cohort of 2,795 patients (OCT scans) across seven different sites who were first diagnosed with nAMD between June 2012 and June 2017 | Sensitivity of 80% at 55% specificity and 34% specificity at 90% sensitivity | Progression to exudative wet AMD |
| Yan et al. [72] | Modified deep convolutional neural network | The data consisted of 52 AMD-associated genetic variants and 31,262 fundus images from 1,351 subjects from the age-related eye disease study (AREDS) fundus images coupled with genotypes. | AUC value of 0.85 | AMD progression |
| Peng et al. [73] | Deep learning (DL) and survival analysis | AREDS and AREDS2 | 5-year C-statistic 86.4 | Late AMD |
| Ajana et al. [74] | Prediction model used bootstrap lasso for survival analysis | The training data set included Rotterdam study I (RS-I) enrolled participants. | AUC estimation in RS-I was 0.92 at five years, 0.92 at ten years and 0.91 at 15 years | Advanced AMD |
| Seddon et al. [77] | Predictive model | The data was from 1446 individuals who participated in the multicenter AREDS, of which 279 progressed to advanced AMD and 1167 did not progress during 6.3 years of follow-up | C statistic score of 0.83 | Prevalence and incidence of AMD |
| Seddon et al. [79] | Model of AMD progression | Data consisted of 2937 individuals in the AREDS | AUC 0.915 in the total sample | AMD Progression |
| Klein et al. [80] | Risk assessment model | Longitudinal data from 2846 participants in the AREDS | C statistic = 0.872. Brier score at 5 years = 0.08 | Advanced AMD |
| Seddon et al. [81] | Predictive model and online application | Data from the AREDS for Caucasian participants were used for this analysis | AUC- 91.1 | Progression to advanced AMD |
| Spencer et al. [82] | Logistic regression and grammatical evolution of neural networks (GENN) models | A VM family dataset, the population-based age-related maculopathy ancillary (ARMA) study cohort, and Vanderbilt-Miami (VM) clinic-based case-control dataset. | Sensitivity of 77.0% and specificity of 74.1% | High- and low-risk groups for AMD |
| Fraccaro et al. [83] | Random forests, AdaBoost and SVM, as well as white-box methods, including decision trees and logistic regression | Data on healthy subjects, study participants, and patients with macular diseases were collected from March 2013 to January 2014 during routine clinical practice at the Medical Retina Center of the University Eye Clinic of Genoa (Italy). | Logistic Regression, AdaBoost, and random forests achieved a mean AUC of 0.92, followed by decision trees and SVM with a mean AUC of 0.90. | Diagnose AMD |
| Shin et al. [84] | Risk prediction model | The study sample included 50 years of age or older individuals counting 10,890; 318 (2.92%) presented with early AMD findings in baseline examinations. | C statistic-0.84 | Progression of AMD |
Disclaimer/Publisher’s Note: The statements, opinions and data contained in all publications are solely those of the individual author(s) and contributor(s) and not of MDPI and/or the editor(s). MDPI and/or the editor(s) disclaim responsibility for any injury to people or property resulting from any ideas, methods, instructions or products referred to in the content. |
© 2022 by the authors. Licensee MDPI, Basel, Switzerland. This article is an open access article distributed under the terms and conditions of the Creative Commons Attribution (CC BY) license (https://creativecommons.org/licenses/by/4.0/).
Share and Cite
Vyas, A.; Raman, S.; Surya, J.; Sen, S.; Raman, R. The Need for Artificial Intelligence Based Risk Factor Analysis for Age-Related Macular Degeneration: A Review. Diagnostics 2023, 13, 130. https://doi.org/10.3390/diagnostics13010130
Vyas A, Raman S, Surya J, Sen S, Raman R. The Need for Artificial Intelligence Based Risk Factor Analysis for Age-Related Macular Degeneration: A Review. Diagnostics. 2023; 13(1):130. https://doi.org/10.3390/diagnostics13010130
Chicago/Turabian StyleVyas, Abhishek, Sundaresan Raman, Janani Surya, Sagnik Sen, and Rajiv Raman. 2023. "The Need for Artificial Intelligence Based Risk Factor Analysis for Age-Related Macular Degeneration: A Review" Diagnostics 13, no. 1: 130. https://doi.org/10.3390/diagnostics13010130