Systematic Review

Automated Identification of Multiple Findings on Brain MRI for Improving Scan Acquisition and Interpretation Workflows: A Systematic Review

by
Kaining Sheng
1,2,*,
Cecilie Mørck Offersen
1,2,
Jon Middleton
3,4,
Jonathan Frederik Carlsen
1,2,
Thomas Clement Truelsen
2,5,
Akshay Pai
1,4,
Jacob Johansen
3,4 and
Michael Bachmann Nielsen
1,2
1
Department of Radiology, Copenhagen University Hospital Rigshospitalet, 2100 Copenhagen, Denmark
2
Department of Clinical Medicine, University of Copenhagen, 2200 Copenhagen, Denmark
3
Department of Computer Science, University of Copenhagen, 2200 Copenhagen, Denmark
4
Cerebriu A/S, 1127 Copenhagen, Denmark
5
Department of Neurology, Copenhagen University Hospital Rigshospitalet, 2100 Copenhagen, Denmark
*
Author to whom correspondence should be addressed.
Diagnostics 2022, 12(8), 1878; https://doi.org/10.3390/diagnostics12081878
Submission received: 21 June 2022 / Revised: 30 July 2022 / Accepted: 1 August 2022 / Published: 3 August 2022

Abstract

:
We conducted a systematic review of the current status of machine learning (ML) algorithms’ ability to identify multiple brain diseases, and we evaluated their applicability for improving existing scan acquisition and interpretation workflows. PubMed Medline, Ovid Embase, Scopus, Web of Science, and IEEE Xplore literature databases were searched for relevant studies published between January 2017 and February 2022. The quality of the included studies was assessed using the Quality Assessment of Diagnostic Accuracy Studies 2 tool. The applicability of ML algorithms for successful workflow improvement was qualitatively assessed based on the satisfaction of three clinical requirements. A total of 19 studies were included for qualitative synthesis. The included studies performed classification tasks (n = 12) and segmentation tasks (n = 7). For classification algorithms, the area under the receiver operating characteristic curve (AUC) ranged from 0.765 to 0.997, while accuracy, sensitivity, and specificity ranged from 80% to 100%, 72% to 100%, and 65% to 100%, respectively. For segmentation algorithms, the Dice coefficient ranged from 0.300 to 0.912. No studies satisfied all clinical requirements for successful workflow improvements due to key limitations pertaining to the study’s design, study data, reference standards, and performance reporting. Standardized reporting guidelines tailored for ML in radiology, prospective study designs, and multi-site testing could help alleviate this.

1. Introduction

Brain magnetic resonance imaging (MRI) is recognized as the imaging modality that produces the best images of brain tissues, body fluids, and fat [1]. It remains the most appropriate modality for diagnosing patients with symptoms of multiple brain diseases including inflammatory diseases, dementia, neurodegenerative disease, cerebrovascular disease, and brain tumors [2,3,4,5]; hence, it plays an important role in multiple clinical scenarios ranging from acute diagnostics to routine follow-ups.
A brain MRI scan typically consists of several scan sequences, the most commonly included being T1-weighted (T1) and T2-weighted (T2) sequences, a diffusion-weighted imaging (DWI) sequence, a fluid attenuated inversion-recovery (FLAIR) sequence, and a bleeding sensitive sequence, e.g., T2* gradient-recall-echo (T2*-GRE) [6]. Selecting the appropriate sequences a priori can be challenging, because many brain diseases often present with the same symptoms [7] while requiring different combinations of sequences for correct diagnosis. Inefficient MR sequence selection can increase the risk of inconclusive scans, scan recalls, and inappropriate usage of gadolinium contrast agents [8]. It can also cause the redundant scanning of patients and result in increased patient inconvenience [8], higher risks of radiologist burnout due to increased workload [9], and prolonged reporting time of potentially time-sensitive diseases [10].
In recent years, machine learning (ML) has been increasingly applied in neuroimaging to alleviate some of these challenges using automated workflow improvements [11]. A potential application of ML algorithms could be to automate scan-sequence acquisition alterations based on real-time image analysis while the patient is still in the scanner [12]. Another application could be to improve scan interpretation efficiencies by prioritizing the reading list of essential and acute/critical findings [11]. However, to improve any existing workflows, ML algorithms require the satisfaction of at least three essential requirements. First, the ML algorithms must be developed and tested in a scenario that reflects clinical practice [13,14]. For improving scan acquisition and interpretation workflows, this means ML algorithms capable of automatically identifying or differentiating between multiple brain diseases with the identification of brain infarcts, hemorrhages, and tumors, being a must due to their frequent and time-critical nature [15,16]. This also requires consecutive datasets not prone to spectrum biases and ground-truth labels unaffected by selection bias [13]. Secondly, tests of the ML algorithm should be performed on an out-of-distribution dataset to account for potential overfitting [13,17]. This could for instance be achieved by testing the algorithms on an external dataset sourced from a different point in time or geographical location compared to the training dataset. Finally, if ML algorithms are to gain widespread trust and usage, their technical performance results should be acceptable with respect to balancing increased workloads from false-positive findings and risk of missing important findings from false-negative results [18]. One method of assessing whether an ML algorithm performs a certain task acceptably could be to compare its performance to that of domain experts performing similar tasks.
Many studies about ML algorithms used within neuroradiology exist [19]. However, few of them address the important question of whether these algorithms could bring actual benefits to clinicians and patients if they were deployed today. To address this knowledge gap, we conducted a systematic review on how well the most recent ML algorithms could identify multiple brain diseases with the aim of evaluating their applicability for improving existing scan acquisition and interpretation workflows based on the satisfaction of the aforementioned requirements.

2. Materials and Methods

This systematic review was conducted in accordance with the Preferred Reporting Items for Systematic Reviews and Meta-Analyses (PRISMA) statement [20]. The study protocol was registered in the Prospective Register of Systematic Reviews (PROSPERO) under number CRD42022329801 during the research process.

2.1. Literature Search

The literature was searched in MEDLINE (accessed through PubMed), Ovid Embase, Elsevier Scopus, Clarivate Web of Science, and IEEE Explore in order to find studies covering both clinical and technical aspects of the review question. The search period ranged between 1 January 2017 and 10 February 2022. This relatively short period was selected due to the nature of deep learning research, with rapid development cycles rendering older studies less relevant for the review question. Structured search terms (MeSH, Emtree), such as “magnetic resonance imaging”, “machine learning”, and “brain diseases”, were combined using Boolean operators and supplemented with free keyword search terms, such as “detection”, “classification”, “triaging”, or “workflow”. Multiple additional keywords describing pathologies of interest, such as “neoplasm”, “stroke”, “intraparenchymal hemorrhage”, “subarachnoid hemorrhages”, and “subdural hemorrhages”, were also included in the search string. The full search string can be found in Appendix A.

2.2. Study Selection

Records that developed ML algorithms for the automated identification of normal and abnormal brain diseases were screened. Main inclusion and exclusion criteria are listed in Table 1.
Two medical doctors (K.S. and C.M.O.) served as reviewers. They independently screened all records based on title and abstract. This was followed by the extraction of relevant reports for full-text screening and final study inclusion. For the process of record and report screening, Covidence (Melbourne, Australia) was used. Discussions between both reviewers were held to resolve any conflicts, but if a consensus was not reached, a third reviewer (J.F.C.) was consulted.

2.3. Data Extraction and Analysis

The reviewers independently extracted data from the included studies according to a pre-defined datasheet. Study and algorithm characteristics were extracted and comprised of the following: (a) study information, (b) population/dataset characteristics including number of patients or images, pathology in the dataset, and MR sequences available, (c) aim of algorithms, (d) type of algorithm, and (e) training and testing strategies including how data-splits were performed. Reported performance metrics together with confidence intervals were also extracted, including accuracy, sensitivity, specificity, F1-score, negative predictive value (NPV), positive predictive value (PPV), and area under the receiver operating characteristic curve (AUC). Furthermore, the Dice score coefficient (DSC), which is one of the most common evaluation metrics used in medical segmentation tasks [21], was extracted where applicable in brain segmentation studies. Performance numbers were summarized using descriptive statistics. If multiple results were reported for different variations of the same algorithm, only the best performance result was extracted unless otherwise stated. When available, performance results were extracted from external test datasets. Included studies were divided by tasks of the included algorithms. The analysis of data was primarily conducted using pivot tables and the in-built analysis tools of Microsoft Excel.

2.4. Quality Assessment of Included Studies

The two reviewers independently assessed the quality of the included studies by using the tailored questionnaire Quality Assessment of Diagnostic Accuracy Studies 2 (QUADAS-2) [22] with signaling questions covering risk of bias and concern for applicability in the domains of patient selection, index test, reference test, and flow and timing. For each study, the respective domains were graded as high-, unclear-, or low risk of bias/concern for applicability. Discordance between the reviewers was resolved through discussion.

2.5. Evaluation of Applicability for Workflow Improvements

The applicability of each included ML algorithm for improving scan acquisition and interpretation workflows was qualitatively assessed based on three essential requirements previously mentioned in the Introduction (Section 1): (A) reflection of clinical practice, (B) testing on an external out-of-distribution dataset, and (C) acceptable performance results. Each requirement was indicated as being ‘Satisfied’ (S) or ‘Not Satisfied’ (NS). The first requirement (A) was satisfied if the patient population was consecutively sampled, if the disease distribution was well reported, and if the study was assessed as having low risk of bias/concern for applicability for the review question. The second requirement (B) was satisfied if external test datasets with data from a different time-period and geographical location were used to produce performance results. Lastly, the third requirement (C) was graded satisfied if a majority of the abovementioned result metrics exceeded a pre-defined threshold of 85% of the maximum attainable value. This threshold for acceptable performance was selected because it reflected the performance levels of a neuroradiologist when performing similar disease identification tasks [23].

3. Results

3.1. Study Selection and Data Extraction

The search of electronic databases returned 5688 records. The removal of duplicates resulted in 3542 records. Screening record titles and abstracts resulted in 81 reports selected for full-text eligibility assessments, of which 19 studies were included for qualitative review. The study inclusion process is illustrated in Figure 1.
Details about the study’s characteristics are summarized in Table 2. All 19 studies included were of retrospective design. Study populations varied with regard to source and size. Twelve out of nineteen studies (63%) used public datasets for development and testing of their algorithms. These datasets included The Whole Brain Atlas from Harvard Medical School (HMS) [24], The Cancer Imaging Archive (TCIA) [25], the Brain Tumor Segmentation (BRATS) challenge dataset [26], and the Ischemic Stroke Lesion Segmentation (ISLES) challenge set [27]. Study populations varied between 100 and 500 patients with one study (5%) having a population of less than 100 patients and five studies (26%) having a population larger than 1000 patients. All large study populations were private, i.e., part of a local in-house dataset not publicly available to researchers outside of the research institution in question. Six studies (31%) only reported on data size as the number of 2D images ranging from 200 images to 4600 images. Training, validation, and testing of algorithms were on average performed using 69%, 3%, and 28% of all available data, respectively. Validation was performed only in six (31%) studies. Testing was mostly performed on data split out from the same data source; however, an external dataset with data from a different time-period and geographical location was used in three (15%) studies.
All studies developed algorithms focusing on brain disease identification using either classification or segmentation tasks. Seven studies (37%) focused on a binary classification of images into either normal/abnormal or differentiation between two diseases, five studies (26%) focused on a multiclass classification of images into specific disease categories, and seven studies (37%) focused on a multiclass segmentation of specific diseases. Most algorithmic tasks employed deep discriminative models, with 14 (74%) studies using convolutional neural networks (CNN). Three (16%) studies employed deep generative models, with two (11%) studies using variational autoencoders (VAE) and one (5%) study using generative adversarial networks (GANs). Reference tests were mostly labels and delineations made by neuroradiologists. Exceptions were found in the study by Wood et al. [46] where reference labels were generated using natural language processing (NLP) of radiological reports and in the study by Ahmadi et al. [28], where reference delineations were constructed using principal component analysis (PCA). Details about the test setup and performance metrics for binary classification, multiclass classification, and segmentation algorithms are summarized in Table 3 and Table 4, respectively.
Different performance measures were reported for each study. For classification studies, the most frequently reported performance metrics were AUC, accuracy, sensitivity, and specificity. AUC ranged from 0.765 to 0.997 while accuracy, sensitivity, and specificity ranged from 80% to 100%, 72% to 100%, and 65% to 100%, respectively. Positive predictive and negative predictive values were reported in nine studies (47%) and ranged from 12% to 94% and 48% to 99%, respectively. The higher performance values were predominantly observed in binary classification studies with a smaller study population, while the lower values were seen when identifying brain tumors. For segmentation studies, the Dice Score Coefficient was the most reported measure ranging from 0.300 for infarct segmentations to 0.912 for glioma and multiple-sclerosis segmentations. Sensitivity and specificity were observed to range from 13% to 99.9% and 87% to 99.8%, respectively, with the lower sensitivity values attributed to brain infarct segmentations.

3.2. Applicability to Workflow Improvement

The applicability of the included ML algorithms for improvements in scan acquisition and interpretation workflows was evaluated based on the satisfaction of the three requirements of (A) testing environments reflecting clinical practice, (B) test on external out-of-distribution datasets, and (C) acceptable algorithm performance results; see Section 2. Evaluation results for each requirement are summarized in Table 3 and Table 4 as well. Ten (53%) of nineteen studies were assessed as having acceptable performance; however, only one (5%) satisfied the requirement of being tested in a clinical environment reflecting clinical practice and three (15%) satisfied the requirement of testing on an external out-of-distribution dataset. Three studies (15%) satisfied two main requirements. These studies used privately acquired datasets. No studies satisfied all three main requirements for successful workflow integrations.

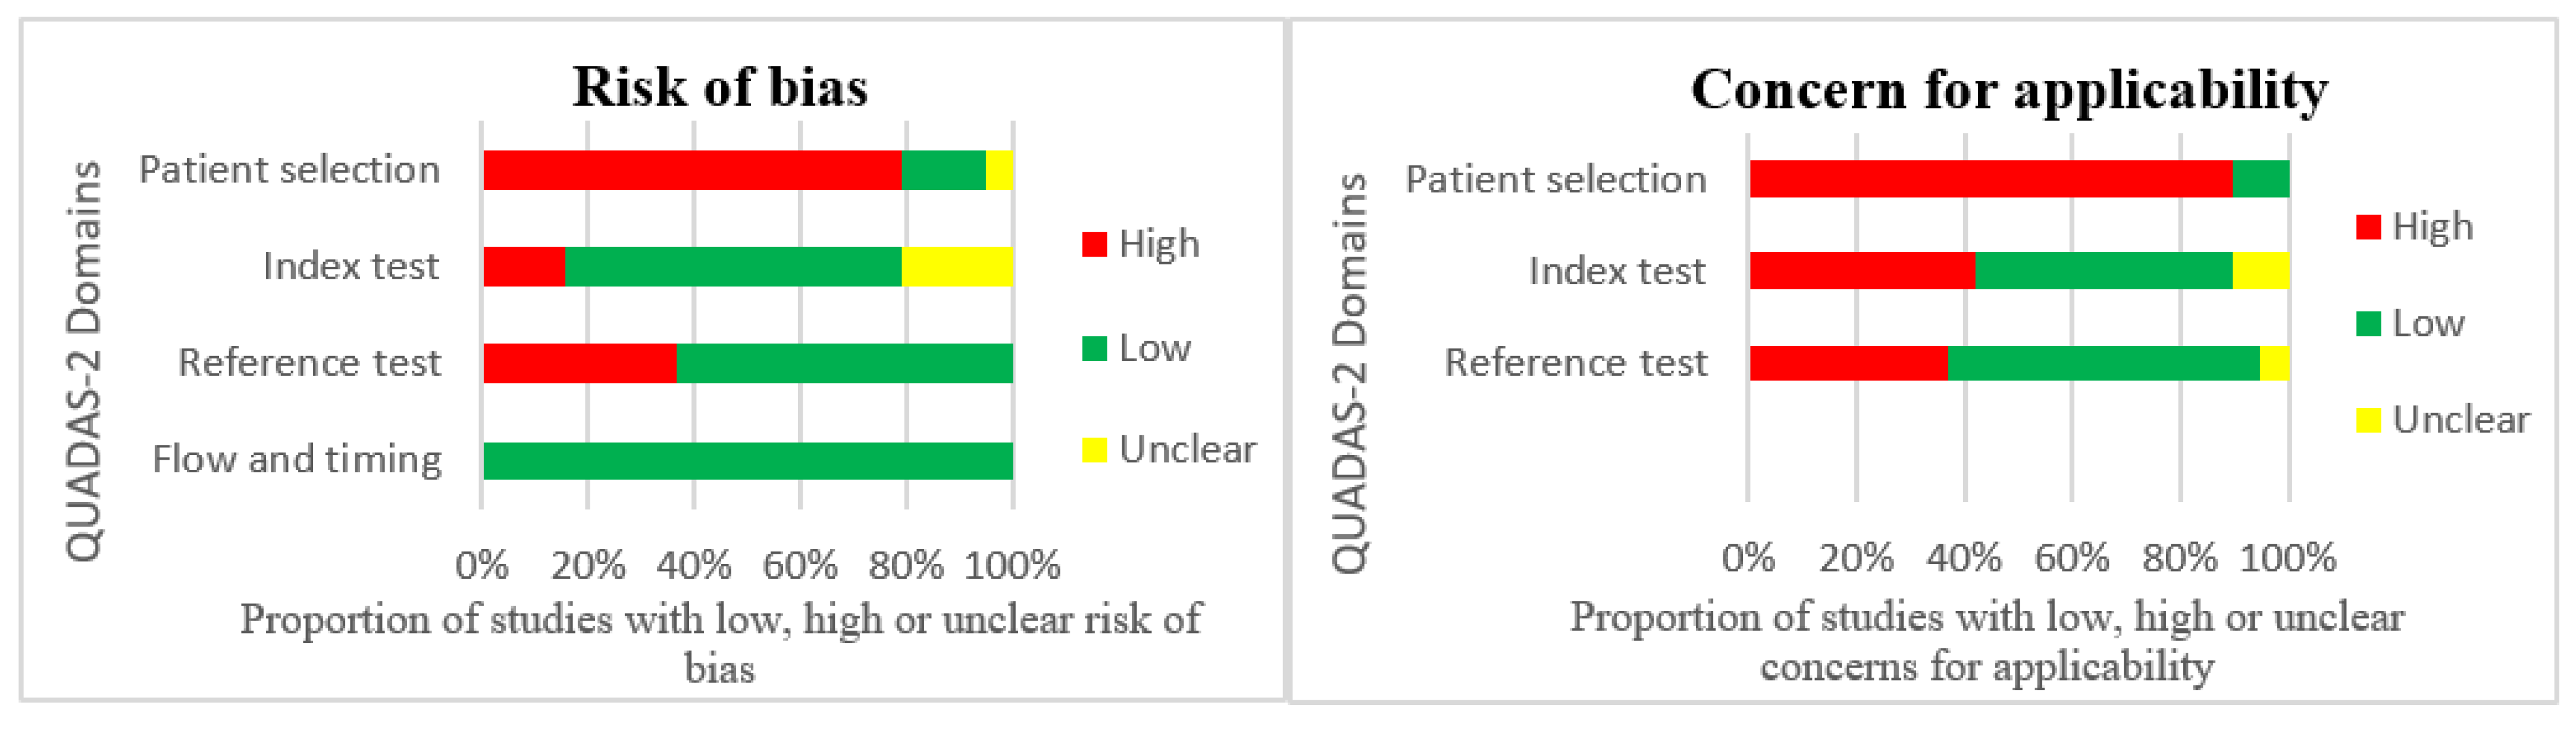
3.3. Quality Assessment

The Quality Assessment of Diagnostic Accuracy Studies 2 tool was applied to all included studies in this review. The results of the risk of bias/concern for applicability analysis are presented in Table 5 and summarized in Figure 2.
Significant risks of bias and concern for applicability were seen in the domain of patient selection, index test, and reference. Reasons for these include a lack of consecutive patient populations in eighteen studies, arbitrary classification of equivocal diseases in two studies, large threshold values and the exclusion of smaller lesions in two studies, and automatically generated reference labels in two studies. Only two studies were assessed with low or unclear risk of bias and concern for applicability in all domains.
No meta-analysis was conducted due to inherent heterogeneities in study tasks, population characteristics, and performance metrics.

4. Discussion

In this systematic review, we found that the included algorithms varied considerably in terms of tasks, data requirements, and applicability to workflow improvement. With respect to patient selection, index tests, and reference tests, a significant risk of bias was seen. Most (63%) surveyed algorithms were developed using public datasets derived from ML development challenges. This largely explains the following observed patterns: data size restricted to a few hundred patients, specific disease distribution in multiple datasets, and algorithm inference capabilities based on a limited amount of MR scan sequences. T2 and T2-FLAIR were the most frequently used sequences for disease identification of multiple brain diseases. However, this observation might be confounded by the usage of public datasets. Deep neural networks and derivatives thereof were the most frequently applied ML algorithms, which might be due to their proven high performance and robust feature input methods [47]. All studies published in clinical journals used private datasets with larger patient populations. All studies that satisfied more than one workflow applicability requirement likewise used private datasets. This observed pattern of private dataset usage fits into the general trend, where promising ML algorithms are validated and regulatorily approved for clinical usage based on retrospective, unpublished, and often proprietary data from a single institution [48].
Performance results varied considerably as well. About half of the algorithms exceeded the pre-defined threshold of 85% of their respective performance metrics. Disease segmentation performance was generally lower due to the complexity of this task. These results are corroborated by similar reviews performed by Zhang et al. [49] and van Kempen et al. [50] focusing on ischemic stroke and glioma segmentation, respectively. Similar performance levels in relation to triaging performance were also observed across other imaging modalities. Hickman et al. for instance demonstrated pooled AUC, sensitivity, and specificity of 0.89, 75.4%, and 90.6%, respectively, for screening and triaging mammography using machine learning techniques [51], which are in line with what is observed in this review. Hence, consistent performance results are reported across multiple imaging modalities when using similar methods. [19,52]. However, large performance gaps were seen across clinical settings and study designs, partially owing to the well-documented effect of domain shift [53]. For example, Gauriau et al. [33] tested an algorithm with moderately low sensitivity and specificity of 77% and 65%, respectively. These results were, however, attained on a large out-of-distribution dataset with a comprehensive representation of almost all diseases seen in everyday clinical practice. On the other hand, the algorithm developed by Lu, Lu et Zhang [40] achieved a binary classification accuracy, sensitivity, and specificity of 100%, but this was achieved on a very small subset of 87 2D MR-slices split out from the same data source as the training data and not reflecting clinical practice. These findings support the approach of considering multiple requirements for study design, study population, testing strategies, and performance when assessing benefits and limitations of applying ML algorithms into existing workflows.

4.1. Potential Benefits of Integrating ML into Existing Scan- and Interpretation Workflows

ML algorithms for clinical workflow integrations have been studied extensively in the past years with multiple authors suggesting different applications [11,12,52,54,55]. Olthof et al. suggest that radiologist workflows could be supported, extended, or replaced by ML functionalities [56].
Based on the findings in this review, scan acquisitions workflows could be supported by multiclass classification and segmentation algorithms. These algorithms, using only a few scan sequences acquired at the beginning of the scan acquisition process, could help classify initial scan images into different disease categories while the patient is still in the scanner and subsequently direct further scan acquisition based on real-time findings. This could prevent the excessive scanning of patients with no significant findings while ensuring fast scan acquisition for stroke patients and appropriate scan acquisition for tumor patients. The fact that 42% of the ML algorithms included in this review could successfully perform multiclass classification and segmentation based on a single MR sequence supports the feasibility of this concept.
Scan interpretation workflows, on the other hand, could be supported by all algorithms in this review. In fact, some of the surveyed binary classification studies aimed explicitly to support interpretation workflows by doing worklist prioritization of critical findings [33,41,45] and, hence, ensure faster reporting times and improved patient outcomes. Multi-class classification and segmentation algorithms could extend this further by offering potential automated diagnosis reporting, biomarker quantification, and even disease progression predictions. None of the surveyed algorithms, however, satisfied all requirements for successful workflow improvements due to key limitations.

4.2. Limitations of Included Studies and Future Directions

Important limitations pertaining to study design, data source, model development, and testing methodologies were uncovered using an analysis of the risk of bias/concern for applicability and applicability assessment for workflow improvements. First, patient selections were not consecutive and largely based on public datasets that consisted of imaging cases with high signal-to-noise ratios and selection biases. This is especially true for the BRATS challenge dataset, which is known to have handpicked and well-processed representations of brain gliomas that are very characteristic and visually recognizable, thus resulting in many algorithms achieving good performance when being developed and tested on it [57]. This could potentially introduce an overestimation of model performance and limit integration into clinical practices that face more heterogeneous images of brain diseases. Secondly, index tests were limited by insufficient reporting of model thresholds or deliberately large thresholds chosen for favorable performance reporting. Nael et al. [41], for instance, demonstrated that their model performance dropped significantly when detecting a smaller infarction volume of <0.25 mL compared to volumes of 1 mL. Because the accurate delineation of size, location and development of ischemic lesions have great prognostic implications [58], this trend of size-dependent accuracy could pose challenges to performing accurate recovery predictions and, hence, overall stroke management. Thirdly, reference tests similarly introduced critical biases, especially in the included studies that used 2D-image datasets with handpicked 2D-images and labels as ground truth. This selection of representative images could have introduced priors that are easily exploitable by ML algorithms, as has previously been demonstrated in similar datasets [59]. Fourthly, about half of the surveyed ML algorithms had unacceptably low sensitivity and specificity, which could increase scan acquisition workloads and more worryingly decrease patient safety. Finally, only a minor proportion reported on the clinically relevant metrics of positive and negative predictive values. This, combined with the lack of testing on out-of-distribution datasets, might have presented skewed performance impressions not accounting for all relevant conditions in the intended target population [13].
Future studies developing ML algorithms applicable for workflow improvements should ensure the possession of a consecutive patient population reflecting the desired target population, transparent reporting of patient population characteristics and thresholds for index tests, and performance levels reported through metrics that incorporate different aspects of positive and negative findings. Low false-negative rates should be prioritized, thus ensuring adequate patient safety by having the fewest possible missed findings. Disease prevalence must be considered so as to account for positive and negative predictive values. To alleviate some of these limitations, standardized reporting guidelines tailored for AI in radiology [60], prospective study designs with consecutive patient sampling, and multi-site testing with clinical partners must be considered. The challenges of low sensitivity and specificity might be addressed by rethinking existing data acquisition strategies and model architectures. For instance, temporal information from follow-up scans or contrast-enhancement kinetics can be taken into account. Similar strategies are being used on PET-CT scans resulting in improved tumor classification specificity [61].

4.3. Limitations of This Review

This review should be read in view of limitations including publication and reporting bias. We limited our inclusion criteria to studies that could identify multiple brain diseases including brain infarcts, hemorrhages, or tumors, and we further restricted our limitation to studies that have tested their algorithms on data separate from training data. Next, we assessed the applicability of ML algorithms for improving workflows based on a set of requirements not previously validated. All of this might have limited the overview and the impression of this research field. As these criteria were selected based on clinical relevance, the results nonetheless present clinically useful representations of how state-of-the-art ML algorithms could be applied to improve existing scan acquisition and interpretation workflows.

5. Conclusions

The surveyed algorithms could potentially support and extend existing workflows. However, limitations pertaining to study design, study data, reference standards, and performance reporting prevent clinical integration. No study satisfied all requirements for successful workflow integration. Standardized reporting guidelines tailored for ML in radiology, prospective study designs, and multi-site testing could help alleviate this. The findings from this review could aid future researchers and healthcare providers by allowing them to critically assess relevant ML studies for workflow improvements and by enabling them to better design studies that validate the benefits of deploying ML in scan acquisition and interpretation workflows.

Author Contributions

Conceptualization, K.S., C.M.O., A.P., J.F.C., T.C.T. and M.B.N.; methodology, K.S., C.M.O., A.P., J.F.C., T.C.T. and M.B.N.; investigation, K.S., C.M.O., J.M. and J.J.; data acquisition, K.S.; writing—original draft preparation, K.S.; writing—review and editing, K.S., C.M.O., A.P., J.J., J.M., J.F.C., T.C.T. and M.B.N.; supervision, A.P., J.F.C., T.C.T. and M.B.N.; project administration, K.S.; funding acquisition, M.B.N. All authors have read and agreed to the published version of the manuscript.

Funding

This research received no external funding.

Institutional Review Board Statement

Not applicable.

Informed Consent Statement

Not applicable.

Data Availability Statement

Data are available upon request.

Conflicts of Interest

The authors declare no conflict of interest.

Appendix A

Search strings for databases
MEDLINE (PubMed)
((“magnetic resonance imaging” [MeSH Terms] OR “Multiparametric Magnetic Resonance Imaging” [MeSH Terms] OR “Diffusion Magnetic Resonance Imaging” [MeSH Terms] OR “MRI” [All Fields] OR “MR imag*” [All Fields])
AND
(“Artificial Intelligence” [MeSH Terms] OR “Machine Learning” [MeSH Terms] OR “Deep Learning” [MeSH Terms] OR “Supervised Machine Learning” [MeSH Terms] OR “Artificial Intelligence” [All Fields] OR “Deep Learning” [All Fields] OR “Neural Network” [All Fields] OR “Convolutional Neural Network” [All Fields])
AND
(“Central Nervous System Diseases” [MeSH Terms] OR “Brain Diseases” [MeSH Terms] OR (“brain” [All Fields] AND “neoplasm*” [All Fields]) OR (“brain” [All Fields] AND “tumor*” [All Fields]) OR (“brain” [All Fields] AND “hemorrhage” [All Fields]) OR (“intraparenchymal” [All Fields] AND “hemorrhage” [All Fields]) OR (“subdural” [All Fields] AND “hemorrhage” [All Fields]) OR (“subarachnoid” [All Fields] AND “hemorrhage” [All Fields]) OR (“epidural” [All Fields] AND “hemorrhage” [All Fields]) (“brain” [All Fields] AND “infarct”[All Fields]) OR “brain” [All Fields])
AND
(“anomal*” [All Fields] OR “abnormal*” [All Fields] OR “patholog*” [All Fields] OR “multi-class” [All Fields] OR “critical findings” [All Fields] OR “triag*” [All Fields] OR “automat*” [All Fields] OR “classification” [MeSH Terms] OR “detect*” [All Fields]))
EMBASE
exp magnetic resonance imaging/
exp brain disease/
exp machine learning/
exp classification/or detection.mp.
(abnormal or patholog$ or multi-class or critical finding$ or triag$ or automat$).mp. [mp = title, abstract, heading word, drug trade name, original title, device manufacturer, drug manufacturer, device trade name, keyword heading word, floating subheading word, candidate term word]
1 and 2 and 3 and 4 and 5
Scopus
(TITLE-ABS-KEY (“magnetic resonance imaging” OR “Multiparametric Magnetic Resonance Imaging” OR “MRI”)) AND (TITLE-ABS-KEY (“Artificial Intelligence” OR “Machine Learning” OR “Deep Learning” OR “Neural Network” OR “Convolutional neural network”)) AND (TITLE-ABS-KEY (brain AND disease OR brain AND infarct OR brain AND hemorrhage OR brain AND neoplasm* OR brain AND tumor OR brain AND anomal* OR brain AND abnormal* OR brain AND patholog* OR brainmulti-class” OR braincritical finding*” OR brain AND triag* OR brain AND automat*)) AND (TITLE-ABS-KEY (classification OR detection)) AND (LIMIT-TO (PUBYEAR, 2022) OR LIMIT-TO (PUBYEAR, 2021) OR LIMIT-TO (PUBYEAR, 2020) OR LIMIT-TO (PUBYEAR, 2019) OR LIMIT-TO (PUBYEAR, 2018) OR LIMIT-TO (PUBYEAR, 2017)) AND (LIMIT-TO (DOCTYPE, “ar”) OR LIMIT-TO (DOCTYPE, “re”))
Web of Science
ALL = ((“magnetic resonance imaging” OR “Multiparametric Magnetic Resonance Imaging” OR “MRI”) AND (“Artificial Intelligence” OR “Machine Learning” OR “Deep Learning” OR “Neural Network” OR “Convolutional neural network”) AND (brain disease OR brain anomal* OR brain abnormal* OR brain patholog* OR brain “multi-class” OR brain “critical finding*” or brain triag* OR brain automat* OR brain infarct OR brain hemorrhage OR “intraparenchymal hemorrhage” OR brain neoplasm OR brain tumor) AND (classification OR detection))
IEEE Xplore
(“magnetic resonance imaging” OR “Multiparametric Magnetic Resonance Imaging” OR “MRI”) AND (“Artificial Intelligence” OR “Machine Learning” OR “Deep Learning” OR “Neural Network” OR “Convolutional neural network”) AND (brain disease OR brain anomaly OR brain abnormality OR brain pathology OR brain “multi-class” OR brain “critical finding*” OR brain triage OR brain infarct OR brain hemorrhage OR brain neoplasm OR brain tumor) AND (classification OR detection)

References

  1. Radue, E.W.; Weigel, M.; Wiest, R.; Urbach, H. Introduction to Magnetic Resonance Imaging for Neurologists. Contin. Lifelong Learn. Neurol. 2016, 22, 1379–1398. [Google Scholar] [CrossRef] [PubMed] [Green Version]
  2. Luttrull, M.D.; Boulter, D.J.; Kirsch, C.F.E.; Aulino, J.M.; Broder, J.S.; Chakraborty, S.; Choudhri, A.F.; Ducruet, A.F.; Kendi, A.T.; Lee, R.K.; et al. ACR Appropriateness Criteria® Acute Mental Status Change, Delirium, and New Onset Psychosis. J. Am. Coll. Radiol. 2019, 16, S26–S37. [Google Scholar] [CrossRef] [PubMed] [Green Version]
  3. Salmela, M.B.; Mortazavi, S.; Jagadeesan, B.D.; Broderick, D.F.; Burns, J.; Deshmukh, T.K.; Harvey, H.B.; Hoang, J.; Hunt, C.H.; Kennedy, T.A.; et al. ACR Appropriateness Criteria® Cerebrovascular Disease. J. Am. Coll. Radios. 2017, 14, S34–S61. [Google Scholar] [CrossRef] [PubMed] [Green Version]
  4. Policeni, B.; Corey, A.S.; Burns, J.; Conley, D.B.; Crowley, R.W.; Harvey, H.B.; Hoang, J.; Hunt, C.H.; Jagadeesan, B.D.; Juliano, A.F.; et al. ACR Appropriateness Criteria® Cranial Neuropathy. J. Am. Coll. Radiol. 2017, 14, S406–S420. [Google Scholar] [CrossRef] [PubMed] [Green Version]
  5. Harvey, H.B.; Watson, L.C.; Subramaniam, R.M.; Burns, J.; Bykowski, J.; Chakraborty, S.; Ledbetter, L.N.; Lee, R.K.; Pannell, J.S.; Pollock, J.M.; et al. ACR Appropriateness Criteria® Movement Disorders and Neurodegenerative Diseases. J. Am. Coll. Radiol. 2020, 17, S175–S187. [Google Scholar] [CrossRef] [PubMed]
  6. Murphy, A.; di Muzio, B. Brain Screen Protocol (MRI). Radiopaedia. Org. 2015. [Google Scholar] [CrossRef]
  7. Subramaniam, R.M.; Kurth, D.A.; Waldrip, C.A.; Rybicki, F.J. American College of Radiology Appropriateness Criteria: Advancing Evidence-Based Imaging Practice. Semin. Nucl. Med. 2019, 49, 161–165. [Google Scholar] [CrossRef]
  8. Mehan, W.A.; González, R.G.; Buchbinder, B.R.; Chen, J.W.; Copen, W.A.; Gupta, R.; Hirsch, J.A.; Hunter, G.J.; Hunter, S.; Johnson, J.M.; et al. Optimal Brain MRI Protocol for New Neurological Complaint. PLoS ONE 2014, 9, e110803. [Google Scholar] [CrossRef] [Green Version]
  9. Chetlen, A.L.; Chan, T.L.; Ballard, D.H.; Frigini, L.A.; Hildebrand, A.; Kim, S.; Brian, J.M.; Krupinski, E.A.; Ganeshan, D. Addressing Burnout in Radiologists. Acad. Radiol. 2019, 26, 526. [Google Scholar] [CrossRef] [PubMed]
  10. Statistics Monthly Diagnostic Waiting Times and Activity. Available online: https://www.england.nhs.uk/statistics/statistical-work-areas/diagnostics-waiting-times-and-activity/monthly-diagnostics-waiting-times-and-activity/ (accessed on 21 May 2022).
  11. Choy, G.; Khalilzadeh, O.; Michalski, M.; Do, S.; Samir, A.E.; Pianykh, O.S.; Geis, J.R.; Pandharipande, P.V.; Brink, J.A.; Dreyer, K.J. Current Applications and Future Impact of Machine Learning in Radiology. Radiology 2018, 288, 318–328. [Google Scholar] [CrossRef]
  12. Letourneau-Guillon, L.; Camirand, D.; Guilbert, F.; Forghani, R. Artificial Intelligence Applications for Workflow, Process Optimization and Predictive Analytics. Neuroimaging Clin. 2020, 30, e1–e15. [Google Scholar] [CrossRef] [PubMed]
  13. Park, S.H.; Han, K. Methodologic Guide for Evaluating Clinical Performance and Effect of Artificial Intelligence Technology for Medical Diagnosis and Prediction. Radiology 2018, 286, 800–809. [Google Scholar] [CrossRef]
  14. Wichmann, J.L.; Willemink, M.J.; de Cecco, C.N. Artificial Intelligence and Machine Learning in Radiology: Current State and Considerations for Routine Clinical Implementation. Investig. Radiol. 2020, 55, 619–627. [Google Scholar] [CrossRef] [PubMed]
  15. Paniagua Bravo, A.; Albillos Merino, J.C.; Ibáñez Sanz, L.; Alba de Cáceres, I. Analysis of the Appropriateness of the Clinical Indications for Neuroimaging Studies. Radiología 2013, 55, 37–45. [Google Scholar] [CrossRef] [PubMed]
  16. Vernooij, M.W.; Ikram, M.A.; Tanghe, H.L.; Vincent, A.J.P.E.; Hofman, A.; Krestin, G.P.; Niessen, W.J.; Breteler, M.M.B.; van der Lugt, A. Incidental Findings on Brain MRI in the General Population. N. Engl. J. Med. 2007, 357, 1821–1828. [Google Scholar] [CrossRef] [PubMed]
  17. Kelly, C.J.; Karthikesalingam, A.; Suleyman, M.; Corrado, G.; King, D. Key Challenges for Delivering Clinical Impact with Artificial Intelligence. BMC Med. 2019, 17, 195. [Google Scholar] [CrossRef] [Green Version]
  18. Strohm, L.; Hehakaya, C.; Ranschaert, E.R.; Boon, W.P.C.; Moors, E.H.M. Implementation of Artificial Intelligence (AI) Applications in Radiology: Hindering and Facilitating Factors. Eur. Radiol. 2020, 30, 5525–5532. [Google Scholar] [CrossRef]
  19. Yao, A.D.; Cheng, D.L.; Pan, I.; Kitamura, F. Deep Learning in Neuroradiology: A Systematic Review of Current Algorithms and Approaches for the New Wave of Imaging Technology. Radiol. Artif. Intell. 2020, 2, e190026. [Google Scholar] [CrossRef] [PubMed]
  20. McInnes, M.D.F.; Moher, D.; Thombs, B.D.; McGrath, T.A.; Bossuyt, P.M.; Clifford, T.; Cohen, J.F.; Deeks, J.J.; Gatsonis, C.; Hooft, L.; et al. Preferred Reporting Items for a Systematic Review and Meta-Analysis of Diagnostic Test Accuracy Studies: The PRISMA-DTA Statement. JAMA 2018, 319, 388–396. [Google Scholar] [CrossRef]
  21. Bertels, J.; Eelbode, T.; Berman, M.; Vandermeulen, D.; Maes, F.; Bisschops, R.; Blaschko, M.B. Optimizing the Dice Score and Jaccard Index for Medical Image Segmentation: Theory and Practice. In Medical Image Computing and Computer Assisted Intervention—MICCAI 2019; Lecture Notes in Computer Science; Springer: Cham, Switzerland, 2019; Volume 11765, pp. 92–100. [Google Scholar] [CrossRef]
  22. QUADAS-2 | Bristol Medical School: Population Health Sciences | University of Bristol. Available online: https://www.bristol.ac.uk/population-health-sciences/projects/quadas/quadas-2/ (accessed on 11 March 2022).
  23. Rauschecker, A.M.; Rudie, J.D.; Xie, L.; Wang, J.; Duong, M.T.; Botzolakis, E.J.; Kovalovich, A.M.; Egan, J.; Cook, T.C.; Nick Bryan, R.; et al. Artificial Intelligence System Approaching Neuroradiologist-Level Diagnosis Accuracy at Brain MRI. Radiology 2020, 295, 626. [Google Scholar] [CrossRef]
  24. Vidoni, E.D. The Whole Brain Atlas. J. Neurol. Phys. Ther. 2012, 36, 108. [Google Scholar] [CrossRef]
  25. Clark, K.; Vendt, B.; Smith, K.; Freymann, J.; Kirby, J.; Koppel, P.; Moore, S.; Phillips, S.; Maffitt, D.; Pringle, M.; et al. The Cancer Imaging Archive (TCIA): Maintaining and Operating a Public Information Repository. J. Digit. Imaging 2013, 26, 1045–1057. [Google Scholar] [CrossRef] [PubMed] [Green Version]
  26. Menze, B.H.; Jakab, A.; Bauer, S.; Kalpathy-Cramer, J.; Farahani, K.; Kirby, J.; Burren, Y.; Porz, N.; Slotboom, J.; Wiest, R.; et al. The Multimodal Brain Tumor Image Segmentation Benchmark (BRATS). IEEE Trans. Med. Imaging 2015, 34, 1993–2024. [Google Scholar] [CrossRef] [PubMed]
  27. Maier, O.; Menze, B.H.; von der Gablentz, J.; Häni, L.; Heinrich, M.P.; Liebrand, M.; Winzeck, S.; Basit, A.; Bentley, P.; Chen, L.; et al. ISLES 2015—A Public Evaluation Benchmark for Ischemic Stroke Lesion Segmentation from Multispectral MRI. Med. Image Anal. 2017, 35, 250. [Google Scholar] [CrossRef] [PubMed] [Green Version]
  28. Ahmadi, M.; Sharifi, A.; Jafarian Fard, M.; Soleimani, N. Detection of Brain Lesion Location in MRI Images Using Convolutional Neural Network and Robust PCA. Int. J. Neurosci. 2021, 1–12. [Google Scholar] [CrossRef]
  29. Baur, C.; Wiestler, B.; Muehlau, M.; Zimmer, C.; Navab, N.; Albarqouni, S. Modeling Healthy Anatomy with Artificial Intelligence for Unsupervised Anomaly Detection in Brain MRI. Radiol. Artif. Intell. 2021, 3, e190169. [Google Scholar] [CrossRef] [PubMed]
  30. Duong, M.T.; Rudie, J.D.; Wang, J.; Xie, L.; Mohan, S.; Gee, J.C.; Rauschecker, A.M. Convolutional Neural Network for Automated FLAIR Lesion Segmentation on Clinical Brain MR Imaging. Am. J. Neuroradiol. 2019, 40, 1282–1290. [Google Scholar] [CrossRef] [Green Version]
  31. Fayaz, M.; Torokeldiev, N.; Turdumamatov, S.; Qureshi, M.S.; Qureshi, M.B.; Gwak, J. An Efficient Methodology for Brain Mri Classification Based on Dwt and Convolutional Neural Network. Sensors 2021, 21, 7480. [Google Scholar] [CrossRef]
  32. Felipe Fattori Alves, A.; Ricardo de Arruda Miranda, J.; Reis, F.; Augusto Santana de Souza, S.; Luchesi Rodrigues Alves, L.; de Moura Feitoza, L.; Thiago de Souza de Castro, J.; Rodrigues de Pina, D. Inflammatory Lesions and Brain Tumors: Is It Possible to Differentiate Them Based on Texture Features in Magnetic Resonance Imaging? J. Venom. Anim. Toxins Incl. Trop. Dis. 2020, 26, 20200011. [Google Scholar] [CrossRef]
  33. Gauriau, R.; Bizzo, B.C.; Kitamura, F.C.; Junior, O.L.; Ferraciolli, S.F.; Macruz, F.B.C.; Sanchez, T.A.; Garcia, M.R.T.; Vedolin, L.M.; Domingues, R.C.; et al. A Deep Learning–Based Model for Detecting Abnormalities on Brain MR Images for Triaging: Preliminary Results from a Multisite. Radiol. Artif. Intell. 2021, 3, e200184. [Google Scholar] [CrossRef]
  34. Gilanie, G.; Bajwa, U.I.; Waraich, M.M.; Habib, Z.; Ullah, H.; Nasir, M. Classification of Normal and Abnormal Brain MRI Slices Using Gabor Texture and Support Vector Machines. Signal Image Video Processing 2018, 12, 479–487. [Google Scholar] [CrossRef]
  35. Han, C.; Rundo, L.; Murao, K.; Noguchi, T.; Shimahara, Y.; Milacski, Z.Á.; Koshino, S.; Sala, E.; Nakayama, H.; Satoh, S. MADGAN: Unsupervised Medical Anomaly Detection GAN Using Multiple Adjacent Brain MRI Slice Reconstruction. BMC Bioinform. 2021, 22, 31. [Google Scholar] [CrossRef] [PubMed]
  36. Hu, X.; Luo, W.; Hu, J.; Guo, S.; Huang, W.; Scott, M.R.; Wiest, R.; Dahlweid, M.; Reyes, M. Brain SegNet: 3D Local Refinement Network for Brain Lesion Segmentation. BMC Med. Imaging 2020, 20, 17. [Google Scholar] [CrossRef] [PubMed]
  37. Kamnitsas, K.; Ledig, C.; Newcombe, V.F.J.; Simpson, J.P.; Kane, A.D.; Menon, D.K.; Rueckert, D.; Glocker, B. Efficient Multi-Scale 3D CNN with Fully Connected CRF for Accurate Brain Lesion Segmentation. Med. Image Anal. 2017, 36, 61–78. [Google Scholar] [CrossRef] [PubMed]
  38. Kim, B.; Kwon, K.; Oh, C.; Park, H. Unsupervised Anomaly Detection in MR Images Using Multi-Contrast Information. Med. Phys. 2021, 48, 7346–7359. [Google Scholar] [CrossRef]
  39. Lu, P.J.; Yoo, Y.; Rahmanzadeh, R.; Galbusera, R.; Weigel, M.; Ceccaldi, P.; Nguyen, T.D.; Spincemaille, P.; Wang, Y.; Daducci, A.; et al. GAMER MRI: Gated-Attention Mechanism Ranking of Multi-Contrast MRI in Brain Pathology. NeuroImage Clin. 2021, 29, 102522. [Google Scholar] [CrossRef] [PubMed]
  40. Lu, S.; Lu, Z.; Zhang, Y.D. Pathological Brain Detection Based on AlexNet and Transfer Learning. J. Comput. Sci. 2019, 30, 41–47. [Google Scholar] [CrossRef]
  41. Nael, K.; Gibson, E.; Yang, C.; Ceccaldi, P.; Yoo, Y.; Das, J.; Doshi, A.; Georgescu, B.; Janardhanan, N.; Odry, B.; et al. Automated Detection of Critical Findings in Multi-Parametric Brain MRI Using a System of 3D Neural Networks. Sci. Rep. 2021, 11, 6876. [Google Scholar] [CrossRef]
  42. Nayak, D.R.; Dash, R.; Majhi, B. Automated Diagnosis of Multi-Class Brain Abnormalities Using MRI Images: A Deep Convolutional Neural Network Based Method. Pattern Recognit. Lett. 2020, 138, 385–391. [Google Scholar] [CrossRef]
  43. Nayak, D.R.; Das, D.; Dash, R.; Majhi, S.; Majhi, B. Deep Extreme Learning Machine with Leaky Rectified Linear Unit for Multiclass Classification of Pathological Brain Images. Multimed. Tools Appl. 2020, 79, 15381–15396. [Google Scholar] [CrossRef]
  44. Pereira, S.; Pinto, A.; Amorim, J.; Ribeiro, A.; Alves, V.; Silva, C.A. Adaptive Feature Recombination and Recalibration for Semantic Segmentation with Fully Convolutional Networks. IEEE Trans. Med. Imaging 2019, 38, 2914–2925. [Google Scholar] [CrossRef] [PubMed]
  45. Wood, D.A.; Kafiabadi, S.; Al Busaidi, A.; Guilhem, E.; Montvila, A.; Lynch, J.; Townend, M.; Agarwal, S.; Mazumder, A.; Barker, G.J.; et al. Deep Learning Models for Triaging Hospital Head MRI Examinations. Med. Image Anal. 2022, 78, 102391. [Google Scholar] [CrossRef] [PubMed]
  46. Wood, D.A.; Kafiabadi, S.; al Busaidi, A.; Guilhem, E.L.; Lynch, J.; Townend, M.K.; Montvila, A.; Kiik, M.; Siddiqui, J.; Gadapa, N.; et al. Deep Learning to Automate the Labelling of Head MRI Datasets for Computer Vision Applications. Eur. Radiol. 2022, 32, 725–736. [Google Scholar] [CrossRef]
  47. Daugaard Jørgensen, M.; Antulov, R.; Hess, S.; Lysdahlgaard, S. Convolutional Neural Network Performance Compared to Radiologists in Detecting Intracranial Hemorrhage from Brain Computed Tomography: A Systematic Review and Meta-Analysis. Eur. J. Radiol. 2022, 146, 110073. [Google Scholar] [CrossRef] [PubMed]
  48. Rajpurkar, P.; Chen, E.; Banerjee, O.; Topol, E.J. AI in Health and Medicine. Nat. Med. 2022, 28, 31–38. [Google Scholar] [CrossRef]
  49. Zhang, Y.; Liu, S.; Li, C.; Wang, J. Application of Deep Learning Method on Ischemic Stroke Lesion Segmentation. J. Shanghai Jiaotong Univ. (Sci.) 2018, 2022, 99–111. [Google Scholar] [CrossRef]
  50. van Kempen, E.J.; Post, M.; Mannil, M.; Witkam, R.L.; ter Laan, M.; Patel, A.; Meijer, F.J.A.; Henssen, D. Performance of Machine Learning Algorithms for Glioma Segmentation of Brain MRI: A Systematic Literature Review and Meta-Analysis. Eur. Radiol. 2021, 31, 9638–9653. [Google Scholar] [CrossRef]
  51. Hickman, S.E.; Woitek, R.; Le, E.P.V.; Im, Y.R.; Luxhøj, C.M.; Aviles-Rivero, A.I.; Baxter, G.C.; MacKay, J.W.; Gilbert, F.J. Machine Learning for Workflow Applications in Screening Mammography: Systematic Review and Meta-Analysis. Radiology 2022, 302, 88–104. [Google Scholar] [CrossRef]
  52. Kelly, B.S.; Judge, C.; Bollard, S.M.; Clifford, S.M.; Healy, G.M.; Aziz, A.; Mathur, P.; Islam, S.; Yeom, K.W.; Lawlor, A.; et al. Radiology Artificial Intelligence: A Systematic Review and Evaluation of Methods (RAISE). Eur. Radiol. 2022, 1–10. [Google Scholar] [CrossRef]
  53. Yu, A.C.; Mohajer, B.; Eng, J. External Validation of Deep Learning Algorithms for Radiologic Diagnosis: A Systematic Review. Radiol. Artif. Intell. 2022, 4, e210064. [Google Scholar] [CrossRef]
  54. Choi, K.S.; Sunwoo, L. Artificial Intelligence in Neuroimaging: Clinical Applications. Investig. Magn. Reson. Imaging 2022, 26, 1–9. [Google Scholar] [CrossRef]
  55. Kotter, E.; Ranschaert, E. Challenges and Solutions for Introducing Artificial Intelligence (AI) in Daily Clinical Workflow. Eur. Radiol. 2020, 31, 5–7. [Google Scholar] [CrossRef] [PubMed]
  56. Olthof, A.W.; van Ooijen, P.M.A.; Rezazade Mehrizi, M.H. Promises of Artificial Intelligence in Neuroradiology: A Systematic Technographic Review. Neuroradiology 2020, 62, 1265–1278. [Google Scholar] [CrossRef] [PubMed]
  57. Ghaffari, M.; Sowmya, A.; Oliver, R. Automated Brain Tumor Segmentation Using Multimodal Brain Scans: A Survey Based on Models Submitted to the BraTS 2012–2018 Challenges. IEEE Rev. Biomed. Eng. 2020, 13, 156–168. [Google Scholar] [CrossRef]
  58. Heiss, W.D.; Kidwell, C.S. Imaging for Prediction of Functional Outcome and Assessment of Recovery in Ischemic Stroke. Stroke 2014, 45, 1195–1201. [Google Scholar] [CrossRef] [Green Version]
  59. Wallis, D.; Buvat, I. Clever Hans Effect Found in a Widely Used Brain Tumour MRI Dataset. Med. Image Anal. 2022, 77, 102368. [Google Scholar] [CrossRef]
  60. Mongan, J.; Moy, L.; Kahn, C.E. Checklist for Artificial Intelligence in Medical Imaging (CLAIM): A Guide for Authors and Reviewers. Radiol. Artif. Intell. 2020, 2, e200029. [Google Scholar] [CrossRef] [Green Version]
  61. Bianchetti, G.; Taralli, S.; Vaccaro, M.; Indovina, L.; Mattoli, M.V.; Capotosti, A.; Scolozzi, V.; Calcagni, M.L.; Giordano, A.; de Spirito, M.; et al. Automated Detection and Classification of Tumor Histotypes on Dynamic PET Imaging Data through Machine-Learning Driven Voxel Classification. Comput. Biol. Med. 2022, 145, 105423. [Google Scholar] [CrossRef]
Figure 1. PRISMA workflow: 5688 records screened, and 19 studies were included for qualitative review.
Diagnostics 12 01878 g001
Figure 2. Summary of risk of bias and concern for the applicability of included studies.
Diagnostics 12 01878 g002
Table 1. Inclusion and exclusion criteria.
Inclusion Criteria:Exclusion Criteria:
Studies focusing on abnormal brain diseases that included either brain infarct, hemorrhage, or tumor on brain MRIStudies focusing on tasks not relevant for identification of brain diseases
Studies developing algorithms tested on a dataset that was separate from the training datasetStudies focusing on identification of a single brain disease only
Peer-reviewed studies in EnglishStudies focusing on development of ML for specialized MR sequences (e.g., MR elastography, functional MRI) or other imaging modalities (e.g., SPECT, PET, CT, US)
Studies with primarily non-adult populations
Editorials, case series, letters, conference proceedings, reviews, and inaccessible papers
Table 2. Study population and data characteristics.
AuthorData SourceNo. Patients
/Images
Training DataValidation DataTesting DataDisease Distribution in DataMR Sequences
Utilized
MR Field Strength
Ahmadi et al., 2021 [28]Private +
Harvard Medical School Whole Brain Atlas
1200 images1120N/A8012.5% normals
87.5% abnormal incl. glioma, Huntington’s disease, Meningioma, and Alzheimer
2D single slice of:
Ax T2
1.5 T
Baur et al., 2021 [29]Private
WMH
TCIA
259 patients1001814142% normal used for unsupervised training
19% multiple sclerosis
15% glioma & glioblastoma
4% microangiopathy
20% WMH
Ax T2-FLAIR1.5 T
3 T
Duong et al., 2019 [30]Private387 patients295N/A92Normal and 19 different abnormalities incl. MS, high grade glioma, and vascular (acute or subacute ischemia)Ax T2-FLAIR1.5 T
3 T
Fayaz et al., 2021 [31]Harvard Medical School Whole Brain Atlas4100 images2870N/A123050% normal
50% abnormal incl. glioma, meningioma, and Alzheimer
2D single slice of:
Ax T2
1.5 T
Felipe Fattori Alves et al., 2020 [32]Private67 patients50N/A1745% inflammatory lesion (incl. MS, vasculitis, toxoplasmosis, pyogenic and septic-embolic brain abscess, etc.)
55% brain tumors (incl. Glioblastoma, anaplastic astrocytoma, anaplastic ependymoma)
Ax T1 & T1 + C
Ax T2
Ax T2-FLAIR
Ax DWI
1.5 T
3 T
Gauriau et al., 2021 [33]Private10,770 patients77954732502Normal and 8+ different abnormalities including infarct, hemorrhage, neoplasm, demyelination, and infectionsAx T2-FLAIR1.5 T
3 T
Gilanie et al., 2018 [34]Harvard Medical School Whole Brain Atlas4589 images3029N/A156011% normal
89% abnormal incl. cerebrovascular, neoplasm, neurodegenerative, and inflammatory disease
2D single slices of:
Ax T1 & T1 + C
Ax T2 & Ax PD
Ax T2-FLAIR
1.5 T
Han et al., 2020 [35]OASIS-3
Private
1162 patients543N/A61947% normals used for unsupervised training
19% normals used for testing
21% dementia of varying degree
7% brain metastasis
6% various disease incl. small infarct, hemorrhage, and white matter lesions
Ax T1 & Ax T1 + c1.5 T
3 T
Hu et al., 2020 [36]BRATS 2019
ISLES 2017
459 patients317N/A14284% glioma (HGG, LGG)
16% acute & subacute infarct
Ax T1 & T1 + C
Ax T2
Ax T2-FLAIR
Ax DWI, ADC,
perfusion
1.5 T
3 T
Kamnitsas et al., 2017 [37]Private
BRATS 2015
ISLES 2015
509 patients348N/A16175% tumor (high grade glioma, low grade glioma)
13% acute & subacute infarct
12% traumatic brain injury
Ax or Sag T1 & T1 + C
Ax T2 & Ax PD
Ax T2-FLAIR
Ax T2 * GRE
Ax DWI & ADC
1.5 T
3 T
Kim et al., 2021 [38]BRATS 2019
ISLES 2015
259 patients239N/A2636% normal
60% glioma
4% acute & subacute infarct
2D slices of
Ax T1 & T1 + C
Ax T2
Ax T2-FLAIR
Ax DWI, ADC,
perfusion
1.5 T
3 T
Lu et al., 2021 [39]Private7134 patients* 50021061107113% acute/subacute stroke
87% non-stroke abnormalities incl. tumor, hemorrhage and normals
Axial T2-FLAIR
Axial DWI + ADC
1.5 T
3 T
Lu, Lu et Zhang., 2019 [40]Harvard Medical School Whole Brain Atlas291 images204N/A8739% normal
61% abnormal incl. neoplasm, neurodegenerative, and inflammatory disease
2D single slice of:
Ax T2
1.5 T
Nael et al., 2021 [41]Private13,215 patients984512482122 17% normal
11% acute infarction
5% acute hemorrhage
4% intracranial mass effect
63% other abnormalities including white matter lesions
Ax or Sag T1 & T1 + C
Ax T2
Ax T2-FLAIR
Ax ADC & DWI
Ax T2 * GRE
1.5 T
3 T
Nayak et al., 2020 [42]Harvard Medical School Whole Brain Atlas &275 images165N/A11020% normal
20% stroke
20% neurodegenerative
20% infectious
20% neoplasm
2D single slice of:
Ax T2
1.5 T
Nayak et al., 2020 [43]Havard Medical School200 images120N/A8020% normal
20% stroke
20% neurodegenerative
20% infectious
20% neoplasm
2D single slice of:
Ax T2
1.5 T
Pereira et al., 2019 [44]BRATS 2013
BRATS 2017
ISLES 2017
471 patients3581010389% tumor (high grade glioma, low grade glioma)
11% acute & subacute infarct
Ax T1 & T1 + C
Ax T2
Ax T2-FLAIR
Ax DWI, ADC,
perfusion
1.5 T
3 T
Rauschecker et al., 2020 [23]Private178 patients86N/A9219 different abnormalities incl. MS, high grade glioma, and vascular (acute or subacute ischemia)Ax T1 + C
Ax T2
Ax T2-FLAIR
Ax T2 * GRE
Ax DWI & ADC
1.5 T
3 T
Wood et al., 2022 [45]Private71,206 patients53,40994257372Normal and 90+ different abnormalities including vascular disease, neoplasms, demyelination, and atrophyAx T2-FLAIR
Ax DWI
1.5 T
3 T
Abbreviations: WMH = White Matter Hyperintensity Challenge; BRATS = Brain Tumor Segmentation Challenge Data; HGG = High Grade Glioma; LGG = Low Grade Glioma; ISLES = Ischemic Stroke Lesion Segmentation; OASIS-3 = Open Access Series of Imaging Studies; Ax. = axial. Private = local in-house dataset not publicly available. * Train/test distribution only reported for data pertaining subpart of study performing case-level classification of stroke/not stroke. Disease frequencies in the study populations were also varied with diverse samples of cerebrovascular disease, brain tumors, inflammatory disease, neurodegenerative diseases, neuroinfectious diseases, dementia, traumatic brain injury, and various less significant pathologies. All study populations had samples of brain tumors, while 11 (58%) studies had samples of both normal scans, brain infarcts, hemorrhages, and tumors. The brain pathologies were identified on MR sequences found in typical routine acquisitions with T1, T2, and T2-FLAIR being the most prevalent. Eight studies (42%) used only a single scan sequence, either T2 or T2-FLAIR, for disease inference.
Table 3. (a) Performance results of binary classification algorithms. (b) Performance results of multiclass classification algorithms.
AuthorAim of AlgorithmType of
Algorithm
Ground TruthTesting StrategyPerformance ResultsWorkflow Applicability
AUCAcc (%)Sens (%)Spec (%)F1 (%)PPV (%)NPV (%)
(a)
Fayaz et al., 2021 [31]Binary classification of normal and abnormalCNN + DWTExpert labelsTrain-test split0.997N/A99.7N/AN/AN/AN/A(A) Reflecting clinical practice: NS
(B) External validation: NS
(C) Performance: S
Note: High performance observed on single 2D MR slices
Felipe Fattori Alves et al., 2020 [32]Binary classification of inflammatory lesions and brain tumorsRF
SVM
k-NN
Expert delineationTrain-test split* 0.906* 82.7* 91.2N/A* 87.5N/AN/A(A) Reflecting clinical practice: NS
(B) External validation: NS
(C) Performance: S
Gauriau et al., 2021 [33]Binary classification of normal and abnormalCNNRadiological reportTrain-test split incl. external test set0.800
[0.770;
0.820]
N/A77.0
[75; 80]
65.0
[61; 69]
78.0
[76; 80]
N/AN/A(A) Reflecting clinical practice: S
(B) External validation: S
(C) Performance: NS
Gilanie et al., 2018 [34]Binary classification of normal and abnormalGabor filter
SVM
Expert labelsTrain-test split0.97096.598.092.0N/AN/AN/A(A) Reflecting clinical practice: NS
(B) External validation: NS
(C) Performance: S
Lu et al., 2021 [39]Binary classification of stroke/non- stroke patientsCNN + Gating attention mechanism ranking of multi-contrast MRIExpert labelsTrain-test split** 0.881N/AN/AN/AN/AN/AN/A(A) Reflecting clinical practice: NS
(B) External validation: NS
(C) Performance: S
Lu, Lu et Zhang., 2019 [40]Binary classification of normal and abnormalCNN + transfer learningExpert labelsTrain-test splitN/A100.0100.0100.0N/AN/AN/A(A) Reflecting clinical practice: NS
(B) External validation: NS
(C) Performance: S
Note: High test performance result on small test set <100 2D MR slices
Wood et al., 2022 [45]Binary classification of normal and abnormalEnsemble
CNN
NLP labelled radiological reportTrain-test split incl. external test set 0.948
[0.945; 0.951]
N/A91.9
[89.9; 93.9]
84.2
[82.2; 86.2]
92.3
[90.3; 94.3]
N/AN/A(A) Reflecting clinical practice: NS
(B) External validation: S
(C) Performance: S
(b)
Han et al., 2020 [35]Multiple binary classification of normal/clinical dementia (Dem), normal/brain metastasis (BM), and normal/various diseases (VD) incl. small infarct and hemorrhage.Unsupervised GAN +
7 Self-attention (SA) modules
Expert labelTrain-test splitDem: 0.765
BM: 0.921
VD: 0.613
N/AN/AN/AN/AN/AN/A(A) Reflecting clinical practice: NS
(B) External validation: NS
(C) Performance: NS
Nael et al., 2021 [41] Multiple binary classification of normal/any abnormalities (abn), infarct (inf)/non-infarct, hemorrhage (hem)/non-hemorrhage, and mass effect (ME)/non-mass effectCNNRadiological report
Expert image delineation
Train-test split incl. external test setAbn: 0.880
Inf.: 0.970
Hem.: 0.830
ME: 0.870
Abn: 80.0
Inf.: 95.0
Hem: 87.0
ME: 81.0
Abn: 80.0
Inf.: 90.0
Hem.: 72.0
ME: 79.0
Abn: 80.0
Inf.: 97.0
Hem.: 88.0
ME: 81.0
N/AAbn: 94.0
Inf.: 92.0
Hem.: 32.0
ME: 12.0
Abn: 48.0
Inf.: 96.0
Hem.: 98.0
ME: 99.0
(A) Reflecting clinical practice: NS
(B) External validation: S
(C) Performance: S
Nayak et al., 2020 [42]Multiclass classification of normal, stroke, tumor, infectious, degenerativeCNNExpert labelsTrain-test splitN/A*** 97.5N/AN/AN/AN/AN/A(A) Reflecting clinical practice: NS
(B) External validation: NS
(C) Performance: S
Note: High test performance result on small test set of 2D MR slices
Nayak et al., 2020 [43]Multiclass classification of normal, stroke, tumor, infectious, degenerativeCNN +
ELM
Expert labelsTrain-test splitN/A93.8N/AN/AN/AN/AN/A(A) Reflecting clinical practice: NS
(B) External validation: NS
(C) Performance: S
Note: High test performance result on small test set <100 2D MR slices
Rauschecker et al., 2020 [23]Multiclass classification of 19 brain diseases incl multiple sclerosis (MS), high grade glioma, and vascular infarct defined as correctly classified within top 3 differential diagnosisCNN +
Bayesian inference
Expert labelsTrain-test split0.920
[0.880; 0.950]
91.0
[84; 96]
N/AN/AN/AN/AN/A(A) Reflecting clinical practice: NS
(B) External validation: NS
(C) Performance: S
(a) Abbreviations: AUC = area under receiver operatic characteristics curve; Acc = accuracy; Sens = sensitivity; Spec = specificity; PPV = positive predictive value; NPV = negative predictive value; S = satisfied; NS = Not Satisfied (see Section 2); CNN = convolutional neural network; VAE = variational auto-encoder; ELM = extreme learning machine; GAN = generative adversarial network; RF = Random forest; SVM = Support vector machine; k-NN = k-Nearest Neighbor; DWT = Deep Wavelet Transform. * Metrics are reported for a random forest classifier on only T1 images ** Results reported for subpart of study performing case-level classification of stroke/not stroke *** Metrics reported for the largest data subset available in the study (b) Abbreviations: ELM = extreme learning machine; GAN = generative adversarial network.
Table 4. Performance results of segmentation algorithms.
AuthorAim of AlgorithmType of AlgorithmGround TruthTesting StrategyPerformance ResultsWorkflow Applicability
DSCSens (%)Spec (%)PPV (%)NPV (%)
Ahmadi et al., 2021 [28]Multiclass segmentation incl. neoplasm and neurodegenerative diseaseCNNSynthetic labels via robust PCATrain-test split0.91299.999.8N/AN/A(A) Reflecting clinical practice: NS
(B) External validation: NS
(C) Performance: S
Baur et al., 2021 [29]Multiclass segmentation of normal, MS, glioblastoma (GBM), glioma, microangiopathy (MA), and WMHUnsupervised VAERadiological report
Expert image delineation
Train-test splitMS: 0.650
GBM: 0.390
Glioma: 0.350
MA: 0.730
WMH: 0.450
MS: 62.0
GBM: 56.0
Glioma: 29.0
MA: 36.0
WMH: 13.0
N/AMS: 67.0
GBM: 14.0
Glioma: 28.0
MA: 17.0
WMH: 49.0
N/A(A) Reflecting clinical practice: NS
(B) External validation: NS
(C) Performance: NS
Duong et al., 2019 [30]Multiclass segmentation of 19+ different abnormalities incl. MS, high grade glioma, and infarctsCNNExpert image delineationTrain-test split0.789
[0.767; 0.811]
76.7
[74.2; 79.2]
99.9
[99; 99]
76.9
[75.1; 78.7]
99.0
[99; 99]
(A) Reflecting clinical practice: NS
(B) External validation: NS
(C) Performance: NS
Hu et al., 2020 [36]Multiclass segmentation of infarct and gliomaCNNExpert image delineationTrain-test splitInfarct: 0.300
[0.120; 0.520]
Glioma: 0.860
Infarct: 43.0
[16; 70]
Glioma: 87.0
Infarct: N/A
Glioma: 87.0
Infarct: 35.0
[8; 62]
Glioma: N/A
N/A(A) Reflecting clinical practice: NS
(B) External validation: NS
(C) Performance: NS
Kamnitsas et al., 2017 [37]Multiclass
segmentation of infarct, traumatic brain injury (TBI), and glioma
Ensemble CNNExpert image delineationTrain-test splitInfarct: 0.590
[0.280; 0.900]
TBI: 0.645
[0.480; 0.810]
Glioma: 0.849
Infarct: 60.0
[33; 87]
TBI: 63.9
[47; 81]
Glioma: 87.7
N/AInfarct: 68.0
[35; 100]
TBI: 69.8
[52; 88]
Glioma: 85.3
N/A(A) Reflecting clinical practice: NS
(B) External validation: NS
(C) Performance: NS
Kim et al., 2021 [38]Multiclass segmentation of infarct and gliomaUnsupervised VAEExpert image delineationTrain-test splitInfarct: 0.278
[0.273; 0.283]
Glioma: 0.692
[0.686; 0.698]
Infarct: 42.9
[42.2; 43.6]
Glioma: 67.5
[65.1; 69.9]
N/AInfarct: 20.5
[19.8; 21.2]
Glioma: 71.1
[67.2; 75.0]
N/A(A) Reflecting clinical practice: NS
(B) External validation: NS
(C) Performance: NS
Pereira et al., 2019 [44]Multiclass segmentation of infarct incl. penumbra and gliomaCNNExpert image delineationTrain-test splitInfarct: 0.340
[0.140; 0.540]
Penumbra: 0.820
[0.730; 0.910]
Glioma: 0.866
Infarct: 55.0 [25; 85]
Glioma: 84.6
N/AInfarct: 36.0
[11; 61]
Glioma: 89.8
N/A(A) Reflecting clinical practice: NS
(B) External validation: NS
(C) Performance: NS
Abbreviations: VAE = variational auto-encoder; CNN = convolutional neural network; DSC = Dice-score coefficient; Sens = sensitivity; Spec = specificity; PPV = positive predictive value; NPV = negative predictive value; S = satisfied; NS = Not Satisfied; CNN = convolutional neural network; VAE = variational autoencoder; PCA = principal component analysis; MS = multiple sclerosis; WMH = white matter hyperintensities.
Table 5. Presentation of risk of bias/concern for applicability analysis results.
SourceRisk of BiasConcern for Applicability
Patient
Selection
Index TestReference TestFlow and TimingPatient
Selection
Index TestReference Test
Ahmadi et al., 2021 [28] Diagnostics 12 01878 i002 Diagnostics 12 01878 i001 Diagnostics 12 01878 i002 Diagnostics 12 01878 i001 Diagnostics 12 01878 i002 Diagnostics 12 01878 i002 Diagnostics 12 01878 i002
Baur et al., 2021 [29] Diagnostics 12 01878 i002 Diagnostics 12 01878 i001 Diagnostics 12 01878 i001 Diagnostics 12 01878 i001 Diagnostics 12 01878 i002 Diagnostics 12 01878 i001 Diagnostics 12 01878 i001
Duong et al.,
2019 [30]
Diagnostics 12 01878 i002 Diagnostics 12 01878 i001 Diagnostics 12 01878 i001 Diagnostics 12 01878 i001 Diagnostics 12 01878 i002 Diagnostics 12 01878 i001 Diagnostics 12 01878 i001
Fayaz et al., 2021 [31] Diagnostics 12 01878 i002 Diagnostics 12 01878 i001 Diagnostics 12 01878 i002 Diagnostics 12 01878 i001 Diagnostics 12 01878 i002 Diagnostics 12 01878 i002 Diagnostics 12 01878 i002
Felipe Fattori Alves et al., 2020 [32] Diagnostics 12 01878 i002 Diagnostics 12 01878 i001 Diagnostics 12 01878 i001 Diagnostics 12 01878 i001 Diagnostics 12 01878 i002 Diagnostics 12 01878 i002 Diagnostics 12 01878 i001
Gauriau et al., 2021 [33] Diagnostics 12 01878 i001 Diagnostics 12 01878 i001 Diagnostics 12 01878 i001 Diagnostics 12 01878 i001 Diagnostics 12 01878 i001 Diagnostics 12 01878 i001 Diagnostics 12 01878 i001
Gilanie et al., 2018 [34] Diagnostics 12 01878 i002 Diagnostics 12 01878 i001 Diagnostics 12 01878 i002 Diagnostics 12 01878 i001 Diagnostics 12 01878 i002 Diagnostics 12 01878 i002 Diagnostics 12 01878 i002
Han et al.,
2020 [35]
Diagnostics 12 01878 i002 Diagnostics 12 01878 i002 Diagnostics 12 01878 i001 Diagnostics 12 01878 i001 Diagnostics 12 01878 i002 Diagnostics 12 01878 i001 Diagnostics 12 01878 i001
Hu et al.,
2020 [36]
Diagnostics 12 01878 i002 Diagnostics 12 01878 i002 Diagnostics 12 01878 i001 Diagnostics 12 01878 i001 Diagnostics 12 01878 i002 Diagnostics 12 01878 i002 Diagnostics 12 01878 i001
Kamnitsas et al., 2017 [37] Diagnostics 12 01878 i002 Diagnostics 12 01878 i003 Diagnostics 12 01878 i001 Diagnostics 12 01878 i001 Diagnostics 12 01878 i002 Diagnostics 12 01878 i002 Diagnostics 12 01878 i002
Kim et al.,
2021 [38]
Diagnostics 12 01878 i002 Diagnostics 12 01878 i001 Diagnostics 12 01878 i001 Diagnostics 12 01878 i001 Diagnostics 12 01878 i002 Diagnostics 12 01878 i003 Diagnostics 12 01878 i001
Lu et al.,
2021 [39]
Diagnostics 12 01878 i002 Diagnostics 12 01878 i002 Diagnostics 12 01878 i001 Diagnostics 12 01878 i001 Diagnostics 12 01878 i002 Diagnostics 12 01878 i001 Diagnostics 12 01878 i001
Lu, Lu et Zhang., 2019 [40] Diagnostics 12 01878 i002 Diagnostics 12 01878 i001 Diagnostics 12 01878 i002 Diagnostics 12 01878 i001 Diagnostics 12 01878 i002 Diagnostics 12 01878 i002 Diagnostics 12 01878 i002
Nael et al.,
2021 [41]
Diagnostics 12 01878 i003 Diagnostics 12 01878 i001 Diagnostics 12 01878 i001 Diagnostics 12 01878 i001 Diagnostics 12 01878 i002 Diagnostics 12 01878 i001 Diagnostics 12 01878 i001
Nayak et al.,
2020 [42]
Diagnostics 12 01878 i002 Diagnostics 12 01878 i003 Diagnostics 12 01878 i002 Diagnostics 12 01878 i001 Diagnostics 12 01878 i002 Diagnostics 12 01878 i001 Diagnostics 12 01878 i002
Nayak et al.,
2020 [43]
Diagnostics 12 01878 i002 Diagnostics 12 01878 i001 Diagnostics 12 01878 i002 Diagnostics 12 01878 i001 Diagnostics 12 01878 i002 Diagnostics 12 01878 i001 Diagnostics 12 01878 i002
Pereira et al., 2019 [44] Diagnostics 12 01878 i002 Diagnostics 12 01878 i003 Diagnostics 12 01878 i001 Diagnostics 12 01878 i001 Diagnostics 12 01878 i002 Diagnostics 12 01878 i002 Diagnostics 12 01878 i001
Rauschecker et al., 2020 [23] Diagnostics 12 01878 i001 Diagnostics 12 01878 i001 Diagnostics 12 01878 i001 Diagnostics 12 01878 i001 Diagnostics 12 01878 i001 Diagnostics 12 01878 i003 Diagnostics 12 01878 i001
Wood et al.,
2022 [45]
Diagnostics 12 01878 i001 Diagnostics 12 01878 i001 Diagnostics 12 01878 i002 Diagnostics 12 01878 i001 Diagnostics 12 01878 i001 Diagnostics 12 01878 i001 Diagnostics 12 01878 i003
Summary of risk of bias and concern for applicability for all included studies. Diagnostics 12 01878 i004 = low risk of bias and concern for applicability; Diagnostics 12 01878 i005 = high risk of bias and concern for applicability; Diagnostics 12 01878 i006 = unclear risk of bias and concern for applicability.
Publisher’s Note: MDPI stays neutral with regard to jurisdictional claims in published maps and institutional affiliations.

