
Lipoprofiling Assessed by NMR Spectroscopy in Patients with Acute Coronary Syndromes: Is There a Need for Fasting Prior to Sampling?

 , , , , and
Abstract
:
1. Introduction
2. Materials and Methods
2.1. Group Selection
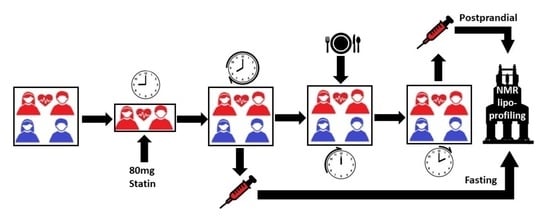
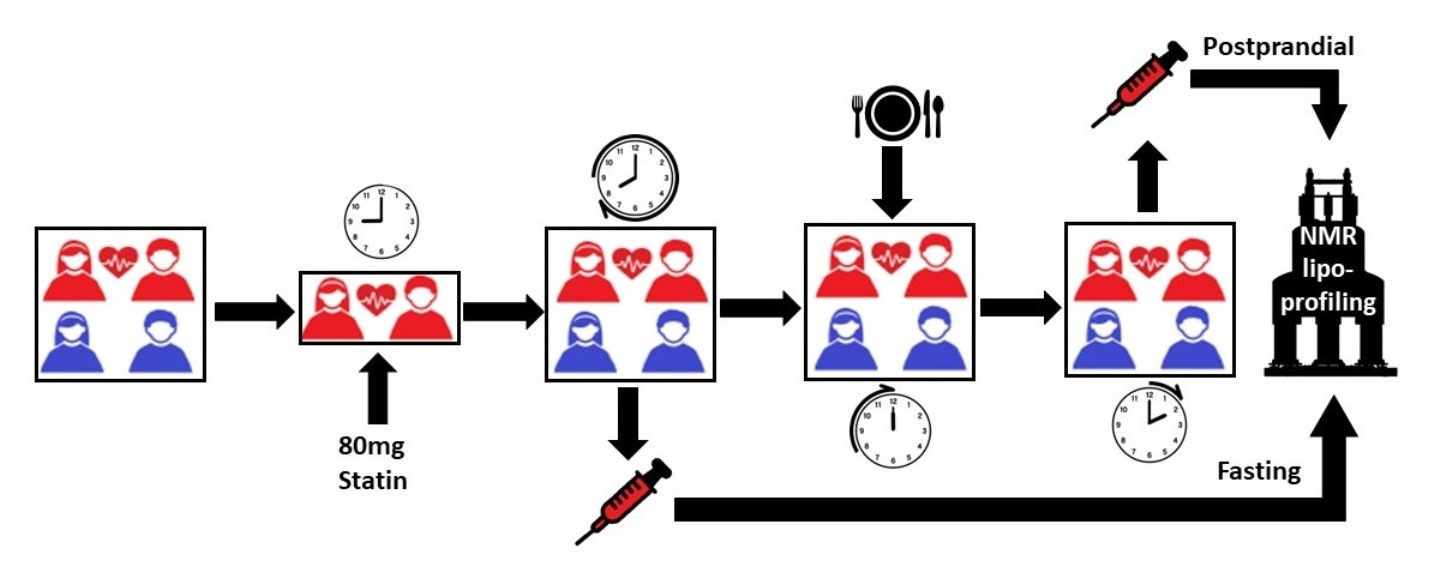
2.2. Blood Sampling
2.3. NMR Analysis
3. Results
4. Discussion
5. Conclusions
Supplementary Materials
Author Contributions
Funding
Institutional Review Board Statement
Informed Consent Statement
Data Availability Statement
Conflicts of Interest
References
- Vakhtangadze, T.; Tak, R.S.; Singh, U.; Baig, M.S.; Bezsonov, E. Gender differences in atherosclerotic vascular disease: From lipids to clinical outcomes. Front. Cardiovasc. Med. 2021, 8, 707889. [Google Scholar] [CrossRef] [PubMed]
- Barquera, S.; Pedroza-Tobías, A.; Medina, C.; Hernández-Barrera, L.; Bibbins-Domingo, K.; Lozano, R.; Moran, A.E. Global overview of the epidemiology of atherosclerotic cardiovascular disease. Arch. Med. Res. 2015, 46, 328–338. [Google Scholar] [CrossRef]
- Mehta, P.K.; Wei, J.; Wenger, N.K. Ischemic heart disease in women: A focus on risk factors. Trends. Cardiovasc. Med. 2015, 25, 140–151. [Google Scholar] [CrossRef] [Green Version]
- Ford, E.S.; Capewell, S. Coronary heart disease mortality among young adults in the U.S. from 1980 through 2002: Concealed leveling of mortality rates. J. Am. Coll. Cardiol. 2007, 50, 2128–2132. [Google Scholar] [CrossRef] [Green Version]
- Collet, J.-P.; Thiele, H.; Barbato, E.; Barthélémy, O.; Bauersachs, J.; Bhatt, D.L.; Dendale, P.; Dorobantu, M.; Edvardsen, T.; Folliguet, T.; et al. ESC Group. 2020 ESC Guidelines for the management of acute coronary syndromes in patients presenting without persistent ST-segment elevation. Eur. Heart J. 2021, 42, 1289–1367. [Google Scholar] [CrossRef] [PubMed]
- Mora, S.; Chang, C.L.; Moorthy, M.V.; Sever, P.S. Association of nonfasting vs fasting lipid levels with risk of major coronary events in the Anglo-Scandinavian Cardiac Outcomes Trial—Lipid Lowering Arm. JAMA Int. Med. 2019, 179, 898–905. [Google Scholar] [CrossRef] [PubMed]
- Stavarache, C.; Nicolescu, A.; Duduianu, C.; Ailiesei, G.L.; Balan-Porcăraşu, M.; Cristea, M.; Macsim, A.-M.; Popa, O.; Stavarache, C.; Hîrtopeanu, A.; et al. A real-life reproducibility assessment for NMR metabolomics. Diagnostics 2022, 12, 559. [Google Scholar] [CrossRef]
- Monsonis Centelles, S.; Hoefsloot, H.C.J.; Khakimov, B.; Ebrahimi, P.; Lind, M.V.; Kristensen, M.; de Roo, N.; Jacobs, D.M.; van Duynhoven, J.; Cannet, C.; et al. Toward reliable lipoprotein particle predictions from NMR spectra of human blood: An interlaboratory ring test. Anal. Chem. 2017, 89, 8004–8012. [Google Scholar] [CrossRef] [Green Version]
- Jiménez, B.; Holmes, E.; Heude, C.; Tolson, R.F.; Harvey, N.; Lodge, S.L.; Chetwynd, A.J.; Cannet, C.; Fang, F.; Pearce, J.T.M.; et al. Quantitative lipoprotein subclass and low molecular weight metabolite analysis in human serum and plasma by 1H NMR spectroscopy in a multilaboratory trial. Anal. Chem. 2018, 90, 11962–11971. [Google Scholar] [CrossRef]
- Dayar, E.; Pechanova, O. Targeted strategy in lipid-lowering therapy. Biomedicines 2022, 10, 1090. [Google Scholar] [CrossRef]
- Dona, A.C.; Jiménez, B.; Schäfer, H.; Humpfer, E.; Spraul, M.; Lewis, M.R.; Pearce, J.T.M.; Holmes, E.; Lindon, J.C.; Nicholson, J.K. Precision high-throughput proton NMR spectroscopy of human urine, serum, and plasma for large-scale metabolic phenotyping. Anal. Chem. 2014, 86, 9887–9894. [Google Scholar] [CrossRef]
- Soininen, P.; Kangas, A.J.; Wurtz, P.; Suna, T.; Ala-Korpela, M. Quantitative serum nuclear magnetic resonance metabolomics in cardiovascular epidemiology and genetics. Circ. Cardiovasc. Genet. 2015, 8, 192–206. [Google Scholar] [CrossRef] [Green Version]
- Papadopoulou, E.; Nicolescu, A.; Haug, L.S.; Husøy, T.; Deleanu, C.; Dirven, H.; Lindeman, B. Lipoprotein profiles associated with exposure to poly- and perfluoroalkyl substances (PFASs) in the EuroMix human biomonitoring study. Environ. Pollut. 2022, 308, 119664. [Google Scholar] [CrossRef]
- Otvos, J.D.; Mora, S.; Shalaurova, I.; Greenland, P.; Mackey, R.H.; Goff, D.C., Jr. Clinical implications of discordance between low-density lipoprotein cholesterol and particle number. J. Clin. Lipidol. 2011, 5, 105–113. [Google Scholar] [CrossRef] [Green Version]
- Toth, P.P.; Grabner, M.; Punekar, R.S.; Quimbo, R.A.; Cziraky, M.J.; Jacobson, T.A. Cardiovascular risk in patients achieving low-density lipoprotein cholesterol and particle targets. Atherosclerosis 2014, 235, 585–591. [Google Scholar] [CrossRef] [Green Version]
- Mach, F.; Baigent, C.; Catapano, A.L.; Koskinas, K.C.; Casula, M.; Badimon, L.; Chapman, M.J.; De Backer, G.G.; Delgado, V.; Ference, B.A.; et al. 2019 ESC/EAS Guidelines for the management of dyslipidaemias: Lipid modification to reduce cardiovascular risk: The Task Force for the management of dyslipidaemias of the European Society of Cardiology (ESC) and European Atherosclerosis Society (EAS). Eur. Heart J. 2020, 41, 111–188. [Google Scholar] [CrossRef]
- Ip, S.; Lichtenstein, A.H.; Chung, M.; Lau, J.; Balk, E.M. Systematic review: Association of low-density lipoprotein subfractions with cardiovascular outcomes. Ann. Intern. Med. 2009, 150, 474–484. [Google Scholar] [CrossRef] [Green Version]
- Superko, H.; Garrett, B. Small dense LDL: Scientific background, clinical relevance, and recent evidence still a risk even with ‘normal’ LDL-C levels. Biomedicines 2022, 10, 829. [Google Scholar] [CrossRef]
- Wu, D.; Yang, Q.; Su, B.; Hao, J.; Ma, H.; Yuan, W.; Gao, J.; Ding, F.; Xu, Y.; Wang, H.; et al. Low-density lipoprotein cholesterol 4: The notable risk factor of coronary artery disease development. Front. Cardiovasc. Med. 2021, 8, 619386. [Google Scholar] [CrossRef]
- Langsted, A.; Nordestgaard, B.G. Nonfasting versus fasting lipid profile for cardiovascular risk prediction. Pathology 2019, 51, 131–141. [Google Scholar] [CrossRef]
- Smy, L.; De Biase, I.; Genzen, J.R.; Yuzyuk, T. The nuclear magnetic resonance metabolic profile: Impact of fasting status. Clin. Biochem. 2021, 87, 85–92. [Google Scholar] [CrossRef]
- Hansson, P.; Holven, K.B.; Øyri, L.K.L.; Brekke, H.K.; Biong, A.S.; Gjevestad, G.O.; Raza, G.S.; Herzig, K.-H.; Thoresen, M.; Ulven, S.M. Meals with similar fat content from different dairy products induce different postprandial triglyceride responses in healthy adults: A randomized controlled cross-over trial. J. Nutr. 2019, 149, 422–431. [Google Scholar] [CrossRef] [Green Version]
- Rizi, E.P.; Baig, S.; Loh, T.P.; Toh, S.A.; Khoo, C.M.; Tai, E.S. Two-hour postprandial lipoprotein particle concentration differs between lean and obese individuals. Front. Physiol. 2019, 10, 856. [Google Scholar] [CrossRef] [Green Version]
- Shah, M.; Jaffery, M.; Adams-Huet, B.; Franklin, B.; Oliver, J.; Mitchell, J. Effect of meal composition on postprandial lipid concentrations and lipoprotein particle numbers: A randomized cross-over study. PLoS ONE 2017, 12, e0172732. [Google Scholar] [CrossRef]
- Wojczynski, M.K.; Glasser, S.P.; Oberman, A.; Kabagambe, E.K.; Hopkins, P.N.; Tsai, M.Y.; Straka, R.J.; Ordovas, J.M.; Arnett, D.K. High-fat meal effect on LDL, HDL, and VLDL particle size and number in the Genetics of Lipid-Lowering Drugs and Diet Network (GOLDN): An interventional study. Lipids Health Dis. 2011, 10, 181. [Google Scholar] [CrossRef] [Green Version]


| Metabolite | Total | Control | Cardio | |||||||||
|---|---|---|---|---|---|---|---|---|---|---|---|---|
| % >0 | % <0 | % =0 | Cases | % >0 | % <0 | % =0 | Cases | % >0 | % <0 | % =0 | Cases | |
| Ala | 47.1 | 47.1 | 5.9 | 68 | 62.1 | 31.0 | 6.9 | 29 | 35.9 | 59.0 | 5.1 | 39 |
| Crn | 39.7 | 52.9 | 7.4 | 68 | 31.0 | 55.2 | 13.8 | 29 | 46.2 | 51.3 | 2.6 | 39 |
| Glut | 52.9 | 47.1 | 0.0 | 68 | 51.7 | 48.3 | 0.0 | 29 | 53.8 | 46.2 | 0.0 | 39 |
| Gly | 33.8 | 63.2 | 2.9 | 68 | 58.6 | 37.9 | 3.4 | 29 | 15.4 | 82.1 | 2.6 | 39 |
| His | 42.6 | 48.5 | 8.8 | 68 | 51.7 | 31.0 | 17.2 | 29 | 35.9 | 61.5 | 2.6 | 39 |
| i-Leu | 44.1 | 45.6 | 10.3 | 68 | 69.0 | 27.6 | 3.4 | 29 | 25.6 | 59.0 | 15.4 | 39 |
| Leu | 27.9 | 70.6 | 1.5 | 68 | 48.3 | 48.3 | 3.4 | 29 | 12.8 | 87.2 | 0.0 | 39 |
| Phal | 29.4 | 57.4 | 13.2 | 68 | 41.4 | 37.9 | 20.7 | 29 | 20.5 | 71.8 | 7.7 | 39 |
| Tyr | 39.7 | 44.1 | 16.2 | 68 | 37.9 | 37.9 | 24.1 | 29 | 41.0 | 48.7 | 10.3 | 39 |
| Val | 36.8 | 57.4 | 5.9 | 68 | 34.5 | 62.1 | 3.4 | 29 | 38.5 | 53.8 | 7.7 | 39 |
| Ac | 42.6 | 38.2 | 19.1 | 68 | 48.3 | 34.5 | 17.2 | 29 | 38.5 | 41.0 | 20.5 | 39 |
| Cit | 52.9 | 42.6 | 4.4 | 68 | 65.5 | 27.6 | 6.9 | 29 | 43.6 | 53.8 | 2.6 | 39 |
| For | 42.6 | 36.8 | 20.6 | 68 | 34.5 | 48.3 | 17.2 | 29 | 48.7 | 28.2 | 23.1 | 39 |
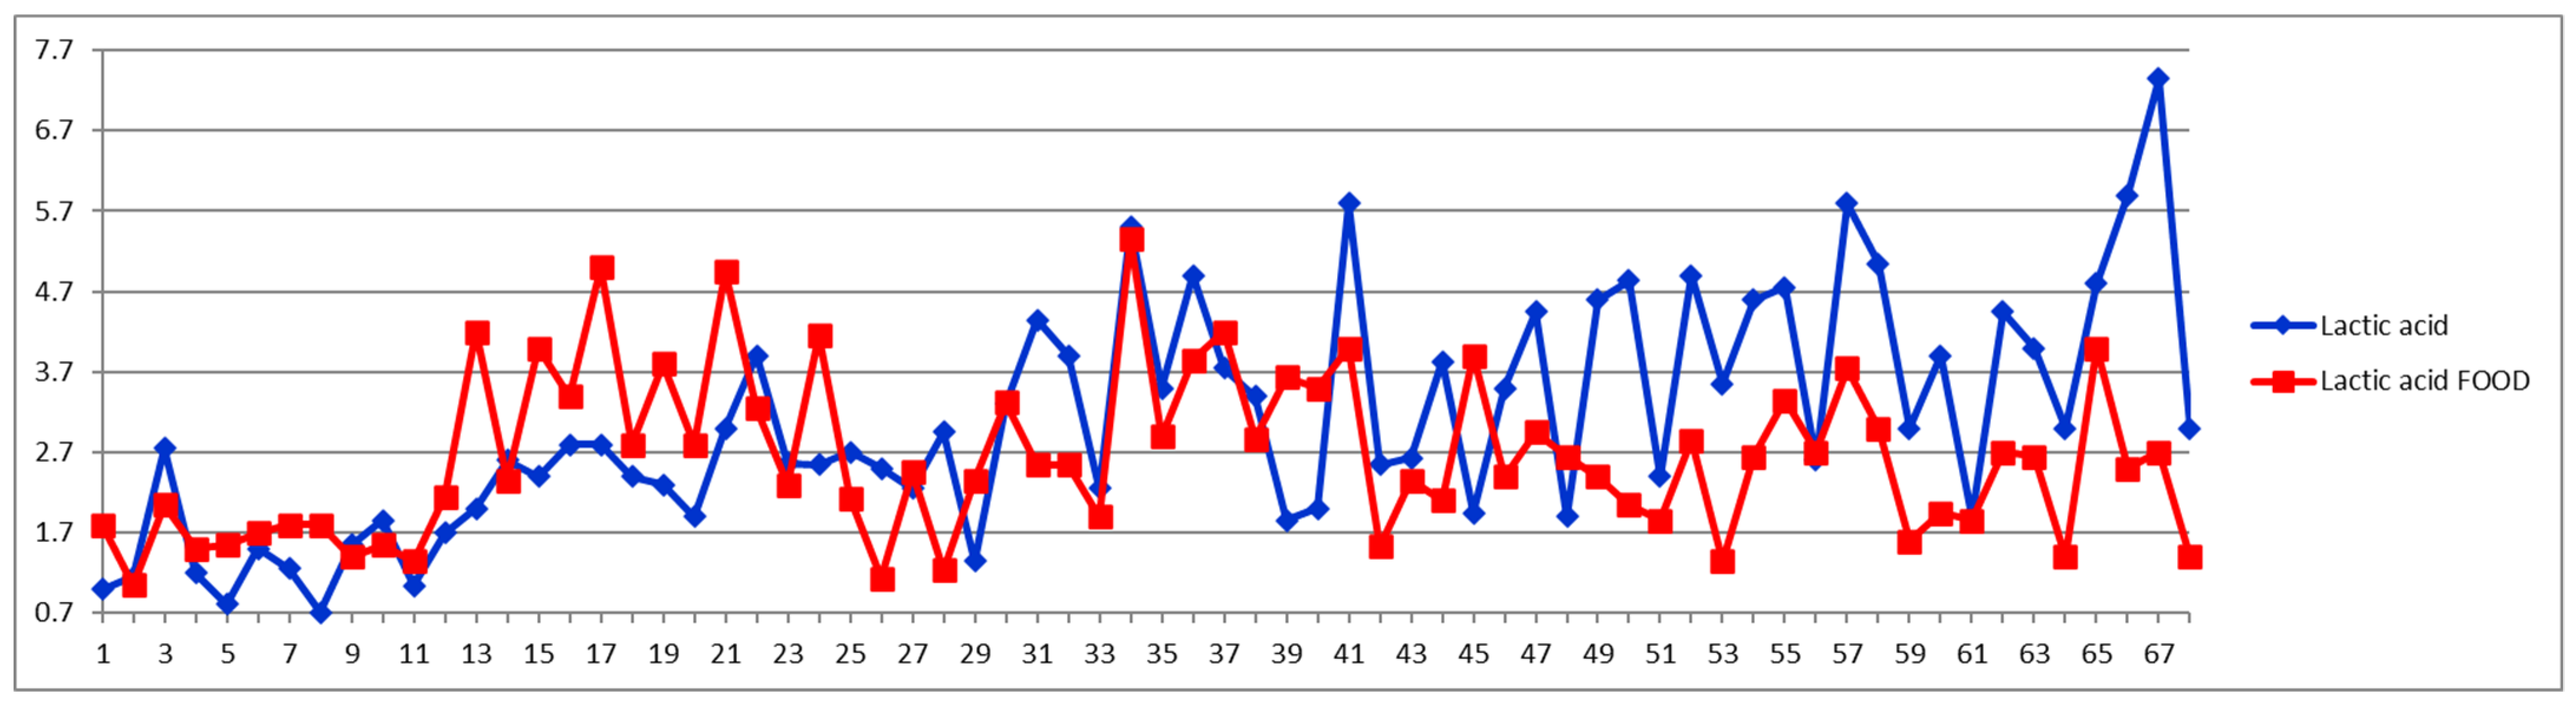
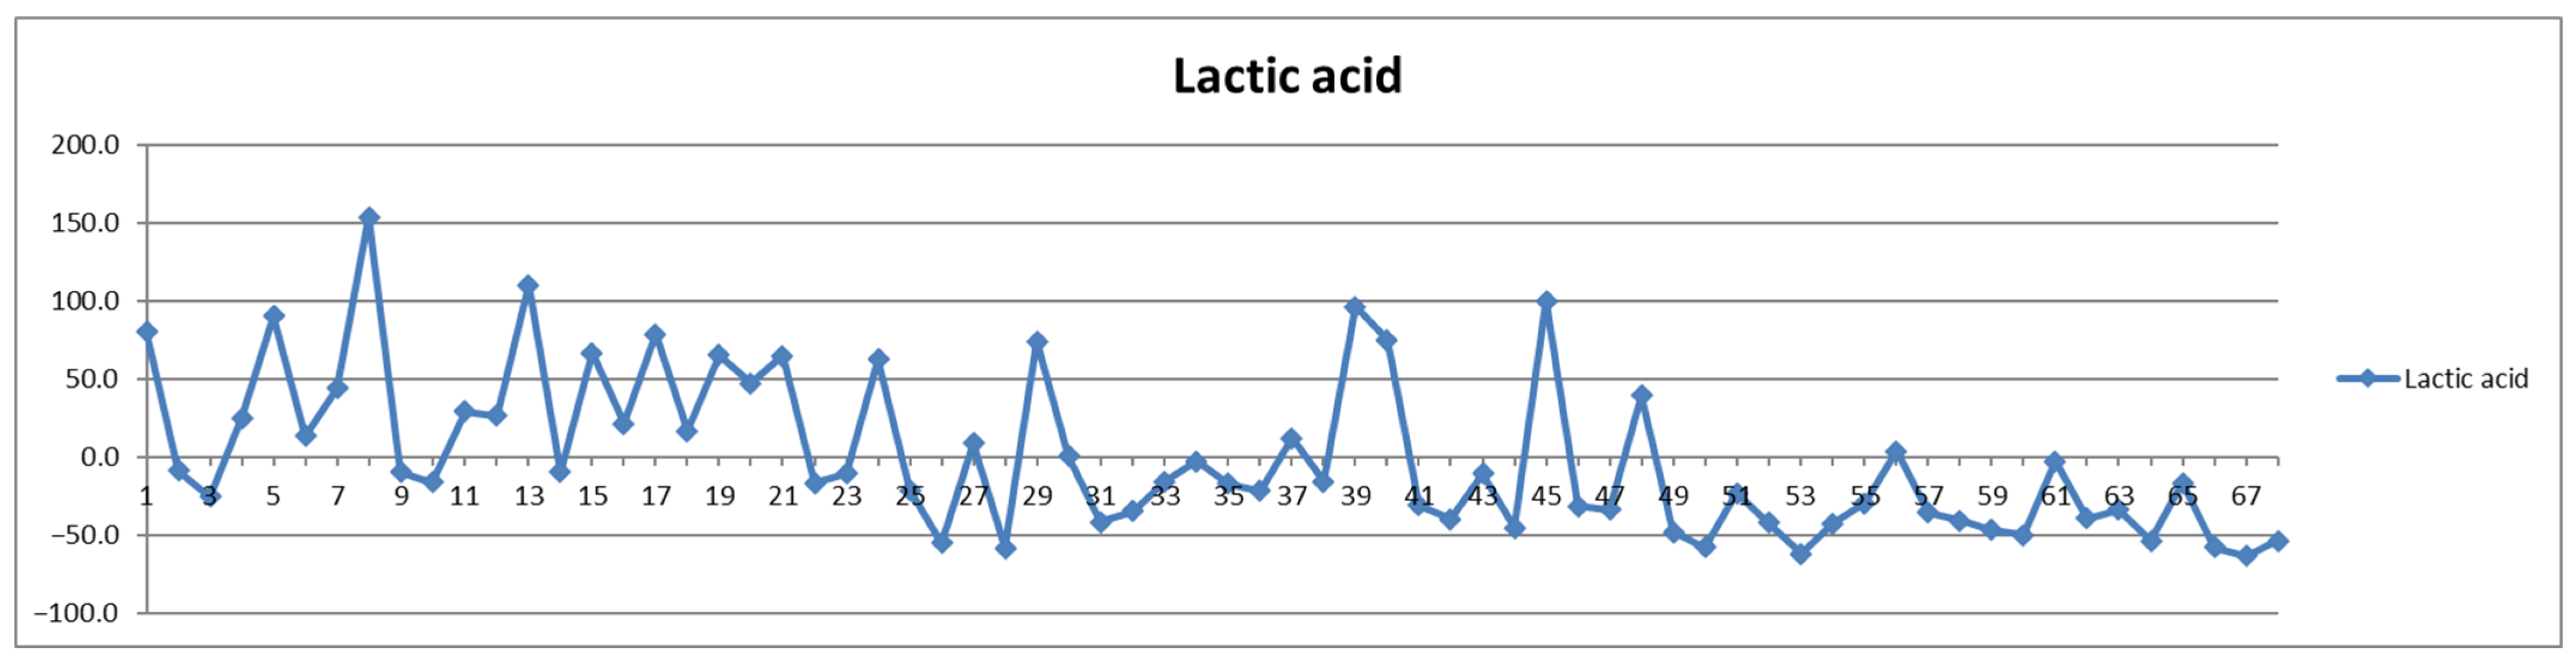
| Lac | 38.2 | 61.8 | 0.0 | 68 | 65.5 | 34.5 | 0.0 | 29 | 17.9 | 82.1 | 0.0 | 39 |
| Pyr | 52.9 | 41.2 | 5.9 | 68 | 69.0 | 17.2 | 13.8 | 29 | 41.0 | 59.0 | 0.0 | 39 |
| Gluc | 52.9 | 44.1 | 2.9 | 68 | 44.8 | 55.2 | 0.0 | 29 | 59.0 | 35.9 | 5.1 | 39 |
| Lipo-Fraction | Total | Control | Cardio | |||||||||
|---|---|---|---|---|---|---|---|---|---|---|---|---|
| % >0 | % <0 | % =0 | Cases | % >0 | % <0 | % =0 | Cases | % >0 | % <0 | % =0 | Cases | |
| TPTG | 82.4 | 17.6 | 0.0 | 68 | 93.1 | 6.9 | 0.0 | 29 | 74.4 | 25.6 | 0.0 | 39 |
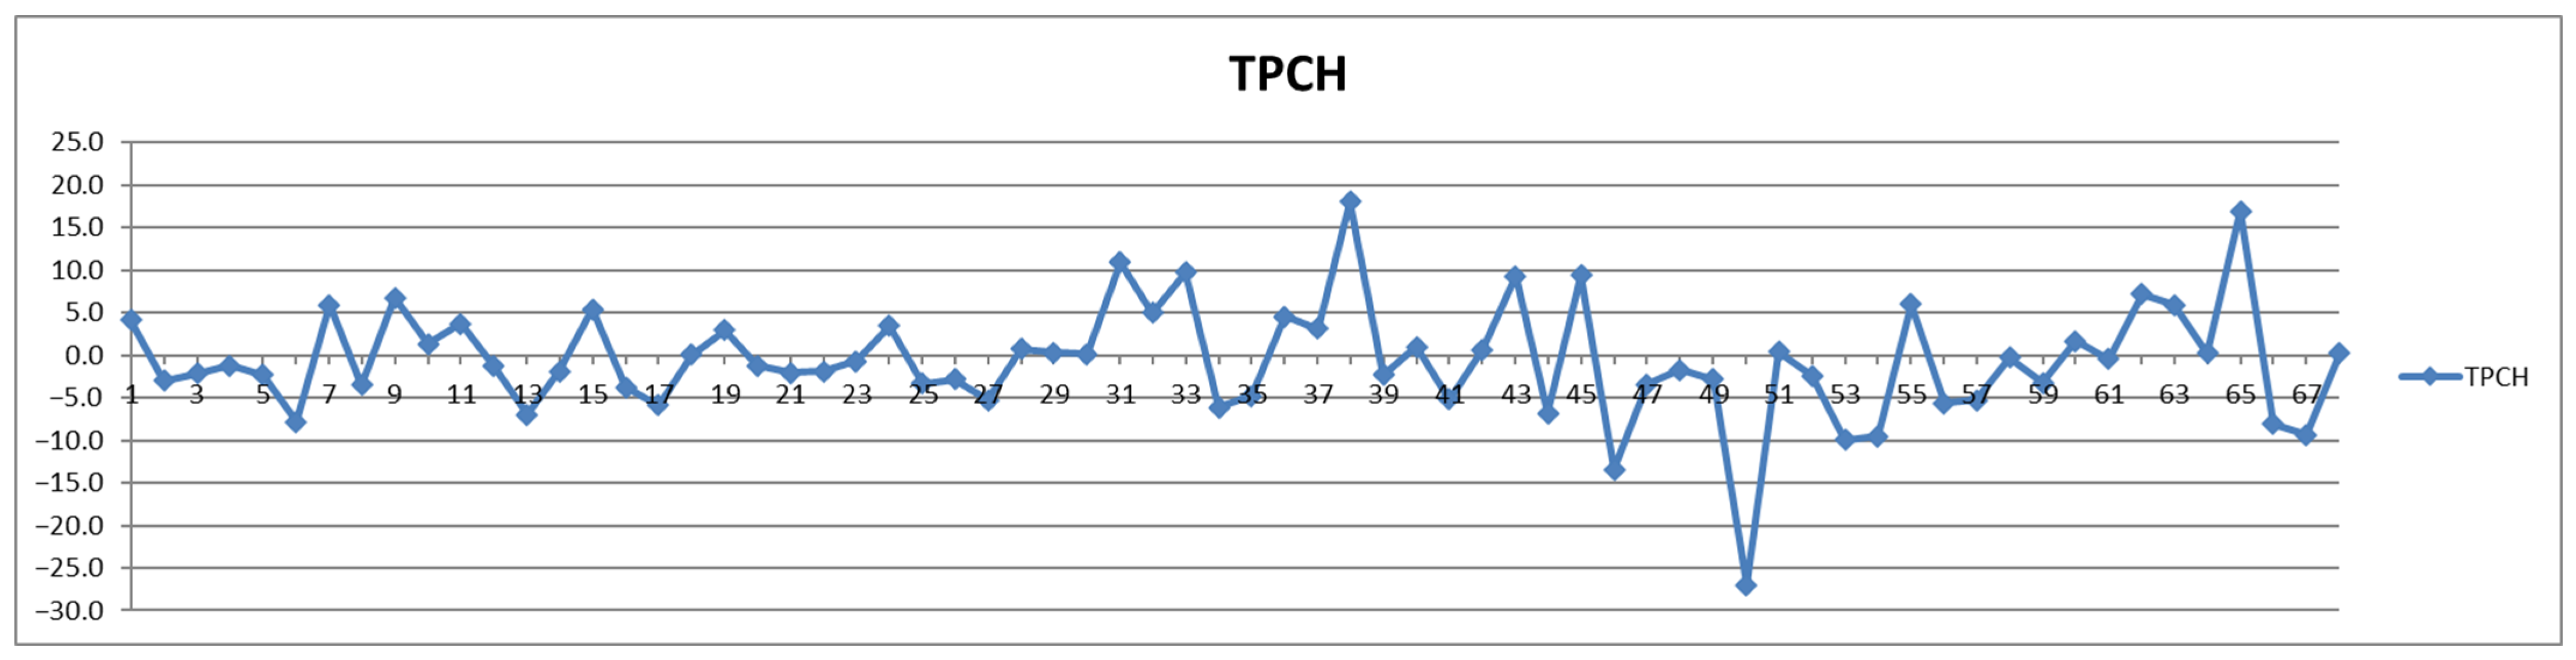
| TPCH | 44.1 | 55.9 | 0.0 | 68 | 37.9 | 62.1 | 0.0 | 29 | 48.7 | 51.3 | 0.0 | 39 |
| LDCH | 38.2 | 61.8 | 0.0 | 68 | 31.0 | 69.0 | 0.0 | 29 | 43.6 | 56.4 | 0.0 | 39 |
| HDCH | 45.6 | 52.9 | 1.5 | 68 | 44.8 | 55.2 | 0.0 | 29 | 46.2 | 51.3 | 2.6 | 39 |
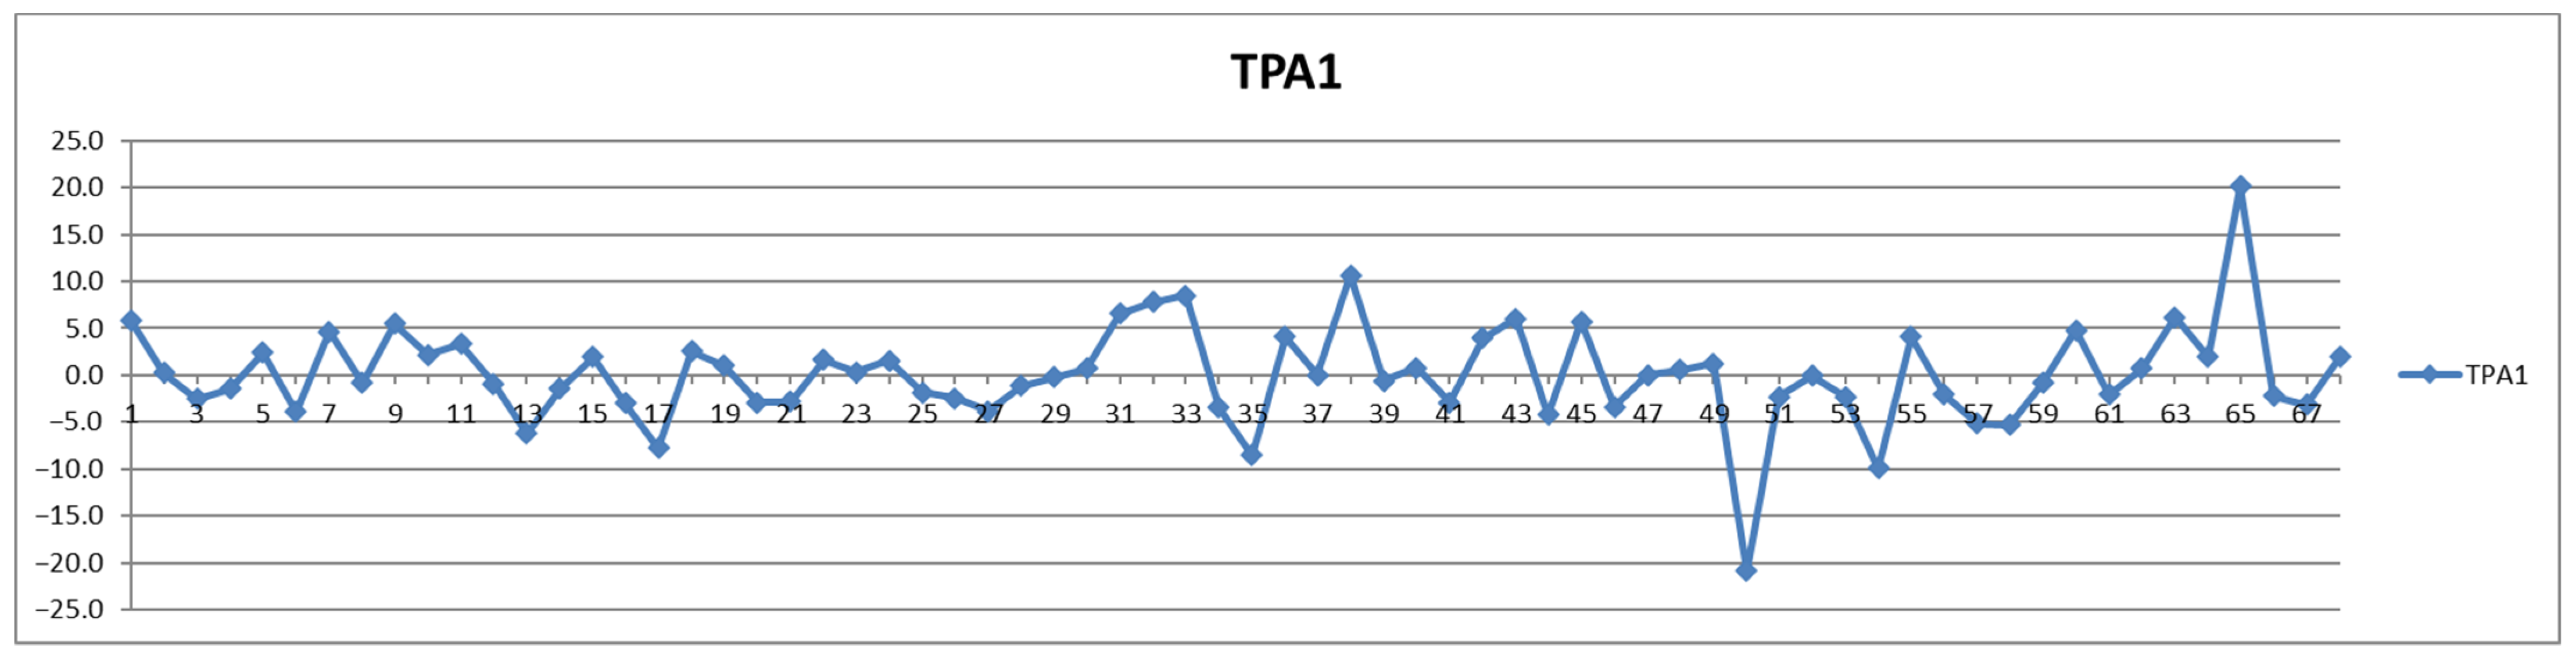
| TPA1 | 48.5 | 51.5 | 0.0 | 68 | 44.8 | 55.2 | 0.0 | 29 | 51.3 | 48.7 | 0.0 | 39 |
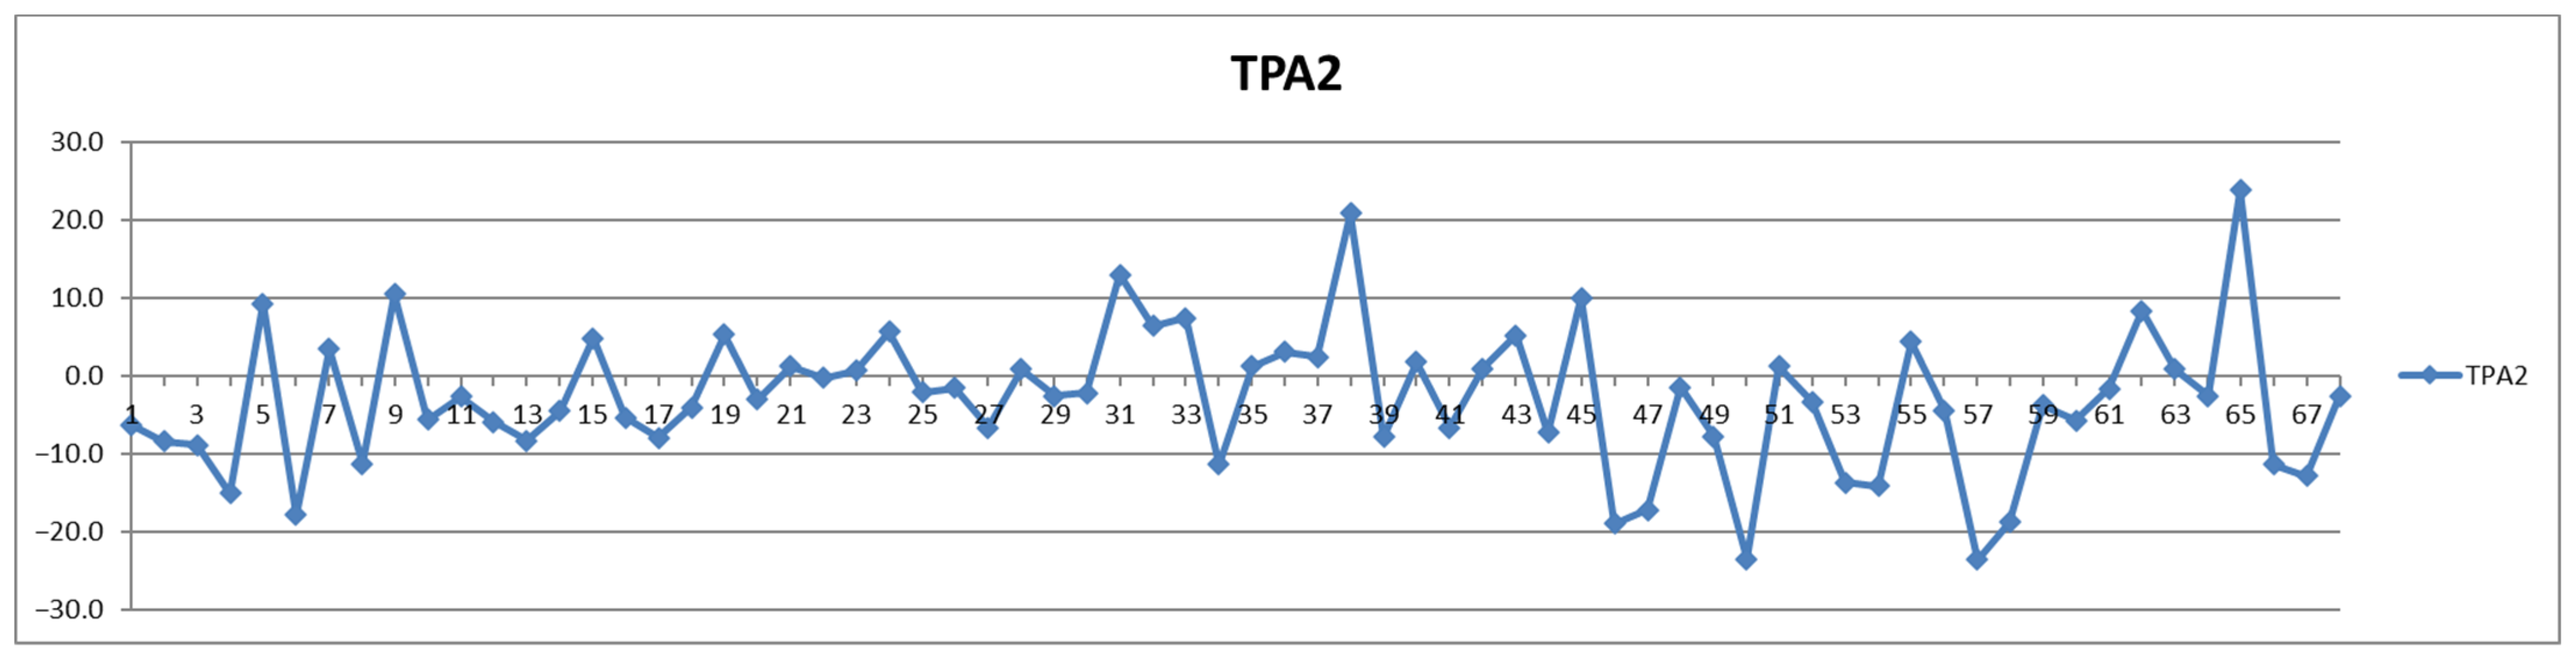
| TPA2 | 36.8 | 63.2 | 0.0 | 68 | 31.0 | 69.0 | 0.0 | 29 | 41.0 | 59.0 | 0.0 | 39 |
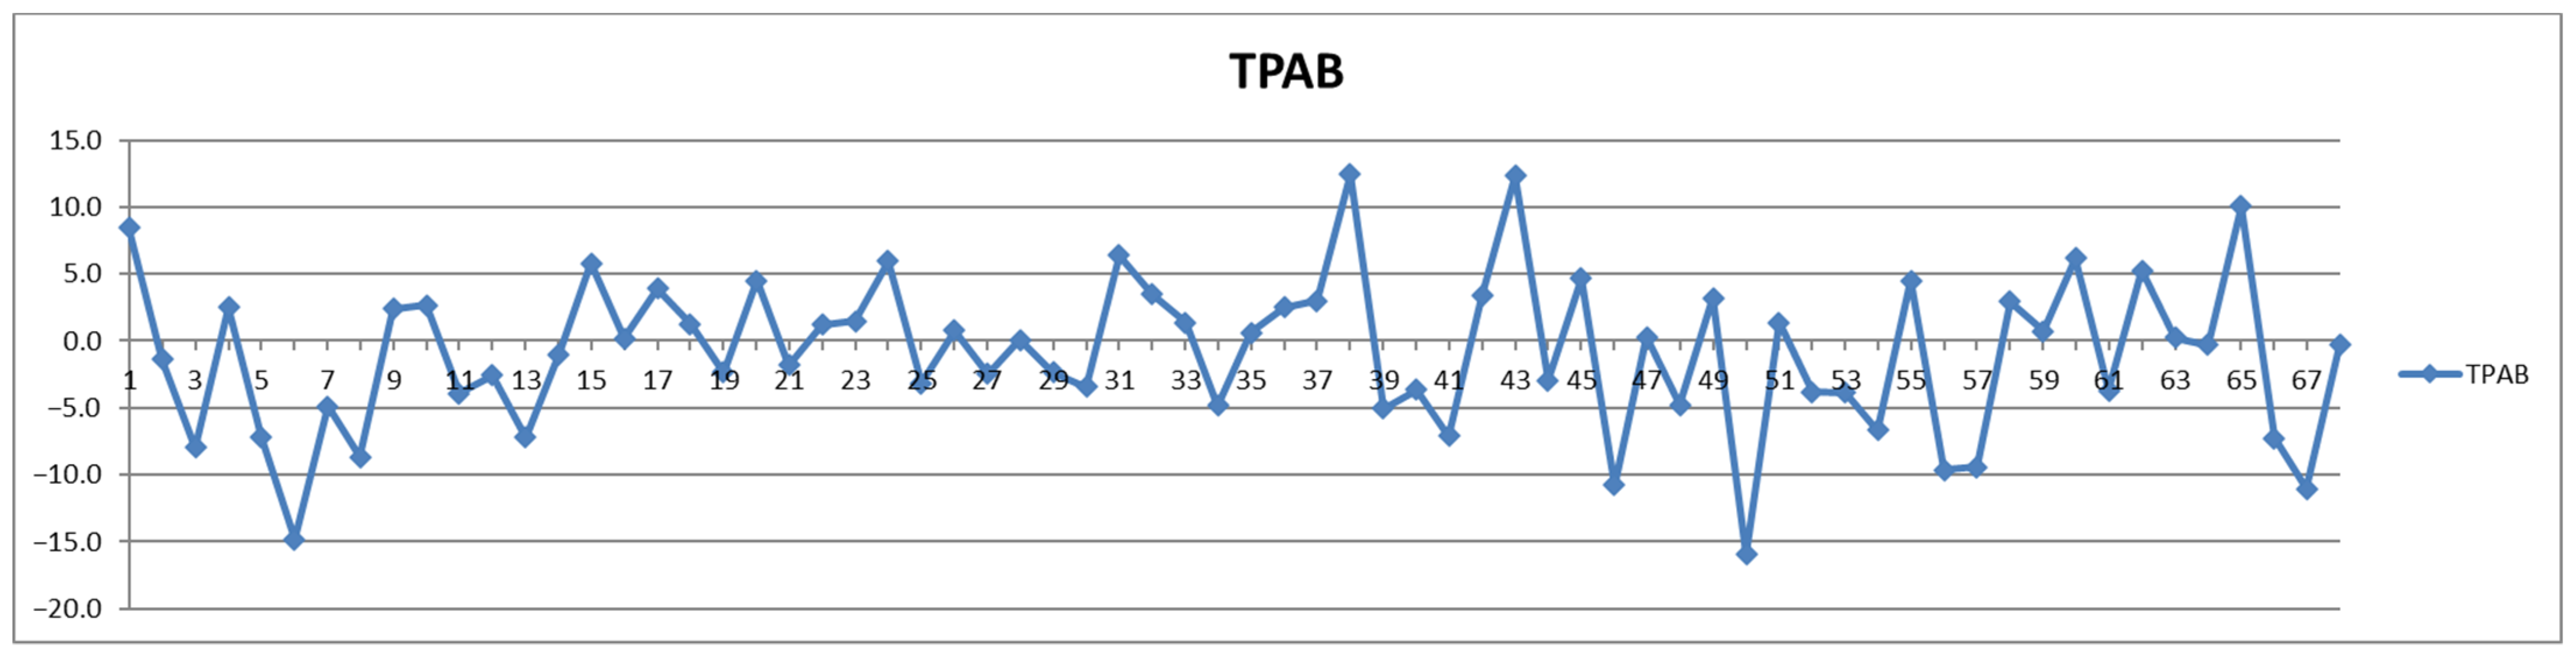
| TPAB | 50.0 | 50.0 | 0.0 | 68 | 48.3 | 51.7 | 0.0 | 29 | 51.3 | 48.7 | 0.0 | 39 |
| LDHD | 51.5 | 45.6 | 2.9 | 68 | 44.8 | 48.3 | 6.9 | 29 | 56.4 | 43.6 | 0.0 | 39 |
| ABA1 | 38.2 | 52.9 | 8.8 | 68 | 44.8 | 41.4 | 13.8 | 29 | 33.3 | 61.5 | 5.1 | 39 |
| TBPN | 50.0 | 50.0 | 0.0 | 68 | 48.3 | 51.7 | 0.0 | 29 | 51.3 | 48.7 | 0.0 | 39 |
| VLPN | 73.5 | 26.5 | 0.0 | 68 | 75.9 | 24.1 | 0.0 | 29 | 71.8 | 28.2 | 0.0 | 39 |
| IDPN | 44.1 | 55.9 | 0.0 | 68 | 41.4 | 58.6 | 0.0 | 29 | 46.2 | 53.8 | 0.0 | 39 |
| LDPN | 41.2 | 58.8 | 0.0 | 68 | 34.5 | 65.5 | 0.0 | 29 | 46.2 | 53.8 | 0.0 | 39 |
| L1PN | 48.5 | 51.5 | 0.0 | 68 | 31.0 | 69.0 | 0.0 | 29 | 61.5 | 38.5 | 0.0 | 39 |
| L2PN | 64.7 | 35.3 | 0.0 | 68 | 69.0 | 31.0 | 0.0 | 29 | 61.5 | 38.5 | 0.0 | 39 |
| L3PN | 54.4 | 45.6 | 0.0 | 68 | 37.9 | 62.1 | 0.0 | 29 | 66.7 | 33.3 | 0.0 | 39 |
| L4PN | 42.6 | 52.9 | 4.4 | 68 | 31.0 | 65.5 | 3.4 | 29 | 51.3 | 43.6 | 5.1 | 39 |
| L5PN | 26.5 | 73.5 | 0.0 | 68 | 27.6 | 72.4 | 0.0 | 29 | 25.6 | 74.4 | 0.0 | 39 |
| L6PN | 41.2 | 58.8 | 0.0 | 68 | 62.1 | 37.9 | 0.0 | 29 | 25.6 | 74.4 | 0.0 | 39 |
| VLTG | 79.4 | 20.6 | 0.0 | 68 | 86.2 | 13.8 | 0.0 | 29 | 74.4 | 25.6 | 0.0 | 39 |
| IDTG | 82.4 | 16.2 | 1.5 | 68 | 89.7 | 6.9 | 3.4 | 29 | 76.9 | 23.1 | 0.0 | 39 |
| LDTG | 66.2 | 33.8 | 0.0 | 68 | 62.1 | 37.9 | 0.0 | 29 | 69.2 | 30.8 | 0.0 | 39 |
| HDTG | 67.6 | 32.4 | 0.0 | 68 | 79.3 | 20.7 | 0.0 | 29 | 59.0 | 41.0 | 0.0 | 39 |
| VLCH | 69.1 | 30.9 | 0.0 | 68 | 72.4 | 27.6 | 0.0 | 29 | 66.7 | 33.3 | 0.0 | 39 |
| IDCH | 36.8 | 61.8 | 1.5 | 68 | 24.1 | 72.4 | 3.4 | 29 | 46.2 | 53.8 | 0.0 | 39 |
| LDCH | 38.2 | 61.8 | 0.0 | 68 | 31.0 | 69.0 | 0.0 | 29 | 43.6 | 56.4 | 0.0 | 39 |
| HDCH | 45.6 | 52.9 | 1.5 | 68 | 44.8 | 55.2 | 0.0 | 29 | 46.2 | 51.3 | 2.6 | 39 |
| VLFC | 73.5 | 25.0 | 1.5 | 68 | 82.8 | 13.8 | 3.4 | 29 | 66.7 | 33.3 | 0.0 | 39 |
| IDFC | 42.6 | 52.9 | 4.4 | 68 | 34.5 | 58.6 | 6.9 | 29 | 48.7 | 48.7 | 2.6 | 39 |
| LDFC | 41.2 | 58.8 | 0.0 | 68 | 27.6 | 72.4 | 0.0 | 29 | 51.3 | 48.7 | 0.0 | 39 |
| HDFC | 58.8 | 41.2 | 0.0 | 68 | 58.6 | 41.4 | 0.0 | 29 | 59.0 | 41.0 | 0.0 | 39 |
| VLPL | 75.0 | 25.0 | 0.0 | 68 | 79.3 | 20.7 | 0.0 | 29 | 71.8 | 28.2 | 0.0 | 39 |
| IDPL | 77.9 | 22.1 | 0.0 | 68 | 79.3 | 20.7 | 0.0 | 29 | 76.9 | 23.1 | 0.0 | 39 |
| LDPL | 41.2 | 58.8 | 0.0 | 68 | 27.6 | 72.4 | 0.0 | 29 | 51.3 | 48.7 | 0.0 | 39 |
| HDPL | 48.5 | 51.5 | 0.0 | 68 | 48.3 | 51.7 | 0.0 | 29 | 48.7 | 51.3 | 0.0 | 39 |
| HDA1 | 42.6 | 57.4 | 0.0 | 68 | 41.4 | 58.6 | 0.0 | 29 | 43.6 | 56.4 | 0.0 | 39 |
| HDA2 | 36.8 | 63.2 | 0.0 | 68 | 31.0 | 69.0 | 0.0 | 29 | 41.0 | 59.0 | 0.0 | 39 |
| VLAB | 73.5 | 26.5 | 0.0 | 68 | 75.9 | 24.1 | 0.0 | 29 | 71.8 | 28.2 | 0.0 | 39 |
| IDAB | 44.1 | 55.9 | 0.0 | 68 | 41.4 | 58.6 | 0.0 | 29 | 46.2 | 53.8 | 0.0 | 39 |
| LDAB | 41.2 | 58.8 | 0.0 | 68 | 34.5 | 65.5 | 0.0 | 29 | 46.2 | 53.8 | 0.0 | 39 |
| V1TG | 73.5 | 26.5 | 0.0 | 68 | 86.2 | 13.8 | 0.0 | 29 | 64.1 | 35.9 | 0.0 | 39 |
| V2TG | 82.4 | 17.6 | 0.0 | 68 | 93.1 | 6.9 | 0.0 | 29 | 74.4 | 25.6 | 0.0 | 39 |
| V3TG | 73.5 | 26.5 | 0.0 | 68 | 75.9 | 24.1 | 0.0 | 29 | 71.8 | 28.2 | 0.0 | 39 |
| V4TG | 60.3 | 39.7 | 0.0 | 68 | 51.7 | 48.3 | 0.0 | 29 | 66.7 | 33.3 | 0.0 | 39 |
| V5TG | 41.2 | 58.8 | 0.0 | 68 | 37.9 | 62.1 | 0.0 | 29 | 43.6 | 56.4 | 0.0 | 39 |
| V1CH | 73.5 | 25.0 | 1.5 | 68 | 79.3 | 17.2 | 3.4 | 29 | 69.2 | 30.8 | 0.0 | 39 |
| V2CH | 67.6 | 29.4 | 2.9 | 68 | 72.4 | 24.1 | 3.4 | 29 | 64.1 | 33.3 | 2.6 | 39 |
| V3CH | 57.4 | 41.2 | 1.5 | 68 | 62.1 | 34.5 | 3.4 | 29 | 53.8 | 46.2 | 0.0 | 39 |
| V4CH | 41.2 | 58.8 | 0.0 | 68 | 34.5 | 65.5 | 0.0 | 29 | 46.2 | 53.8 | 0.0 | 39 |
| V5CH | 44.1 | 55.9 | 0.0 | 68 | 51.7 | 48.3 | 0.0 | 29 | 38.5 | 61.5 | 0.0 | 39 |
| V1FC | 75.0 | 20.6 | 4.4 | 68 | 86.2 | 10.3 | 3.4 | 29 | 66.7 | 28.2 | 5.1 | 39 |
| V2FC | 72.1 | 23.5 | 4.4 | 68 | 75.9 | 13.8 | 10.3 | 29 | 69.2 | 30.8 | 0.0 | 39 |
| V3FC | 67.6 | 27.9 | 4.4 | 68 | 69.0 | 20.7 | 10.3 | 29 | 66.7 | 33.3 | 0.0 | 39 |
| V4FC | 42.6 | 52.9 | 4.4 | 68 | 37.9 | 51.7 | 10.3 | 29 | 46.2 | 53.8 | 0.0 | 39 |
| V5FC | 25.0 | 67.6 | 7.4 | 68 | 13.8 | 72.4 | 13.8 | 29 | 33.3 | 64.1 | 2.6 | 39 |
| V1PL | 77.9 | 22.1 | 0.0 | 68 | 89.7 | 10.3 | 0.0 | 29 | 69.2 | 30.8 | 0.0 | 39 |
| V2PL | 79.4 | 20.6 | 0.0 | 68 | 89.7 | 10.3 | 0.0 | 29 | 71.8 | 28.2 | 0.0 | 39 |
| V3PL | 73.5 | 26.5 | 0.0 | 68 | 75.9 | 24.1 | 0.0 | 29 | 71.8 | 28.2 | 0.0 | 39 |
| V4PL | 48.5 | 51.5 | 0.0 | 68 | 41.4 | 58.6 | 0.0 | 29 | 53.8 | 46.2 | 0.0 | 39 |
| V5PL | 45.6 | 52.9 | 1.5 | 68 | 44.8 | 51.7 | 3.4 | 29 | 46.2 | 53.8 | 0.0 | 39 |
| L1TG | 61.8 | 36.8 | 1.5 | 68 | 51.7 | 44.8 | 3.4 | 29 | 69.2 | 30.8 | 0.0 | 39 |
| L2TG | 72.1 | 27.9 | 0.0 | 68 | 65.5 | 34.5 | 0.0 | 29 | 76.9 | 23.1 | 0.0 | 39 |
| L3TG | 41.2 | 58.8 | 0.0 | 68 | 34.5 | 65.5 | 0.0 | 29 | 46.2 | 53.8 | 0.0 | 39 |
| L4TG | 51.5 | 47.1 | 1.5 | 68 | 41.4 | 55.2 | 3.4 | 29 | 59.0 | 41.0 | 0.0 | 39 |
| L5TG | 51.5 | 48.5 | 0.0 | 68 | 51.7 | 48.3 | 0.0 | 29 | 51.3 | 48.7 | 0.0 | 39 |
| L6TG | 39.7 | 60.3 | 0.0 | 68 | 51.7 | 48.3 | 0.0 | 29 | 30.8 | 69.2 | 0.0 | 39 |
| L1CH | 52.9 | 47.1 | 0.0 | 68 | 37.9 | 62.1 | 0.0 | 29 | 64.1 | 35.9 | 0.0 | 39 |
| L2CH | 70.6 | 29.4 | 0.0 | 68 | 72.4 | 27.6 | 0.0 | 29 | 69.2 | 30.8 | 0.0 | 39 |
| L3CH | 58.8 | 39.7 | 1.5 | 68 | 44.8 | 55.2 | 0.0 | 29 | 69.2 | 28.2 | 2.6 | 39 |
| L4CH | 38.2 | 54.4 | 7.4 | 68 | 31.0 | 65.5 | 3.4 | 29 | 43.6 | 46.2 | 10.3 | 39 |
| L5CH | 25.0 | 75.0 | 0.0 | 68 | 27.6 | 72.4 | 0.0 | 29 | 23.1 | 76.9 | 0.0 | 39 |
| L6CH | 35.3 | 64.7 | 0.0 | 68 | 51.7 | 48.3 | 0.0 | 29 | 23.1 | 76.9 | 0.0 | 39 |
| L1FC | 54.4 | 45.6 | 0.0 | 68 | 27.6 | 72.4 | 0.0 | 29 | 74.4 | 25.6 | 0.0 | 39 |
| L2FC | 66.2 | 33.8 | 0.0 | 68 | 69.0 | 31.0 | 0.0 | 29 | 64.1 | 35.9 | 0.0 | 39 |
| L3FC | 54.4 | 45.6 | 0.0 | 68 | 48.3 | 51.7 | 0.0 | 29 | 59.0 | 41.0 | 0.0 | 39 |
| L4FC | 41.2 | 58.8 | 0.0 | 68 | 27.6 | 72.4 | 0.0 | 29 | 51.3 | 48.7 | 0.0 | 39 |
| L5FC | 23.5 | 76.5 | 0.0 | 68 | 24.1 | 75.9 | 0.0 | 29 | 23.1 | 76.9 | 0.0 | 39 |
| L6FC | 42.6 | 57.4 | 0.0 | 68 | 55.2 | 44.8 | 0.0 | 29 | 33.3 | 66.7 | 0.0 | 39 |
| L1PL | 52.9 | 47.1 | 0.0 | 68 | 34.5 | 65.5 | 0.0 | 29 | 66.7 | 33.3 | 0.0 | 39 |
| L2PL | 69.1 | 30.9 | 0.0 | 68 | 72.4 | 27.6 | 0.0 | 29 | 66.7 | 33.3 | 0.0 | 39 |
| L3PL | 52.9 | 45.6 | 1.5 | 68 | 37.9 | 58.6 | 3.4 | 29 | 64.1 | 35.9 | 0.0 | 39 |
| L4PL | 45.6 | 52.9 | 1.5 | 68 | 31.0 | 69.0 | 0.0 | 29 | 56.4 | 41.0 | 2.6 | 39 |
| L5PL | 30.9 | 69.1 | 0.0 | 68 | 31.0 | 69.0 | 0.0 | 29 | 30.8 | 69.2 | 0.0 | 39 |
| L6PL | 30.9 | 69.1 | 0.0 | 68 | 44.8 | 55.2 | 0.0 | 29 | 20.5 | 79.5 | 0.0 | 39 |
| L1AB | 48.5 | 51.5 | 0.0 | 68 | 31.0 | 69.0 | 0.0 | 29 | 61.5 | 38.5 | 0.0 | 39 |
| L2AB | 64.7 | 35.3 | 0.0 | 68 | 69.0 | 31.0 | 0.0 | 29 | 61.5 | 38.5 | 0.0 | 39 |
| L3AB | 54.4 | 45.6 | 0.0 | 68 | 37.9 | 62.1 | 0.0 | 29 | 66.7 | 33.3 | 0.0 | 39 |
| L4AB | 42.6 | 52.9 | 4.4 | 68 | 31.0 | 65.5 | 3.4 | 29 | 51.3 | 43.6 | 5.1 | 39 |
| L5AB | 26.5 | 73.5 | 0.0 | 68 | 27.6 | 72.4 | 0.0 | 29 | 25.6 | 74.4 | 0.0 | 39 |
| L6AB | 41.2 | 58.8 | 0.0 | 68 | 62.1 | 37.9 | 0.0 | 29 | 25.6 | 74.4 | 0.0 | 39 |
| H1TG | 72.1 | 27.9 | 0.0 | 68 | 79.3 | 20.7 | 0.0 | 29 | 66.7 | 33.3 | 0.0 | 39 |
| H2TG | 60.3 | 39.7 | 0.0 | 68 | 75.9 | 24.1 | 0.0 | 29 | 48.7 | 51.3 | 0.0 | 39 |
| H3TG | 67.6 | 32.4 | 0.0 | 68 | 72.4 | 27.6 | 0.0 | 29 | 64.1 | 35.9 | 0.0 | 39 |
| H4TG | 69.1 | 30.9 | 0.0 | 68 | 69.0 | 31.0 | 0.0 | 29 | 69.2 | 30.8 | 0.0 | 39 |
| H1CH | 67.6 | 32.4 | 0.0 | 68 | 65.5 | 34.5 | 0.0 | 29 | 69.2 | 30.8 | 0.0 | 39 |
| H2CH | 55.9 | 44.1 | 0.0 | 68 | 65.5 | 34.5 | 0.0 | 29 | 48.7 | 51.3 | 0.0 | 39 |
| H3CH | 44.1 | 55.9 | 0.0 | 68 | 24.1 | 75.9 | 0.0 | 29 | 59.0 | 41.0 | 0.0 | 39 |
| H4CH | 30.9 | 69.1 | 0.0 | 68 | 24.1 | 75.9 | 0.0 | 29 | 35.9 | 64.1 | 0.0 | 39 |
| H1FC | 67.6 | 32.4 | 0.0 | 68 | 72.4 | 27.6 | 0.0 | 29 | 64.1 | 35.9 | 0.0 | 39 |
| H2FC | 38.2 | 61.8 | 0.0 | 68 | 20.7 | 79.3 | 0.0 | 29 | 51.3 | 48.7 | 0.0 | 39 |
| H3FC | 41.2 | 55.9 | 2.9 | 68 | 27.6 | 69.0 | 3.4 | 29 | 51.3 | 46.2 | 2.6 | 39 |
| H4FC | 35.3 | 63.2 | 1.5 | 68 | 17.2 | 82.8 | 0.0 | 29 | 48.7 | 48.7 | 2.6 | 39 |
| H1PL | 64.7 | 35.3 | 0.0 | 68 | 62.1 | 37.9 | 0.0 | 29 | 66.7 | 33.3 | 0.0 | 39 |
| H2PL | 61.8 | 38.2 | 0.0 | 68 | 62.1 | 37.9 | 0.0 | 29 | 61.5 | 38.5 | 0.0 | 39 |
| H3PL | 47.1 | 52.9 | 0.0 | 68 | 31.0 | 69.0 | 0.0 | 29 | 59.0 | 41.0 | 0.0 | 39 |
| H4PL | 35.3 | 64.7 | 0.0 | 68 | 17.2 | 82.8 | 0.0 | 29 | 48.7 | 51.3 | 0.0 | 39 |
| H1A1 | 63.2 | 36.8 | 0.0 | 68 | 65.5 | 34.5 | 0.0 | 29 | 61.5 | 38.5 | 0.0 | 39 |
| H2A1 | 51.5 | 48.5 | 0.0 | 68 | 48.3 | 51.7 | 0.0 | 29 | 53.8 | 46.2 | 0.0 | 39 |
| H3A1 | 48.5 | 51.5 | 0.0 | 68 | 34.5 | 65.5 | 0.0 | 29 | 59.0 | 41.0 | 0.0 | 39 |
| H4A1 | 29.4 | 70.6 | 0.0 | 68 | 17.2 | 82.8 | 0.0 | 29 | 38.5 | 61.5 | 0.0 | 39 |
| H1A2 | 64.7 | 35.3 | 0.0 | 68 | 65.5 | 34.5 | 0.0 | 29 | 64.1 | 35.9 | 0.0 | 39 |
| H2A2 | 64.7 | 35.3 | 0.0 | 68 | 58.6 | 41.4 | 0.0 | 29 | 69.2 | 30.8 | 0.0 | 39 |
| H3A2 | 61.8 | 38.2 | 0.0 | 68 | 51.7 | 48.3 | 0.0 | 29 | 69.2 | 30.8 | 0.0 | 39 |
| H4A2 | 27.9 | 72.1 | 0.0 | 68 | 24.1 | 75.9 | 0.0 | 29 | 30.8 | 69.2 | 0.0 | 39 |
Publisher’s Note: MDPI stays neutral with regard to jurisdictional claims in published maps and institutional affiliations. |
© 2022 by the authors. Licensee MDPI, Basel, Switzerland. This article is an open access article distributed under the terms and conditions of the Creative Commons Attribution (CC BY) license (https://creativecommons.org/licenses/by/4.0/).
Share and Cite
Stănciulescu, L.-A.; Scafa, A.; Duduianu, C.; Stan, R.; Nicolescu, A.; Deleanu, C.; Dorobanțu, M. Lipoprofiling Assessed by NMR Spectroscopy in Patients with Acute Coronary Syndromes: Is There a Need for Fasting Prior to Sampling? Diagnostics 2022, 12, 1675. https://doi.org/10.3390/diagnostics12071675
Stănciulescu L-A, Scafa A, Duduianu C, Stan R, Nicolescu A, Deleanu C, Dorobanțu M. Lipoprofiling Assessed by NMR Spectroscopy in Patients with Acute Coronary Syndromes: Is There a Need for Fasting Prior to Sampling? Diagnostics. 2022; 12(7):1675. https://doi.org/10.3390/diagnostics12071675
Chicago/Turabian StyleStănciulescu, Laura-Adina, Alexandru Scafa, Cătălin Duduianu, Raluca Stan, Alina Nicolescu, Calin Deleanu, and Maria Dorobanțu. 2022. "Lipoprofiling Assessed by NMR Spectroscopy in Patients with Acute Coronary Syndromes: Is There a Need for Fasting Prior to Sampling?" Diagnostics 12, no. 7: 1675. https://doi.org/10.3390/diagnostics12071675