
MCRS1 Expression Regulates Tumor Activity and Affects Survival Probability of Patients with Gastric Cancer

 , ,
, , 
Abstract
:1. Introduction
2. Materials and Methods
2.1. Patient Selection
2.2. Tissue Array
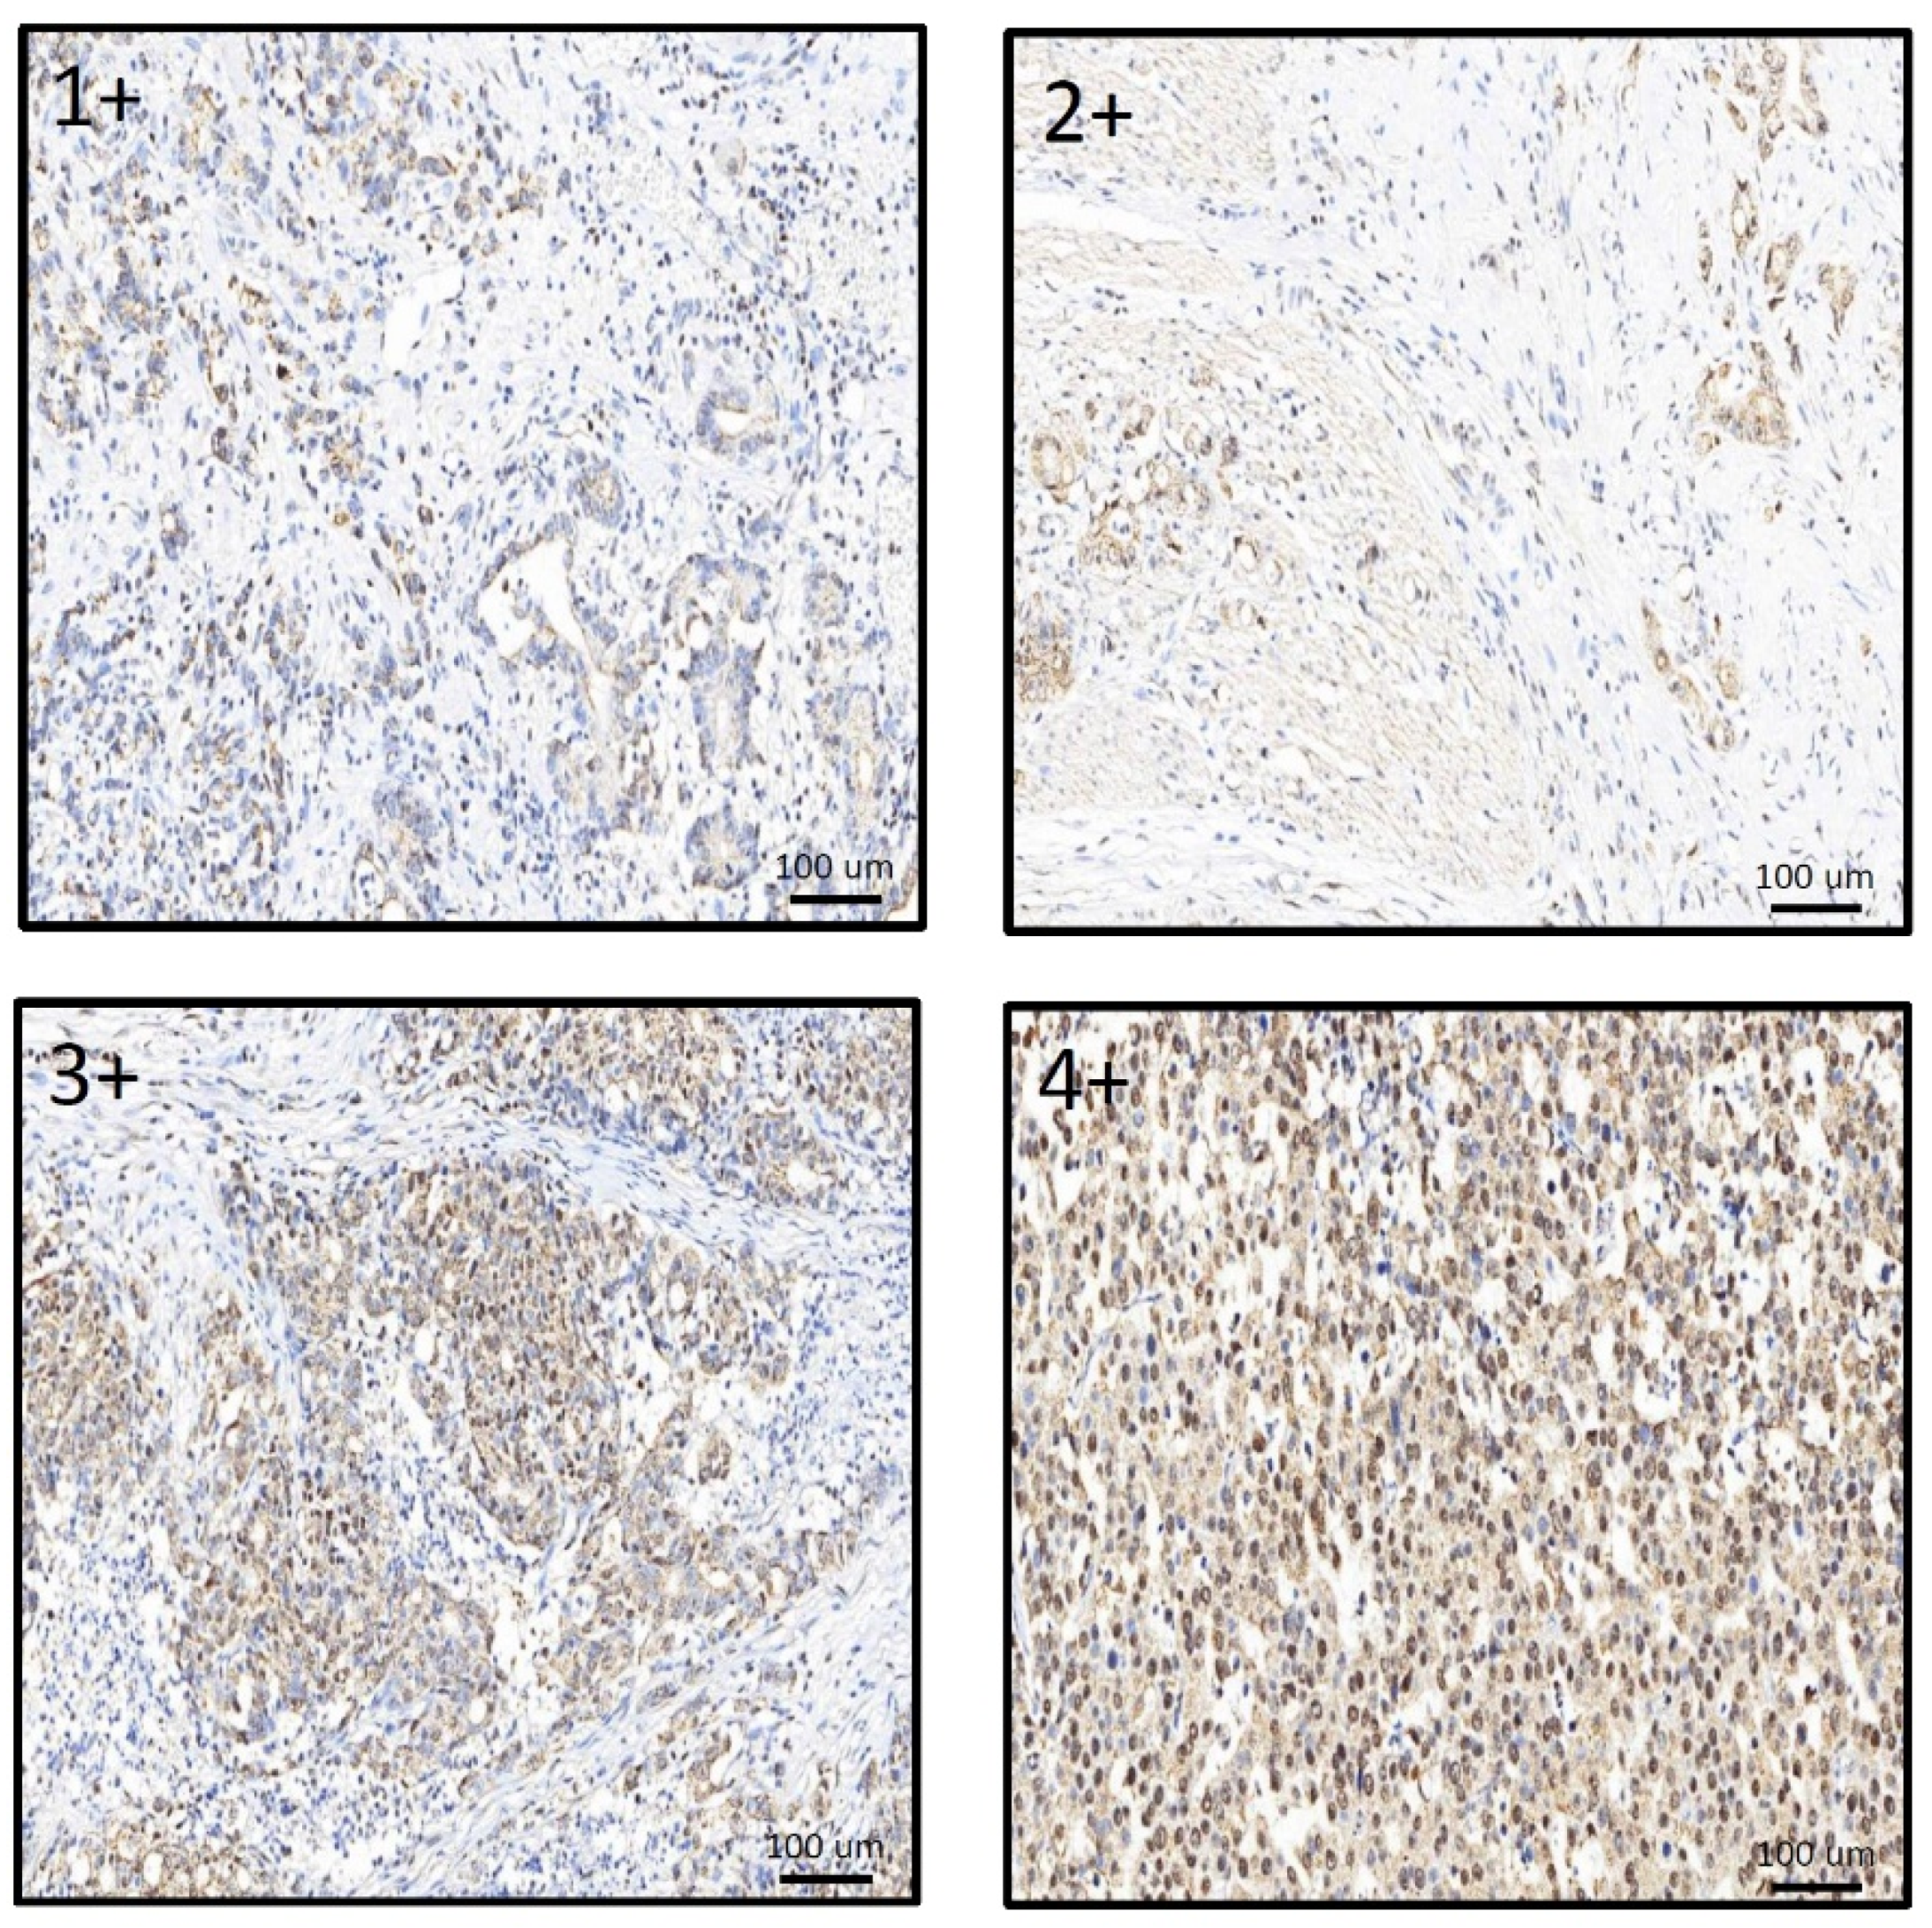
2.3. Immunohistochemical Staining (IHC) and H Score
2.4. Statistical Analysis
3. Results
4. Discussion
Author Contributions
Funding
Institutional Review Board Statement
Informed Consent Statement
Data Availability Statement
Conflicts of Interest
References
- Li, C.M.; Chen, Z. Autoimmunity as an Etiological Factor of Cancer: The Transformative Potential of Chronic Type 2 Inflammation. Front. Cell Dev. Biol. 2021, 9, 664305. [Google Scholar] [CrossRef] [PubMed]
- Bray, F.; Ferlay, J.; Soerjomataram, I.; Siegel, R.L.; Torre, L.A.; Jemal, A. Global cancer statistics 2018: GLOBOCAN estimates of incidence and mortality worldwide for 36 cancers in 185 countries. CA Cancer J. Clin. 2018, 68, 394–424. [Google Scholar] [CrossRef] [PubMed] [Green Version]
- Eusebi, L.H.; Telese, A.; Marasco, G.; Bazzoli, F.; Zagari, R.M. Gastric cancer prevention strategies: A global perspective. J. Gastroenterol. Hepatol. 2020, 35, 1495–1502. [Google Scholar] [CrossRef] [PubMed]
- Rawla, P.; Barsouk, A. Epidemiology of gastric cancer: Global trends, risk factors and prevention. Prz. Gastroenterol. 2019, 14, 26–38. [Google Scholar] [CrossRef]
- Thrift, A.P.; El-Serag, H.B. Burden of Gastric Cancer. Clin. Gastroenterol. Hepatol. 2020, 18, 534–542. [Google Scholar] [CrossRef]
- Society, A.C. Early Detection, Diagnosis, and Staging. Available online: https://www.cancer.org/cancer/stomach-cancer/detection-diagnosis-staging/staging.html (accessed on 20 May 2022).
- Song, Z.; Wu, Y.; Yang, J.; Yang, D.; Fang, X. Progress in the treatment of advanced gastric cancer. Tumour Biol. 2017, 39, 1010428317714626. [Google Scholar] [CrossRef] [Green Version]
- Tan, Z. Recent Advances in the Surgical Treatment of Advanced Gastric Cancer: A Review. Med. Sci. Monit. 2019, 25, 3537–3541. [Google Scholar] [CrossRef]
- Yuan, L.; Xu, Z.Y.; Ruan, S.M.; Mo, S.; Qin, J.J.; Cheng, X.D. Long non-coding RNAs towards precision medicine in gastric cancer: Early diagnosis, treatment, and drug resistance. Mol. Cancer 2020, 19, 96. [Google Scholar] [CrossRef]
- Benavides, M.; Chow-Tsang, L.F.; Zhang, J.; Zhong, H. The novel interaction between microspherule protein Msp58 and ubiquitin E3 ligase EDD regulates cell cycle progression. Biochim. Biophys. Acta 2013, 1833, 21–32. [Google Scholar] [CrossRef] [Green Version]
- Yuan, L.; Xu, Z.Y.; Ruan, S.M.; Mo, S.; Qin, J.J.; Cheng, X.D. MCRS1 is essential for epiblast development during early mouse embryogenesis. Reproduction 2020, 159, 1–13. [Google Scholar] [CrossRef]
- Lin, D.Y.; Shih, H.M. Essential role of the 58-kDa microspherule protein in the modulation of Daxx-dependent transcriptional repression as revealed by nucleolar sequestration. J. Biol. Chem. 2002, 277, 25446–25456. [Google Scholar] [CrossRef] [PubMed] [Green Version]
- Meunier, S.; Vernos, I. K-fibre minus ends are stabilized by a RanGTP-dependent mechanism essential for functional spindle assembly. Nat. Cell Biol. 2011, 13, 1406–1414. [Google Scholar] [CrossRef] [PubMed]
- Lee, S.H.; Lee, M.S.; Choi, T.I.; Hong, H.; Seo, J.Y.; Kim, C.H.; Kim, J. MCRS1 associates with cytoplasmic dynein and mediates pericentrosomal material recruitment. Sci. Rep. 2016, 6, 27284. [Google Scholar] [CrossRef] [PubMed] [Green Version]
- Wang, X.M.; Li, Q.Y.; Ren, L.L.; Liu, Y.M.; Wang, T.S.; Mu, T.C.; Xiao, J.Y. Effects of MCRS1 on proliferation, migration, invasion, and epithelial mesenchymal transition of gastric cancer cells by interacting with Pkmyt1 protein kinase. Cell. Signal. 2019, 59, 171–181. [Google Scholar] [CrossRef]
- Brandt, M.; Grazioso, T.P.; Fawal, M.A.; Tummala, K.S.; Torres-Ruiz, R.; Rodriguez-Perales, S.; Djouder, N. mTORC1 Inactivation Promotes Colitis-Induced Colorectal Cancer but Protects from APC Loss-Dependent Tumorigenesis. Cell Metab. 2018, 27, 118–135.e8. [Google Scholar] [CrossRef] [Green Version]
- Liu, M.; Zhou, K.; Huang, Y.; Cao, Y. The candidate oncogene (MCRS1) promotes the growth of human lung cancer cells via the miR-155-Rb1 pathway. J. Exp. Clin. Cancer Res. 2015, 34, 121. [Google Scholar] [CrossRef] [Green Version]
- Peng, J.; Ma, J.; Li, W.; Mo, R.; Zhang, P.; Gao, K.; Fan, J. Stabilization of MCRS1 by BAP1 prevents chromosome instability in renal cell carcinoma. Cancer Lett. 2015, 369, 167–174. [Google Scholar] [CrossRef]
- Wang, H.; Ou, J.; Jian, Z.; Ou, Y. miR-186 modulates hepatocellular carcinoma cell proliferation and mobility via targeting MCRS1-mediated Wnt/beta-catenin signaling. J. Cell Physiol. 2019, 234, 23135–23145. [Google Scholar] [CrossRef]
- Wu, L.; Zhang, Z.G.; Qin, H.Z.; Zhang, J.; Gao, G.D.; Lin, W.; Zhang, J. Downregulation of MSP58 suppresses cell proliferation in neuroblastoma cell lines. Neuroreport 2012, 23, 932–936. [Google Scholar] [CrossRef]
- Cui, J.; Xi, H.; Cai, A.; Ma, L.; Bian, S.; Zhang, K.; Chen, L. Increased Expression of 58-kDa Microspherule Protein (MSP58) in Human Gastric Cancer Promotes Cell Proliferation and Correlates with Poor Patient Survival. Clin. Lab. 2016, 62, 993–1001. [Google Scholar] [CrossRef]
- Li, C.; Chen, M.; Zhao, P.; Ayana, D.A.; Wang, L.; Jiang, Y. Expression of MCRS1 and MCRS2 and their correlation with serum carcinoembryonic antigen in colorectal cancer. Exp. Ther. Med. 2016, 12, 589–596. [Google Scholar] [CrossRef] [PubMed] [Green Version]
- Liu, M.X.; Zhou, K.C.; Cao, Y. MCRS1 overexpression, which is specifically inhibited by miR-129*, promotes the epithelial-mesenchymal transition and metastasis in non-small cell lung cancer. Mol. Cancer 2014, 13, 245. [Google Scholar] [CrossRef] [PubMed] [Green Version]
- Zhai, X.; Wu, Y.; Zhang, D.; Chong, T.; Zhao, J. Knockdown of MSP58 inhibits the proliferation and metastasis in human renal cell carcinoma cells. Biomed. Pharmacother. 2017, 91, 54–59. [Google Scholar] [CrossRef] [PubMed]
- Zhong, M.; Zhang, X.; Li, B.; Chen, C.S.; Ji, G.L.; Li, S.X.; Shi, H. Expression of MSP58 in hepatocellular carcinoma. Med. Oncol. 2013, 30, 539. [Google Scholar] [CrossRef] [PubMed]
- Lin, W.; Dai, S.H.; Chen, T.; Kawai, N.; Miyake, K.; Okada, M.; Fei, Z. Expression of 58-kD Microspherule Protein (MSP58) is Highly Correlated with PET Imaging of Tumor Malignancy and Cell Proliferation in Glioma Patients. Cell. Physiol. Biochem. 2016, 38, 635–645. [Google Scholar] [CrossRef]
- Menon, S.S.; Guruvayoorappan, C.; Sakthivel, K.M.; Rasmi, R.R. Ki-67 protein as a tumour proliferation marker. Clin. Chim. Acta 2019, 491, 39–45. [Google Scholar] [CrossRef]
- Booth, D.G.; Earnshaw, W.C. Ki-67 and the Chromosome Periphery Compartment in Mitosis. Trends Cell Biol. 2017, 27, 906–916. [Google Scholar] [CrossRef] [Green Version]
- Schlüter, C.; Duchrow, M.; Wohlenberg, C.; Becker, M.H.; Key, G.; Flad, H.D.; Gerdes, J. The cell proliferation-associated antigen of antibody Ki-67: A very large, ubiquitous nuclear protein with numerous repeated elements, representing a new kind of cell cycle-maintaining proteins. J. Cell Biol. 1993, 123, 513–522. [Google Scholar] [CrossRef]
- Sun, X.; Kaufman, P.D. Ki-67: More than a proliferation marker. Chromosoma 2018, 127, 175–186. [Google Scholar] [CrossRef]
- Gerdes, J.; Lemke, H.; Baisch, H.; Wacker, H.H.; Schwab, U.; Stein, H. Cell cycle analysis of a cell proliferation-associated human nuclear antigen defined by the monoclonal antibody Ki-67. J. Immunol. 1984, 133, 1710–1715. [Google Scholar]
- Jonat, W.; Arnold, N. Is the Ki-67 labelling index ready for clinical use? Ann. Oncol. 2011, 22, 500–502. [Google Scholar] [CrossRef] [PubMed]
- Hernandez, A.R.; Klein, A.M.; Kirschner, M.W. Kinetic responses of beta-catenin specify the sites of Wnt control. Science 2012, 338, 1337–1340. [Google Scholar] [CrossRef] [PubMed]
- Li, V.S.; Ng, S.S.; Boersema, P.J.; Low, T.Y.; Karthaus, W.R.; Gerlach, J.P.; Clevers, H. Wnt signaling through inhibition of beta-catenin degradation in an intact Axin1 complex. Cell 2012, 149, 1245–1256. [Google Scholar] [CrossRef] [Green Version]
- Lin, T.C.; Su, C.Y.; Wu, P.Y.; Lai, T.C.; Pan, W.A.; Jan, Y.H.; Hsiao, M. The nucleolar protein NIFK promotes cancer progression via CK1alpha/beta-catenin in metastasis and Ki-67-dependent cell proliferation. eLife 2016, 5, e11288. [Google Scholar] [CrossRef] [PubMed]
- Pan, W.A.; Tsai, H.Y.; Wang, S.C.; Hsiao, M.; Wu, P.Y.; Tsai, M.D. The RNA recognition motif of NIFK is required for rRNA maturation during cell cycle progression. RNA Biol. 2015, 12, 255–267. [Google Scholar] [CrossRef] [Green Version]
- Liang, Y.; Liu, M.; Wang, P.; Ding, X.; Cao, Y. Analysis of 20 genes at chromosome band 12q13: RACGAP1 and MCRS1 overexpression in nonsmall-cell lung cancer. Genes Chromosomes Cancer 2013, 52, 305–315. [Google Scholar] [CrossRef]
- Lin, W.; Zhang, J.; Zhang, J.; Liu, X.; Fei, Z.; Li, X.; Yao, L. RNAi-mediated inhibition of MSP58 decreases tumour growth, migration and invasion in a human glioma cell line. J. Cell. Mol. Med. 2009, 13, 4608–4622. [Google Scholar] [CrossRef] [Green Version]
- Yang, N.; Gilman, P.; Mirzayans, R.; Sun, X.; Touret, N.; Weinfeld, M.; Goping, I.S. Characterization of the apoptotic response induced by the cyanine dye D112: A potentially selective anti-cancer compound. PLoS ONE 2015, 10, e0125381. [Google Scholar] [CrossRef] [Green Version]
- Khalil, H.; Peltzer, N.; Walicki, J.; Yang, J.Y.; Dubuis, G.; Gardiol, N.; Widmann, C. Caspase-3 protects stressed organs against cell death. Mol. Cell. Biol. 2012, 32, 4523–4533. [Google Scholar] [CrossRef] [Green Version]
- Koff, J.L.; Ramachandiran, S.; Bernal-Mizrachi, L. A time to kill: Targeting apoptosis in cancer. Int. J. Mol. Sci. 2015, 16, 2942–2955. [Google Scholar] [CrossRef] [Green Version]
- Huang, Q.; Li, F.; Liu, X.; Li, W.; Shi, W.; Liu, F.F.; Li, C.Y. Caspase 3-mediated stimulation of tumor cell repopulation during cancer radiotherapy. Nat. Med. 2011, 17, 860–866. [Google Scholar] [CrossRef]
- Mirzayans, R.; Andrais, B.; Scott, A.; Wang, Y.W.; Murray, D. Ionizing radiation-induced responses in human cells with differing TP53 status. Int. J. Mol. Sci. 2013, 14, 22409–22435. [Google Scholar] [CrossRef] [PubMed] [Green Version]
- Mirzayans, R.; Andrais, B.; Scott, A.; Murray, D. New insights into p53 signaling and cancer cell response to DNA damage: Implications for cancer therapy. J. Biomed. Biotechnol. 2012, 2012, 170325. [Google Scholar] [CrossRef] [PubMed] [Green Version]
- Chen, H.; Yang, X.; Feng, Z.; Tang, R.; Ren, F.; Wei, K.; Chen, G. Prognostic value of Caspase-3 expression in cancers of digestive tract: A meta-analysis and systematic review. Int. J. Clin. Exp. Med. 2015, 8, 10225–10234. [Google Scholar] [PubMed]
- Newman, P.J.; Berndt, M.C.; Gorski, J.; White, G.C.; Lyman, S.; Paddock, C.; Muller, W.A. PECAM-1 (CD31) cloning and relation to adhesion molecules of the immunoglobulin gene superfamily. Science 1990, 247, 1219–1222. [Google Scholar] [CrossRef] [PubMed]
- Zhang, Y.Y.; Kong, L.Q.; Zhu, X.D.; Cai, H.; Wang, C.H.; Shi, W.K.; Sun, H.C. CD31 regulates metastasis by inducing epithelial-mesenchymal transition in hepatocellular carcinoma via the ITGB1-FAK-Akt signaling pathway. Cancer Lett. 2018, 429, 29–40. [Google Scholar] [CrossRef]
- Li, Y.; Guo, X.B.; Wei, Y.H.; Kang, X.L. Serum CXCL13 and PECAM-1 can be used as diagnostic and prognostic markers in elderly patients with gastric cancer. Clin. Transl. Oncol. 2021, 23, 130–138. [Google Scholar] [CrossRef]
- Lertkiatmongkol, P.; Liao, D.; Mei, H.; Hu, Y.; Newman, P.J. Endothelial functions of platelet/endothelial cell adhesion molecule-1 (CD31). Curr. Opin. Hematol. 2016, 23, 253–259. [Google Scholar] [CrossRef] [Green Version]
- Yang, S.; Graham, J.; Kahn, J.W.; Schwartz, E.A.; Gerritsen, M.E. Functional roles for PECAM-1 (CD31) and VE-cadherin (CD144) in tube assembly and lumen formation in three-dimensional collagen gels. Am. J. Pathol. 1999, 155, 887–895. [Google Scholar] [CrossRef] [Green Version]
- Cao, G.; Fehrenbach, M.L.; Williams, J.T.; Finklestein, J.M.; Zhu, J.X.; Delisser, H.M. Angiogenesis in platelet endothelial cell adhesion molecule-1-null mice. Am. J. Pathol. 2009, 175, 903–915. [Google Scholar] [CrossRef] [Green Version]
- O’Brien, C.D.; Cao, G.; Makrigiannakis, A.; DeLisser, H.M. Role of immunoreceptor tyrosine-based inhibitory motifs of PECAM-1 in PECAM-1-dependent cell migration. Am. J. Physiol. Cell Physiol. 2004, 287, C1103–C1113. [Google Scholar] [CrossRef] [PubMed]
- Noble, K.E.; Wickremasinghe, R.G.; DeCornet, C.; Panayiotidis, P.; Yong, K.L. Monocytes stimulate expression of the Bcl-2 family member, A1, in endothelial cells and confer protection against apoptosis. J. Immunol. 1999, 162, 1376–1383. [Google Scholar] [PubMed]
- Gao, C.; Sun, W.; Christofidou-Solomidou, M.; Sawada, M.; Newman, D.K.; Bergom, C.; Newman, P.J. PECAM-1 functions as a specific and potent inhibitor of mitochondrial-dependent apoptosis. Blood 2003, 102, 169–179. [Google Scholar] [CrossRef] [PubMed]
- Torres-Cabala, C.; Li-Ning-Tapia, E.; Hwu, W.J. Pathology-based Biomarkers Useful for Clinical Decisions in Melanoma. Arch. Med. Res. 2020, 51, 827–838. [Google Scholar] [CrossRef] [PubMed]
- Mohamed, S.Y.; Mohammed, H.L.; Ibrahim, H.M.; Mohamed, E.M.; Salah, M. Role of VEGF, CD105, and CD31 in the Prognosis of Colorectal Cancer Cases. J. Gastrointest. Cancer 2019, 50, 23–34. [Google Scholar] [CrossRef] [PubMed]
- Vockova, P.; Molinsky, J.; Klanova, M.; Karban, J.; Spacek, M.; Havranek, O.; Klener, P. CD31/PECAM-1 impacts engraftment, growth and spread of mantle cell lymphoma cells and positively correlates with extramedullary involvement. Leuk. Lymphoma 2021, 62, 861–867. [Google Scholar] [CrossRef]
- Virman, J.; Bono, P.; Luukkaala, T.; Sunela, K.; Kujala, P.; Kellokumpu-Lehtinen, P.L. VEGFR3 and CD31 as prognostic factors in renal cell cancer. Anticancer Res. 2015, 35, 921–927. [Google Scholar]
- Dongre, A.; Weinberg, R.A. New insights into the mechanisms of epithelial-mesenchymal transition and implications for cancer. Nat. Rev. Mol. Cell Biol. 2019, 20, 69–84. [Google Scholar] [CrossRef]
- Nieto, M.A.; Huang, R.Y.; Jackson, R.A.; Thiery, J.P. Emt: 2016. Cell 2016, 166, 21–45. [Google Scholar] [CrossRef] [Green Version]
- Lambert, A.W.; Pattabiraman, D.R.; Weinberg, R.A. Emerging Biological Principles of Metastasis. Cell 2017, 168, 670–691. [Google Scholar] [CrossRef] [Green Version]
- Shibue, T.; Weinberg, R.A. EMT, CSCs, and drug resistance: The mechanistic link and clinical implications. Nat. Rev. Clin. Oncol. 2017, 14, 611–629. [Google Scholar] [CrossRef] [PubMed] [Green Version]
- Francou, A.; Anderson, K.V. The Epithelial-to-Mesenchymal Transition (EMT) in Development and Cancer. Annu. Rev. Cancer Biol. 2020, 4, 197–220. [Google Scholar] [CrossRef] [PubMed] [Green Version]
- White, E.S.; Muro, A.F. Fibronectin splice variants: Understanding their multiple roles in health and disease using engineered mouse models. IUBMB Life 2011, 63, 538–546. [Google Scholar] [CrossRef]
- Zeng, Z.Z.; Jia, Y.; Hahn, N.J.; Markwart, S.M.; Rockwood, K.F.; Livant, D.L. Role of focal adhesion kinase and phosphatidylinositol 3′-kinase in integrin fibronectin receptor-mediated, matrix metalloproteinase-1-dependent invasion by metastatic prostate cancer cells. Cancer Res. 2006, 66, 8091–8099. [Google Scholar] [CrossRef] [Green Version]
- Meng, X.N.; Jin, Y.; Yu, Y.; Bai, J.; Liu, G.Y.; Zhu, J.; Fu, S.B. Characterisation of fibronectin-mediated FAK signalling pathways in lung cancer cell migration and invasion. Br. J. Cancer 2009, 101, 327–334. [Google Scholar] [CrossRef] [Green Version]
- Mitra, A.K.; Sawada, K.; Tiwari, P.; Mui, K.; Gwin, K.; Lengyel, E. Ligand-independent activation of c-Met by fibronectin and alpha(5)beta(1)-integrin regulates ovarian cancer invasion and metastasis. Oncogene 2011, 30, 1566–1576. [Google Scholar] [CrossRef] [PubMed] [Green Version]
- Han, S.W.; Roman, J. Fibronectin induces cell proliferation and inhibits apoptosis in human bronchial epithelial cells: Pro-oncogenic effects mediated by PI3-kinase and NF-kappa B. Oncogene 2006, 25, 4341–4349. [Google Scholar] [CrossRef] [Green Version]
- Ghura, H.; Keimer, M.; von Au, A.; Hackl, N.; Klemis, V.; Nakchbandi, I.A. Inhibition of fibronectin accumulation suppresses tumor growth. Neoplasia 2021, 23, 837–850. [Google Scholar] [CrossRef]
- Sun, M.; Xie, J.; Zhang, D.; Chen, C.; Lin, S.; Chen, Y.; Zhang, G. B7-H3 inhibits apoptosis of gastric cancer cell by interacting with Fibronectin. J. Cancer 2021, 12, 7518–7526. [Google Scholar] [CrossRef]
- Wang, X.; Tan, M.; Huang, H.; Zou, Y.; Wang, M. Hsa_circ_0000285 contributes to gastric cancer progression by upregulating FN1 through the inhibition of miR-1278. J. Clin. Lab. Anal. 2022, 36, e24475. [Google Scholar] [CrossRef]
- Morita, Y.; Hata, K.; Nakanishi, M.; Omata, T.; Morita, N.; Yura, Y.; Yoneda, T. Cellular fibronectin 1 promotes VEGF-C expression, lymphangiogenesis and lymph node metastasis associated with human oral squamous cell carcinoma. Clin. Exp. Metastasis 2015, 32, 739–753. [Google Scholar] [CrossRef] [PubMed]
- Liao, Y.X.; Zhang, Z.P.; Zhao, J.; Liu, J.P. Effects of Fibronectin 1 on Cell Proliferation, Senescence and Apoptosis of Human Glioma Cells Through the PI3K/AKT Signaling Pathway. Cell Physiol. Biochem. 2018, 48, 1382–1396. [Google Scholar] [CrossRef] [PubMed]
- Jagadeeshan, S.; Krishnamoorthy, Y.R.; Singhal, M.; Subramanian, A.; Mavuluri, J.; Lakshmi, A.; Rayala, S.K. Transcriptional regulation of fibronectin by p21-activated kinase-1 modulates pancreatic tumorigenesis. Oncogene 2015, 34, 455–464. [Google Scholar] [CrossRef] [PubMed]
- Jia, X.; Wen, Z.; Sun, Q.; Zhao, X.; Yang, H.; Shi, X.; Xin, T. Apatinib suppresses the Proliferation and Apoptosis of Gastric Cancer Cells via the PI3K/Akt Signaling Pathway. J. Buon 2019, 24, 1985–1991. [Google Scholar]
- Zhang, Q.; Wang, X.; Cao, S.; Sun, Y.; He, X.; Jiang, B.; Kang, N. Berberine represses human gastric cancer cell growth in vitro and in vivo by inducing cytostatic autophagy via inhibition of MAPK/mTOR/p70S6K and Akt signaling pathways. Biomed. Pharmacother. 2020, 128, 110245. [Google Scholar] [CrossRef]
- Zhao, S.; Shao, L.; Wang, Y.; Meng, Q.; Yu, J. Ketamine exhibits anti-gastric cancer activity via induction of apoptosis and attenuation of PI3K/Akt/mTOR. Arch. Med. Sci. 2020, 16, 1140–1149. [Google Scholar] [CrossRef]
- Xu, X.; Liu, X.; Zhang, Y. Osthole inhibits gastric cancer cell proliferation through regulation of PI3K/AKT. PLoS ONE 2018, 13, e0193449. [Google Scholar] [CrossRef]
- Wu, Y.; Qi, Y.; Liu, H.; Wang, X.; Zhu, H.; Wang, Z. AMPK activator AICAR promotes 5-FU-induced apoptosis in gastric cancer cells. Mol. Cell. Biochem. 2016, 411, 299–305. [Google Scholar] [CrossRef]
- Song, J.; Chen, Y.; He, D.; Tan, W.; Lv, F.; Liang, B.; Li, J. Astragalus Polysaccharide Promotes Adriamycin-Induced Apoptosis in Gastric Cancer Cells. Cancer Manag. Res. 2020, 12, 2405–2414. [Google Scholar] [CrossRef] [Green Version]
- Gao, M.; Dang, F.; Deng, C. beta-Cryptoxanthin induced anti-proliferation and apoptosis by G0/G1 arrest and AMPK signal inactivation in gastric cancer. Eur. J. Pharmacol. 2019, 859, 172528. [Google Scholar] [CrossRef]
- Kim, J.G.; Lee, S.J.; Chae, Y.S.; Kang, B.W.; Lee, Y.J.; Oh, S.Y.; Kim, S.J. Association between phosphorylated AMP-activated protein kinase and MAPK3/1 expression and prognosis for patients with gastric cancer. Oncology 2013, 85, 78–85. [Google Scholar] [CrossRef] [PubMed]
- Kang, B.W.; Jeong, J.Y.; Chae, Y.S.; Lee, S.J.; Lee, Y.J.; Choi, J.Y.; Kim, J.G. Phosphorylated AMP-activated protein kinase expression associated with prognosis for patients with gastric cancer treated with cisplatin-based adjuvant chemotherapy. Cancer Chemother. Pharmacol. 2012, 70, 735–741. [Google Scholar] [CrossRef] [PubMed]
- Rubinfeld, H.; Seger, R. The ERK cascade: A prototype of MAPK signaling. Mol. Biotechnol. 2005, 31, 151–174. [Google Scholar] [CrossRef]
- Baek, J.H.; Jang, J.E.; Kang, C.M.; Chung, H.Y.; Kim, N.D.; Kim, K.W. Hypoxia-induced VEGF enhances tumor survivability via suppression of serum deprivation-induced apoptosis. Oncogene 2000, 19, 4621–4631. [Google Scholar] [CrossRef] [Green Version]
- Huang, Y.; Zou, Y.; Lin, L.; Ma, X.; Zheng, R. miR101 regulates the cell proliferation and apoptosis in diffuse large Bcell lymphoma by targeting MEK1 via regulation of the ERK/MAPK signaling pathway. Oncol. Rep. 2019, 41, 377–386. [Google Scholar] [CrossRef] [PubMed]
- Gavrish, A.S.; Kononchuk, N.A. The structural-metabolic damages to the myocardium in acute coronary failure. Likars’ Ka sprava 1998, 41–47. [Google Scholar]
- Lefloch, R.; Pouyssegur, J.; Lenormand, P. Total ERK1/2 activity regulates cell proliferation. Cell Cycle 2009, 8, 705–711. [Google Scholar] [CrossRef] [Green Version]
- Liu, F.; An, X.; Zhao, X.; Zhang, N.; Chen, B.; Li, Z.; Xu, W. MiR-10b-5p inhibits tumorigenesis in gastric cancer xenograft mice model through down-regulating Tiam1. Exp. Cell Res. 2021, 407, 112810. [Google Scholar] [CrossRef]
- Liu, J.; Knani, I.; Gross-Cohen, M.; Hu, J.; Wang, S.; Tang, L.; Vlodavsky, I. Role of heparanase 2 (Hpa2) in gastric cancer. Neoplasia 2021, 23, 966–978. [Google Scholar] [CrossRef]
- Li, L.B.; Fang, T.Y.; Xu, W.J. Oral glutamine inhibits tumor growth of gastric cancer bearing mice by improving immune function and activating apoptosis pathway. Tissue Cell 2021, 71, 101508. [Google Scholar] [CrossRef]
- Chang, H.-P.; Sun, J.-T.; Cheng, C.-Y.; Liang, Y.-J.; Chen, Y.-L. High Mobility Group A 1 Expression as a Poor Prognostic Marker Associated with Tumor Invasiveness in Gastric Cancer. Life 2022, 12, 709. [Google Scholar] [CrossRef] [PubMed]


| Antibody | Brands | Catalog Number | Proportion |
|---|---|---|---|
| MCRS1 | Sigma-Aldrich | HPA039057 | 1:400 |
| Ki-67 | BioLegend | 350503 | 1:100 |
| Caspase3 | Cell Signaling | 9664 | 1:100 |
| CD31 | Abbiotec | 250590 | 1:500 |
| E-cadherin | Abcam | ab40772 | 1:100 |
| N-cadherin | Abcam | ab76011 | 1:100 |
| Fibronectin | Santa Cruz | SC-8422 | 1:50 |
| pAKT | GeneTex | GTX11901 | 1:50 |
| pERK | R&D | AF1018 | 1:200 |
| pSTAT3 | Abcam | ab76315 | 1:50 |
| pAMPK | Cell signal | 2535 | 1:100 |
| Low MCRS1 Expression | High MCRS1 Expression | Total | p-Value | ||
|---|---|---|---|---|---|
| Age (years) | <65 | 45 (90.0%) | 5 (10.0%) | 50 (27.6%) | 0.586 |
| ≥65 | 114 (87.0%) | 17 (17.0%) | 131 (72.4%) | ||
| Gender | Female | 106 (86.9%) | 16 (13.1%) | 122 (67.4%) | 0.572 |
| Male | 53 (89.8%) | 6 (10.2%) | 59 (32.6%) | ||
| Differentiation | Well | 48 (92.3%) | 4 (7.7%) | 52 (28.7%) | 0.586 |
| Moderate | 111 (86.0%) | 18 (14.0%) | 129 (71.3%) | ||
| Stage | I and II | 67 (90.5%) | 7 (9.5%) | 74 (40.9%) | 0.352 |
| III and IV | 92 (86.0%) | 15 (14.0%) | 107 (59.1%) |
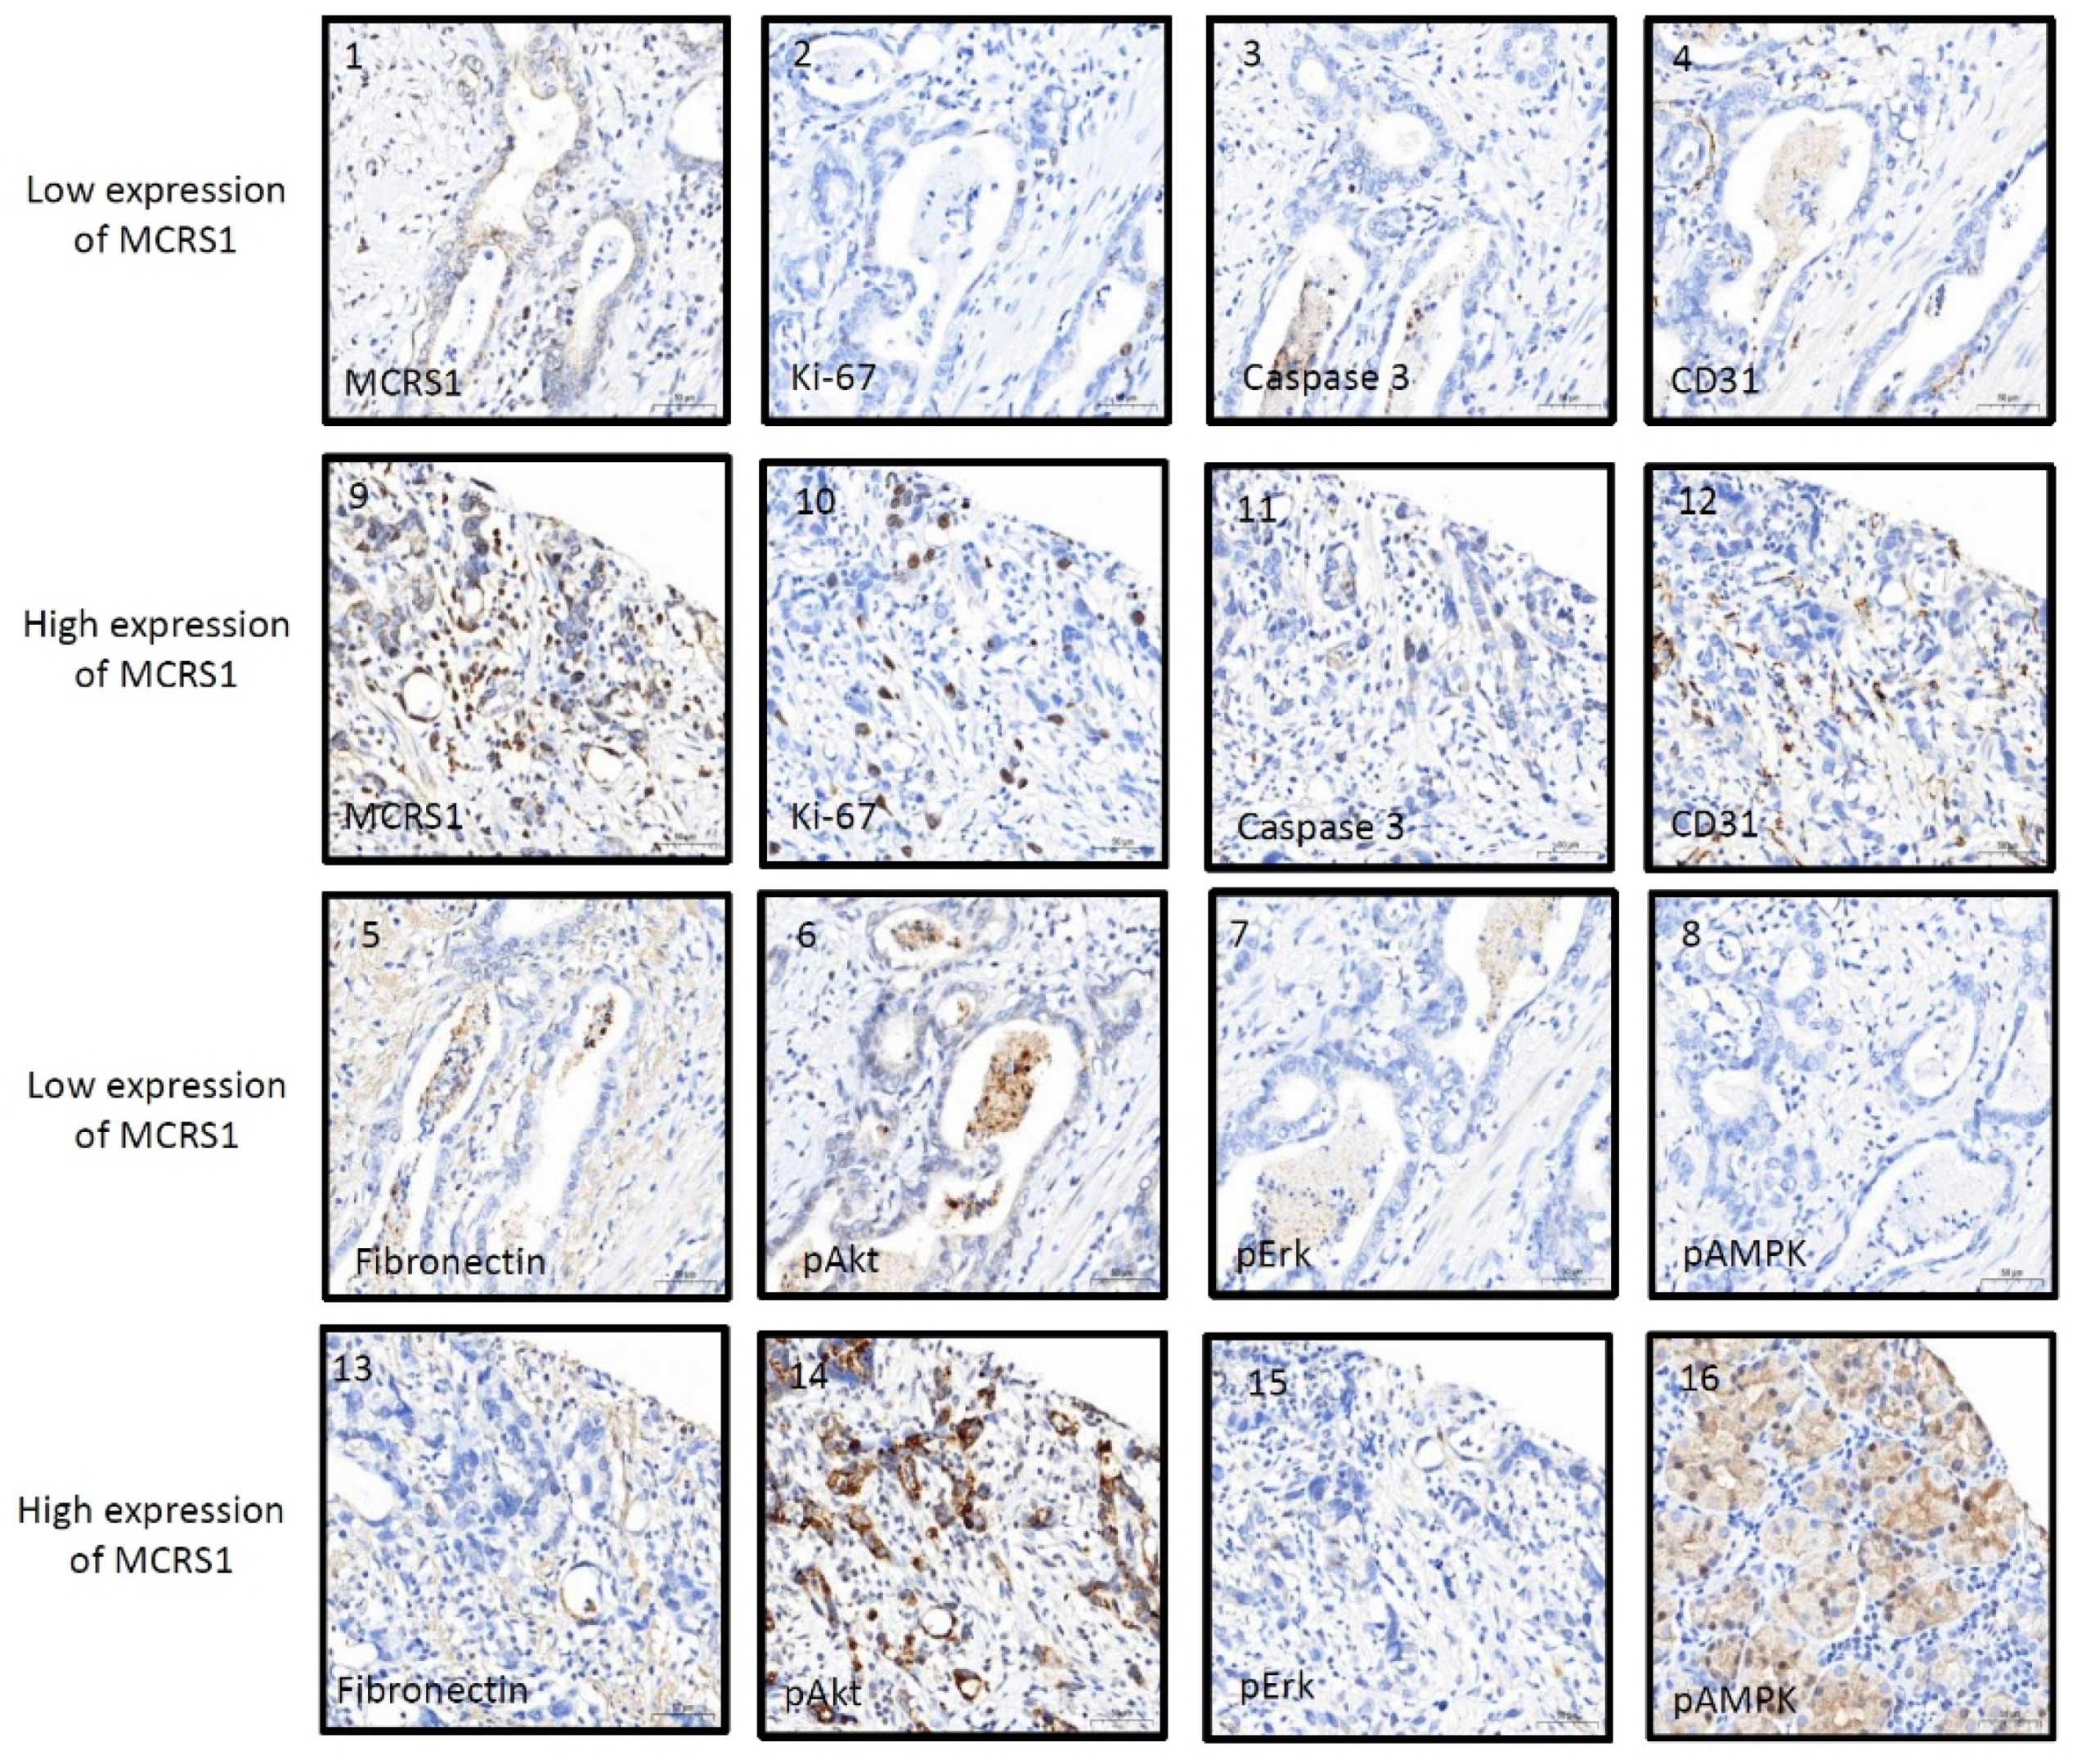
| Biomarkers | MCRS1 Low Expression | MCRS1 High Expression | R | p-Value |
|---|---|---|---|---|
| Ki-67 | 22.88 (31.08) | 39.29 (55.32) | 0.439 | <0.001 *** |
| Caspase3 | 6.18 (3.55) | 9.37 (4.70) | 0.270 | <0.001 *** |
| CD31 | 25.63 (21.26) | 24.34 (18.49) | 0.271 | <0.001 *** |
| Fibronectin | 59.73 (98.11) | 33.70 (46.6) | −0.187 | 0.001 ** |
| pAkt | 17.87 (25.43) | 14.97 (12.30) | 0.281 | <0.001 *** |
| pErk | 9.02 (3.21) | 11.34 (0.82) | −0.121 | 0.029 * |
| pSTAT3 | 2.80 (0.83) | 5.59 (0.16) | 0.051 | 0.358 |
| pAMPK | 4.89 (3.42) | 10.42 (5.96) | 0.182 | 0.001 ** |
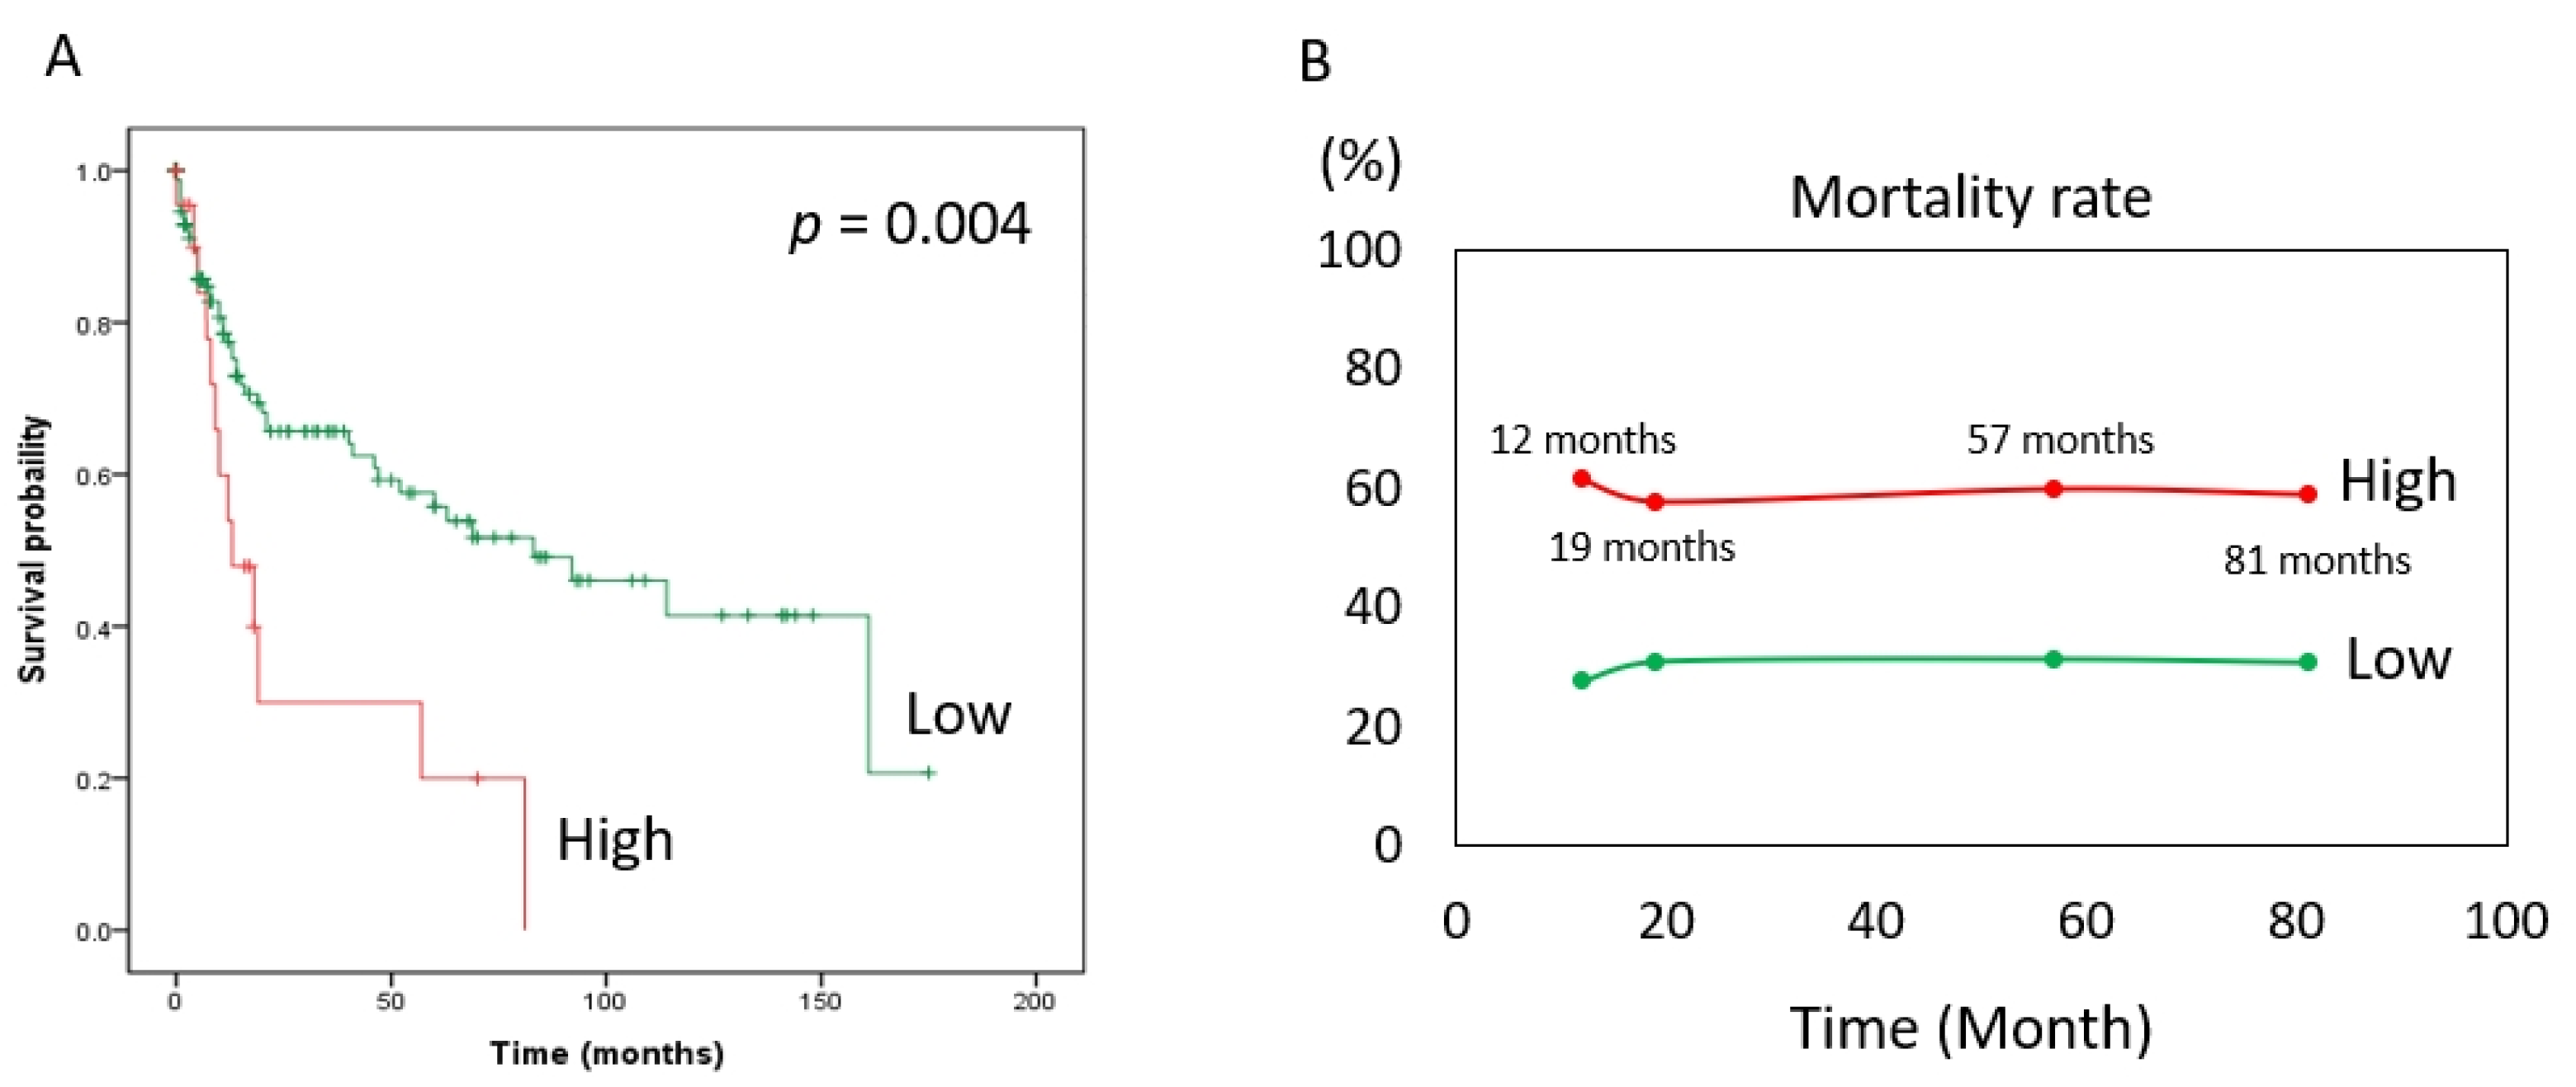
| Hazard Ratio (95% CI) | p-Value | ||
|---|---|---|---|
| MCRS1 expression | Low | Reference | 0.005 ** |
| High | 2.44 (1.31–4.57) | ||
| Age (years) | <65 | Reference | 0.184 |
| ≥65 | 0.70 (0.41–1.18) | ||
| Gender | Female | Reference | 0.311 |
| Male | 0.74 (0.42–1.32) | ||
| Differentiation | Moderate | Reference | 0.079 |
| Well | 1.74 (0.94–3.34) | ||
| Stage | I and II | Reference | 0.001 ** |
| III and IV | 2.50 (1.44–4.35) |
Publisher’s Note: MDPI stays neutral with regard to jurisdictional claims in published maps and institutional affiliations. |
© 2022 by the authors. Licensee MDPI, Basel, Switzerland. This article is an open access article distributed under the terms and conditions of the Creative Commons Attribution (CC BY) license (https://creativecommons.org/licenses/by/4.0/).
Share and Cite
Wang, L.-H.; Chang, C.-C.; Cheng, C.-Y.; Liang, Y.-J.; Pei, D.; Sun, J.-T.; Chen, Y.-L. MCRS1 Expression Regulates Tumor Activity and Affects Survival Probability of Patients with Gastric Cancer. Diagnostics 2022, 12, 1502. https://doi.org/10.3390/diagnostics12061502
Wang L-H, Chang C-C, Cheng C-Y, Liang Y-J, Pei D, Sun J-T, Chen Y-L. MCRS1 Expression Regulates Tumor Activity and Affects Survival Probability of Patients with Gastric Cancer. Diagnostics. 2022; 12(6):1502. https://doi.org/10.3390/diagnostics12061502
Chicago/Turabian StyleWang, Liang-Han, Chih-Chun Chang, Chiao-Yin Cheng, Yao-Jen Liang, Dee Pei, Jen-Tang Sun, and Yen-Lin Chen. 2022. "MCRS1 Expression Regulates Tumor Activity and Affects Survival Probability of Patients with Gastric Cancer" Diagnostics 12, no. 6: 1502. https://doi.org/10.3390/diagnostics12061502