1. Introduction
Retinitis pigmentosa (RP) comprises a broad and heterogeneous group of inherited retinal dystrophies, characterized by the progressive deterioration of the photoreceptor cells and retinal pigment epithelium, which can lead to severe visual impairment [
1]. The estimated prevalence of RP is 1 in 3000–5000 individuals [
2].
RP typically manifests with nyctalopia during adolescence, followed by a concentric visual field constriction, reflecting the principal dysfunction of rod photoreceptors; central vision loss occurs later in life due to secondary degeneration of the cones [
1,
3]. The typical fundoscopic findings include mid-peripheral, bone spicule-like, pigment deposits, waxy pallor of the optic nerve head, and vascular attenuation. An electroretinogram shows a photoreceptor function markedly reduced or even absent. Optical coherence tomography (OCT) and fundus autofluorescence imaging show a progressive loss of outer retinal layers and altered lipofuscin distribution with characteristic patterns.
A precise evaluation of vascular changes in RP patients may be very useful for research and clinical purposes, in order to obtain a better comprehension of the disease physiopathology; for early diagnosis; progression monitoring; selection of patients for clinical trials; and evaluation of the possible response to innovative treatments. In particular, optical coherence tomography angiography (OCTA), a non-invasive and rapid imaging method that allows the visualization and quantification of retinal and choroidal circulation, has been recently employed in different studies to assess the microvascular changes in RP, demonstrating to be an objective, repeatable, and reliable method [
4,
5,
6,
7,
8,
9,
10,
11,
12,
13,
14].
In the present research, we evaluated with OCTA the quantitative changes in chorioretinal vasculature in a group of RP patients regularly followed at the Eye Clinic of the Careggi University Hospital in Florence.
2. Materials and Methods
We performed an observational retrospective cross-sectional study. The study was conducted on 26 unrelated patients affected by RP, recruited through the Hereditary Retinal Degenerations Referring Center of the Eye Clinic, Careggi University Hospital, in Florence (Italy) between March 2016 and April 2017, and a control group of 19 healthy subjects. The study adhered to the tenets of the Declaration of Helsinki, and was approved by the Institutional Review Board of Careggi University Hospital. All patients signed a written informed consent, agreeing to participate.
Inclusion criteria were the diagnosis of RP, along with clear media to allow adequate OCTA-examination. Criteria for the RP phenotype included the following: (1) history of nyctalopia; (2) peripheral visual field constriction; ophthalmoscopic findings: (3) bone spicule-like pigment clumping; (4) vessel attenuation; (5) waxy pallor of the optic disc; (6) marked reduced or non-recordable a- and b-wave amplitudes on electroretinogram testing. In each case, the clinical and imaging-based diagnosis was confirmed by genetic characterization. Healthy subjects, without significant ocular pathologies or systemic disease, recruited as volunteers, acted as a control group.
Patients underwent a complete ophthalmic examination, including best-corrected visual acuity (BCVA) evaluation expressed in logMAR, intraocular pressure measurement with applanation tonometry, ocular eye examination with biomicroscopy of the anterior segment and dilated fundus examination, spectral domain OCT (SD-OCT), and OCTA. Exclusion criteria consisted of high refractive errors (myopia > 5 diopters, hypermetropia or astigmatism > 3 diopters), ocular pathologies, and opacity of dioptric means such as to prevent a good visualization of the eye fundus. We excluded patients with significant systemic diseases, with particular attention to diabetes and cardiovascular disorders, smokers (over 10 cigarettes/day), and patients who used medications that could affect the circulatory system.
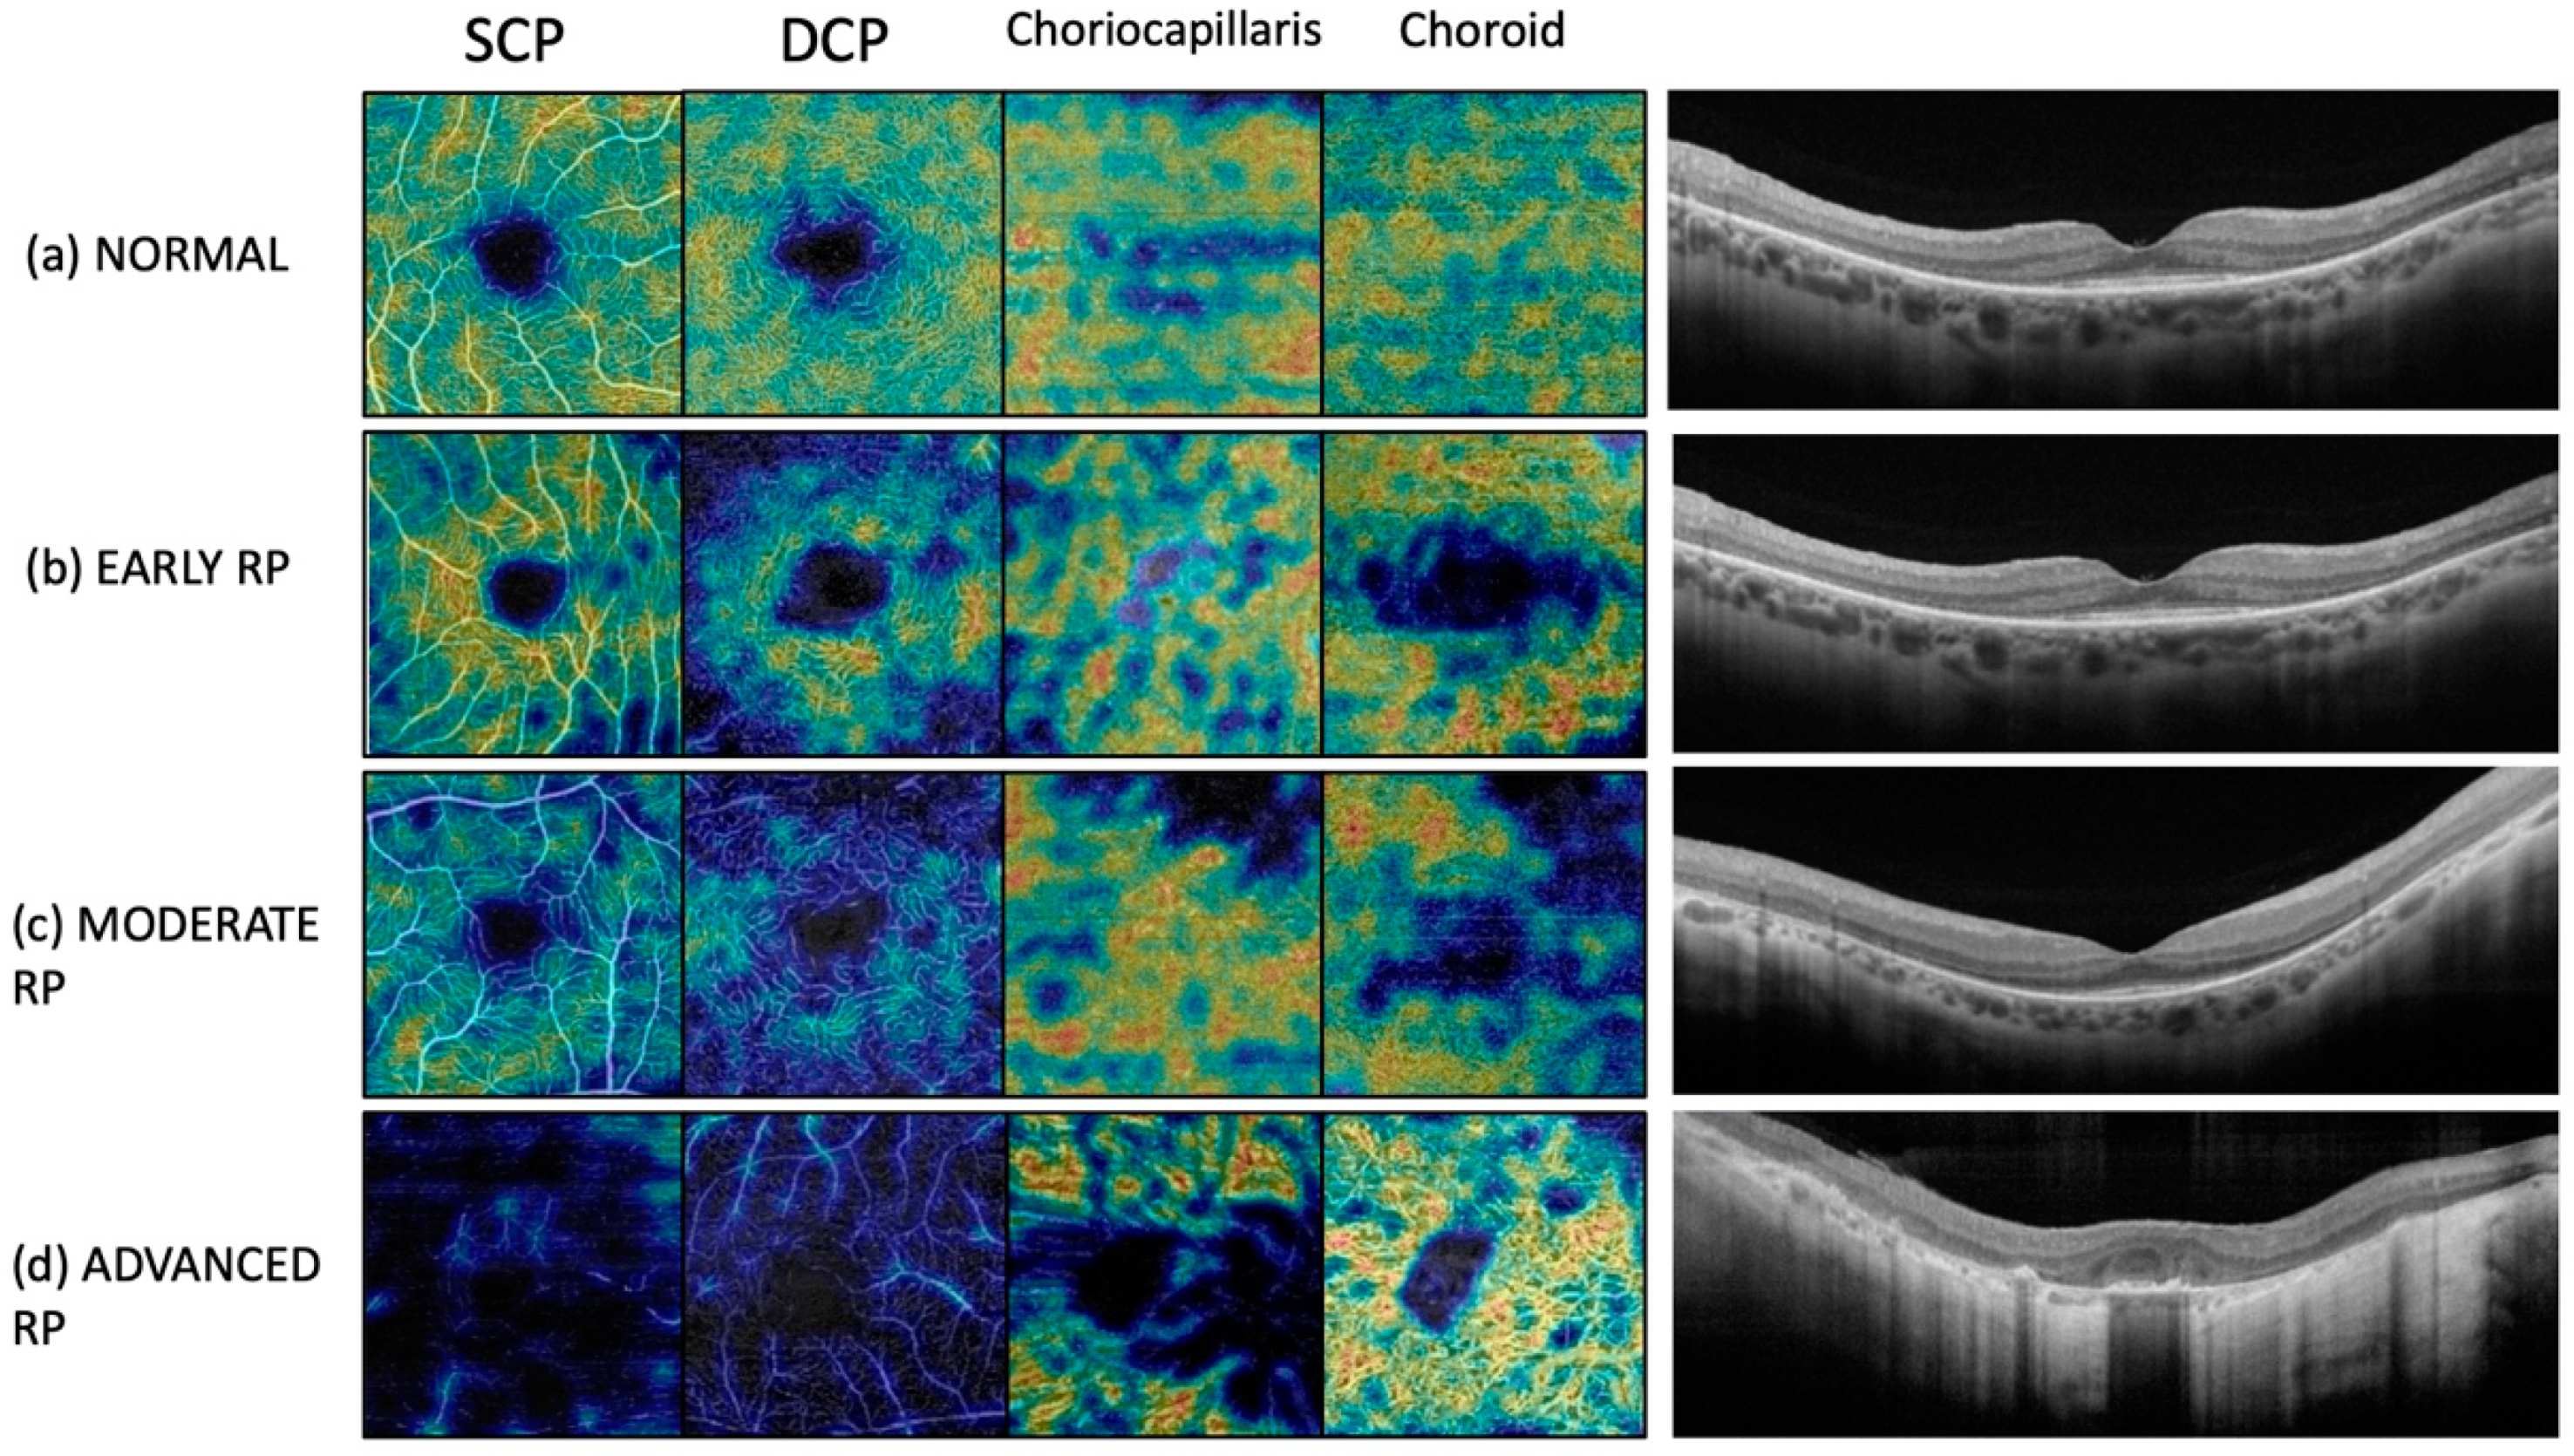
We used the RS-3000 Advance SD-OCT angiographer device (NIDEK Co. Ltd., Gamagori, Japan) for capturing high-definition images at different layers. The device has a scan speed of 53,000 A-scans/s, and incorporates an eye-tracing function, to maintain the same scan location on the SLO image, despite involuntary eye movements, for an accurate image capture. It gave us the possibility to obtain a quantitative measure in terms of vascular and flow density in mm2. All OCTA scans were performed under full pharmacological mydriasis obtained with tropicamide drops, 1% instillation. For each eye, 3 mm × 3 mm fovea-centered scans were acquired and used for all analyses. Automated segmentation of superficial capillary plexus (SCP), deep capillary plexus (DCP), and choriocapillaris (CC) and choroid was performed. Manual adjustment of the segmentation was performed in cases of alteration of the macular cytoarchitecture. Images were reviewed by the investigators (G.V.; D.B.) for segmentation accuracy. We included in the study only high-quality scans (signal strength index of at least 9), with a mean signal strength index 9.3/10. We excluded poor-quality scans, and scans with incorrect segmentation or motion artifacts.
For every eye included in the study, we performed a quantitative evaluation. Vascular densities of SCP, DCP, CC, and choroid were evaluated by default device software. Vascular density was defined as the percentage of the sample area occupied by vessel lumens following binary reconstruction of images (ETDRS-based VD [%]). The FAZ area was manually measured at SCP level through the free-hand selection tool, and its dimension was expressed as square millimeters.
Figure 1 shows OCTA scans in a healthy control and in patients with RP at different disease stages.
B-scan OCT quantitative measurements were obtained for all the eyes included in the study. We manually measured central retinal thickness (CRT), subfoveal choroidal thickness (CT), and CT at 1000 microns from the fovea in nasal and temporal sectors, using the software analysis tool.
Statistical analysis was performed using STATA software version 15.1 (StataCorp. College Station, TX, USA). They included descriptive statistics used to summarize demographics and main clinical records (mean values and standard deviations of all numerical data of the two groups) and comparative analysis with two-tailed Student’s t-test or Chi-square test with 95% confidence intervals. Spearman correlation coefficient was used as a non-parametric method to evaluate the correlation among OCTA and demographic/clinical variables. The chosen level of statistical significance was p-value < 0.05.
3. Results
3.1. Demographic and Clinical Characteristics
Twenty-six patients (52 eyes) affected by RP were enrolled for the study. In this group, the mean age was 50.48 ± 16.13 years. Thirteen patients (50%) were male, and 13 (50%) were female. Three of 26 RP patients were affected by Usher’s syndrome; the remaining twenty-three had non-syndromic RP.
The control group consisted of 19 healthy volunteers (38 eyes), with a mean age of 43.22 ± 15.71 years. Six patients (31.6%) were male, and 13 (68.4%) were female.
The mean BCVA (logMAR) of the RP group was 0.18 ± 0.25. In the control group, BCVA was 0.00, and it was significantly higher in comparison with the RP group (p-value = 0.001). The mean intraocular pressure was 13 mmHg in both the RP and control group. No RP patients had significant media opacities and dilated fundus examination showed no other alterations except RP. Anterior segment and dilated fundus examination were unremarkable in both eyes of all controls.
The demographic characteristics of RP patients and controls are summarized in
Table 1.
3.2. B-Scan Optical Coherence Tomography Quantitative Measurements
We obtained B-scan OCT quantitative measurements for all the eyes included in the study. These data are resumed in
Table 2.
There were no statistically significant differences in CRT value between the RP group and control group (192.31 ± 67.29 μm vs. 191.73 ± 25.28 μm; p-value = 0.688). The mean subfoveal CT value was 211.82 ± 66.46 μm in the RP group and 292.92 ± 52.88 μm in the control group, and the difference was statistically significant (p-value < 0.0001). The mean CT value measured at 1000 microns from the fovea on the nasal sector was 195.96 ± 66.29 μm in the RP group and 261.73 ± 52.76 μm in the control group, and the difference was statistically significant (p-value = 0.001). The mean CT value measured at 1000 microns from the fovea on temporal sector was 216.45 ± 65.94 μm and 271.81 ± 54.05 μm, respectively, in the RP and control group, with a statistically significant difference (p-value = 0.007).
3.3. Optical Coherence Tomography Angiography Results
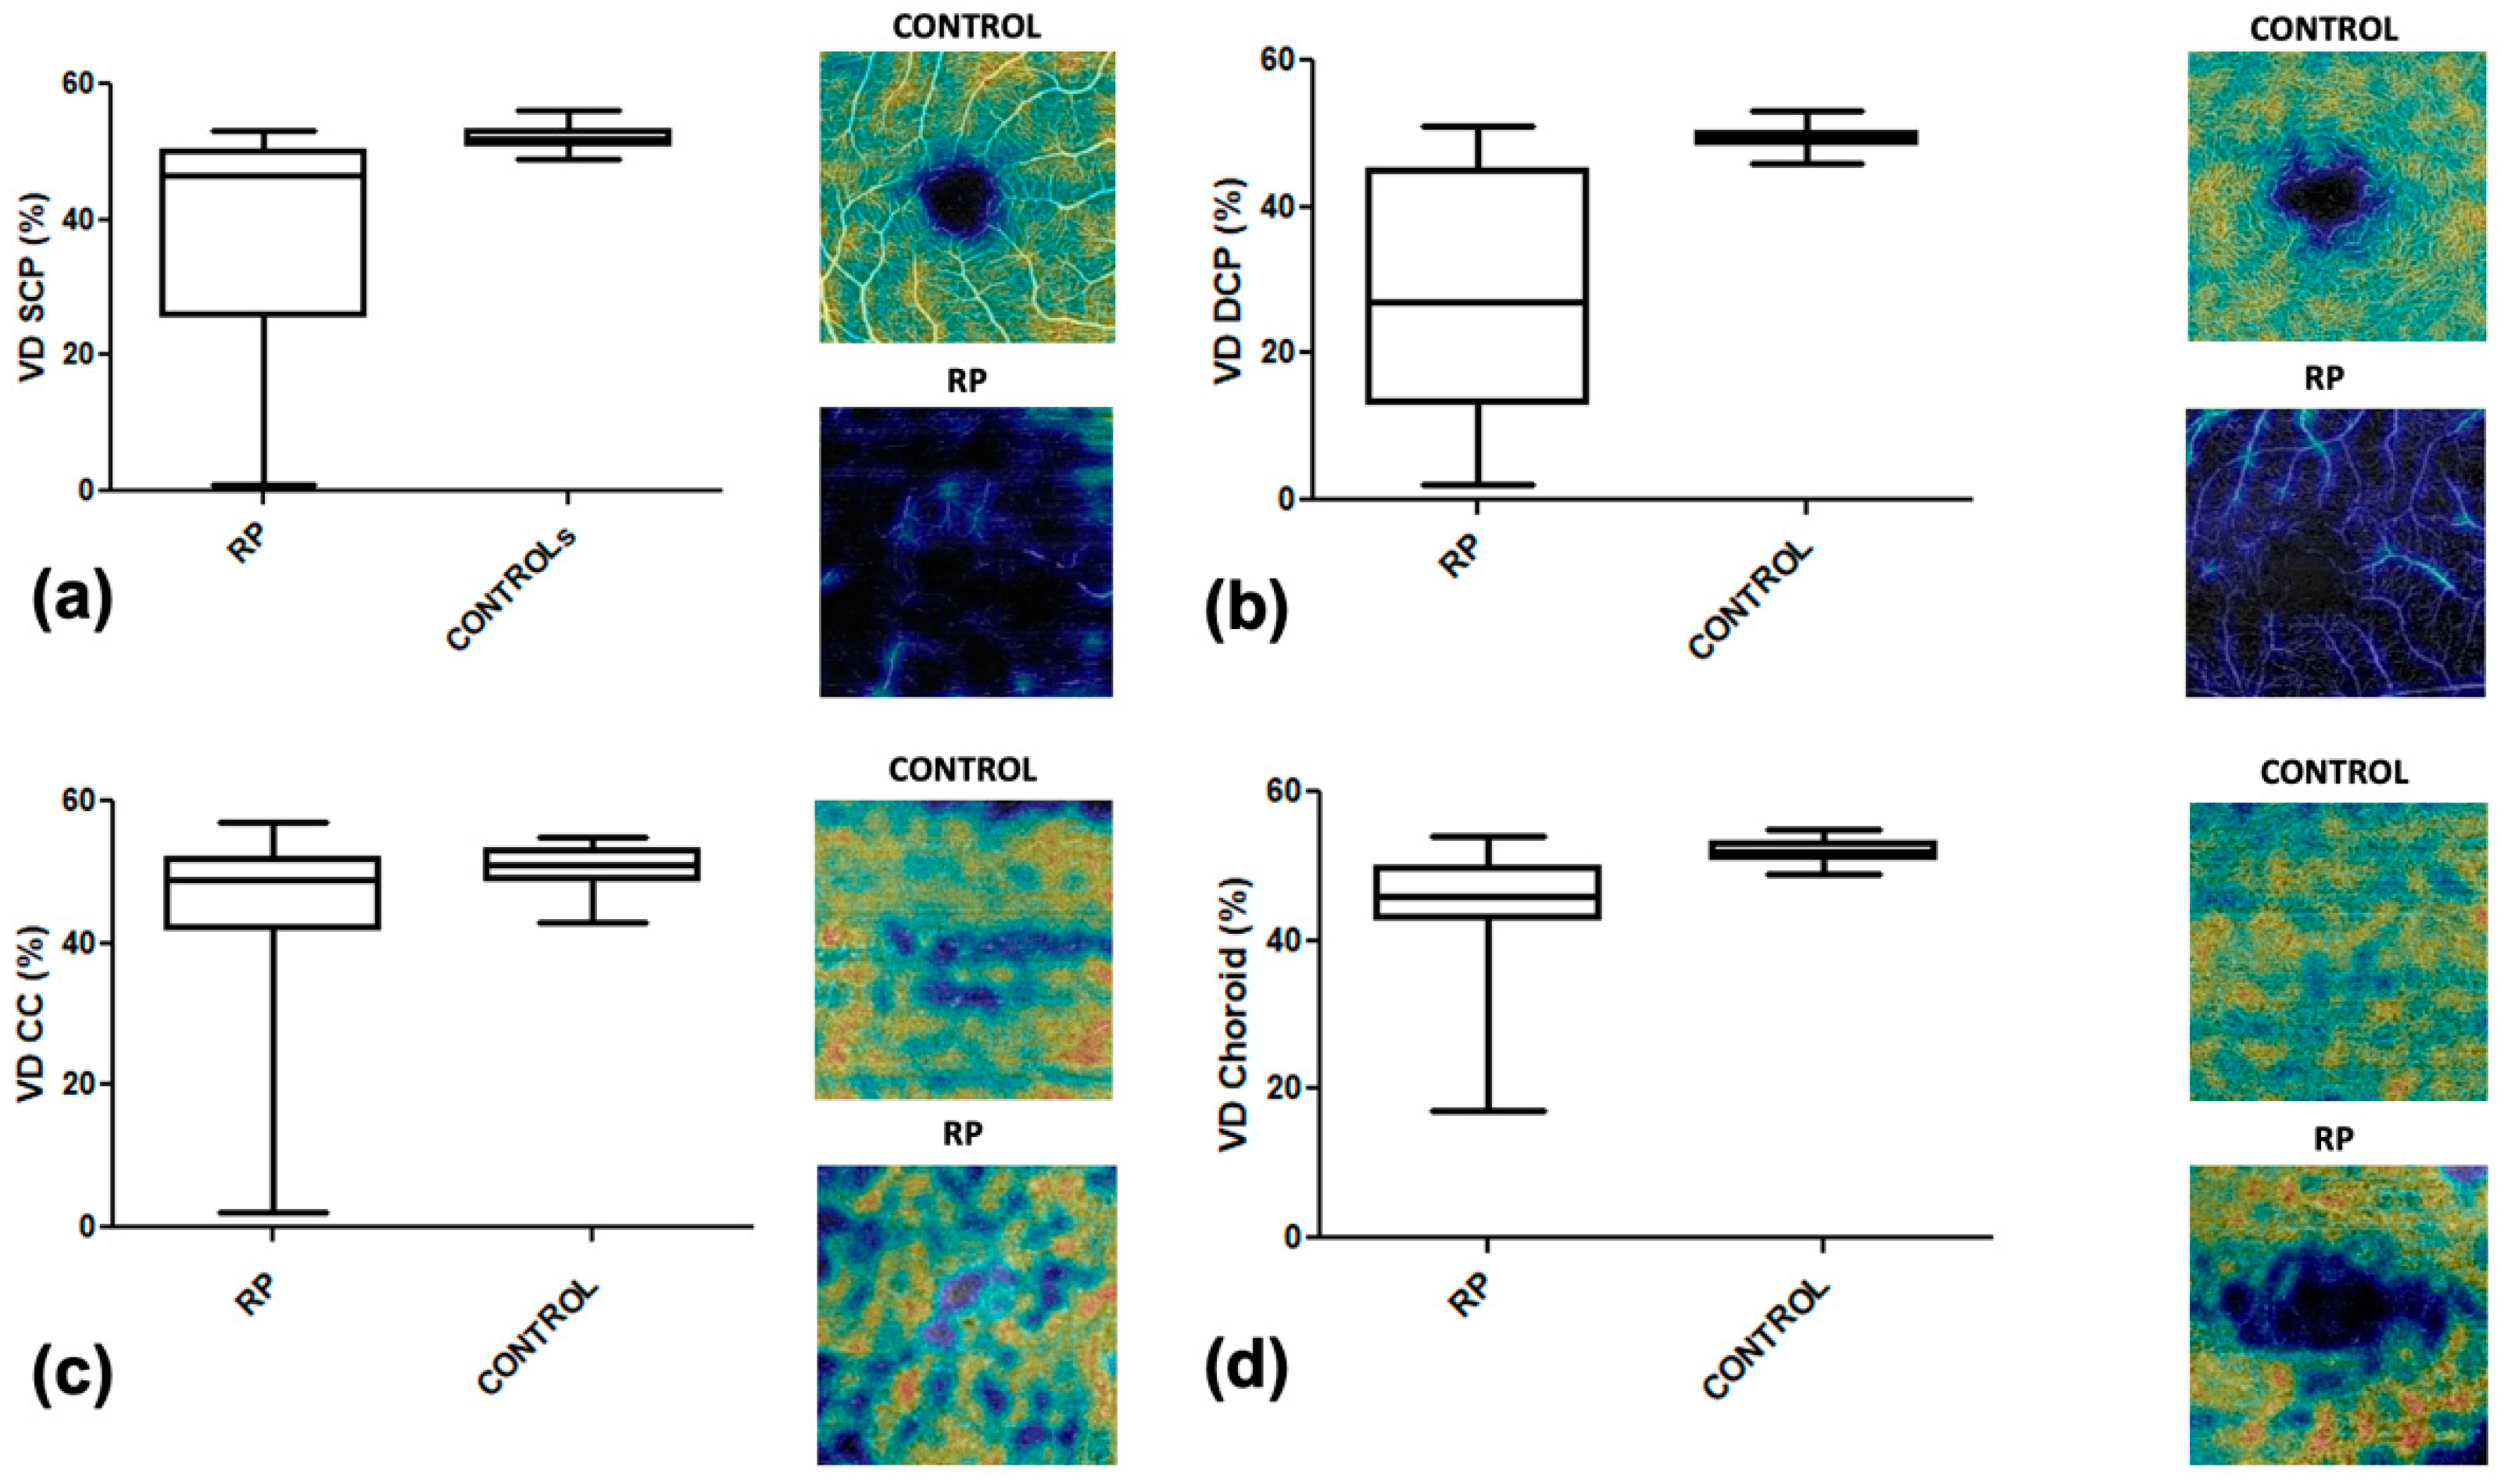
Our OCTA analysis showed in RP patients a rarefaction of the vascular texture in all layers. In particular, the RP group showed, in comparison to healthy subjects, a significantly lower vascular density in SCP (27.56% ± 15.37 vs. 49.39% ± 1.55;
p-value < 0.0001), in DCP (38.43% ± 15.23 vs. 3.34% ± 0.26;
p-value < 0.0001), in CC (46.02% ± 1.293 vs. 50.63% ± 0.4274;
p-value = 0.0040), and in choroid (38.48% ± 15.23 vs. 3.34% ± 0.26;
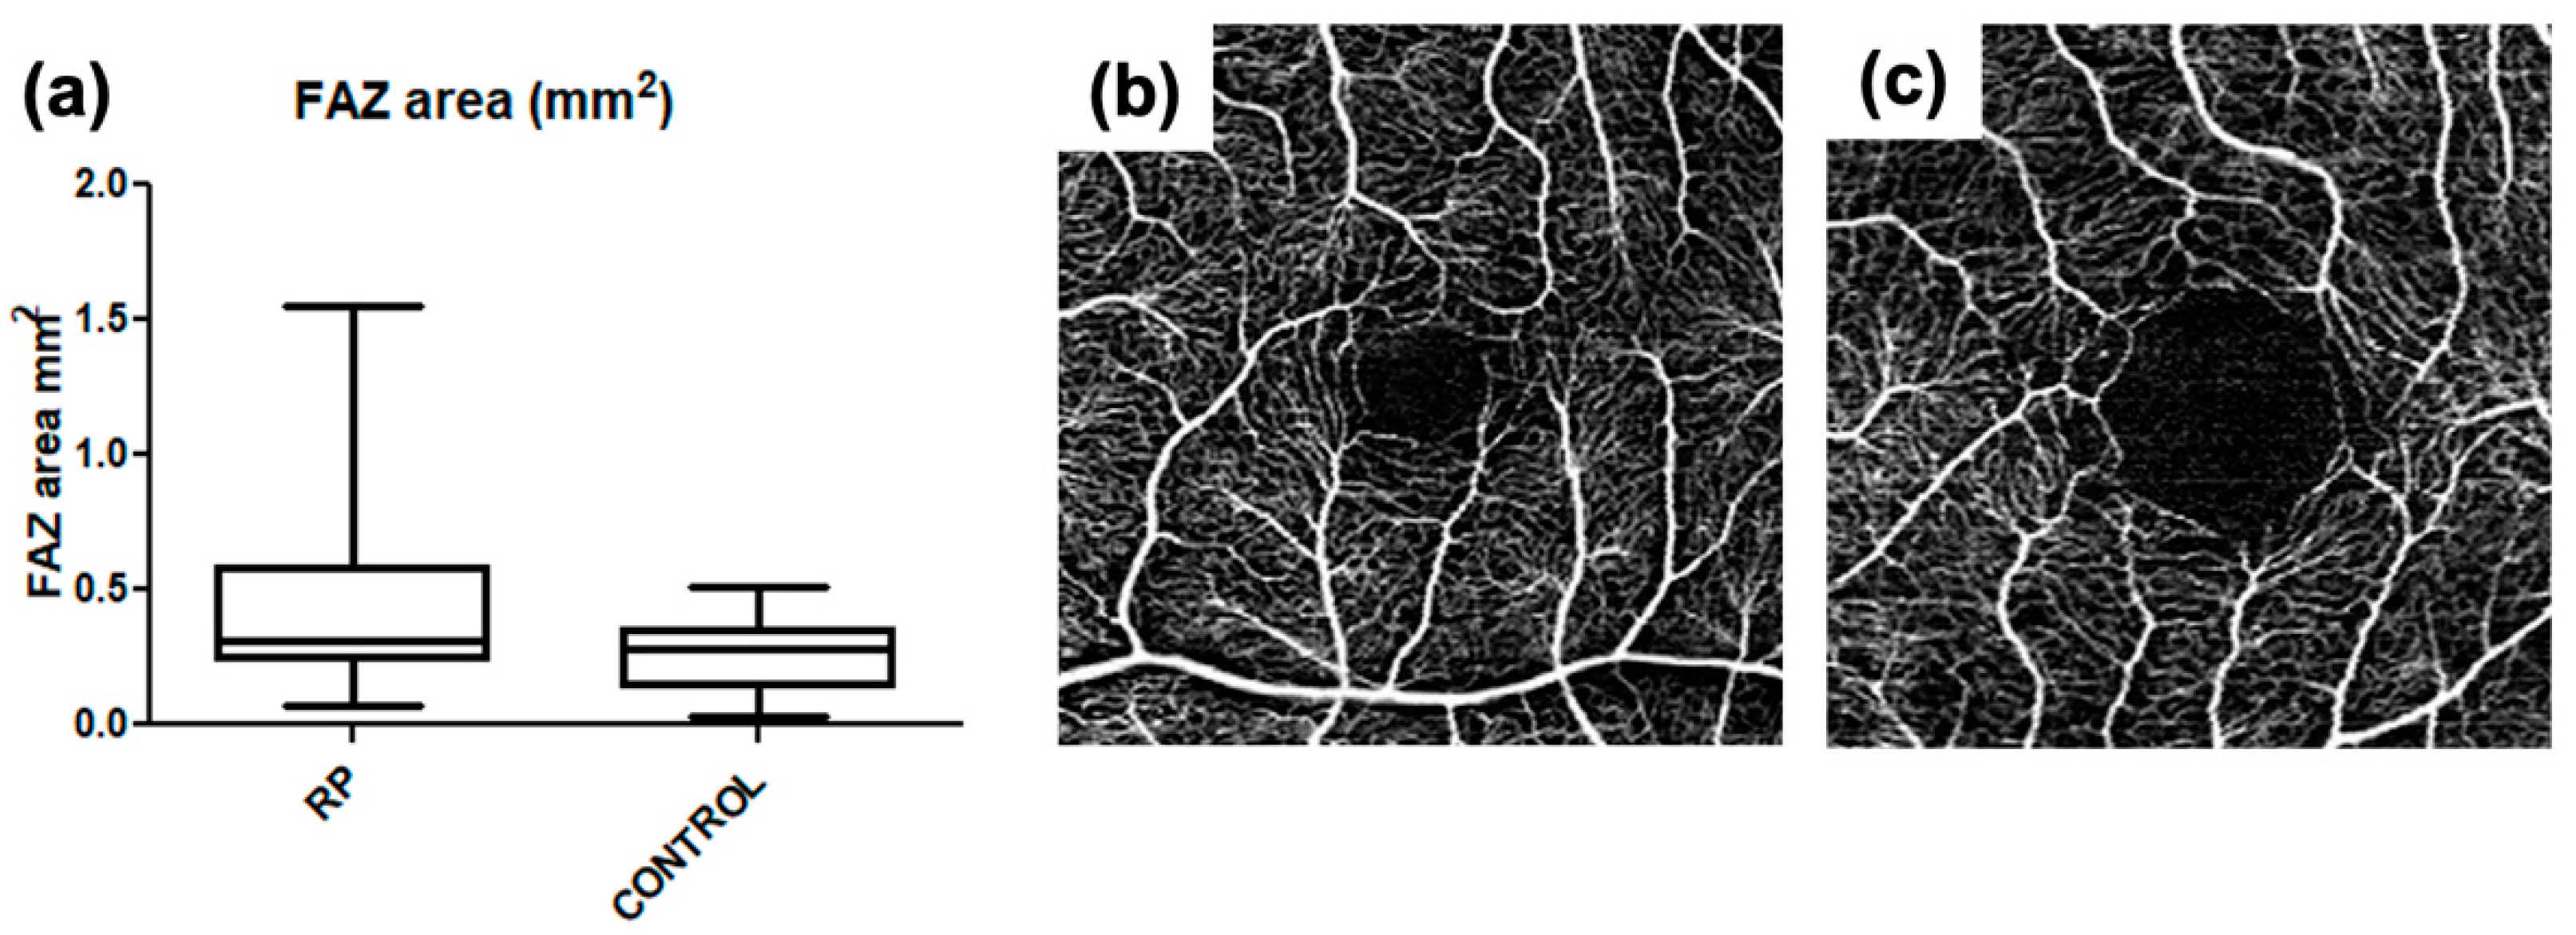
p-value < 0.0001). We also identified a significantly lower FAZ area in RP patients compared to controls (0.45 mm
2 ± 0.35 vs. 0.26 mm
2 ± 0.13;
p-value < 0.0001). A complete list of the results of this analysis is reported in
Table 3.
Figure 2 show box plots of the relationship between the vascular density of controls and RP patients, respectively, in SCP, DCP, CC, and choroid. In our series, the FAZ area was larger with increasing age, both in the control (r = 0.42;
p-value = 0.012) and RP group (r = 0.46;
p-value = 0.009), with a statistically significant correlation in both groups (
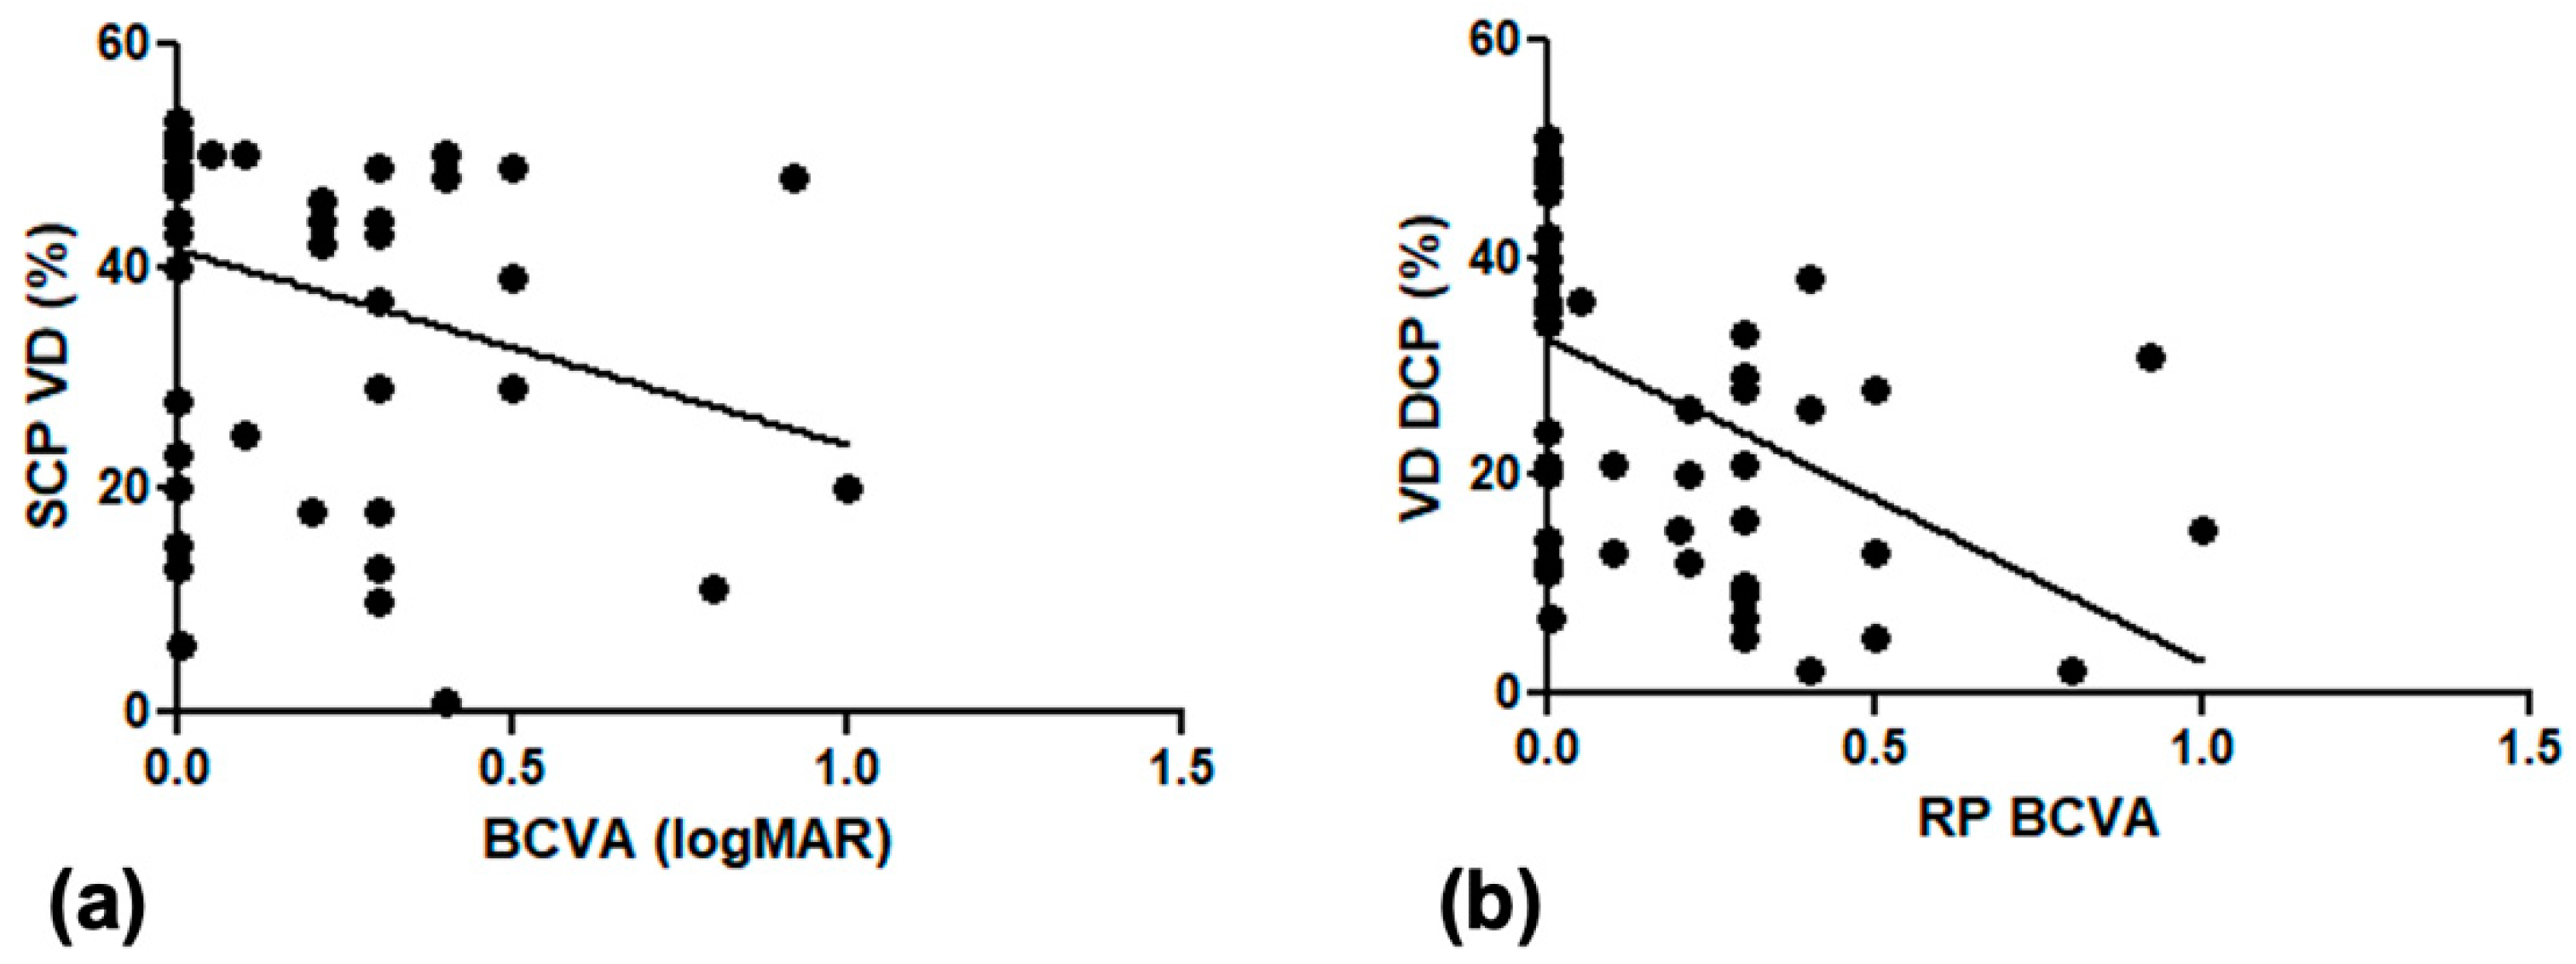
Figure 3). In the RP group, patients with lower visual acuity had lower vascular density, with a statistically significant correlation between BCVA and VD in the SCP (r = 0.24,
p-value = 0.04) and VD in the DCP (r = 0.52
p-value = 0.0004) (
Figure 4).
In RP patients, we also found a statistically significant correlation between subfoveal choroidal thickness and VD in the SCP (r = 0.43, p-value < 0.001) and in the DCP (r = 0.35, p-value < 0.001).
4. Discussion
Several studies recently conducted on patients affected by RP with OCTA have reported a reduction of the retinal and choroidal blood flow, when compared to controls, and an increase in size of the foveal avascular zone (FAZ) [
7,
8,
9,
12]. Ling et al. [
13] conducted a meta-analysis of the relevant published studies on OCTA in RP patients, showing that both retinal and choroidal vessels were attenuated in RP patients when compared with controls. Additionally, they revealed that the FAZ was larger and foveal thickness was smaller in RP patients compared with controls, suggesting that these microvascular parameters may have significant value in the diagnosis and monitoring of disease progression. Jauregui et al. [
15] examined the OCTA progression over time and found that perfusion density decreased significantly at the superficial and deep capillary plexus and FAZ area increased significantly at the superficial and deep layers.
The reduction of retinal blood flow appeared to be significantly correlated to visual function in RP patients [
6,
11]. A recent study conducted by means of widefield swept source OCTA showed an impairment of retinal and choroidal perfusion density and vessel length density in both the central and peripheral retina of RP patients, if compared to healthy controls [
16]. In this study, the reduction of flow features correlates with the macular function assessed with microperimetry.
We reported the results of our Centre experience in the evaluation of retinal and choroidal microvasculature in RP patients, by means of OCTA. All the chorioretinal image acquisitions were performed with the same tool. The analysis of the data obtained in our series allows some considerations. In our series, CRT did not show a statistically significant difference between RP and controls, and this result can be explained as the RP group includes cases with macular atrophy (reduced CRT), as well normal macula until the very late stages (normal CRT) or even patients with increased CRT due to macular edema. On the other side, CT was reduced in RP for all the considered locations (subfoveal and at 1000 microns from the fovea in nasal and temporal sectors) and this is in agreement with previous studies, showing a severe or moderate choroidal atrophy in RP [
17].
The quantitative evaluation of OCTA parameters in 3 mm × 3 mm macular scans showed significant differences in vascular density between RP and healthy controls at all the evaluated layers (SCP, DCP, CC, choroid), with lower values in RP patients.
The FAZ area, evaluated at SCP level, resulted significantly larger in the RP group in comparison with the controls. In both the RP and control group, the FAZ area was related to age, being wider in older patients, while the VD SCP and VD DCP in the RP group were related with BCVA and subfoveal choroidal thickness. Our data were in agreement with the published OCTA studies, confirming the vascular impairment already reported in RP.
The pathogenesis of this vascular impairment is still a matter of discussion. The rarefaction of the vascular density may be secondary to photoreceptors loss, because of the lower metabolic demand. Another hypothesis suggests a primary role of vascular supply abnormalities in the physiopathology of the disease. Moreover, an abnormal retinal vascular supply may be related to the reported choroidal alterations in RP. The retinal and choroidal microvascular alterations documented with OCTA have prompted the formulation of hypotheses on the pathogenesis of the disease such as the theory of Lu et al. [
14] on the relevant role of the microglial activation and vascular dysfunction in the entire process of retinal degeneration at the base of RP. In the human eye, there is a close interaction between the choroid and the outer retinal layers, as the choroid normally releases nutrients necessary for retinal metabolism, while the RPE normally provides trophic factors promoting choroidal survival.
The positive correlation between FAZ area and age both in RP and healthy controls is not unexpected, as increasing age is reasonably associated with a rarefaction of the vascular density. On the other side in RP, the positive correlation between VD SCP and VD DCP and BCVA suggests an influence of vascular abnormalities on visual loss progression in RP. The mechanism of this influence is quite unclear and we can only speculate that even in RP, the photoreceptors’ damage is primarily genetic; a better vascular supply may play a favorable role on outer retina metabolism, then supporting a longer preservation of visual capabilities.
We are aware that our study presents some limitations. The first limitation is the small sample size; nevertheless, it should be considered the rarity of the disease. Additionally, our cross-sectional study includes a heterogeneous group of patients affected by RP, without a stratification of the disease severity, and no analyses have been made on OCTA parameters in relation to the disease degree. This is another limitation of the study. Several factors can affect OCTA results, such as diabetes, systemic hypertension, cognitive status, axial length, and signal strength of scans. We tried to overcome this limitation by excluding from the study patients with concomitant systemic diseases, such as diabetes, arterial hypertension, neurodegenerative diseases, high myopic and hyperopic patients, patients with poor quality scans, incorrect segmentation, or motion artifacts. However, it is difficult to eliminate all the possible confounding factors that could affect OCTA parameters, and this is also a limitation of the study. Lastly, the detection of vessel density in the choroid is difficult with SD-OCTA and has limitations [
18,
19]. However, SD-OCTA allows a vessel density detention in the choroid, although we are aware of the limitations of the method.
5. Conclusions
In conclusion, our study OCTA reported relevant vascular alterations in RP patients in comparison with healthy controls. These abnormalities were associated with choroidal atrophy and were related to central visual loss. If the observation of a vascular impairment in RP is further confirmed, it might promote the research of additional therapeutical approaches, aiming to improve the retinal and choroidal blood supply. In our RP series, OCTA provided clinically significant information, and may represent a reliable tool for the management of these patients, in particular for an early diagnosis, a prognostic evaluation, patients selection for clinical trials, and monitoring disease progression.
Author Contributions
Conceptualization, F.G., G.V. (Giulio Vicini), A.S., C.N., and D.B.; methodology, F.G, G.V. (Giulio Vicini), A.S., C.N., G.V. (Gianni Virgili) and D.B; software, G.V. (Giulio Vicini), C.N., L.B., and D.B.; validation, F.G., G.V. (Giulio Vicini), A.S., G.V. (Gianni Virgili), and S.R., formal analysis, F.G., G.V. (Giulio Vicini), A.S., G.V. (Gianni Virgili); investigation, F.G., G.V. (Giulio Vicini), A.S., C.N., L.B., and D.B.; resources, F.G., G.V. (Giulio Vicini), A.S., G.V. (Gianni Virgili), and S.R.; data curation, F.G., G.V. (Giulio Vicini), A.S., G.V. (Gianni Virgili) and S.R; writing—original draft preparation, F.G., D.B.; writing—review and editing, F.G., G.V. (Giulio Vicini), A.S., C.N., and D.B.; visualization, F.G., G.V. (Giulio Vicini), A.S., C.N., L.B., and D.B.; supervision, D.B.; project administration, F.G. All authors have read and agreed to the published version of the manuscript.
Funding
This research received no external funding.
Institutional Review Board Statement
The study was conducted in accordance with the Declaration of Helsinki, and approved by the Institutional Review Board of Careggi University Hospital.
Informed Consent Statement
Informed consent was obtained from all subjects involved in the study.
Data Availability Statement
The data presented in this study are available on request from the corresponding author. The data (original imaging) are not publicly available due to privacy issues.
Conflicts of Interest
The authors declare no conflict of interest. The funders had no role in the design of the study; in the collection, analyses, or interpretation of data; in the writing of the manuscript, or in the decision to publish the results.
References
- Hartong, D.T.; Berson, E.L.; Dryja, T.P. Retinitis pigmentosa. Lancet 2006, 368, 1795–1809. [Google Scholar] [CrossRef]
- Chizzolini, M.; Galan, A.; Milan, E.; Sebastiani, A.; Costagliola, C.; Parmeggiani, F. Good epidemiologic practice in retinitis pigmentosa: From phenotyping to biobanking. Curr. Genom. 2011, 12, 260–266. [Google Scholar]
- Verbakel, S.K.; van Huet, R.A.C.; Boon, C.J.F.; den Hollander, A.I.; Collin, R.W.J.; Klaver, C.C.W.; Hoyng, C.B.; Roepman, R.; Klevering, B.J. Non-syndromic retinitis pigmentosa. Prog. Retin. Eye Res. 2018, 6, 157–186. [Google Scholar] [CrossRef] [PubMed]
- Borrelli, E.; Sarraf, D.; Freund, K.B.; Sadda, S.R. OCT angiography and evaluation of the choroid and choroidal vascular disorders. Prog. Retin. Eye Res. 2018, 67, 30–55. [Google Scholar] [CrossRef] [PubMed]
- Ong, S.S.; Patel, T.P.; Singh, M.S. Optical Coherence Tomography Angiography Imaging in Inherited Retinal Diseases. J. Clin. Med. 2019, 8, 2078. [Google Scholar] [CrossRef] [PubMed] [Green Version]
- Murakami, Y.; Ikeda, Y.; Akiyama, M.; Fujiwara, K.; Yoshida, N.; Nakatake, S.; Notomi, S.; Nabeshima, T.; Hisatomi, T.; Enaida, H.; et al. Correlation between macular blood flow and central visual sensitivity in retinitis pigmentosa. Acta Ophthalmol. 2015, 93, e644–e648. [Google Scholar] [CrossRef] [PubMed]
- Toto, L.; Borrelli, E.; Mastropasqua, R.; Senatore, A.; Di Antonio, L.; Di Nicola, M.; Carpineto, P.; Mastropasqua, L. Macular Features in Retinitis Pigmentosa: Correlations among Ganglion Cell Complex Thickness, Capillary Density, and Macular Function. Investig. Ophthalmol. Vis. Sci. 2016, 57, 6360–6366. [Google Scholar] [CrossRef] [PubMed] [Green Version]
- Sugahara, M.; Miyata, M.; Ishihara, K.; Gotoh, N.; Morooka, S.; Ogino, K.; Hasegawa, T.; Hirashima, T.; Yoshikawa, M.; Hata, M.; et al. Optical Coherence Tomography Angiography to Estimate Retinal Blood Flow in Eyes with Retinitis Pigmentosa. Sci. Rep. 2017, 7, 46396. [Google Scholar] [CrossRef] [PubMed]
- Battaglia Parodi, M.; Cicinelli, M.V.; Rabiolo, A.; Pierro, L.; Gagliardi, M.; Bolognesi, G.; Bandello, F. Vessel density analysis in patients with retinitis pigmentosa by means of optical coherence tomography angiography. Br. J. Ophthalmol. 2017, 101, 428–432. [Google Scholar] [CrossRef] [PubMed]
- Koyanagi, Y.; Murakami, Y.; Funatsu, J.; Akiyama, M.; Nakatake, S.; Fujiwara, K.; Tachibana, T.; Nakao, S.; Hisatomi, T.; Yoshida, S.; et al. Optical coherence tomography angiography of the macular microvasculature changes in retinitis pigmentosa. Acta Ophthalmol. 2018, 96, e59–e67. [Google Scholar] [CrossRef] [PubMed] [Green Version]
- Inooka, D.; Ueno, S.; Kominami, T.; Sayo, A.; Okado, S.; Ito, Y.; Terasaki, H. Quantification of Macular Microvascular Changes in Patients with Retinitis Pigmentosa Using Optical Coherence Tomography Angiography. Investig. Ophthalmol. Vis. Sci. 2018, 59, 433–438. [Google Scholar] [CrossRef] [PubMed] [Green Version]
- Alnawaiseh, M.; Schubert, F.; Heiduschka, P.; Eter, N. Optical coherence tomography angiography in patients with retinitis pigmentosa. Retina 2019, 39, 210–217. [Google Scholar] [CrossRef] [PubMed]
- Ling, L.; Gao, F.; Zhang, Q.; He, T.; Zhao, Y.; Xing, Y.; Yu, Y.; Ji, K. Optical Coherence Tomography Angiography Assessed Retinal and Choroidal Microvasculature Features in Patients with Retinitis Pigmentosa: A Meta-Analysis. BioMed Res. Int. 2019, 2019, 6723917. [Google Scholar] [CrossRef] [PubMed] [Green Version]
- Lu, B.W.; Chao, G.J.; Wu, G.P.; Xie, L.K. In depth understanding of retinitis pigmentosa pathogenesis through optical coherence tomography angiography analysis: A narrative review. Int. J. Ophthalmol. 2021, 14, 1979–1985. [Google Scholar] [CrossRef] [PubMed]
- Jauregui, R.; Park, K.S.; Duong, J.K.; Mahajan, V.B.; Tsang, S.H. Quantitative progression of retinitis pigmentosa by optical coherence tomography angiography. Sci. Rep. 2018, 8, 13130. [Google Scholar] [CrossRef] [PubMed]
- Mastropasqua, R.; D’Aloisio, R.; De Nicola, C.; Ferro, G.; Senatore, A.; Libertini, D.; Di Marzio, G.; Di Nicola, M.; Di Martino, G.; Di Antonio, L.; et al. Widefield Swept Source OCTA in Retinitis Pigmentosa. Diagnostics 2020, 10, 50. [Google Scholar] [CrossRef] [PubMed] [Green Version]
- Sodi, A.; Lenzetti, C.; Murro, V.; Caporossi, O.; Mucciolo, D.P.; Bacherini, D.; Cipollini, F.; Passerini, I.; Virgili, G.; Rizzo, S. EDI-OCT evaluation of choroidal thickness in retinitis pigmentosa. Eur. J. Ophthalmol. 2018, 28, 52–57. [Google Scholar] [CrossRef] [PubMed]
- Ang, M.; Tan, A.C.S.; Cheung, C.M.G.; Keane, P.A.; Dolz-Marco, R.; Sng, C.; Schmetterer, L. Optical coherence tomography angiography: A review of current and future clinical applications. Graefes Arch. Clin. Exp. Ophthalmol. 2018, 256, 237–245. [Google Scholar] [CrossRef] [PubMed]
- Sambhav, K.; Grover, S.; Chalam, K.V. The application of optical coherence tomography angiography in retinal diseases. Surv. Ophthalmol. 2017, 62, 838–866. [Google Scholar] [CrossRef] [PubMed]
| Publisher’s Note: MDPI stays neutral with regard to jurisdictional claims in published maps and institutional affiliations. |
© 2022 by the authors. Licensee MDPI, Basel, Switzerland. This article is an open access article distributed under the terms and conditions of the Creative Commons Attribution (CC BY) license (https://creativecommons.org/licenses/by/4.0/).


 ,
, 


