Systematic Review

Preoperative Apparent Diffusion Coefficient Values for Differentiation between Low and High Grade Meningiomas: An Updated Systematic Review and Meta-Analysis

1
Department of Medical Imaging, Chi Mei Medical Center, Tainan 710, Taiwan
2
Department of Anesthesiology, Chi Mei Medical Center, Tainan 710, Taiwan
3
Department of Hospital and Health Care Administration, College of Recreation and Health Management, Chia Nan University of Pharmacy and Science, Tainan 71710, Taiwan
4
Department of Neurosurgery, Chi Mei Medical Center, Chiali, Tainan 722, Taiwan
5
Department of Nursing, Min-Hwei College of Health Care Management, Tainan 736, Taiwan
6
Department of Medical Imaging, Kaohsiung Medical University Hospital, Kaohsiung 807, Taiwan
7
Department of Radiological Sciences, University of California, Irvine, CA 92697, USA
8
Department of Radiology, E-DA Hospital, I-Shou University, Kaohsiung 824, Taiwan
9
Department of Health and Nutrition, Chia Nan University of Pharmacy and Science, Tainan 71710, Taiwan
10
Institute of Biomedical Sciences, National Sun Yat-Sen University, Kaohsiung 804, Taiwan
*
Author to whom correspondence should be addressed.
These authors contributed equally to this work.
Diagnostics 2022, 12(3), 630; https://doi.org/10.3390/diagnostics12030630
Submission received: 8 February 2022 / Revised: 2 March 2022 / Accepted: 3 March 2022 / Published: 4 March 2022
(This article belongs to the Topic Diagnostic Imaging and Pathology in Cancer Research)

Abstract

:
The meta-analysis aimed to compare the preoperative apparent diffusion coefficient (ADC) values between low-grade meningiomas (LGMs) and high-grade meningiomas (HGMs). Medline, Cochrane, Scopus, and Embase databases were screened up to January 2022 for studies investigating the ADC values of meningiomas. The study endpoint was the reported ADC values for LGMs and HGMs. Further subgroup analyses between 1.5T and 3T MRI scanners, ADC threshold values, ADC in different histological LGMs, and correlation coefficients (r) between ADC and Ki-67 were also performed. The quality of studies was evaluated by the quality assessment of diagnostic accuracy studies (QUADAS-2). A χ2-based test of homogeneity was performed using Cochran’s Q statistic and inconsistency index (I2). Twenty-five studies with a total of 1552 meningiomas (1102 LGMs and 450 HGMs) were included. The mean ADC values (×10−3 mm2/s) were 0.92 and 0.79 for LGMs and HGMs, respectively. Compared with LGMs, significantly lower mean ADC values for HGMs were observed with a pooled difference of 0.13 (p < 0.00001). The results were consistent in both 1.5T and 3T MRI scanners. For ADC threshold values, pooled sensitivity of 69%, specificity of 82%, and AUC of 0.84 are obtained for differentiation between LGMs and HGMs. The mean ADC (×10−3 mm2/s) in different histological LGMs ranged from 0.87 to 1.22. Correlation coefficients (r) of mean ADC and Ki-67 ranged from −0.29 to −0.61. Preoperative ADC values are a useful tool for differentiating between LGMs and HGMs. Results of this study provide valuable information for planning treatments in meningiomas.

1. Introduction

Meningiomas are the most common benign intracranial tumors and account for more than 30% of all brain tumors [1]. The 2016 World Health Organization (WHO) classification of central nervous system tumors divides meningiomas into three grades based on the invasive and histopathological features [2]. Eighty percent of meningiomas are grade I benign meningiomas, referred to as low-grade meningiomas (LGMs); the remaining are grade II atypical meningiomas and grade III malignant meningiomas, referred to as high-grade meningiomas (HGMs) [2]. Most LGMs are slow-growing tumors and usually do not cause clinical symptoms. In contrast, the HGMs show a higher risk of recurrence and lead to higher morbidity and mortality. The recurrence rates were 14.8%, 49.4%, and 69.7% in grades I, II, and III meningiomas, respectively, and overall 5-year survival was 92% for grade I, 78.5% for grade II, and 44% for grade III meningiomas [3,4]. The treatment planning of meningiomas is highly associated with tumor grading. Surgical resection is considered appropriate for LGMs, whereas adjuvant radiotherapy is recommended for HGMs [5,6]. Thus, correct preoperative prediction of tumor grades for meningiomas is crucial in clinical practice.
Diffusion-weighted magnetic resonance imaging (DWI) and apparent diffusion coefficient (ADC) value is a noninvasive, easily accessible technique that has been widely used as a tumor imaging biomarker [7]. It reflects the mobility of water molecules in a specified time, which provides biomedical information of the tumor microstructure [8]. High DWI signal and low ADC value usually indicate the water restriction phenomenon caused by high tumor cellularity [7,8]. Therefore, this technique is widely used to predict tumor characterization noninvasively in several types of brain tumors [9]. Several studies described the correlation of ADC values and the grading of meningiomas [10,11,12,13,14,15]. Some authors reported lower ADC values in HGMs compared to those in LGMs, which highlights that ADC could be a useful imaging marker to differentiate the grades of meningiomas [10,11,12,13,14,15]. However, other studies revealed inconsistent findings [16,17,18,19].
A recent meta-analysis [20] performed a literature search (i.e., Medline and Scopus) in 2019, which demonstrated an overlap in ADC values between LGMs and HGMs despite a higher ADC value in the LGMs, suggesting that ADC may not accurately predict the proliferation potential of the meningiomas. More evidence was presented after 2019 [14,15,19,21,22,23], and updating the latest evidence is imperative. The aim of this meta-analysis was to systematically review the latest evidence from four databases (Medline, Cochrane, Scopus, Embase) and explore the ability of ADC values to differentiate LGMs and HGMs.

2. Materials and Methods

2.1. Search Strategy

We searched the Medline, Cochrane, Scopus, and Embase databases from their inception dates until January 2022. The Boolean operator “OR” was used to cover similar concepts, while “AND” was used to intersect different concepts. The keywords below were applied to search for eligible records: (“meningioma*” or meningioma [MeSH term]) and (“apparent diffusion coefficient” or ADC or “Diffusion Magnetic Resonance Imaging [MeSH term]” or “diffusion weighted imaging” or DWI). Subject headings (i.e., MeSH terms in Medline) were also adopted in the current literature search. Additional records were screened by reviewing the reference lists of the relevant studies.

2.2. Selection Criteria

Prospective or retrospective studies with patients receiving brain MRI evaluation for meningiomas were included. The inclusion criteria were imaging that must have been performed before surgery or treatments, and the results had to include the mean ADC values with standard deviation in low-grade and high-grade meningiomas. Letters, comments, editorials, case reports, proceedings, reviews, and personal communications were excluded.

2.3. Study Selection and Data Extraction

The Preferred Reporting Items for Systematic Reviews and Meta-Analyses (PRISMA) 2020 guidelines were applied [24]. The following data were extracted from studies that met the selection criteria: the name of the first author, year of publication, study design, 1.5T or 3T MRI, number of participants in each group, histological tumor grades, mean and standard deviation of ADC values in the LGMs and HGMs, b-values of DWI, ADC measurement methods, threshold values of ADC between LGMs and HGMs, and the correlation coefficient (r) between mean ADC and Ki-67 index.

2.4. Quality Assessment

The quality of included studies was assessed using the Quality Assessment of Diagnostic Accuracy Studies (QUADAS-2) [25]. The risk of bias in each study was reported as “low,” “unclear” or “high” in the following domains: patient selection, index test, reference standard, and flow and timing. The assessments were performed by two independent reviewers, and a third reviewer was consulted for any uncertainty.

2.5. Statistical Analysis

Differences in mean with 95% confidence interval (CI) were calculated for each individual study and for those studies pooled. A χ2 test of homogeneity was performed, and the inconsistency index (I2) and Q statistics were determined. By assuming heterogeneity across the studies based on a previous meta-analysis [20], a random-effects model was used for outcome assessment, regardless of the finding of statistical heterogeneity. Pooled effects were calculated, and a two-sided p-value < 0.05 was considered statistically significant. Sensitivity analysis was evaluated for the outcomes using the one-study-removed test. The analyses were performed using Comprehensive Meta-Analysis (version 3.0) and Review Manager (version 5.4.1) statistical software. For subgroup analysis in ADC threshold values, diagnostic test accuracy and the summary receiver operating characteristics (sROC) were performed using R statistical software (version 4.1.1). Pooled sensitivity, specificity, and area under sROC (AUC) were calculated using the bivariate random-effects model [26,27].

3. Results

3.1. Literature Search and Study Characteristics

Figure 1 displays the PRISMA flow chart of the study acquisition. Initially, the search of the databases produced 1322 citations. After removing 451 duplicates, 871 publications were screened for eligibility according to the titles and abstracts. The screening process yielded 79 potentially eligible articles for full-text review. A total of 54 studies were excluded due to lack of DWI analysis (n = 38), overlapping data (n = 3), no reported mean ADC (n = 6), no reported standard deviation (n = 5), or review article (n = 2). Finally, 25 studies published from 2001 to 2021, and involving 1552 patients, were included for the present meta-analysis (Figure 1). The baseline characteristics of all included studies are summarized in Table 1. For the included 25 studies, 18 studies were conducted using a retrospective design, while 7 studies were conducted using a prospective design. Sixteen of the 25 studies used 1.5T MRI [10,11,14,15,16,19,21,23,28,29,30,31,32,33,34,35], six studies used 3T MRI [13,22,36,37,38,39], two studies used both 1.5T and 3T MRI [40,41], and one study used 1T MRI [17]. Among the 1552 patients, 1102 patients were diagnosed as LGMs, while 450 patients were diagnosed as HGMs.

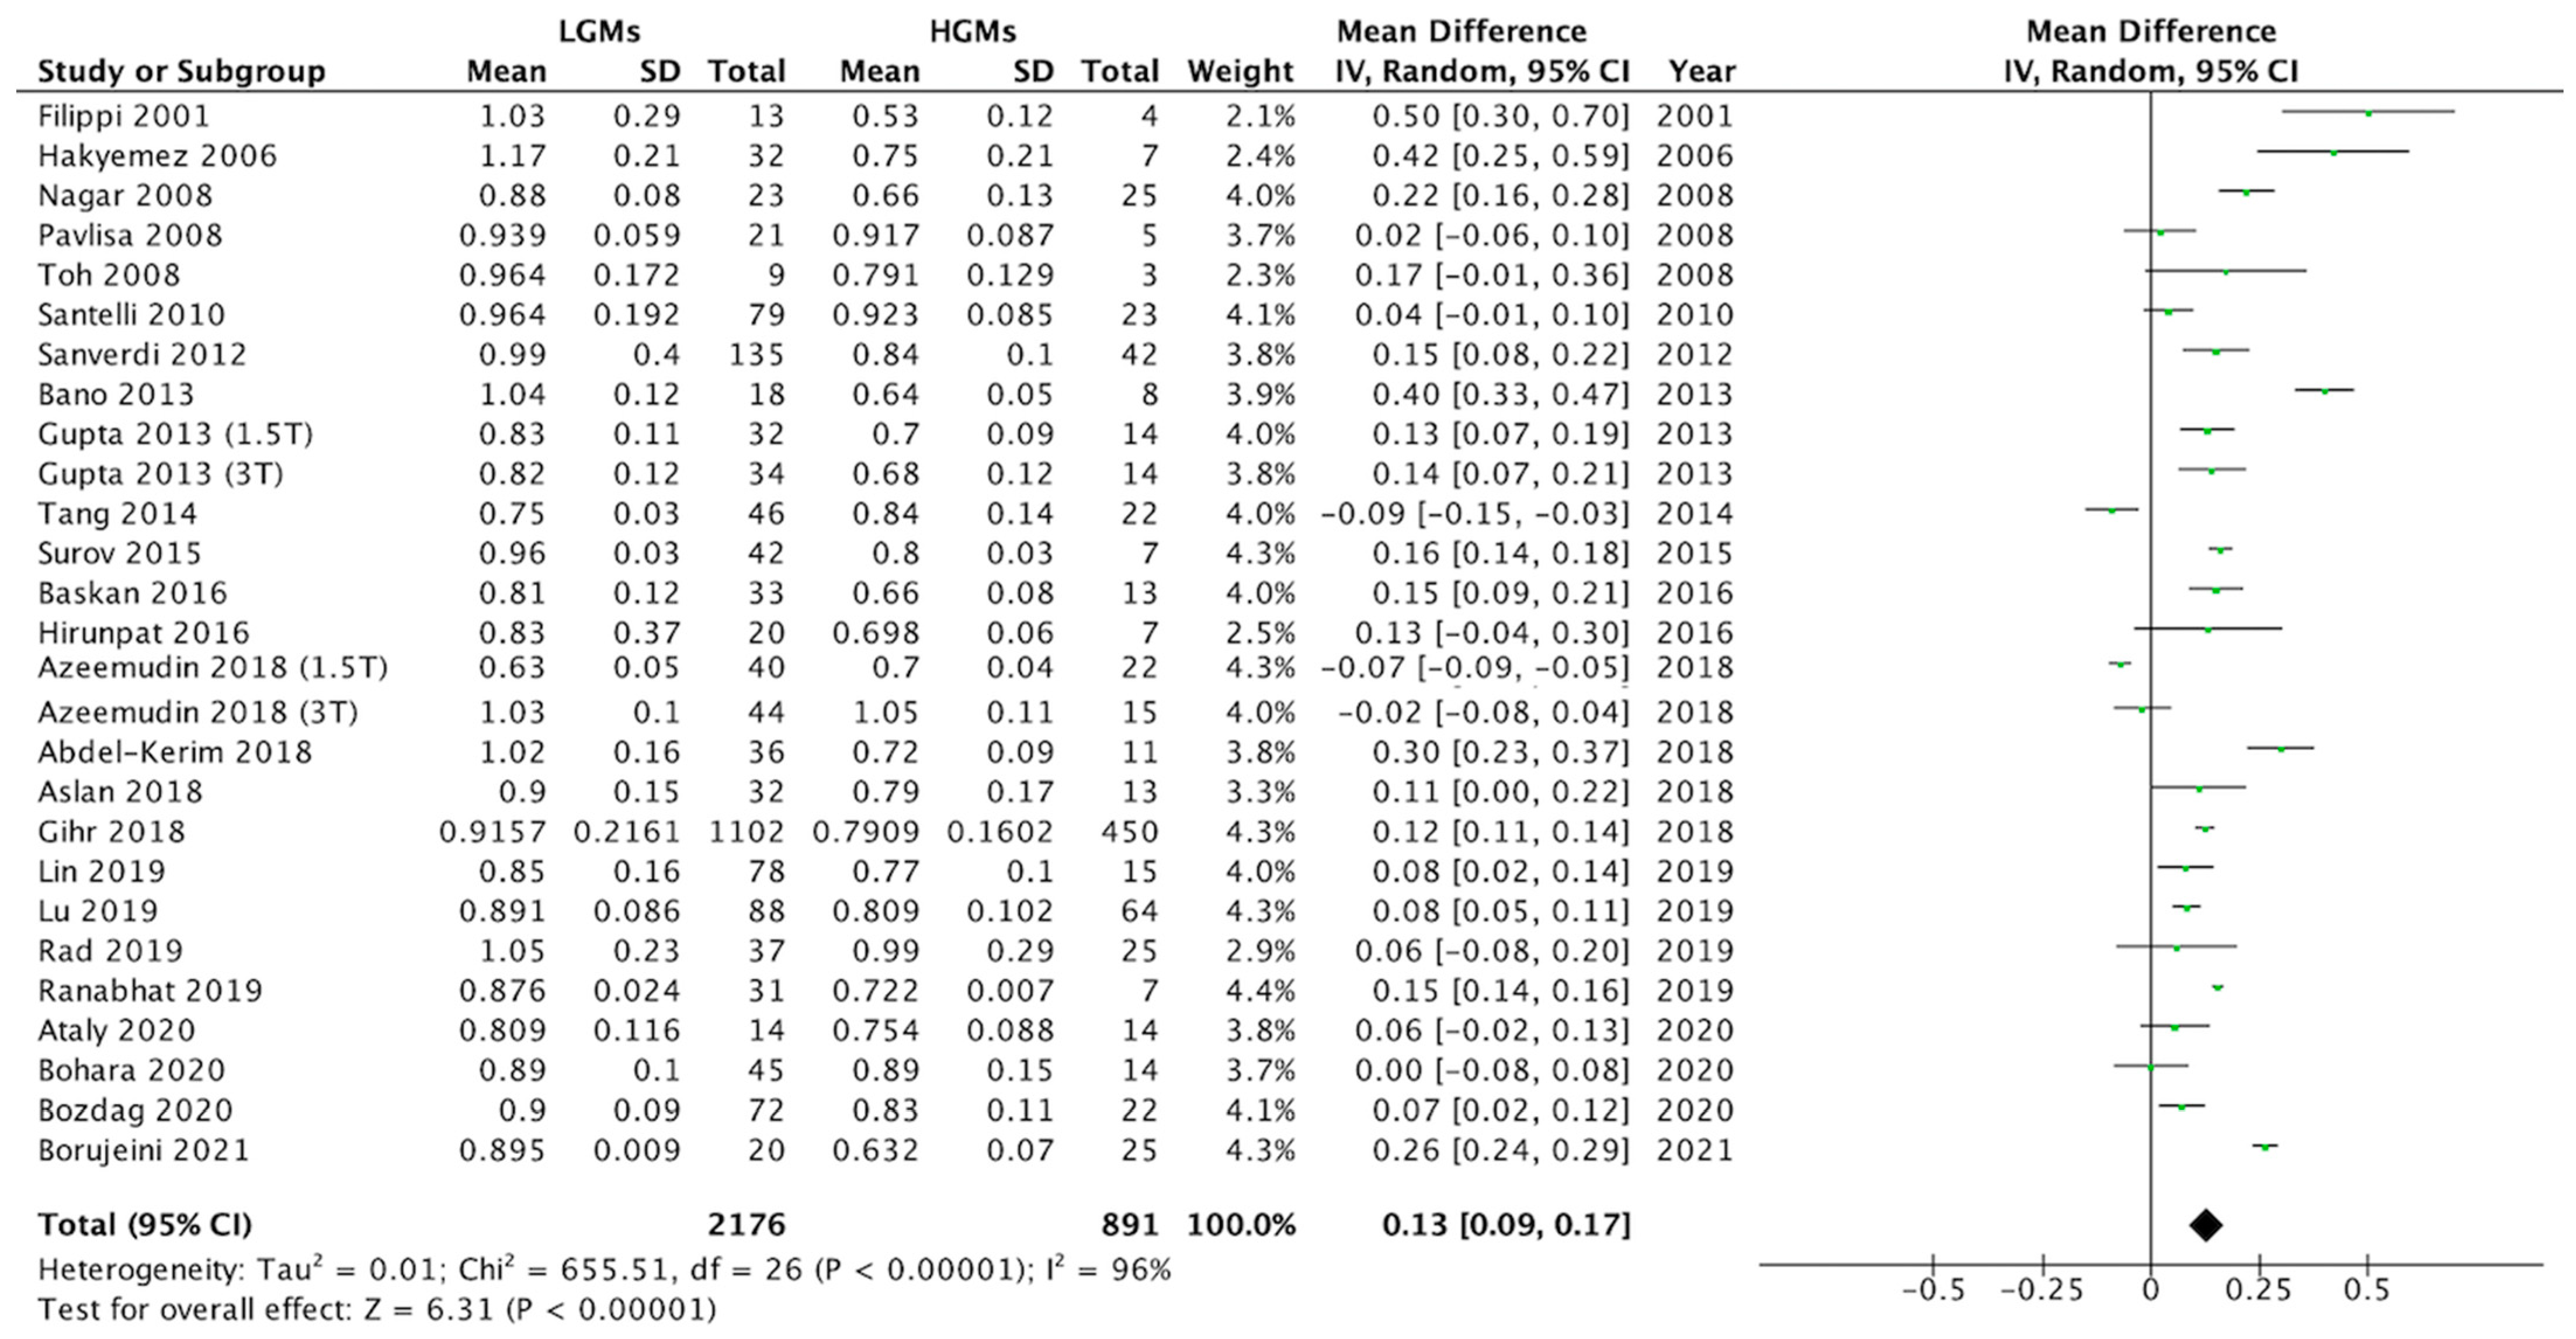
3.2. Differences in ADC Values between LGMs and HGMs

The difference in ADC means of the two groups are summarized in Figure 2. Heterogeneity of the mean ADC values existed among the 25 studies (Q statistic = 655.51, I2 = 96%, p < 0.00001). Pooled differences in mean ADC values (0.13, 95% CI = 0.09 to 0.17) indicated that the ADC values were lower in HGMs than in LGMs (p < 0.00001, Figure 2), with mean values of 0.79 × 10⁻³ mm2/s (95% CI = 0.78 to 0.81) and 0.92 × 10⁻³ mm2/s (95% CI = 0.90 to 0.93), respectively.

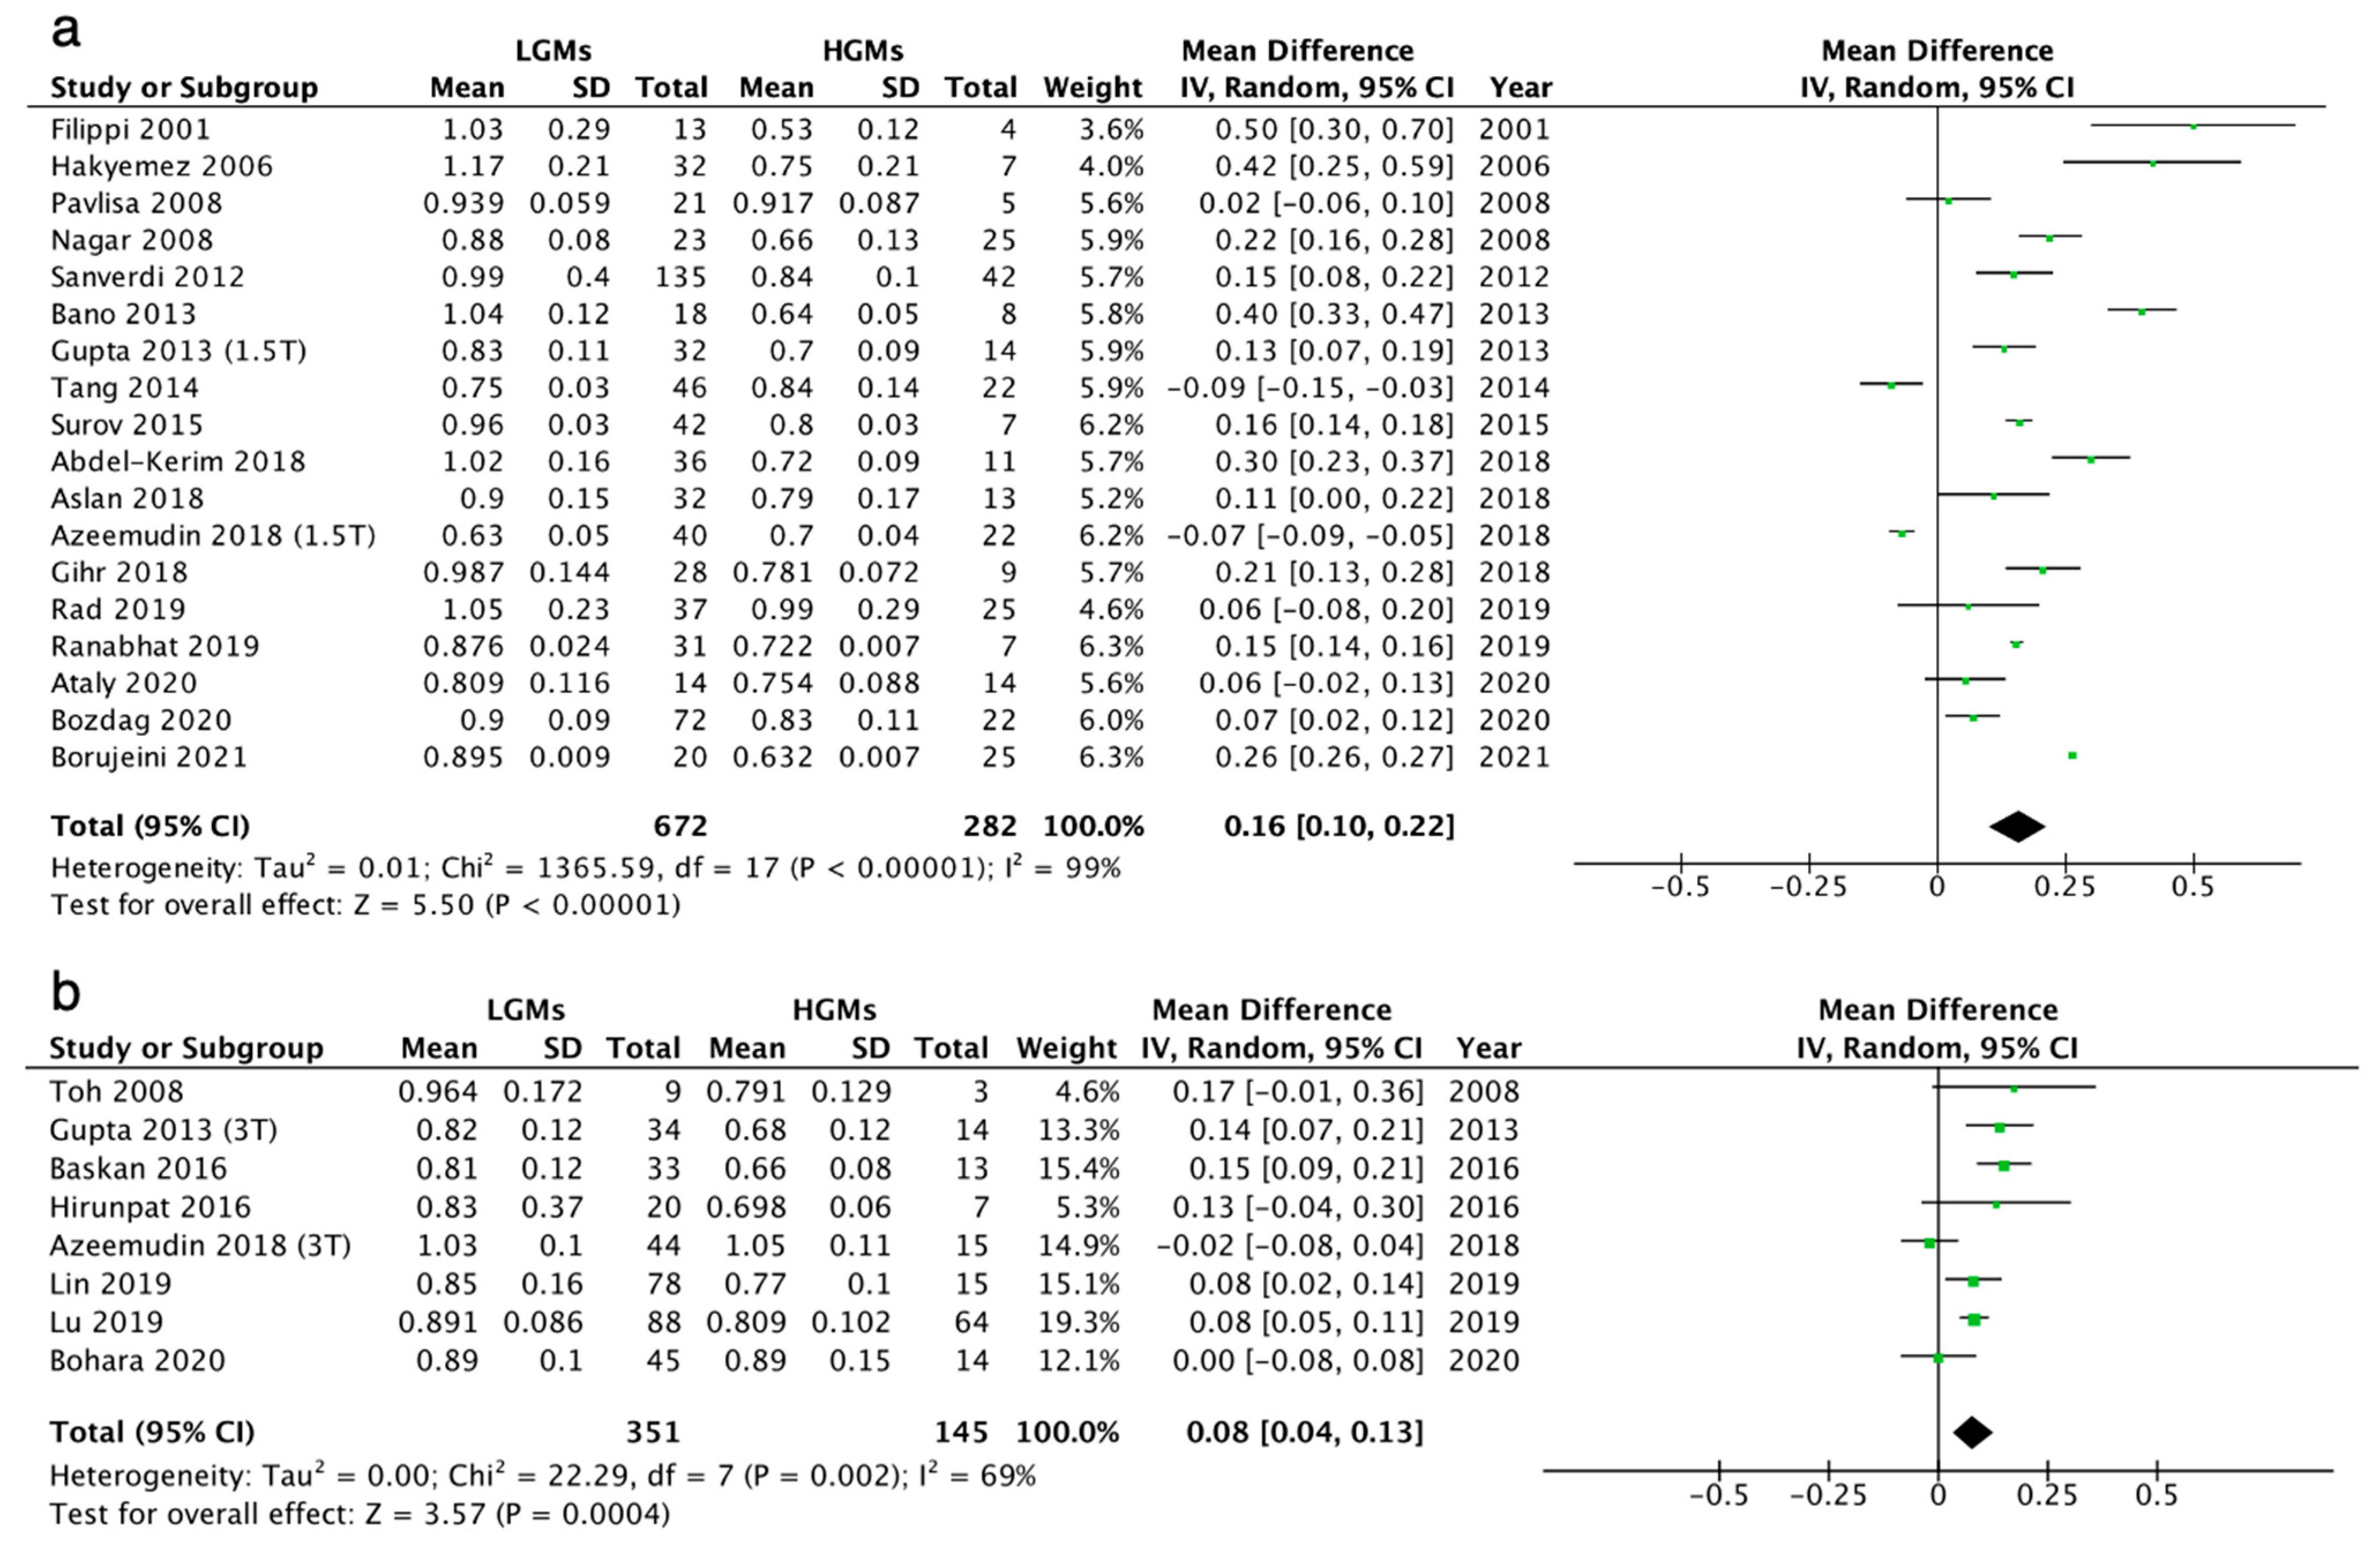
3.3. Subgroup Analysis for 1.5T and 3T MRI Scanners

Both 1.5T and 3T MRI scanners showed significant differences in mean ADC values between LGMs and HGMs (Figure 3). The results of 1.5T MRI scanners showed that LGMs had higher ADC values compared to HGMs (mean difference = 0.16, 95% CI = 0.10 to 0.22, p < 0.00001; I2 = 99%; 16 studies; n = 954) (Figure 3a). Results for 3T MRI scanners also showed that LGMs also had higher ADC values compared to HGMs (mean difference = 0.08, 95% CI = 0.04 to 0.13, p = 0.0004; I2 = 69%; 6 studies; n = 496) (Figure 3b).

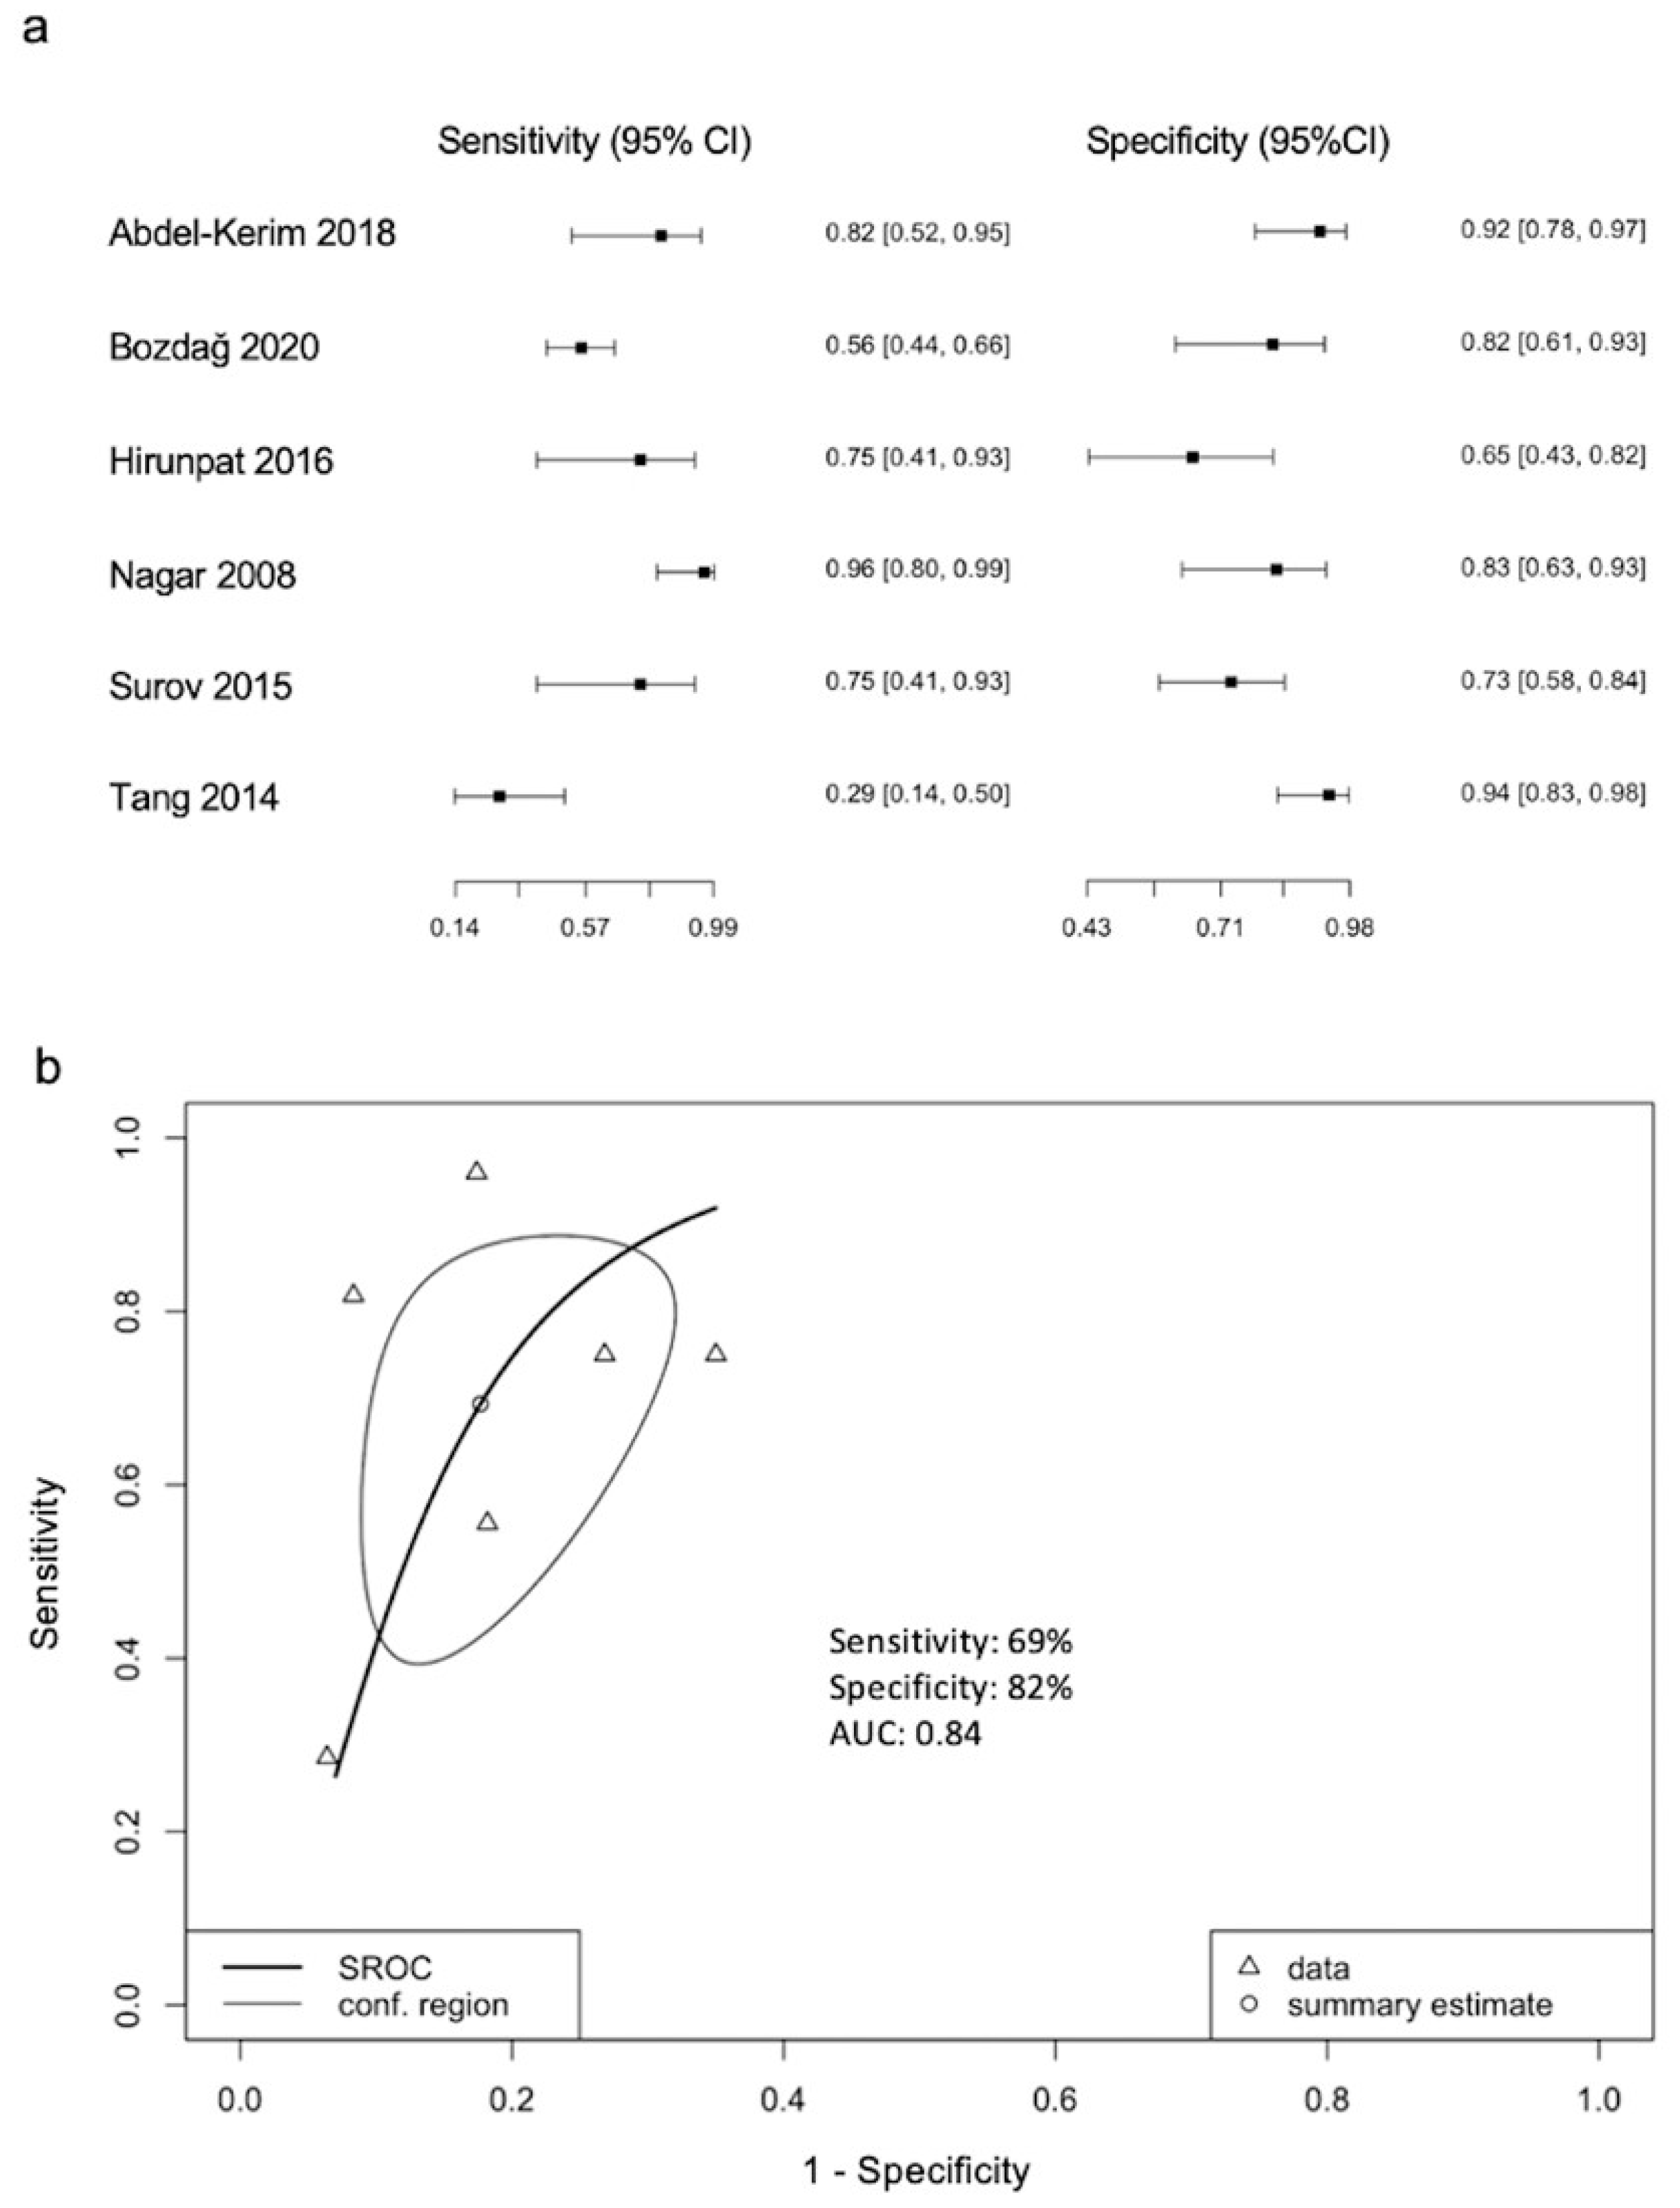
3.4. ADC Threshold Values for Differentiation between LGMs and HGMs

Six of the 25 studies reported threshold ADC values for differentiation between LGMs and HGMs (Table 2) [10,23,29,32,33,37]. The forest plot and sROC curve (Figure 4) of the six studies showed a pooled sensitivity of 69%, specificity of 82%, and AUC of 0.84.

3.5. Correlation Coefficients (r) between Mean ADC and Ki-67

Five studies reported a weak-to-moderate inverse correlation between mean ADC values and Ki-67 index in meningiomas [10,13,23,32,34], with the correlation coefficient ranging from −0.28 to −0.61 (Table 3).

3.6. Quality Assessment and Sensitivity Analysis

The results of quality assessment for all studies included in this meta-analysis are shown in Supplementary Figure S1, and most studies showed an overall low risk of bias. Sensitivity analysis was performed using one-study-removed analysis in which the meta-analysis of the mean ADC values was performed with each study removed in turn (Supplementary Figure S2). Differences between mean ADC values did not vary markedly with the removal of each study, indicating that the data were not overly influenced by each study.

4. Discussion

MRI is widely used for the evaluation of meningioma; however, no broad consensus of conventional MRI findings that can distinguish HGMs from LGMs [42]. The aim of this study was to evaluate the effectiveness of preoperative ADC values for differentiation between low-grade and high-grade meningiomas. The present meta-analysis showed that preoperative mean ADC values were significantly lower in HGMs than in LGMs, and the results were consistent for both 1.5T and 3T MRI scanners. In subgroup analyses, a good AUC was obtained in ADC threshold values for differentiation between LGMs and HGMs. The mean ADC values in different histological LGMs and correlation coefficients (r) between mean ADC and Ki-67 were also presented in this study.
According to the WHO 2016 classification, the grading of meningiomas is based on the mitotic number and the invasive features. WHO grade I meningiomas are characterized by less than four mitotic cells per 10 high power fields (HPF), no brain invasion, and less than three of the following atypical features: increased cellularity, necrosis, prominent nucleoli, sheeting, and the high nuclear-to-cytoplasmic ratio [2]. WHO grade I meningiomas encompass nine histological subtypes, including meningothelial, fibroblastic, transitional, psammomatous, angiomatous, microcystic, secretory, lymphoplasmacyte-rich, and metaplastic meningiomas [43]. In contrast, grade II and III meningiomas are defined as having more mitotic cells (≥4) per 10 HPF, or brain invasion, or with more than three atypical features [2]. Three histological subtypes (choroid, clear-cell, and atypical) were identified in WHO grade II meningiomas, and another three subtypes (papillary, rhabdoid, and anaplastic) were found in WHO grade III meningiomas [43].
The Ki-67 index is an important cellular proliferation marker, and a positive correlation between the Ki-67 index and grading of meningiomas was reported [44]. Moreover, a higher Ki-67 index is associated with poor prognosis and a higher risk of tumor recurrence in meningiomas [45]. ADC values were shown to reflect the microstructural cellularity in many tumors [7]. In fact, some authors reported that ADC values correlated inversely with the Ki-67 proliferation index and are helpful in differentiating low and high-grade meningiomas [10,12,13]. Tang et al. [10] reported an ADC value of 0.84 × 10⁻³ mm2/s and Ki-67 of 2% in LGMs compared with an ADC of 0.75 × 10⁻³ mm2/s and Ki-67 of 9% in HGMs. Five articles in the present meta-analysis reported an association between low ADC value and high Ki-67 in meningiomas [10,13,23,32,34]. Surov et al. [12] reported a threshold ADC value of 0.85 × 10⁻³ mm2/s for differentiating between LGMs and HGMs, with positive predictive value (PPV) and negative predictive value (NPV) of 33% and 97%, respectively. Bozdag et al. [23] reported a higher cut-off value of 0.89 × 10⁻³ mm2/s with PPV and NPV of 91% and 36% in a larger sample size. We first used six different studies to evaluate the diagnostic test accuracy of threshold ADC values for differentiation between LGMs and HGMs, and we obtained excellent accuracy with an AUC of 0.84. Although most studies reported lower ADC values in HGMs, few studies revealed inconsistent findings [10,41]. Tang et al. [10] and Azeemudin et al. [41] reported higher ADC values in HGMs, which may be explained by the significantly higher ADC values in chordoid meningiomas (WHO grade II) among all LGMs and HGMs [46]. The increased ADC values in the chordoid subtype may be caused by the unique histopathologic features of mucoid stroma and vacuolated cytoplasm, leading to a decreased nucleus-to-cytoplasm ratio [46]. Another possible explanation is that the ADC values are influenced both by perfusion and diffusion effects [47]. HGMs usually have a higher degree of blood volume (perfusion), which results in a higher ADC [10,48].
The present study showed consistent results in both 1.5T and 3T MRI scanners, which means the differences in ADC values between LGMs and HGMs are not affected by different magnetic field strengths of MRI. In six articles investigating the ADC values of different histological LGMs, fibroblastic meningiomas showed the lowest mean ADC value, and angiomatous meningiomas showed the highest mean ADC value. For HGMs, no studies in the available literature reported the ADC values in different histological subtypes. Recently, Meyer et al. [20] reported a meta-analysis reviewing studies from two databases (Medline and Scopus) until November 2019, and the results showed that ADC might not accurately predict proliferation potential and cellularity in the meningiomas, and no validated ADC threshold can be recommended for distinguishing LGMs from HGMs. As compared with 1055 patients reported by Meyer et al. [20], the present study collected the latest studies until January 2022 from four databases (Medline, Cochrane, Scopus, Embase), with a total of 1552 meningioma cases. Six extra updated studies (2019–2022) were included in the present meta-analysis. Meyer et al. [20] reported only weak inverse correlations (r = −0.36) existing between ADC and Ki-67 in meningiomas, and significant overlap of ADC values between LGMs and HGMs were observed. In contrast, the present meta-analysis first reported significant differences in ADC values between LGMs and HGMs. In clinical practice, the valuable ADC threshold value for differentiation between LGMs and HGMs was first analyzed in the present study. The discrepancy between the two meta-analyses can be explained by the additional 497 (497/1055, 47.1%) patients collected in the six additional updated studies [14,15,19,21,23,39] in the present meta-analysis and by searching two more databases (Cochrane and Embase). On the other hand, Ugga et al. [49] recently reported a meta-analysis of radiomics and machine learning for the prediction of intracranial meningioma grading based on preoperative MRI, and promising results with an overall pooled AUC of 0.88 was obtained.
Histological grading is the current gold standard in terms of diagnosing and treating meningiomas [50]. Surgery is the classical first-line treatment for all meningiomas. However, a wait-and-see strategy monitored by clinical and MRI follow-up should be considered since most meningiomas (80%) are benign tumors with stable disease status. For LGMs, the aim of surgery may be the relief of the clinical symptoms caused by mass effects. Postoperative adjuvant radiotherapy should be used more conservatively because all radiotherapeutic procedures have long-term side effects and might affect future treatments [51]. However, WHO grade II and III meningiomas are aggressive tumors with high recurrence rates, and aggressive tumor resection during primary surgery combined with adjuvant radiotherapy of the tumor area may be more beneficial for these patients [3,52]. The present study is the first to report significant differences in ADC values between LGMs and HGMs in a meta-analysis with large case numbers. The results provided valuable information for the preoperative diagnosis and planning of treatments in meningiomas.
There are still several limitations in our study. First, publication bias may exist because studies with negative results were less likely to be published and were therefore not included in the meta-analysis. The automatically calculated ADC values may be affected by different vendors, applied b-values, and regions of interest (ROIs) (i.e., single ROI or whole tumor measurement). The overall diagnostic test accuracy of ADC threshold values for differentiation between LGMs and HGMs cannot be obtained due to the lack of comprehensive raw data in each study. Finally, the association between ADC and cellularity in meningiomas was not determined because the updated data reflecting new concepts were not sufficient.

5. Conclusions

The present meta-analysis revealed that mean ADC values are significantly lower in HGMs than in LGMs in both 1.5T and 3T MRI scanners. The threshold ADC values also showed excellent accuracy for differentiation between LGMs and HGMs in subgroup analysis. Therefore, preoperative ADC appears to be a useful noninvasive tool for differentiation between LGMs and HGMs. The results of this study have the potential to offer valuable information for the planning of treatments in meningiomas, including the extent of tumor resection, implementation of adjuvant radiotherapy, and the appropriate time intervals for MRI follow-up.

Supplementary Materials

The following are available online at https://www.mdpi.com/article/10.3390/diagnostics12030630/s1: Supplementary Figure S1: Quality assessment of all included studies. Supplementary Figure S2: Sensitivity study.

Author Contributions

Conceptualization, C.-C.K.; methodology, Y.-T.T. and K.-C.H.; software, Y.-J.S.; validation, S.-W.L.; formal analysis, C.-C.Y.; investigation, C.-C.K.; resources, C.-C.K.; data curation, C.-C.K.; writing—original draft preparation, C.-C.K. and Y.-T.T.; writing—review and editing, C.-C.K. and Y.-T.K.; visualization, J.-H.C.; supervision, Y.-T.K.; project administration, C.-C.K.; funding acquisition, C.-C.K. All authors have read and agreed to the published version of the manuscript.

Funding

This research was funded by the Ministry of Science and Technology (MOST) in Taiwan (MOST 109–2314-B-384–010-MY2) and Chi Mei Medical Center, Tainan, Taiwan (No. CMFHR 11088 and 11105). The funders had no role in study design, data collection and analysis, decision to publish, or preparation of the manuscript.

Institutional Review Board Statement

Not applicable.

Informed Consent Statement

Not applicable.

Data Availability Statement

The original contributions presented in the study are included in the article and Supplementary Materials. Further inquiries can be directed to the corresponding author.

Conflicts of Interest

The authors declare no conflict of interest.

References

  1. Ostrom, Q.T.; Patil, N.; Cioffi, G.; Waite, K.; Kruchko, C.; Barnholtz-Sloan, J.S. CBTRUS Statistical Report: Primary Brain and Other Central Nervous System Tumors Diagnosed in the United States in 2013–2017. Neuro Oncol. 2020, 22, iv1–iv96. [Google Scholar] [CrossRef] [PubMed]
  2. Louis, D.N.; Perry, A.; Reifenberger, G.; von Deimling, A.; Figarella-Branger, D.; Cavenee, W.K.; Ohgaki, H.; Wiestler, O.D.; Kleihues, P.; Ellison, D.W. The 2016 World Health Organization Classification of Tumors of the Central Nervous System: A summary. Acta Neuropathol. 2016, 131, 803–820. [Google Scholar] [CrossRef] [PubMed] [Green Version]
  3. Durand, A.; Labrousse, F.; Jouvet, A.; Bauchet, L.; Kalamarides, M.; Menei, P.; Deruty, R.; Moreau, J.J.; Fevre-Montange, M.; Guyotat, J. WHO grade II and III meningiomas: A study of prognostic factors. J. Neurooncol. 2009, 95, 367–375. [Google Scholar] [CrossRef] [PubMed]
  4. van Alkemade, H.; de Leau, M.; Dieleman, E.M.T.; Kardaun, J.W.P.F.; van Os, R.; Vandertop, W.P.; van Furth, W.R.; Stalpers, L.J.A. Impaired survival and long-term neurological problems in benign meningioma. Neuro-Oncology 2012, 14, 658–666. [Google Scholar] [CrossRef] [PubMed]
  5. Buerki, R.A.; Horbinski, C.M.; Kruser, T.; Horowitz, P.M.; James, C.D.; Lukas, R.V. An overview of meningiomas. Future Oncol. 2018, 14, 2161–2177. [Google Scholar] [CrossRef]
  6. Kaur, G.; Sayegh, E.T.; Larson, A.; Bloch, O.; Madden, M.; Sun, M.Z.; Barani, I.J.; James, C.D.; Parsa, A.T. Adjuvant radiotherapy for atypical and malignant meningiomas: A systematic review. Neuro-Oncology 2014, 16, 628–636. [Google Scholar] [CrossRef] [Green Version]
  7. Padhani, A.R.; Liu, G.; Koh, D.M.; Chenevert, T.L.; Thoeny, H.C.; Takahara, T.; Dzik-Jurasz, A.; Ross, B.D.; Van Cauteren, M.; Collins, D.; et al. Diffusion-weighted magnetic resonance imaging as a cancer biomarker: Consensus and recommendations. Neoplasia 2009, 11, 102–125. [Google Scholar] [CrossRef] [Green Version]
  8. Le Bihan, D.; Iima, M. Diffusion Magnetic Resonance Imaging: What Water Tells Us about Biological Tissues. PLoS Biol. 2015, 13, e1002203. [Google Scholar] [CrossRef]
  9. Yamasaki, F.; Kurisu, K.; Satoh, K.; Arita, K.; Sugiyama, K.; Ohtaki, M.; Takaba, J.; Tominaga, A.; Hanaya, R.; Yoshioka, H.; et al. Apparent Diffusion Coefficient of Human Brain Tumors at MR Imaging. Radiology 2005, 235, 985–991. [Google Scholar] [CrossRef]
  10. Tang, Y.; Dundamadappa, S.K.; Thangasamy, S.; Flood, T.; Moser, R.; Smith, T.; Cauley, K.; Takhtani, D. Correlation of apparent diffusion coefficient with Ki-67 proliferation index in grading meningioma. AJR Am. J. Roentgenol. 2014, 202, 1303–1308. [Google Scholar] [CrossRef]
  11. Filippi, C.G.; Edgar, M.A.; Uluǧ, A.M.; Prowda, J.C.; Heier, L.A.; Zimmerman, R.D. Appearance of Meningiomas on Diffusion-weighted Images: Correlating Diffusion Constants with Histopathologic Findings. AJNR Am. J. Neuroradiol. 2001, 22, 65–72. [Google Scholar] [PubMed]
  12. Surov, A.; Ginat, D.T.; Sanverdi, E.; Lim, C.C.T.; Hakyemez, B.; Yogi, A.; Cabada, T.; Wienke, A. Use of Diffusion Weighted Imaging in Differentiating Between Maligant and Benign Meningiomas. A Multicenter Analysis. World Neurosurg. 2016, 88, 598–602. [Google Scholar] [CrossRef] [PubMed]
  13. Baskan, O.; Silav, G.; Bolukbasi, F.H.; Canoz, O.; Geyik, S.; Elmaci, I. Relation of apparent diffusion coefficient with Ki-67 proliferation index in meningiomas. Br. J. Radiol. 2016, 89, 20140842. [Google Scholar] [CrossRef] [PubMed] [Green Version]
  14. Ranabhat, K.; Bishokarma, S.; Agrawal, P.; Shrestha, P.; Panth, R.; Ghimire, R.K. Role of MR Morphology and Diffusion-Weighted Imaging in the Evaluation of Meningiomas: Radio-Pathologic Correlation. JNMA J. Nepal Med. Assoc. 2019, 57, 37–44. [Google Scholar] [CrossRef]
  15. Haghighi Borujeini, M.; Farsizaban, M.; Yazdi, S.R.; Tolulope Agbele, A.; Ataei, G.; Saber, K.; Hosseini, S.M.; Abedi-Firouzjah, R. Grading of meningioma tumors based on analyzing tumor volumetric histograms obtained from conventional MRI and apparent diffusion coefficient images. Egypt. J. Radiol. Nucl. Med. 2021, 52, 167. [Google Scholar] [CrossRef]
  16. Sanverdi, S.E.; Ozgen, B.; Oguz, K.K.; Mut, M.; Dolgun, A.; Soylemezoglu, F.; Cila, A. Is diffusion-weighted imaging useful in grading and differentiating histopathological subtypes of meningiomas? Eur. J. Radiol. 2012, 81, 2389–2395. [Google Scholar] [CrossRef]
  17. Santelli, L.; Ramondo, G.; Della Puppa, A.; Ermani, M.; Scienza, R.; d’Avella, D.; Manara, R. Diffusion-weighted imaging does not predict histological grading in meningiomas. Acta Neurochir. 2010, 152, 1315–1319. [Google Scholar] [CrossRef]
  18. Yiping, L.; Kawai, S.; Jianbo, W.; Li, L.; Daoying, G.; Bo, Y. Evaluation parameters between intra-voxel incoherent motion and diffusion-weighted imaging in grading and differentiating histological subtypes of meningioma: A prospective pilot study. J. Neurol. Sci. 2017, 372, 60–69. [Google Scholar] [CrossRef]
  19. Rad, H.S.; Safari, M.; Kazerooni, A.F.; Moharamzad, Y.; Taheri, M. Apparent Diffusion Coefficient (ADC) and First-Order Histogram Statistics in Differentiating Malignant Versus Benign Meningioma in Adults. Iran. J. Radiol. 2018, 16, e74324. [Google Scholar]
  20. Meyer, H.J.; Wienke, A.; Surov, A. ADC values of benign and high grade meningiomas and associations with tumor cellularity and proliferation—A systematic review and meta-analysis. J. Neurol. Sci. 2020, 415, 116975. [Google Scholar] [CrossRef]
  21. Atalay, B.; Ediz, S.S.; Ozbay, N.O. Apparent Diffusion Coefficient in Predicting the Preoperative Grade of Meningiomas. J. Coll. Physicians Surg. Pak. 2020, 30, 1126–1132. [Google Scholar] [CrossRef] [PubMed]
  22. Bohara, M.; Nakajo, M.; Kamimura, K.; Yoneyama, T.; Fukukura, Y.; Kiyao, Y.; Yonezawa, H.; Higa, N.; Kirishima, M.; Yoshiura, T. Histological Grade of Meningioma: Prediction by Intravoxel Incoherent Motion Histogram Parameters. Acad. Radiol. 2020, 27, 342–353. [Google Scholar] [CrossRef] [PubMed]
  23. Bozdag, M.; Er, A.; Ekmekci, S. Association of apparent diffusion coefficient with Ki-67 proliferation index, progesterone- receptor status and various histopathological parameters, and its utility in predicting the high grade in meningiomas. Acta Radiol. 2021, 62, 401–413. [Google Scholar] [CrossRef] [PubMed]
  24. Page, M.J.; McKenzie, J.E.; Bossuyt, P.M.; Boutron, I.; Hoffmann, T.C.; Mulrow, C.D.; Shamseer, L.; Tetzlaff, J.M.; Akl, E.A.; Brennan, S.E.; et al. The PRISMA 2020 statement: An updated guideline for reporting systematic reviews. BMJ 2021, 372, n71. [Google Scholar] [CrossRef]
  25. Whiting, P.F.; Rutjes, A.W.; Westwood, M.E.; Mallett, S.; Deeks, J.J.; Reitsma, J.B.; Leeflang, M.M.; Sterne, J.A.; Bossuyt, P.M. QUADAS-2: A revised tool for the quality assessment of diagnostic accuracy studies. Ann. Intern. Med. 2011, 155, 529–536. [Google Scholar] [CrossRef]
  26. Reitsma, J.B.; Glas, A.S.; Rutjes, A.W.; Scholten, R.J.; Bossuyt, P.M.; Zwinderman, A.H. Bivariate analysis of sensitivity and specificity produces informative summary measures in diagnostic reviews. J. Clin. Epidemiol. 2005, 58, 982–990. [Google Scholar] [CrossRef]
  27. Harbord, R.M.; Deeks, J.J.; Egger, M.; Whiting, P.; Sterne, J.A. A unification of models for meta-analysis of diagnostic accuracy studies. Biostatistics 2007, 8, 239–251. [Google Scholar] [CrossRef] [Green Version]
  28. Hakyemez, B.; Yildirim, N.; Gokalp, G.; Erdogan, C.; Parlak, M. The contribution of diffusion-weighted MR imaging to distinguishing typical from atypical meningiomas. Neuroradiology 2006, 48, 513–520. [Google Scholar] [CrossRef]
  29. Nagar, V.A.; Ye, J.R.; Ng, W.H.; Chan, Y.H.; Hui, F.; Lee, C.K.; Lim, C.C. Diffusion-weighted MR imaging: Diagnosing atypical or malignant meningiomas and detecting tumor dedifferentiation. AJNR Am. J. Neuroradiol. 2008, 29, 1147–1152. [Google Scholar] [CrossRef] [Green Version]
  30. Pavlisa, G.; Rados, M.; Pazanin, L.; Padovan, R.S.; Ozretic, D.; Pavlisa, G. Characteristics of typical and atypical meningiomas on ADC maps with respect to schwannomas. Clin. Imaging 2008, 32, 22–27. [Google Scholar] [CrossRef]
  31. Bano, S.; Waraich, M.M.; Khan, M.A.; Buzdar, S.A.; Manzur, S. Diagnostic value of apparent diffusion coefficient for the accurate assessment and differentiation of intracranial meningiomas. Acta Radiol. Short Rep. 2013, 2, 2047981613512484. [Google Scholar] [CrossRef] [PubMed]
  32. Surov, A.; Gottschling, S.; Mawrin, C.; Prell, J.; Spielmann, R.P.; Wienke, A.; Fiedler, E. Diffusion-Weighted Imaging in Meningioma: Prediction of Tumor Grade and Association with Histopathological Parameters. Transl. Oncol. 2015, 8, 517–523. [Google Scholar] [CrossRef] [PubMed] [Green Version]
  33. Abdel-Kerim, A.; Shehata, M.; El Sabaa, B.; Fadel, S.; Heikal, A.; Mazloum, Y. Differentiation between benign and atypical cranial Meningiomas. Can ADC measurement help? MRI findings with hystopathologial correlation. Egypt. J. Radiol. Nucl. Med. 2018, 49, 172–175. [Google Scholar] [CrossRef]
  34. Gihr, G.A.; Horvath-Rizea, D.; Garnov, N.; Kohlhof-Meinecke, P.; Ganslandt, O.; Henkes, H.; Meyer, H.J.; Hoffmann, K.T.; Surov, A.; Schob, S. Diffusion Profiling via a Histogram Approach Distinguishes Low-grade from High-grade Meningiomas, Can Reflect the Respective Proliferative Potential and Progesterone Receptor Status. Mol. Imaging Biol. 2018, 20, 632–640. [Google Scholar] [CrossRef] [PubMed]
  35. Aslan, K.; Gunbey, H.P.; Tomak, L.; Incesu, L. The diagnostic value of using combined MR diffusion tensor imaging parameters to differentiate between low- and high-grade meningioma. Br. J. Radiol. 2018, 91, 20180088. [Google Scholar] [CrossRef] [PubMed]
  36. Toh, C.H.; Castillo, M.; Wong, A.M.; Wei, K.C.; Wong, H.F.; Ng, S.H.; Wan, Y.L. Differentiation between classic and atypical meningiomas with use of diffusion tensor imaging. AJNR Am. J. Neuroradiol. 2008, 29, 1630–1635. [Google Scholar] [CrossRef] [Green Version]
  37. Hirunpat, S.; Sanghan, N.; Watcharakul, C.; Kayasut, K.; Ina, N.; Pornrujee, H. Is Apparent Diffusion Coefficient Value Measured on Picture Archiving and Communication System Workstation Helpful in Prediction of High-grade Meningioma? Hong Kong J. Radiol. 2016, 19, 84–90. [Google Scholar] [CrossRef]
  38. Lin, L.; Xue, Y.; Duan, Q.; Chen, X.; Chen, H.; Jiang, R.; Zhong, T.; Xu, G.; Geng, D.; Zhang, J. Grading meningiomas using mono-exponential, bi-exponential and stretched exponential model-based diffusion-weighted MR imaging. Clin. Radiol. 2019, 74, 651.e15–651.e23. [Google Scholar] [CrossRef]
  39. Lu, Y.; Liu, L.; Luan, S.; Xiong, J.; Geng, D.; Yin, B. The diagnostic value of texture analysis in predicting WHO grades of meningiomas based on ADC maps: An attempt using decision tree and decision forest. Eur. Radiol. 2019, 29, 1318–1328. [Google Scholar] [CrossRef]
  40. Gupta, A.; Prabhu, S.M.; Sureka, J.; Chacko, G. Role of diffusion weighted MRI in differentiating typical from atypical meningiomas at 1.5 and 3T MRI. Egypt. J. Radiol. Nucl. Med. 2013, 44, 635–640. [Google Scholar] [CrossRef] [Green Version]
  41. Azeemuddin, M.; Nizamani, W.M.; Tariq, M.U.; Wasay, M. Role of ADC values and ratios of MRI scan in differentiating typical from atypical/anaplastic meningiomas. J. Pak. Med. Assoc. 2018, 68, 1403–1406. [Google Scholar] [PubMed]
  42. Weber, D.C.; Lovblad, K.O.; Rogers, L. New pathology classification, imagery techniques and prospective trials for meningiomas: The future looks bright. Curr. Opin. Neurol. 2010, 23, 563–570. [Google Scholar] [CrossRef] [PubMed]
  43. Bhat, A.R.; Wani, M.A.; Kirmani, A.R.; Ramzan, A.U. Histological-subtypes and anatomical location correlated in meningeal brain tumors (meningiomas). J. Neurosci. Rural Pract. 2014, 5, 244–249. [Google Scholar] [CrossRef] [PubMed]
  44. Babu, S.; Uppin, S.G.; Uppin, M.S.; Panigrahi, M.K.; Saradhi, V.; Bhattacharjee, S.; Sahu, B.P.; Purohit, A.K.; Challa, S. Meningiomas: Correlation of Ki67 with histological grade. Neurol. India 2011, 59, 204–207. [Google Scholar] [CrossRef] [PubMed]
  45. Abry, E.; Thomassen, I.O.; Salvesen, O.O.; Torp, S.H. The significance of Ki-67/MIB-1 labeling index in human meningiomas: A literature study. Pathol. Res. Pract. 2010, 206, 810–815. [Google Scholar] [CrossRef]
  46. Pond, J.B.; Morgan, T.G.; Hatanpaa, K.J.; Yetkin, Z.F.; Mickey, B.E.; Mendelsohn, D.B. Chordoid Meningioma: Differentiating a Rare World Health Organization Grade II Tumor from Other Meningioma Histologic Subtypes Using MRI. AJNR Am. J. Neuroradiol. 2015, 36, 1253–1258. [Google Scholar] [CrossRef] [Green Version]
  47. Cohen, A.D.; LaViolette, P.S.; Prah, M.; Connelly, J.; Malkin, M.G.; Rand, S.D.; Mueller, W.M.; Schmainda, K.M. Effects of perfusion on diffusion changes in human brain tumors. J. Magn. Reson. Imaging 2013, 38, 868–875. [Google Scholar] [CrossRef] [Green Version]
  48. Marosi, C.; Hassler, M.; Roessler, K.; Reni, M.; Sant, M.; Mazza, E.; Vecht, C. Meningioma. Crit. Rev. Oncol. Hematol. 2008, 67, 153–171. [Google Scholar] [CrossRef]
  49. Ugga, L.; Perillo, T.; Cuocolo, R.; Stanzione, A.; Romeo, V.; Green, R.; Cantoni, V.; Brunetti, A. Meningioma MRI radiomics and machine learning: Systematic review, quality score assessment, and meta-analysis. Neuroradiology 2021, 63, 1293–1304. [Google Scholar] [CrossRef]
  50. Apra, C.; Peyre, M.; Kalamarides, M. Current treatment options for meningioma. Expert Rev. Neurother. 2018, 18, 241–249. [Google Scholar] [CrossRef]
  51. Stafford, S.L.; Pollock, B.E.; Foote, R.L.; Link, M.J.; Gorman, D.A.; Schomberg, P.J.; Leavitt, J.A. Meningioma radiosurgery: Tumor control, outcomes, and complications among 190 consecutive patients. Neurosurgery 2001, 49, 1029–1037. [Google Scholar] [PubMed]
  52. Walcott, B.P.; Nahed, B.V.; Brastianos, P.K.; Loeffler, J.S. Radiation Treatment for WHO Grade II and III Meningiomas. Front. Oncol. 2013, 3, 227. [Google Scholar] [CrossRef] [PubMed] [Green Version]
Figure 1. PRISMA flowchart for study selection.
Diagnostics 12 00630 g001
Figure 2. Forest plot for the pooled difference in mean ADC values between LGMs and HGMs. The pooled difference in mean ADC was 0.13 (95% CI = 0.08 to 0.17, p < 0.00001).
Diagnostics 12 00630 g002
Figure 3. Forest plot for the pooled differences in mean ADC values between LGMs and HGMs in (a) 1.5T and (b) 3T MRI scanners. The pooled differences were 0.16 and 0.08, respectively (p < 0.001).
Diagnostics 12 00630 g003
Figure 4. The (a) forest plot and (b) summary ROC curve in diagnostic test accuracy of ADC threshold values for differentiation between LGMs and HGMs. Pooled sensitivity of 69%, specificity of 82%, and AUC of 0.84 are obtained.
Diagnostics 12 00630 g004
Table 1. Baseline characteristics of the 25 studies included in the meta-analysis.
StudyStudy DesignMRIROIb ValueLGMs HGMs
Tesla (s/mm2)NumbersMean ADCSDNumbersMean ADCSD
(×10−3 mm2/s) (×10−3 mm2/s)
Filippi (2001)Prospective1.5TSingle0,1000131.030.2940.530.12
Hakyemez (2006)Prospective1.5TSingle0,1000321.170.2170.750.21
Nagar (2008)Retrospective1.5TSingle0,1000230.880.08250.660.13
Pavlisa (2008)Prospective1.5TSingle0,500,1000210.940.0650.920.09
Toh (2008)Prospective3TSingle0,100090.960.1730.790.13
Santelli (2010)Retrospective1TSingle0,800790.960.19230.920.09
Sanverdi (2012)Retrospective1.5TSingle0,500,10001350.990.4420.840.10
Bano (2013)Prospective1.5TSingle0,1000,2000181.040.1280.640.05
Gupta (2013)Retrospective1.5TSingle0,1000320.830.11140.700.09
3TSingle0,1000340.820.12140.680.12
Tang (2014)Retrospective1.5TSingle0,1000460.750.03220.840.14
Surov (2015)Retrospective1.5TWhole0,1000420.960.0370.800.03
Baskan (2016)Retrospective3TSingle0,1000330.810.12130.660.08
Hirunpat (2016)Retrospective3TSingle0,1000200.830.3770.700.06
Abdel-Kerim (2018)Prospective1.5TSingle0,1000361.020.16110.720.09
Aslan (2018)Retrospective1.5TSingle0,1000320.900.15130.790.17
Azeemudin (2018)Retrospective1.5TSingle0,1000400.630.05220.700.04
3TSingle0,1000441.030.10151.050.11
Gihr (2018)Retrospective1.5TWhole0,1000280.990.1490.780.07
Lin (2019)Prospective3TSingle0,1000780.850.16150.770.10
Lu (2019)Retrospective3TSingle0,1000880.890.09640.810.10
Rad (2019)Retrospective1.5TWhole0,1000371.050.23250.990.29
Ranabhat (2019)Retrospective1.5TSingle0,90,1000310.880.0270.720.01
Ataly (2020)Retrospective1.5TSingle0,1000140.810.12140.750.09
Bohara (2020)Retrospective3TWhole0,1000450.890.10140.890.15
Bozdag (2020)Retrospective1.5TSingle0,1000720.900.09220.830.11
Borujeini (2021)Retrospective1.5TWhole0,500,1000200.900.01250.630.01
159
Table 2. ADC threshold values for differentiation between LGMs and HGMs.
StudyADC Threshold Values
(×10−3 mm2/s)
Sensitivity (%)Specificity (%)PPV (%)NPV (%)
Nagar (2008) 0.8096828695
Tang (2014)0.7029946775
Surov (2015)0.8573733397
Hirunpat (2016)0.8075654687
Abdel-Kerim (2018)0.7981927594
Bozdag (2020)0.8956829136
PPV: positive predictive value. NPV: negative predictive value.
Table 3. Correlation coefficients (r) between mean ADC and Ki-67.
Studyr
Tang (2014)−0.34
Surov (2015)−0.61
Baskan (2016)−0.33
Gihr (2018)−0.32
Bozdag (2020)−0.29
Publisher’s Note: MDPI stays neutral with regard to jurisdictional claims in published maps and institutional affiliations.

