

Ensemble Learning Based on Hybrid Deep Learning Model for Heart Disease Early Prediction
 , , ,
, , ,
Abstract
:1. Introduction
- We proposed two hybrid models with heterogeneous architectures: CNN-LSTM and CNN-GRU were proposed and optimized.
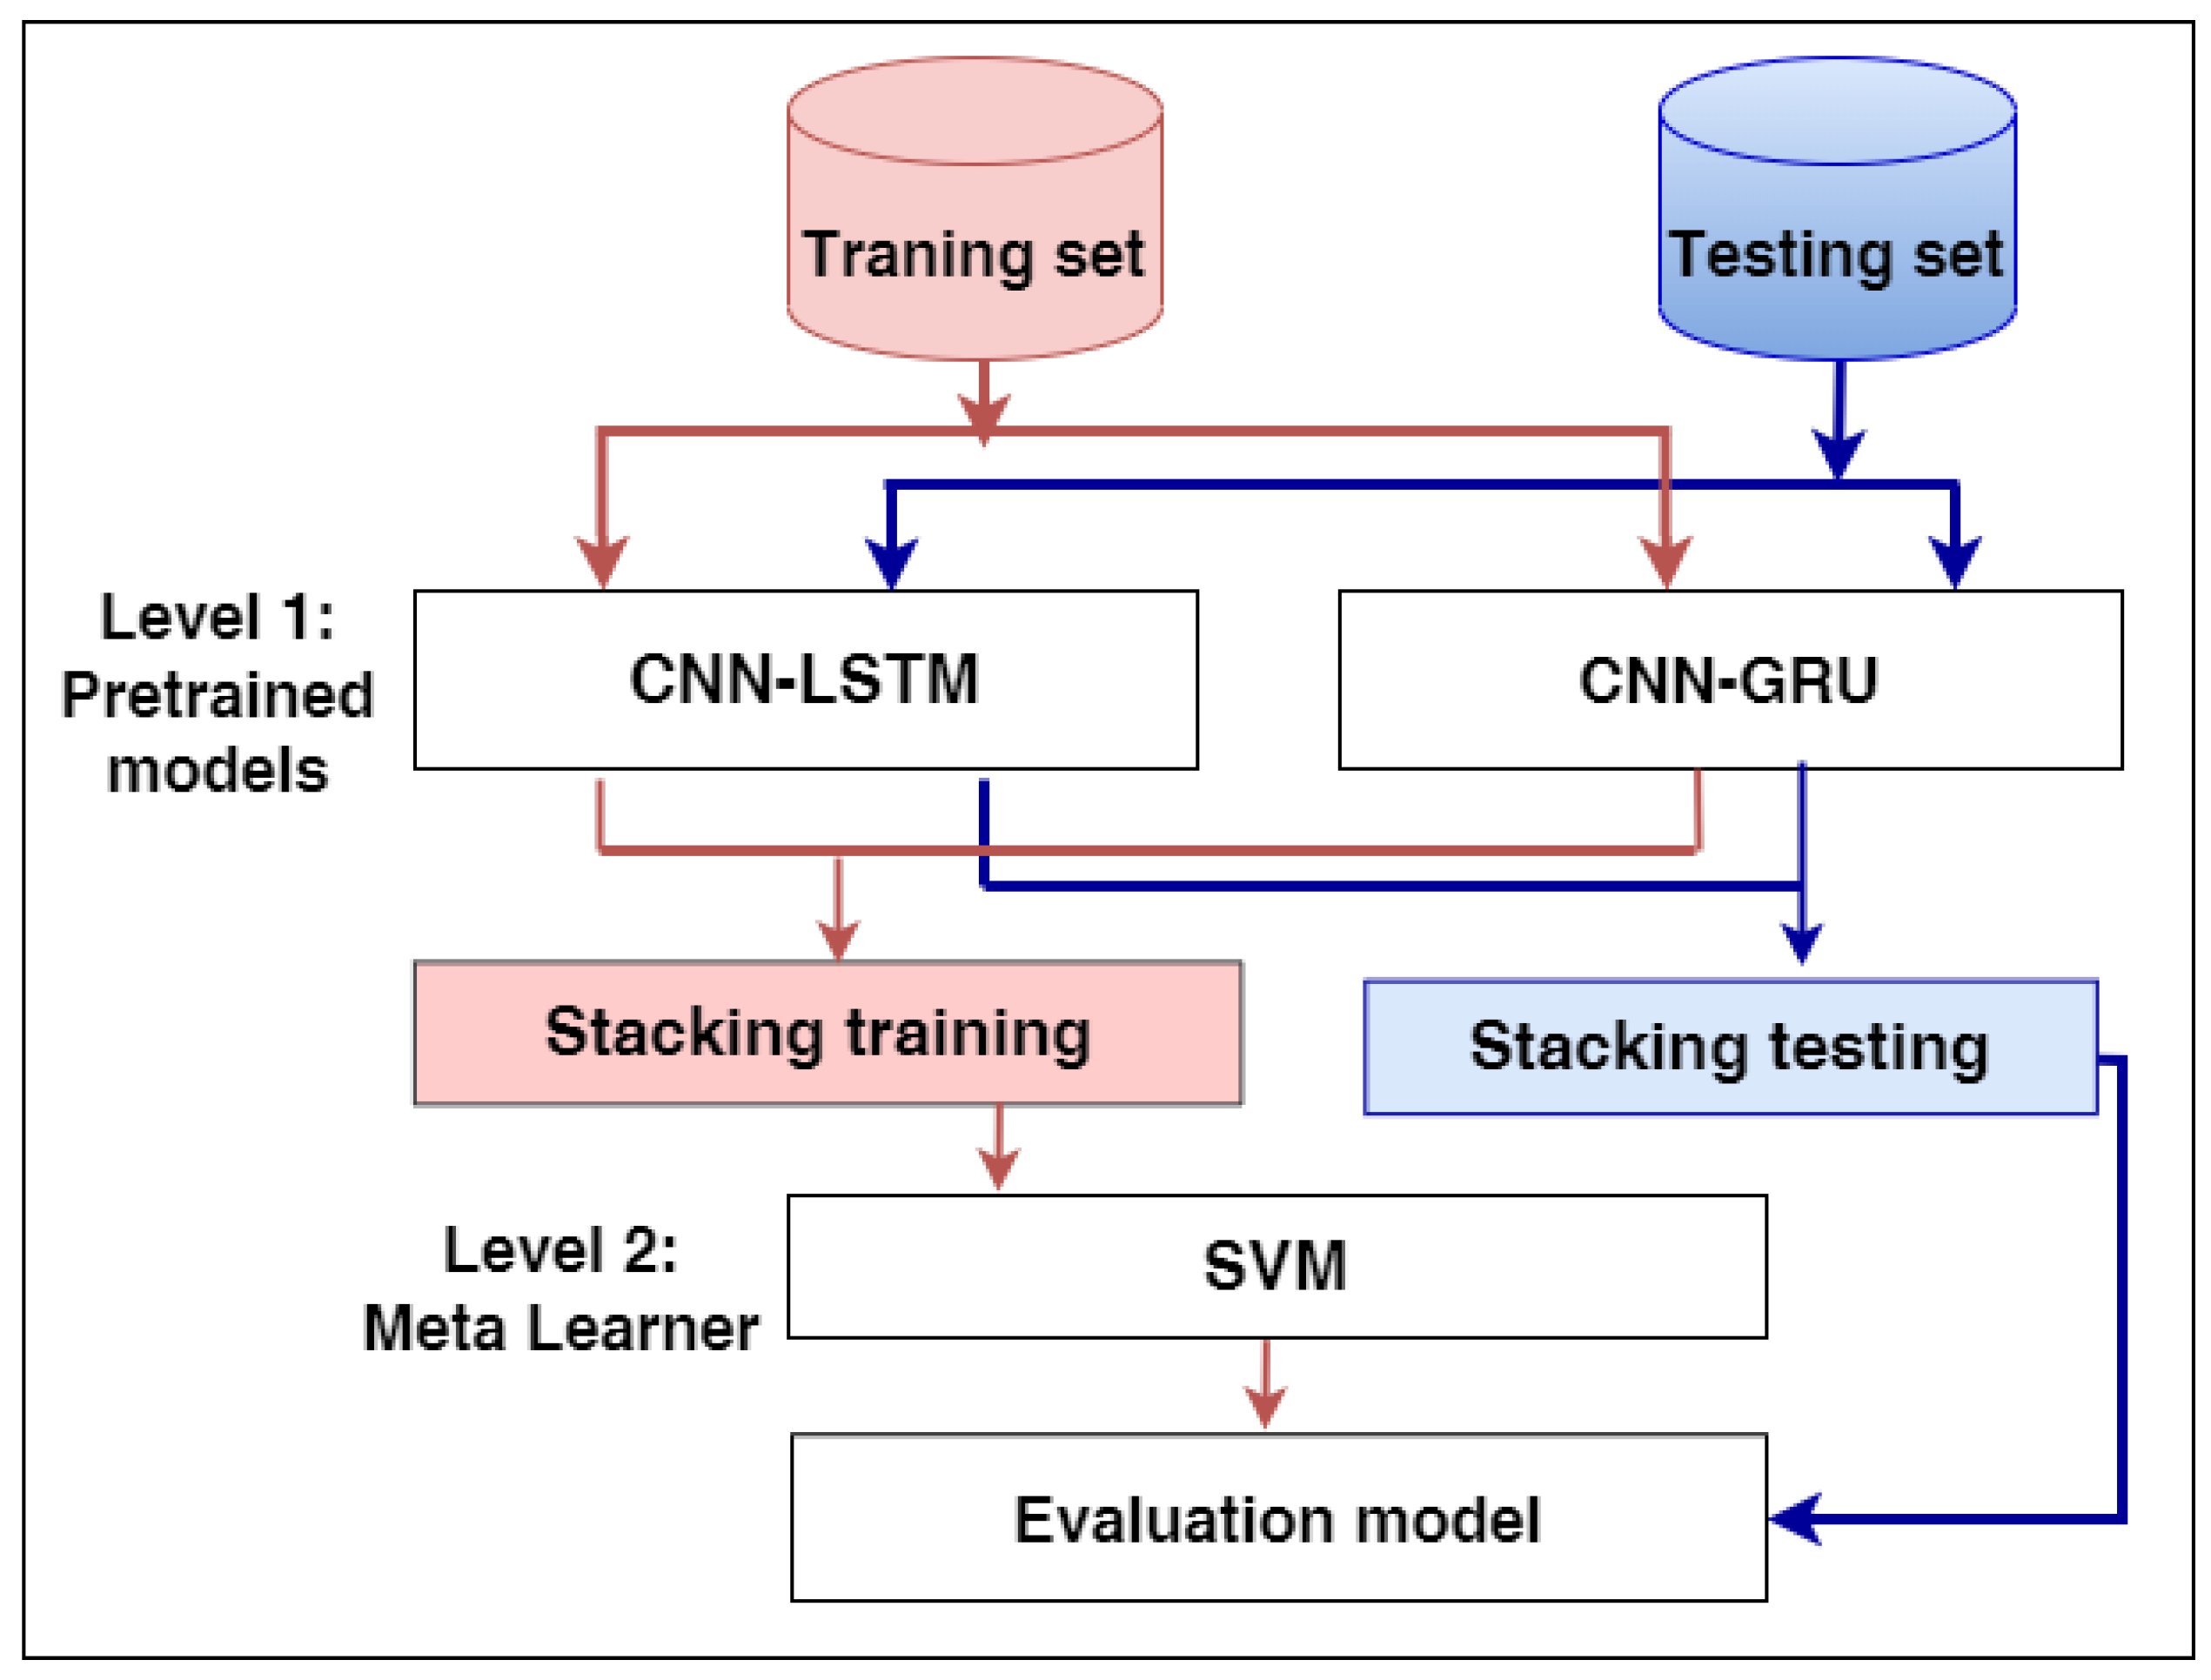
- We proposed a stacking ensemble model that merged the previous pre-trained hybrid models of CNN-LSTM and CNN-GRU. The best meta-learner classifier has been selected based on the experimental results. The SVM algorithm achieved the best results as the meta-classifier to determine the best weights of the base classifiers;
- We compared the proposed model with different ML models using two benchmark heart disease datasets;
- The proposed model significantly outperformed all other models and achieved the best results.
2. Related Work
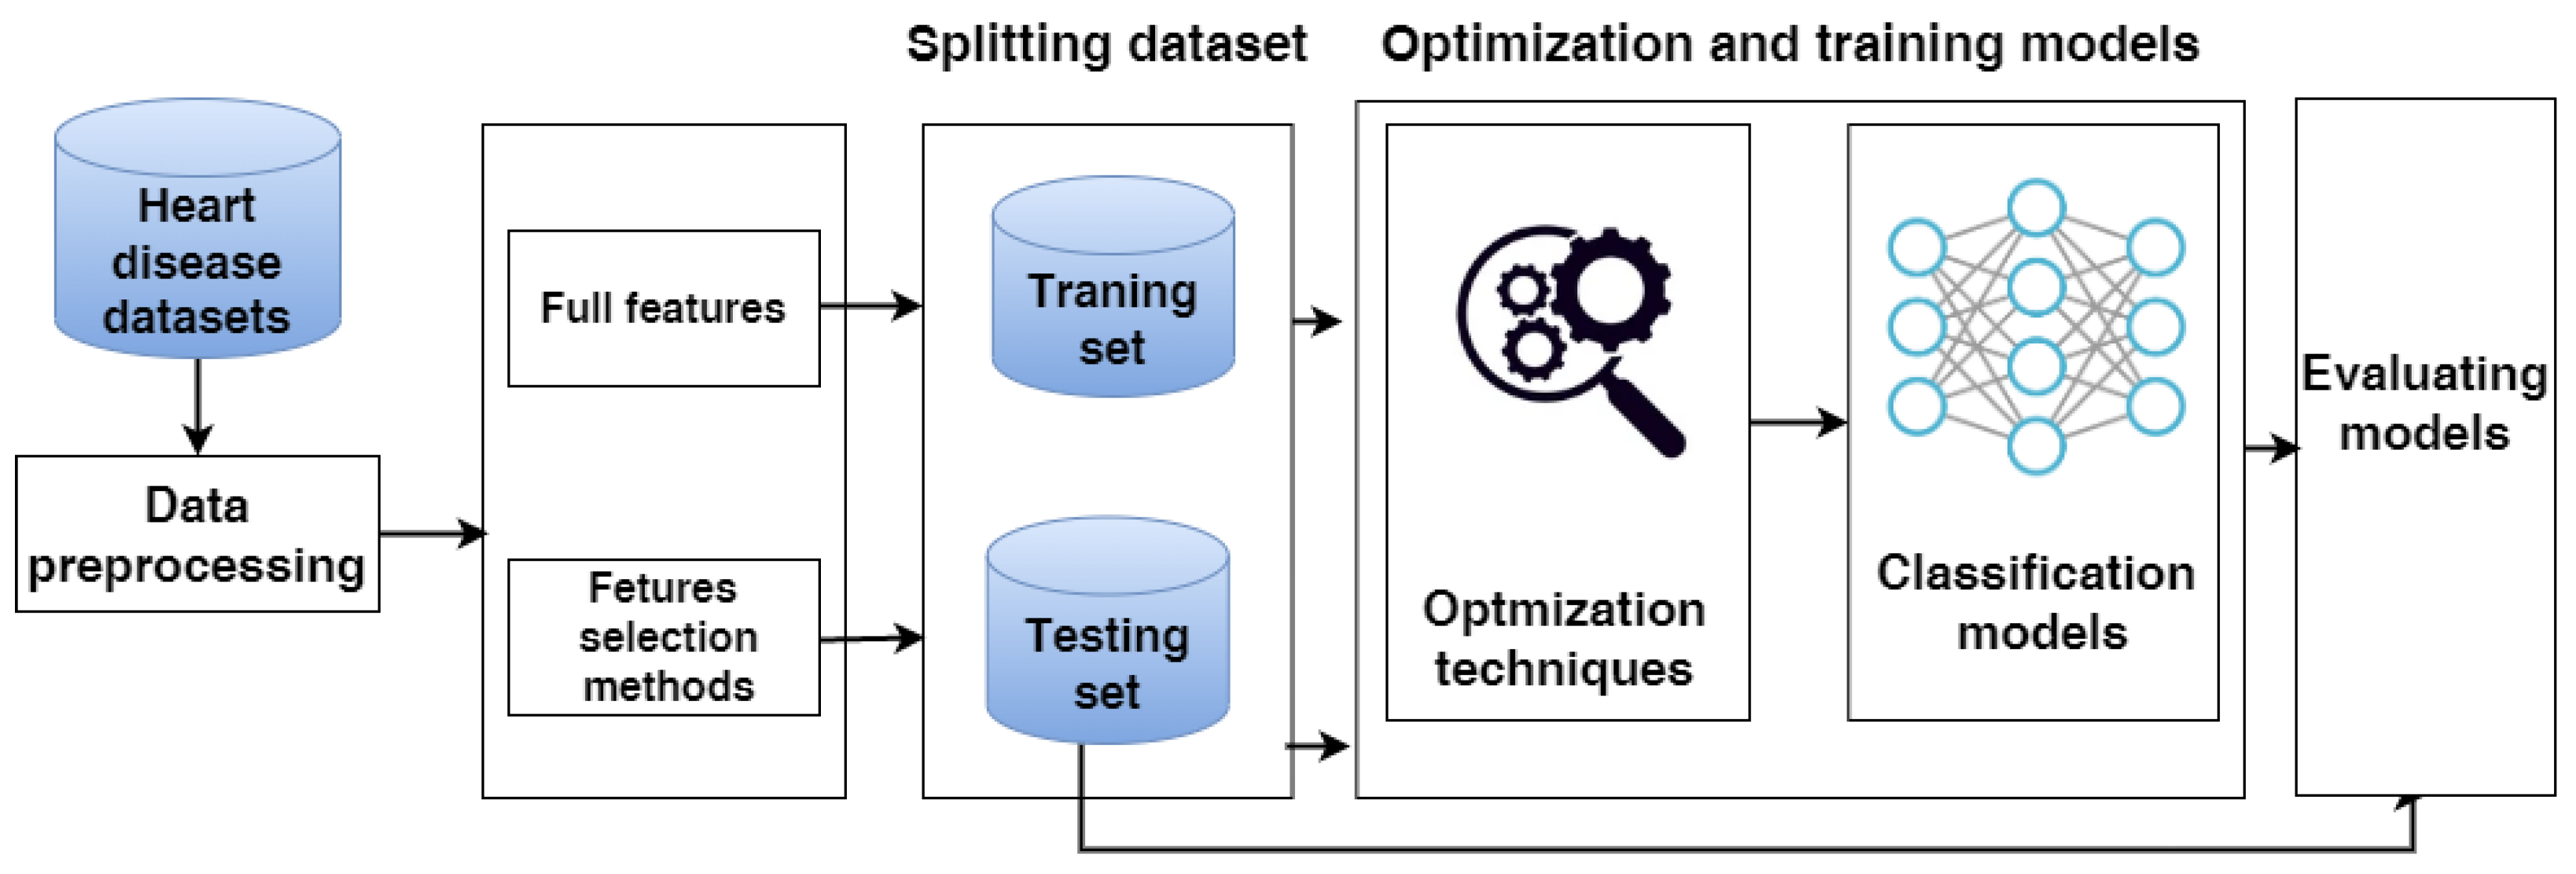
3. Methodology
3.1. Heart Disease Datasets
3.1.1. Dataset 1
3.1.2. Cleveland Dataset
3.2. Data Pre-Processing
3.3. Data Splitting
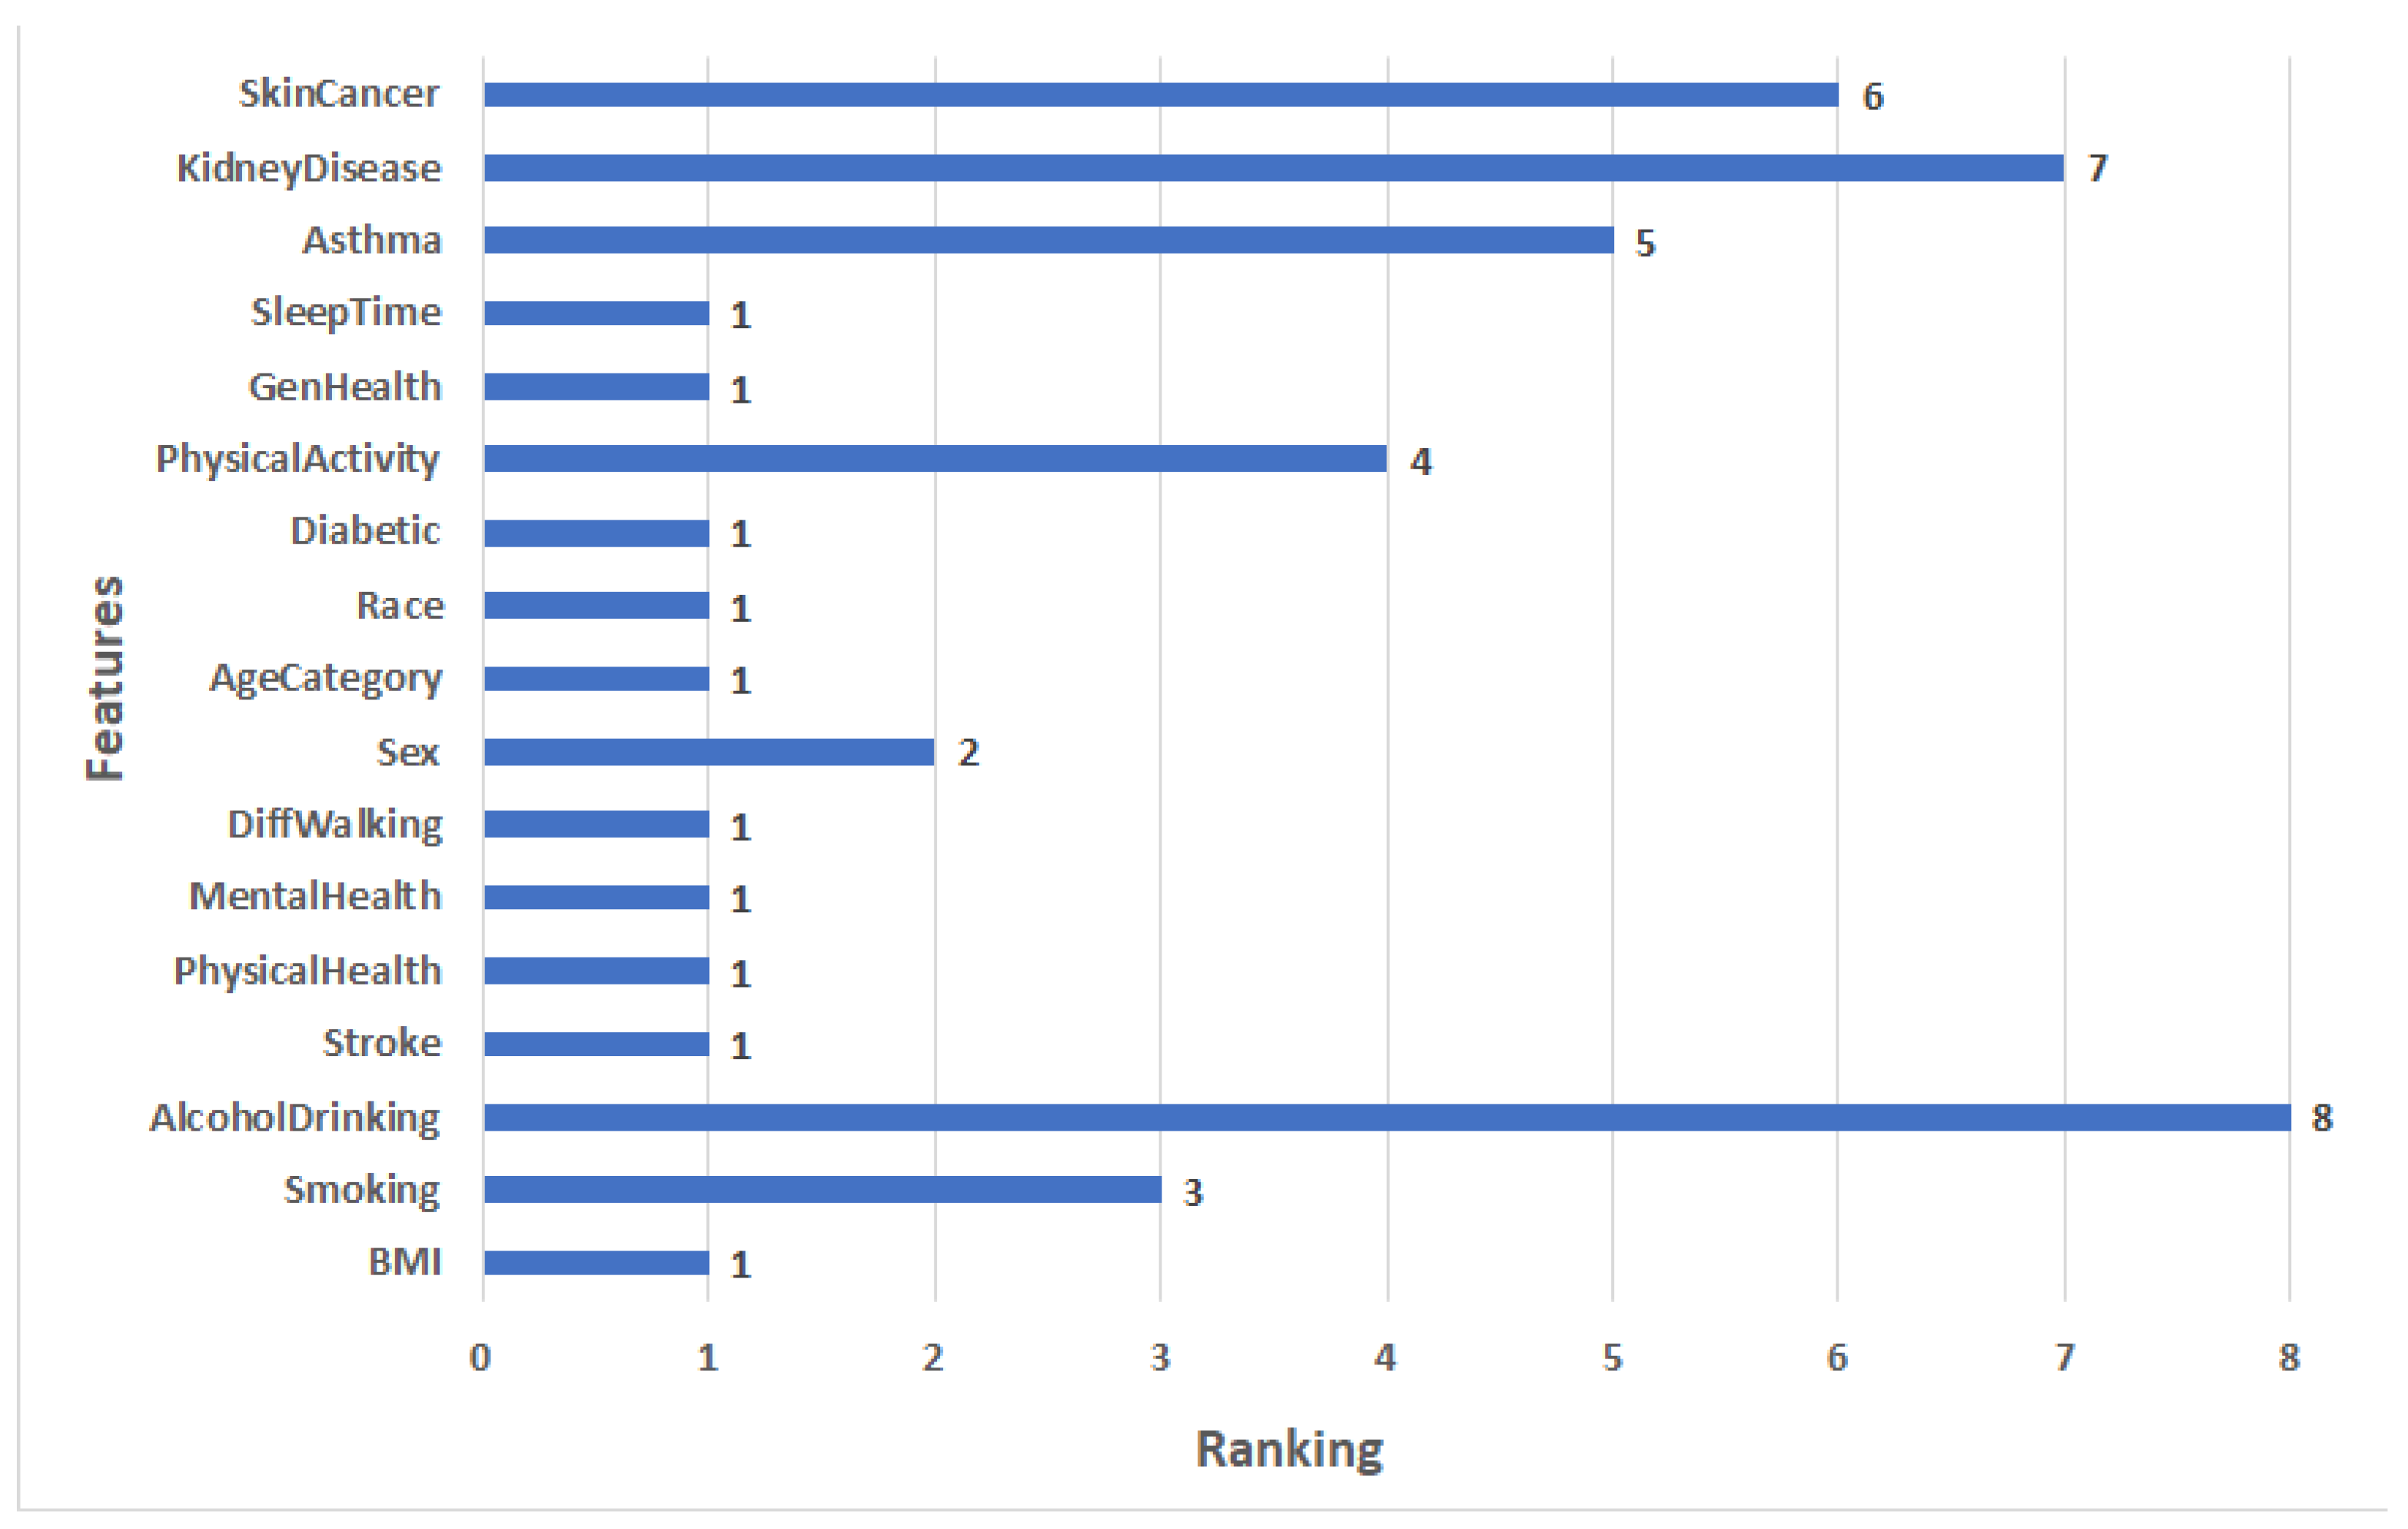
3.4. Feature Selection Methods
3.5. Machine Learning Approach
3.5.1. ML Algorithms
3.5.2. Optimization Techniques for Classical Models
3.6. The Hybrid Models
3.6.1. The Hybrid Model Architectures
- The first model is CNN-LSTM, which combines CNN with LSTM, consisting of a convolutional layer, a max-pooling layer, an LSTM layer, a flatten layer, a fully connected, and an output layer;
- The second model is CNN-GRU, which combines CNN with GRU. The architecture consists of a convolutional layer, a max-pooling layer, an GRU layer, a flatten layer, a fully connected, and an output layer.
3.6.2. Optimization Techniques for Hybrid Models
3.7. The Proposed Stacking Ensemble Model
3.8. Evaluating Models
4. Experimental Results
4.1. Experimental Setup
4.2. Results of Dataset1
4.2.1. Feature Selection Results
4.2.2. Results of Applying Models
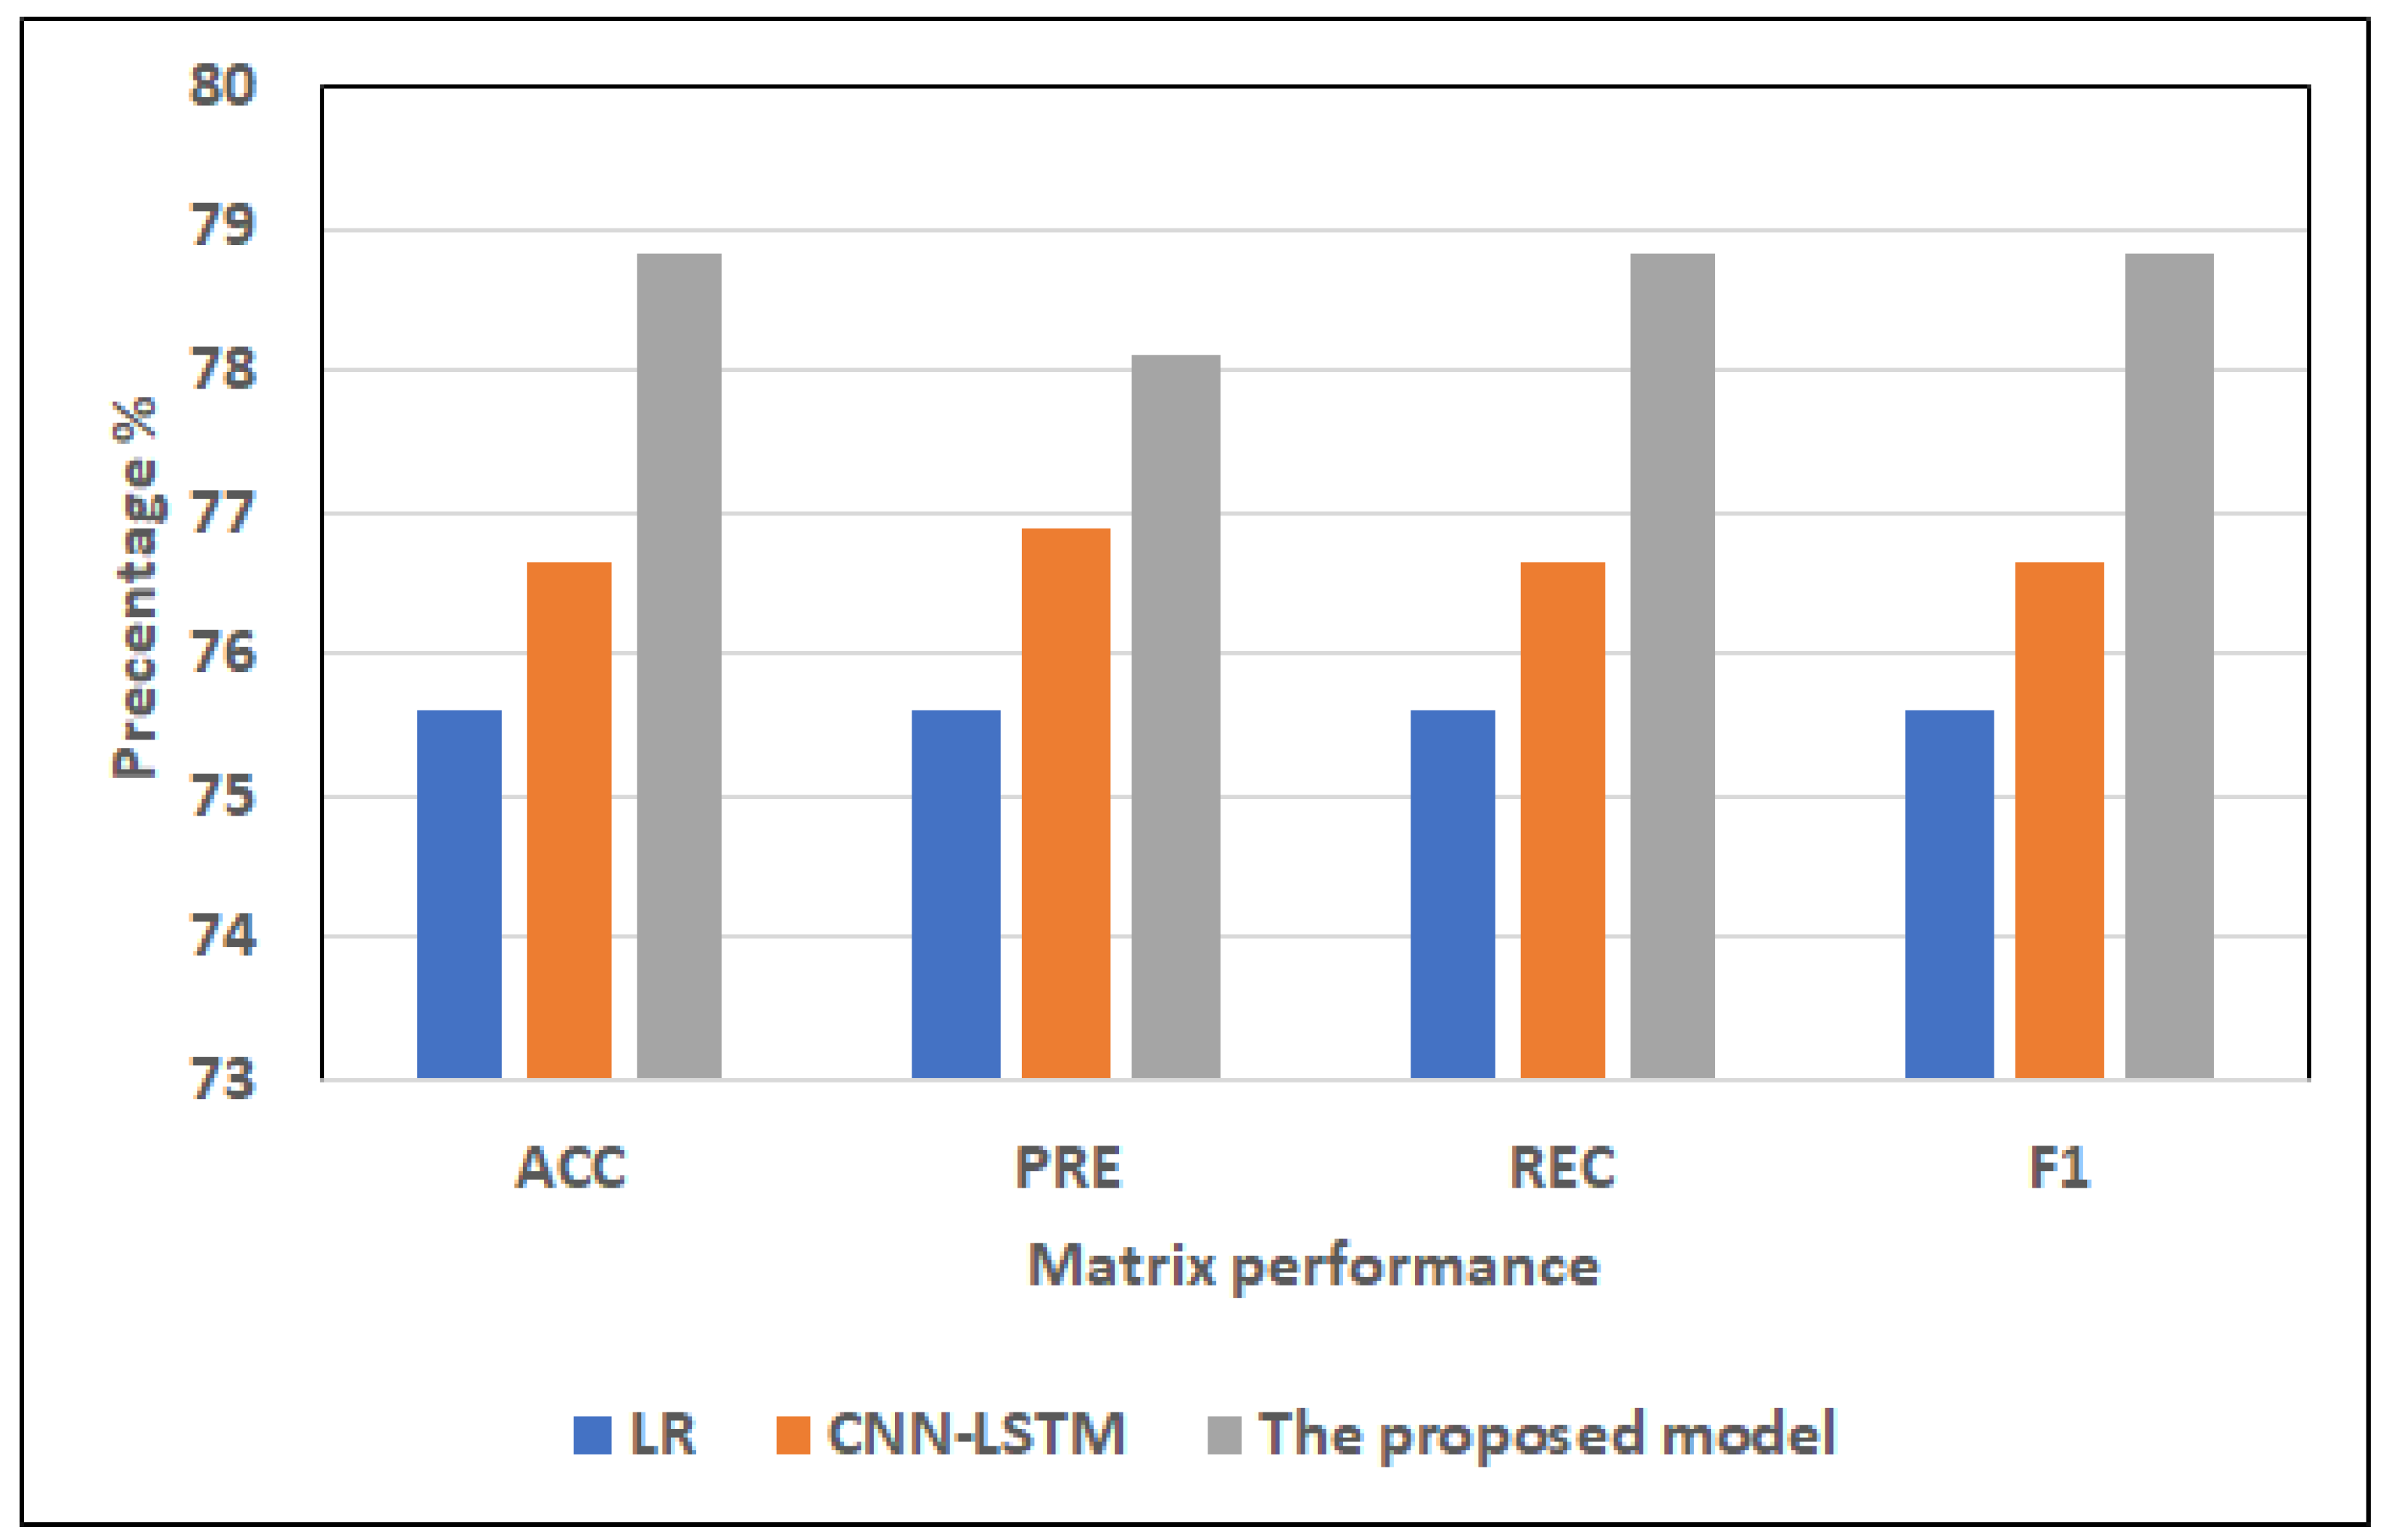
- Results of the full features:For ML models, RF and LR register approximately the same highest scores (75.32% of ACC, 75.44% of PRE, 75.32% of REC, 75.33% of F1) and (75.60% of ACC, 75.60% of PRE, 75.60% of REC, 75.60% of F1), respectively. NB records the worst scores (60.87% of ACC, 64.98% of PRE, 60.87% of REC, 56.69% of F1). KNN registers the second-highest scores (73.16% of ACC, 73.47% of PRE, 73.16% of REC, 73.16% of F1).For hybrid models, CNN-LSTM has the highest scores (76.64% of ACC, 76.9% of PRE, 76.64% of REC, and 76.65% of F1). CNN-GRU records the lowest scores (75.63% of ACC, 75.65% of PRE, 75.63% of REC, 75.58% of F1).The proposed model records the highest scores (ACC = 78.81%, 78.1% of PRE, 78.81% of REC, and 78.81% of F1) compared to other models. It improves ACC by 2.17, PRE by 1.2, REC by 2.17, and F1 by 2.16 compared to CNN-LSTM.
- Results of the selected features:For ML models, RF and LR register approximately the same highest scores (73.02% of ACC, 73.06% of PRE, 73.02% of REC, 73.03% of F1) and (73.58% of ACC, 73.60% of PRE, 73.58% of REC, = 73.59% of F1), respectively. NB records the worst scores (60.84% of ACC, 64.97% of PRE, 60.84% of REC, F1 = 56.63%). KNN registers the second-highest scores (72.59% of ACC, 72.92% of PRE, 72.59% of REC, F1 = 72.59%).The top scores for hybrid models belong to CNN-LSTM (75.22% of ACC, 75.42% of PRE, 75.22% of REC, and 75.22% of F1). The lowest scores are recorded by CNN-GRU (74.07% of ACC, 74.23% of PRE, 74.07% of REC, and 74.08% of F1).In comparison to other models, the proposed model achieves the greatest scores (77.42% of ACC, 77.99% of PRE, 77.42% of REC, and 77.39% of F1). In comparison to CNN-LSTM, it enhances ACC by 2.2%, PRE by 2.57%, REC by 2.2%, and F1 by 2.17%.
4.3. Results of the Cleveland Dataset
4.3.1. Feature Selection Results
4.3.2. Results of the Applied Models
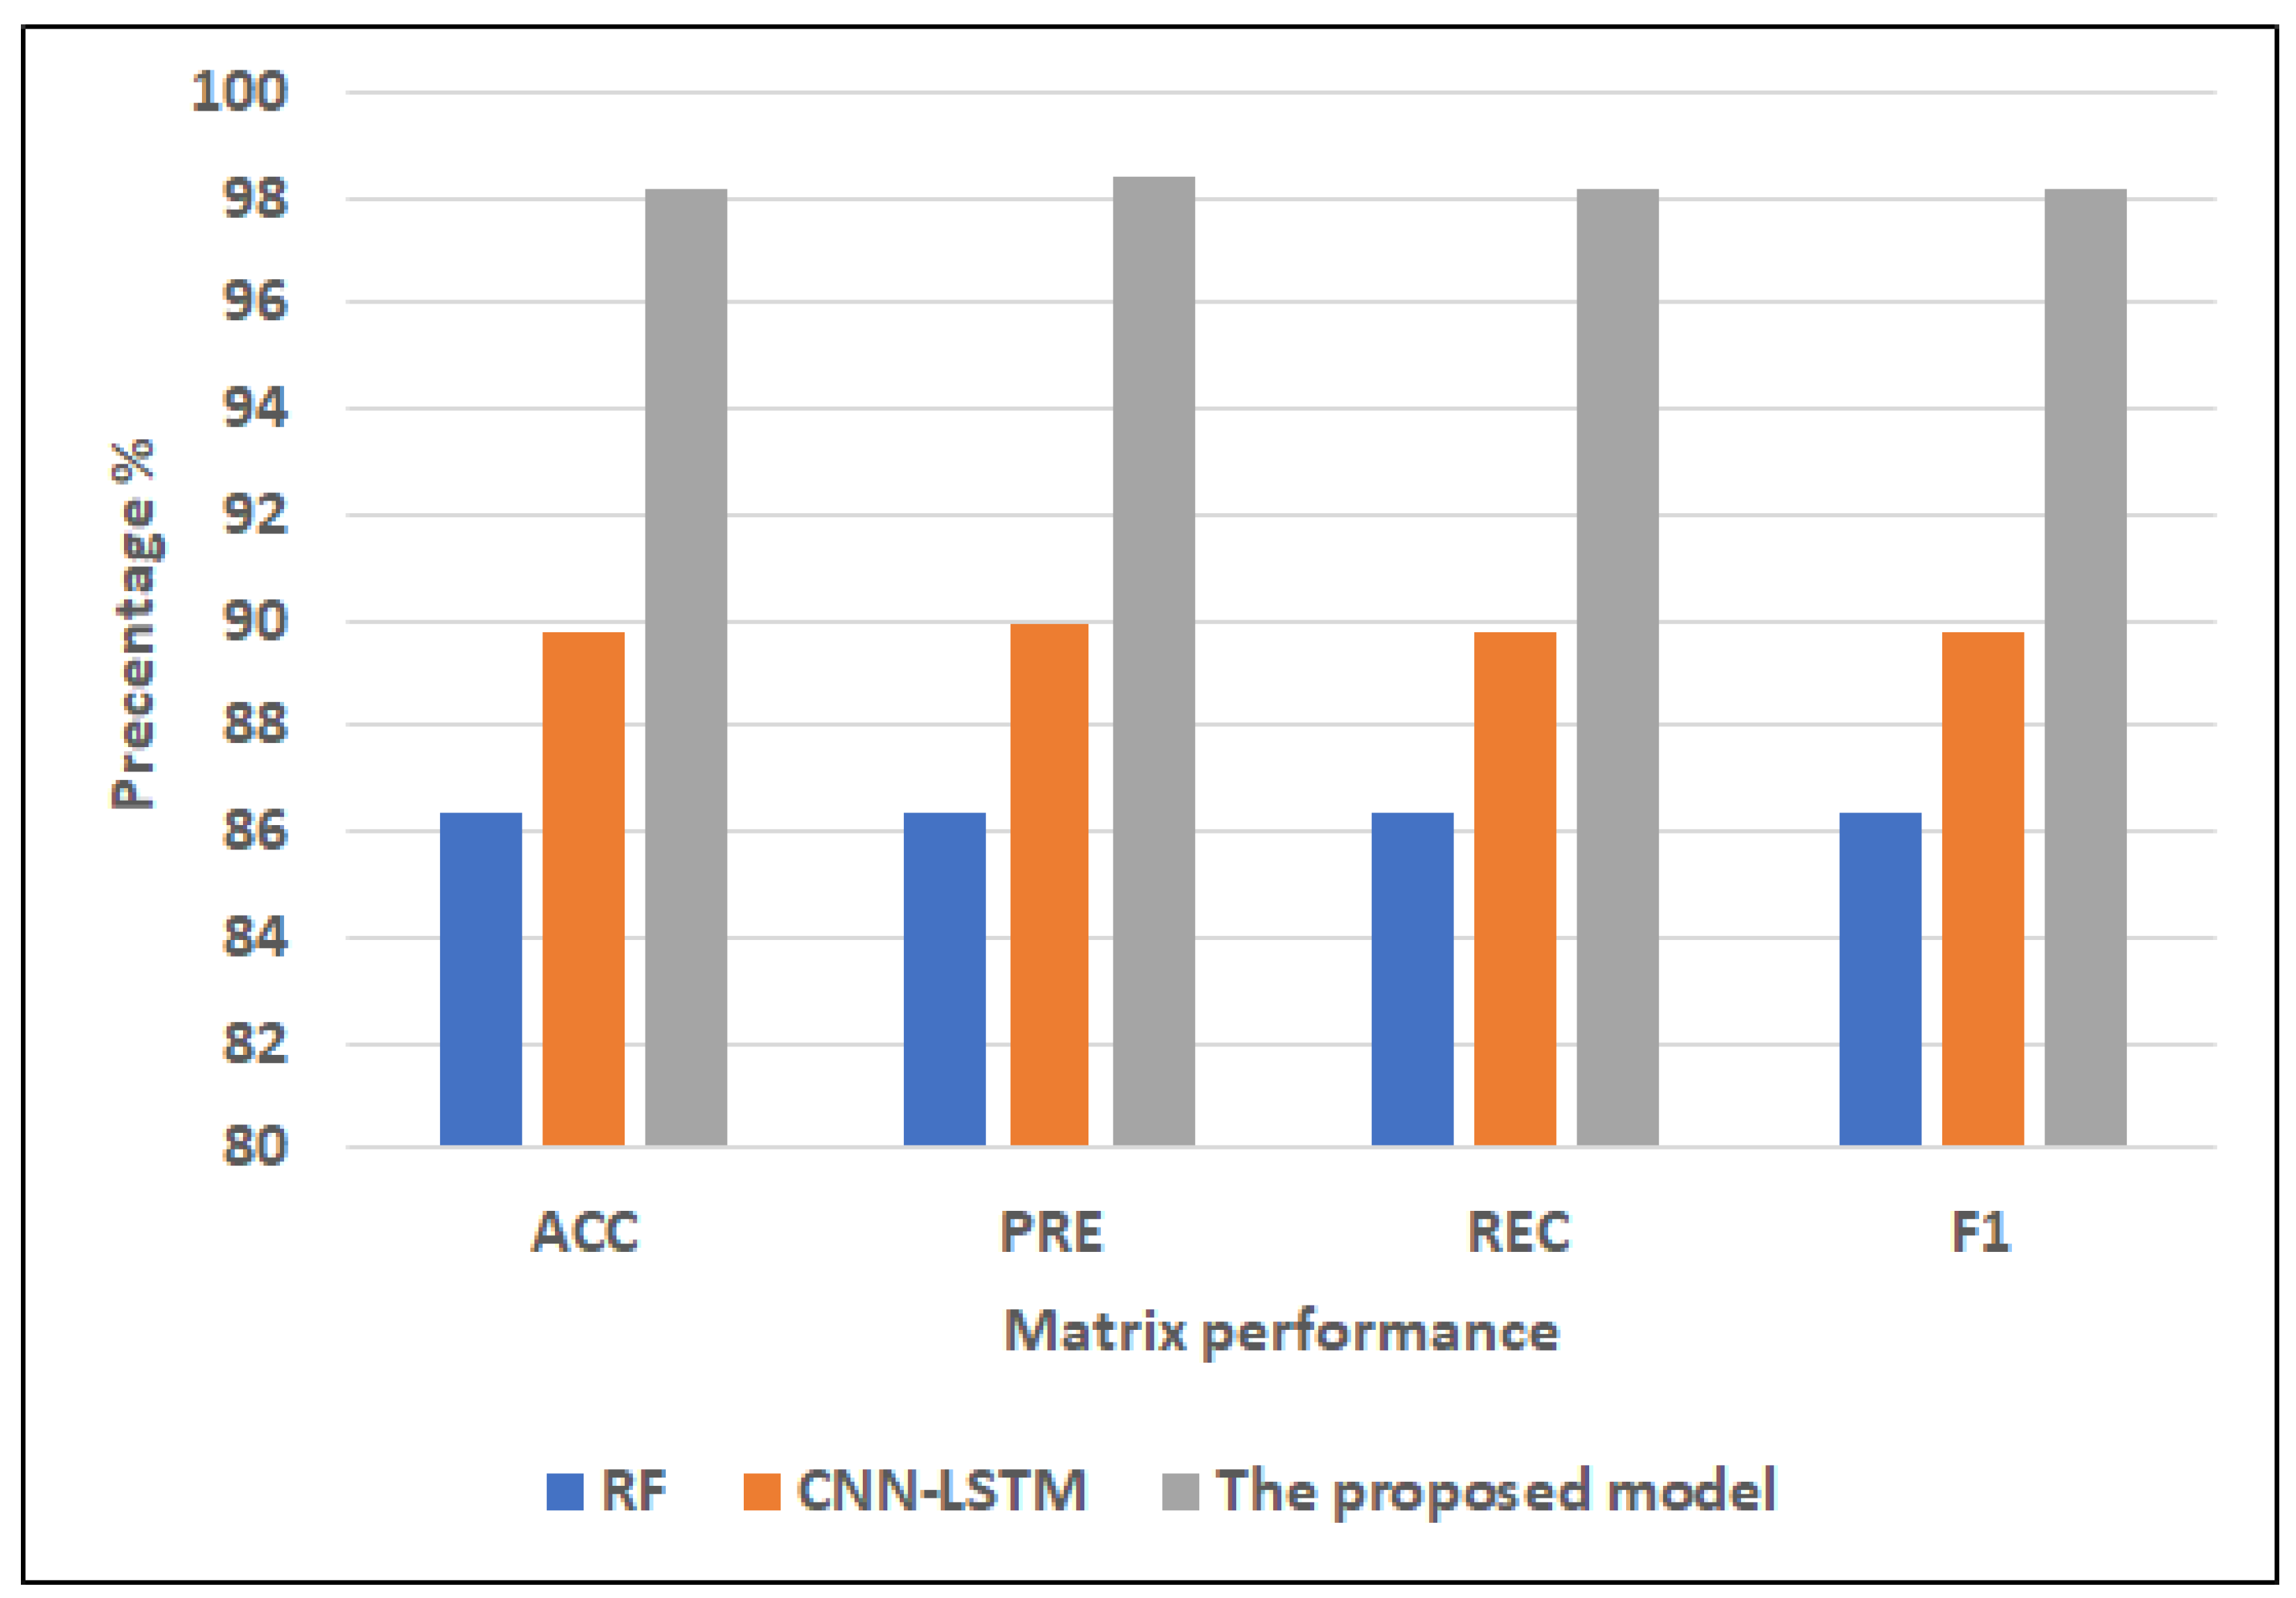
- Full featuresFor ML models, RF has the highest scores (86.34% of ACC, 86.34% of PRE, 86.34% of REC, and 86.34% of F1). NB records the lowest scores (60.00% of ACC, 60.05% of PRE, 60.00% of REC, 59.74% of F1). DT registers the second-highest scores (82.44% of ACC, 82.46% of PRE, 82.44% of REC, 82.44% of F1).For hybrid models, CNN-LSTM has the highest scores (89.76% of ACC, 89.96% of PRE, REC = 89.76% of REC, F1 = 89.75%). CNN-GRU records the lowest scores (88.29% of ACC, 89.06% of PRE, REC = 88.29% of REC, 88.26% of F1).The proposed model records the highest scores (97.17% of ACC, 97.42% of PRE, 97.17% of REC, 97.15% of F1) compared to the other models. It improves ACC by 7.41, PRE by 7.46, REC by 7.41, and F1 by 7.4 compared to CNN-LSTM.
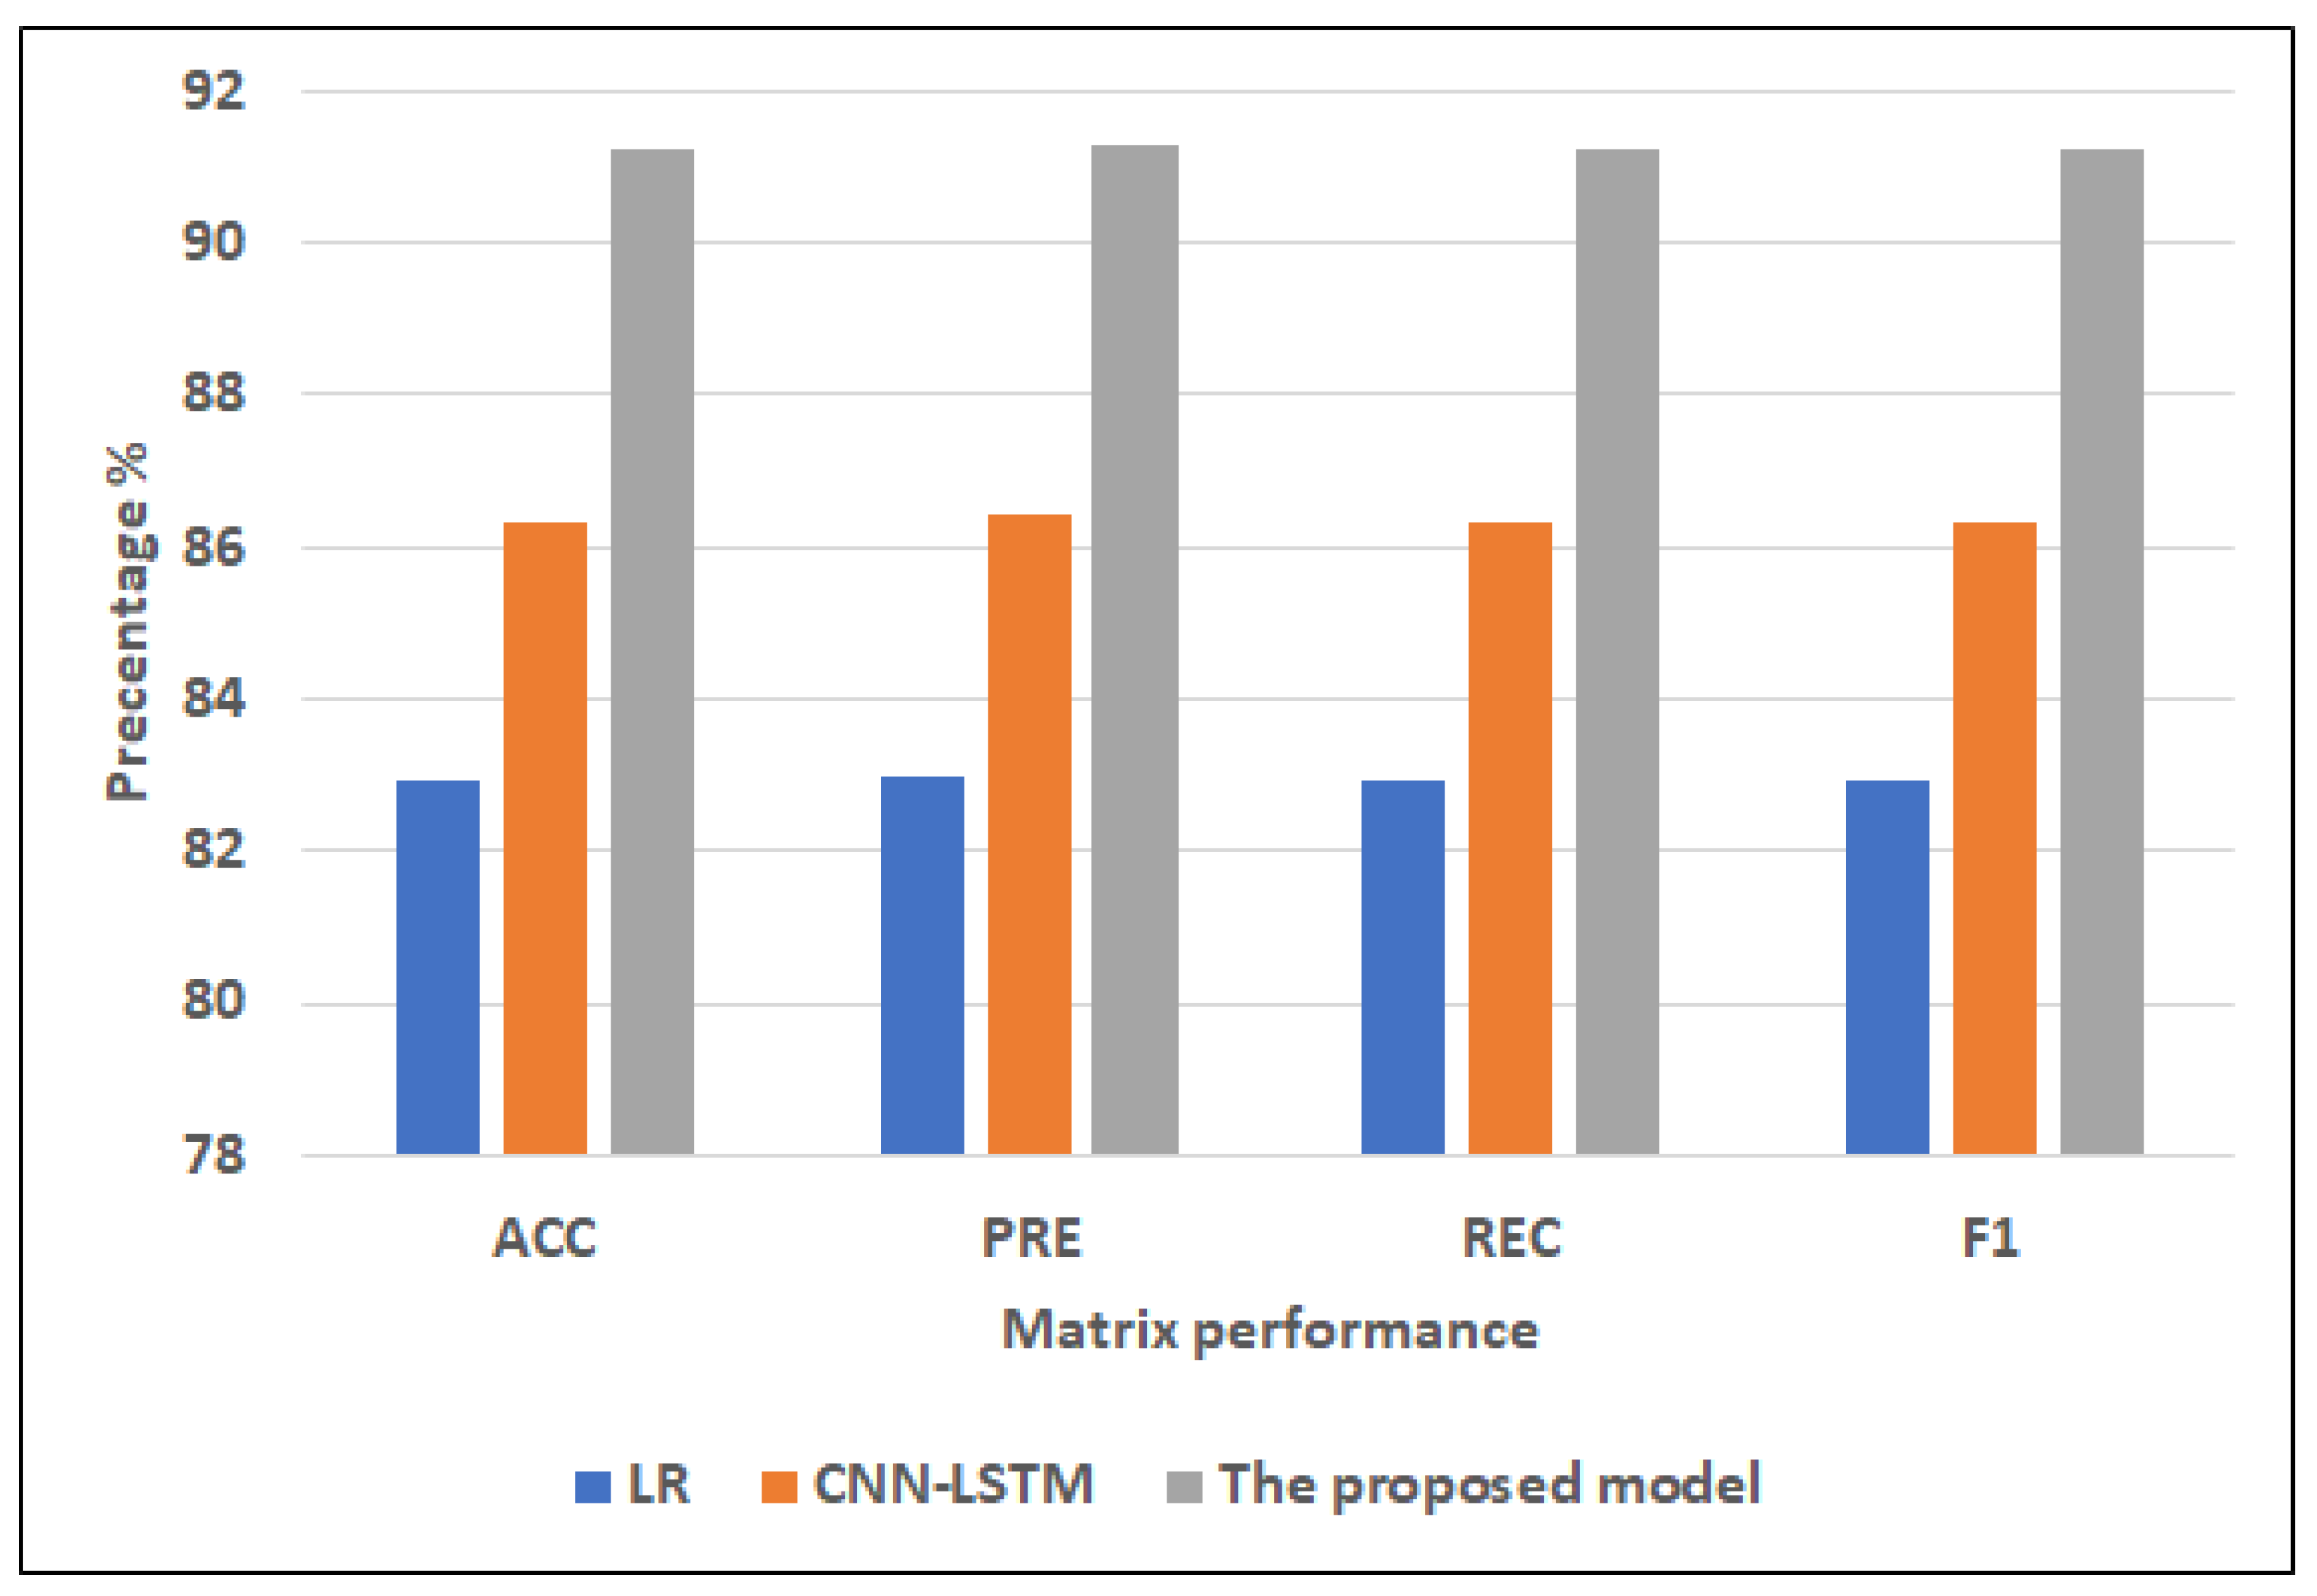
- Selected featuresFor ML models, RF has the highest scores (82.93% of ACC, 82.99% of PRE, 82.93% of REC, 82.91% of F1). NB records the lowest scores (64.88% of ACC, 64.90% of PRE, 64.88% of REC, 64.88% of F1). DT registers the second-highest scores (81.95% of ACC, PRE = 82.01%, 81.95% of REC, 81.93% of F1).For hybrid models, CNN-LSTM has the highest scores (86.34% of ACC, 86.41% of PRE, 86.34% of REC, and 86.34% of F1). CNN-GRU records the lowest scores (85.85% of ACC, 86.92% of PRE, 85.85% of REC, 85.78% of F1).The proposed model records the highest scores (91.22% of ACC, 91.29% of PRE, 91.22% of REC, 91.22% of F1) compared to other models. It improves ACC by 4.88, PRE by 4.88, REC by 4.88, and F1 by 4.88 compared to CNN-LSTM.
4.4. Discussion
4.4.1. Dataset1
4.4.2. Cleveland Dataset
4.4.3. Comparison with Literature Studies
5. Conclusions
Supplementary Materials
Author Contributions
Funding
Data Availability Statement
Acknowledgments
Conflicts of Interest
References
- Cardiovascular Diseases (CVDs). Available online: http://www.who.int/cardiovascular_diseases/en/ (accessed on 10 October 2022).
- Hall, J.E.; Hall, M.E. Guyton and Hall Textbook of Medical Physiology e-Book; Elsevier Health Sciences: Amsterdam, The Netherlands, 2020. [Google Scholar]
- Bhowmick, A.; Mahato, K.D.; Azad, C.; Kumar, U. Heart Disease Prediction Using Different Machine Learning Algorithms. In Proceedings of the 2022 IEEE World Conference on Applied Intelligence and Computing (AIC), Sonbhadra, India, 17–19 June 2022; pp. 60–65. [Google Scholar]
- Saleh, H.; Alyami, H.; Alosaimi, W. Predicting Breast Cancer Based on Optimized Deep Learning Approach. Comput. Intell. Neurosci. 2022, 2022, 1820777. [Google Scholar] [CrossRef]
- Cardoso, M.R.; Santos, J.C.; Ribeiro, M.L.; Talarico, M.C.R.; Viana, L.R.; Derchain, S.F.M. A metabolomic approach to predict breast cancer behavior and chemotherapy response. Int. J. Mol. Sci. 2018, 19, 617. [Google Scholar] [CrossRef] [Green Version]
- Spagnuolo, G.; De Vito, D.; Rengo, S.; Tatullo, M. COVID-19 outbreak: An overview on dentistry. Int. J. Environ. Res. Public Health 2020, 17, 2094. [Google Scholar] [CrossRef] [Green Version]
- Alouffi, B.; Alharbi, A.; Sahal, R.; Saleh, H. An Optimized Hybrid Deep Learning Model to Detect COVID-19 Misleading Information. Comput. Intell. Neurosci. 2021, 2021, 9615034. [Google Scholar] [CrossRef]
- Mitchell, T.; Buchanan, B.; DeJong, G.; Dietterich, T.; Rosenbloom, P.; Waibel, A. Machine learning. Annu. Rev. Comput. Sci. 1990, 4, 417–433. [Google Scholar] [CrossRef]
- Chan, S.R.; Torous, J.; Hinton, L.; Yellowlees, P. Mobile tele-mental health: Increasing applications and a move to hybrid models of care. Healthcare 2014, 2, 220–233. [Google Scholar] [CrossRef] [Green Version]
- Sharma, S.; Parmar, M. Heart diseases prediction using deep learning neural network model. Int. J. Innov. Technol. Explor. Eng. (IJITEE) 2020, 9, 124–137. [Google Scholar] [CrossRef]
- Weissler, E.H.; Naumann, T.; Andersson, T.; Ranganath, R.; Elemento, O.; Luo, Y.; Freitag, D.F.; Benoit, J.; Hughes, M.C.; Khan, F.; et al. The role of machine learning in clinical research: Transforming the future of evidence generation. Trials 2021, 22, 1–15. [Google Scholar]
- Melin, P.; Monica, J.C.; Sanchez, D.; Castillo, O. Multiple ensemble neural network models with fuzzy response aggregation for predicting COVID-19 time series: The case of Mexico. Healthcare 2020, 8, 181. [Google Scholar] [CrossRef]
- Sagi, O.; Rokach, L. Ensemble learning: A survey. Wiley Interdiscip. Rev. Data Min. Knowl. Discov. 2018, 8, e1249. [Google Scholar] [CrossRef]
- Freund, Y.; Schapire, R.E. Experiments with a new boosting algorithm. ICML Citeseer 1996, 6, 148–156. [Google Scholar]
- Rajagopal, S.; Kundapur, P.P.; Hareesha, K.S. A stacking ensemble for network intrusion detection using heterogeneous datasets. Secur. Commun. Netw. 2020, 2020, 4586875. [Google Scholar] [CrossRef]
- Bühlmann, P. Bagging, boosting and ensemble methods. In Handbook of Computational Statistics; Springer: Berlin/Heidelberg, Germany, 2012; pp. 985–1022. [Google Scholar]
- Kavitha, M.; Gnaneswar, G.; Dinesh, R.; Sai, Y.R.; Suraj, R.S. Heart disease prediction using hybrid machine learning model. In Proceedings of the 2021 6th International Conference on Inventive Computation Technologies (ICICT), Coimbatore, India, 20–22 January 2021; pp. 1329–1333. [Google Scholar]
- Ishaq, A.; Sadiq, S.; Umer, M.; Ullah, S.; Mirjalili, S.; Rupapara, V.; Nappi, M. Improving the prediction of heart failure patients’ survival using SMOTE and effective data mining techniques. IEEE Access 2021, 9, 39707–39716. [Google Scholar] [CrossRef]
- Ansarullah, S.I.; Saif, S.M.; Kumar, P.; Kirmani, M.M. Significance of visible non-invasive risk attributes for the initial prediction of heart disease using different machine learning techniques. Comput. Intell. Neurosci. 2022, 2022, 9580896. [Google Scholar] [CrossRef]
- Spencer, R.; Thabtah, F.; Abdelhamid, N.; Thompson, M. Exploring feature selection and classification methods for predicting heart disease. Digit. Health 2020, 6, 2055207620914777. [Google Scholar] [CrossRef] [Green Version]
- Bharti, R.; Khamparia, A.; Shabaz, M.; Dhiman, G.; Pande, S.; Singh, P. Prediction of heart disease using a combination of machine learning and deep learning. Comput. Intell. Neurosci. 2021, 2021, 8387680. [Google Scholar] [CrossRef]
- Gokulnath, C.B.; Shantharajah, S. An optimized feature selection based on genetic approach and support vector machine for heart disease. Clust. Comput. 2019, 22, 14777–14787. [Google Scholar] [CrossRef]
- Amin, M.S.; Chiam, Y.K.; Varathan, K.D. Identification of significant features and data mining techniques in predicting heart disease. Telemat. Informatics 2019, 36, 82–93. [Google Scholar] [CrossRef]
- Bashir, S.; Khan, Z.S.; Khan, F.H.; Anjum, A.; Bashir, K. Improving heart disease prediction using feature selection approaches. In Proceedings of the 2019 16th International Bhurban Conference on Applied Sciences and Technology (IBCAST), Islamabad, Pakistan, 8–12 January 2019; pp. 619–623. [Google Scholar]
- Javid, I.; Ghazali, R.; Zulqarnain, M.; Husaini, N.A. Deep Learning GRU Model and Random Forest for Screening Out Key Attributes of Cardiovascular Disease. In International Conference on Soft Computing and Data Mining; Springer: Berlin/Heidelberg, Germany, 2022; pp. 160–170. [Google Scholar]
- Chae, M.; Gil, H.W.; Cho, N.J.; Lee, H. Machine Learning-Based Cardiac Arrest Prediction for Early Warning System. Mathematics 2022, 10, 2049. [Google Scholar] [CrossRef]
- Narmadha, S.; Gokulan, S.; Pavithra, M.; Rajmohan, R.; Ananthkumar, T. Determination of various deep learning parameters to predict heart disease for diabetes patients. In Proceedings of the 2020 International Conference on System, Computation, Automation and Networking (ICSCAN), Pondicherry, India, 3–4 July 2020; pp. 1–6. [Google Scholar]
- Adhikari, B.; Shakya, S. Heart Disease Prediction Using Ensemble Model. In Proceedings of Second International Conference on Sustainable Expert Systems; Springer: Berlin/Heidelberg, Germany, 2022; pp. 857–868. [Google Scholar]
- Javid, I.; Alsaedi, A.K.Z.; Ghazali, R. Enhanced accuracy of heart disease prediction using machine learning and recurrent neural networks ensemble majority voting method. Int. J. Adv. Comput. Sci. Appl. 2020, 11. [Google Scholar] [CrossRef] [Green Version]
- Ghosh, P.; Azam, S.; Jonkman, M.; Karim, A.; Shamrat, F.J.M.; Ignatious, E.; Shultana, S.; Beeravolu, A.R.; De Boer, F. Efficient prediction of cardiovascular disease using machine learning algorithms with relief and LASSO feature selection techniques. IEEE Access 2021, 9, 19304–19326. [Google Scholar] [CrossRef]
- Heart Disease Prediction. Available online: https://www.kaggle.com/code/andls555/heart-disease-prediction/data/ (accessed on 8 November 2022).
- Heart Disease Dataset. Available online: https://www.kaggle.com/datasets/johnsmith88/heart-disease-dataset (accessed on 8 November 2022).
- Sechidis, K.; Tsoumakas, G.; Vlahavas, I. On the stratification of multi-label data. In Joint European Conference on Machine Learning and Knowledge Discovery in Databases; Springer: Berlin/Heidelberg, Germany, 2011; pp. 145–158. [Google Scholar]
- Liberty, E.; Lang, K.; Shmakov, K. Stratified sampling meets machine learning. In Proceedings of the International Conference on Machine Learning, New York, NY, USA, 20–22 June 2016; pp. 2320–2329. [Google Scholar]
- Naz, H.; Ahuja, S. Deep learning approach for diabetes prediction using PIMA Indian dataset. J. Diabetes Metab. Disord. 2020, 19, 391–403. [Google Scholar] [CrossRef] [PubMed]
- Prusty, S.; Patnaik, S.; Dash, S.K. SKCV: Stratified K-fold cross-validation on ML classifiers for predicting cervical cancer. Front. Nanotechnol. 2022, 4, 972421. [Google Scholar] [CrossRef]
- Fonarow, G.C.; Adams, K.F.; Abraham, W.T.; Yancy, C.W.; Boscardin, W.J.; Committee, A.S.A. Risk stratification for in-hospital mortality in acutely decompensated heart failure: Classification and regression tree analysis. JAMA 2005, 293, 572–580. [Google Scholar] [CrossRef] [PubMed] [Green Version]
- Srinivasan, B.; Pavya, K. Feature selection techniques in data mining: A study. Int. J. Sci. Dev. Res. (IJSDR) 2017, 2, 594–598. [Google Scholar]
- Saeys, Y.; Inza, I.; Larranaga, P. A review of feature selection techniques in bioinformatics. Bioinformatics 2007, 23, 2507–2517. [Google Scholar] [CrossRef] [Green Version]
- Liu, H.; Yu, L. Toward integrating feature selection algorithms for classification and clustering. IEEE Trans. Knowl. Data Eng. 2005, 17, 491–502. [Google Scholar]
- Noble, W.S. What is a support vector machine? Nat. Biotechnol. 2006, 24, 1565–1567. [Google Scholar] [CrossRef]
- Hearst, M.A.; Dumais, S.T.; Osuna, E.; Platt, J.; Scholkopf, B. Support vector machines. IEEE Intell. Syst. Their Appl. 1998, 13, 18–28. [Google Scholar] [CrossRef] [Green Version]
- Pisner, D.A.; Schnyer, D.M. Support vector machine. In Machine Learning; Elsevier: Amsterdam, The Netherlands, 2020; pp. 101–121. [Google Scholar]
- Steinwart, I.; Christmann, A. Support Vector Machines; Springer Science & Business Media: Berlin/Heidelberg, Germany, 2008. [Google Scholar]
- Nusinovici, S.; Tham, Y.C.; Yan, M.Y.C.; Ting, D.S.W.; Li, J.; Sabanayagam, C.; Wong, T.Y.; Cheng, C.Y. Logistic regression was as good as machine learning for predicting major chronic diseases. J. Clin. Epidemiol. 2020, 122, 56–69. [Google Scholar] [CrossRef]
- Rymarczyk, T.; Kozłowski, E.; Kłosowski, G.; Niderla, K. Logistic regression for machine learning in process tomography. Sensors 2019, 19, 3400. [Google Scholar] [CrossRef] [PubMed] [Green Version]
- John, G.H.; Langley, P. Estimating continuous distributions in Bayesian classifiers. arXiv 2013, arXiv:1302.4964. [Google Scholar]
- Charbuty, B.; Abdulazeez, A. Classification based on decision tree algorithm for machine learning. J. Appl. Sci. Technol. Trends 2021, 2, 20–28. [Google Scholar] [CrossRef]
- Chen, W.; Xie, X.; Wang, J.; Pradhan, B.; Hong, H.; Bui, D.T.; Duan, Z.; Ma, J. A comparative study of logistic model tree, random forest, and classification and regression tree models for spatial prediction of landslide susceptibility. Catena 2017, 151, 147–160. [Google Scholar] [CrossRef] [Green Version]
- Rodriguez-Galiano, V.F.; Chica-Rivas, M. Evaluation of different machine learning methods for land cover mapping of a Mediterranean area using multi-seasonal Landsat images and Digital Terrain Models. Int. J. Digit. Earth 2014, 7, 492–509. [Google Scholar] [CrossRef]
- Arjun, P. Machine Learning and AI for Healthcare: Big Data for Improved Health Outcomes; Apress: London, UK, 2019. [Google Scholar]
- Fayed, H.A.; Atiya, A.F. Speed up grid-search for parameter selection of support vector machines. Appl. Soft Comput. 2019, 80, 202–210. [Google Scholar] [CrossRef]
- Malley, T.O.; Bursztein, E.; Long, J.; Chollet, F.; Jin, H.; Invernizzi, L. Hyperparameter Tuning with Keras Tuner. 2019. Available online: https://github.com/keras-team/keras-tuner (accessed on 8 November 2022).


| Dataset | Classes | Training Set | Testing Set | Total |
|---|---|---|---|---|
| Dataset 1 | Heart disease | 21,898 | 5475 | 27,373 |
| Healthy | 24,000 | 6000 | 30,000 | |
| Total | 45,898 | 11,475 | 57,373 | |
| Cleveland Dataset | Heart disease | 421 | 105 | 526 |
| Healthy | 399 | 100 | 499 | |
| Total | 820 | 205 | 1025 |
| Parameters | Values |
|---|---|
| filters | [16,128] |
| Kernel_size | [2,3,4,5] |
| Pool_Size | [2,3,4,5] |
| Unit_LSTM | between 20 and 500 |
| Unit_GRU | between 20 and 500 |
| Unit_Dense | between 20 and 500 |
| Dataset | Models | Parameters | Full Features | Selected Features |
|---|---|---|---|---|
| Dataset 1 | CNN-LSTM | filters | 128 | 16 |
| Kernel_size | 4 | 4 | ||
| Pool_Size | 2 | 2 | ||
| Unit_LSTM | 380 | 40 | ||
| Unit_Dense | 140 | 50 | ||
| CNN-GRU | filters | 128 | 16 | |
| Kernel_size | 4 | 4 | ||
| Pool_Size | 2 | 2 | ||
| Unit_GRU | 100 | 320 | ||
| Unit_Dense | 100 | 200 |
| Approaches | Models | Features | Matrix Performance | |||
|---|---|---|---|---|---|---|
| ACC | PRE | REC | F1 | |||
| Regular ML approach | RF | Full features | 75.32 | 75.44 | 75.32 | 75.33 |
| Selected features | 73.02 | 73.06 | 73.02 | 73.03 | ||
| LR | Full features | 75.60 | 75.60 | 75.60 | 75.60 | |
| Selected features | 73.58 | 73.60 | 73.58 | 73.59 | ||
| DT | Full features | 67.28 | 67.26 | 67.28 | 67.27 | |
| Selected features | 65.76 | 65.76 | 65.76 | 65.7 | ||
| NB | Full features | 60.87 | 64.98 | 60.87 | 56.69 | |
| Selected features | 60.84 | 64.97 | 60.84 | 56.63 | ||
| KNN | Full features | 73.16 | 73.47 | 73.16 | 73.16 | |
| Selected features | 72.59 | 72.92 | 72.59 | 72.59 | ||
| The hybrid models | CNN-LSTM | Full features | 76.64 | 76.9 | 76.64 | 76.65 |
| Selected features | 75.22 | 75.42 | 75.22 | 75.22 | ||
| CNN-GRU | Full features | 75.63 | 75.65 | 75.63 | 75.58 | |
| Selected features | 74.07 | 74.23 | 74.07 | 74.08 | ||
| The proposed model | Stacking SVM | Full features | 78.81 | 78.1 | 78.81 | 78.81 |
| Selected features | 77.42 | 77.99 | 77.42 | 77.39 | ||
| Datasets | Models | Parameters | Full Features | Selected Features |
|---|---|---|---|---|
| Cleveland dataset | CNN-LSTM | filters | 128 | 16 |
| Kernel_size | 4 | 5 | ||
| Pool_Size | 2 | 2 | ||
| Unit_LSTM | 360 | 60 | ||
| Dense Unit | 160 | 20 | ||
| CNN-GRU | filters | 64 | 16 | |
| Kernel_size | 4 | 5 | ||
| Pool_Size | 2 | 2 | ||
| Unit_GRU | 440 | 80 | ||
| Unit_Dense | 160 | 40 |
| Approaches | Models | Features | Matrix Performance | |||
|---|---|---|---|---|---|---|
| ACC | PRE | REC | F1 | |||
| Regular ML approach | RF | Full features | 86.34 | 86.34 | 86.34 | 86.34 |
| Selected features | 82.93 | 82.99 | 82.93 | 82.91 | ||
| LR | Full features | 67.32 | 67.43 | 67.3 | 67.18 | |
| Selected features | 73.17 | 73.19 | 73.17 | 73.14 | ||
| DT | Full features | 82.44 | 82.46 | 82.44 | 82.44 | |
| Selected features | 81.95 | 82.01 | 81.95 | 81.93 | ||
| NB | Full features | 60.00 | 60.05 | 60.00 | 59.74 | |
| Selected features | 64.88 | 64.90 | 64.88 | 64.88 | ||
| KNN | Full features | 60.00 | 60.25 | 60.00 | 59.92 | |
| Selected features | 66.34 | 66.62 | 66.34 | 66.29 | ||
| The hybrid models | CNN-LSTM | Full features | 89.76 | 89.96 | 89.76 | 89.75 |
| Selected features | 86.34 | 86.41 | 86.34 | 86.34 | ||
| CNN-GRU | Full features | 88.29 | 89.06 | 88.29 | 88.26 | |
| Selected features | 85.85 | 86.92 | 85.85 | 85.78 | ||
| The proposed model | Stacking SVM | Full features | 97.17 | 97.42 | 97.17 | 97.15 |
| Selected features | 91.22 | 91.29 | 91.22 | 91.22 | ||
| Papers | Models | Datasets | Accuracy |
|---|---|---|---|
| [17] | hybrid model that combines DT and RF | Cleveland Dataset. | 88.7% |
| [18] | DT, AdaBoost, LR, SGD, RF, GBM, ETC, GNB, SVM | Cleveland Dataset. | 92.62% |
| [20] | BayesNet, LR, SGD, IBK(k = 21), AdaB(DS), AdaB(Logistic), RF | Cleveland Dataset. | 85% |
| [21] | LR, KNN, SVM, RF, DT, DL | Cleveland Dataset. | 94.2% |
| [22] | KNN, MLP, SVM, and J48 | Cleveland Dataset. | 88.34% |
| [23] | K-NN, DT, NB, LR, SVM, NN, Vote | Cleveland Dataset. | 87.41% |
| [24] | DT, LR, RF, NB, LR (SVM) | Cleveland Dataset. | 84.85% |
| [28] | Ensemble Voting, | Cleveland Dataset. | 96.43% |
| [29] | Hard Voting Ensemble Model | Cleveland Dataset. | 85.71% |
| Our work | The proposed model | Cleveland Dataset. | 98.41 |
Publisher’s Note: MDPI stays neutral with regard to jurisdictional claims in published maps and institutional affiliations. |
© 2022 by the authors. Licensee MDPI, Basel, Switzerland. This article is an open access article distributed under the terms and conditions of the Creative Commons Attribution (CC BY) license (https://creativecommons.org/licenses/by/4.0/).
Share and Cite
Almulihi, A.; Saleh, H.; Hussien, A.M.; Mostafa, S.; El-Sappagh, S.; Alnowaiser, K.; Ali, A.A.; Refaat Hassan, M. Ensemble Learning Based on Hybrid Deep Learning Model for Heart Disease Early Prediction. Diagnostics 2022, 12, 3215. https://doi.org/10.3390/diagnostics12123215
Almulihi A, Saleh H, Hussien AM, Mostafa S, El-Sappagh S, Alnowaiser K, Ali AA, Refaat Hassan M. Ensemble Learning Based on Hybrid Deep Learning Model for Heart Disease Early Prediction. Diagnostics. 2022; 12(12):3215. https://doi.org/10.3390/diagnostics12123215
Chicago/Turabian StyleAlmulihi, Ahmed, Hager Saleh, Ali Mohamed Hussien, Sherif Mostafa, Shaker El-Sappagh, Khaled Alnowaiser, Abdelmgeid A. Ali, and Moatamad Refaat Hassan. 2022. "Ensemble Learning Based on Hybrid Deep Learning Model for Heart Disease Early Prediction" Diagnostics 12, no. 12: 3215. https://doi.org/10.3390/diagnostics12123215