
Automated Detection of Corneal Ulcer Using Combination Image Processing and Deep Learning

 , , ,
, , ,  and
and
Abstract
:1. Introduction
2. Review of the Study
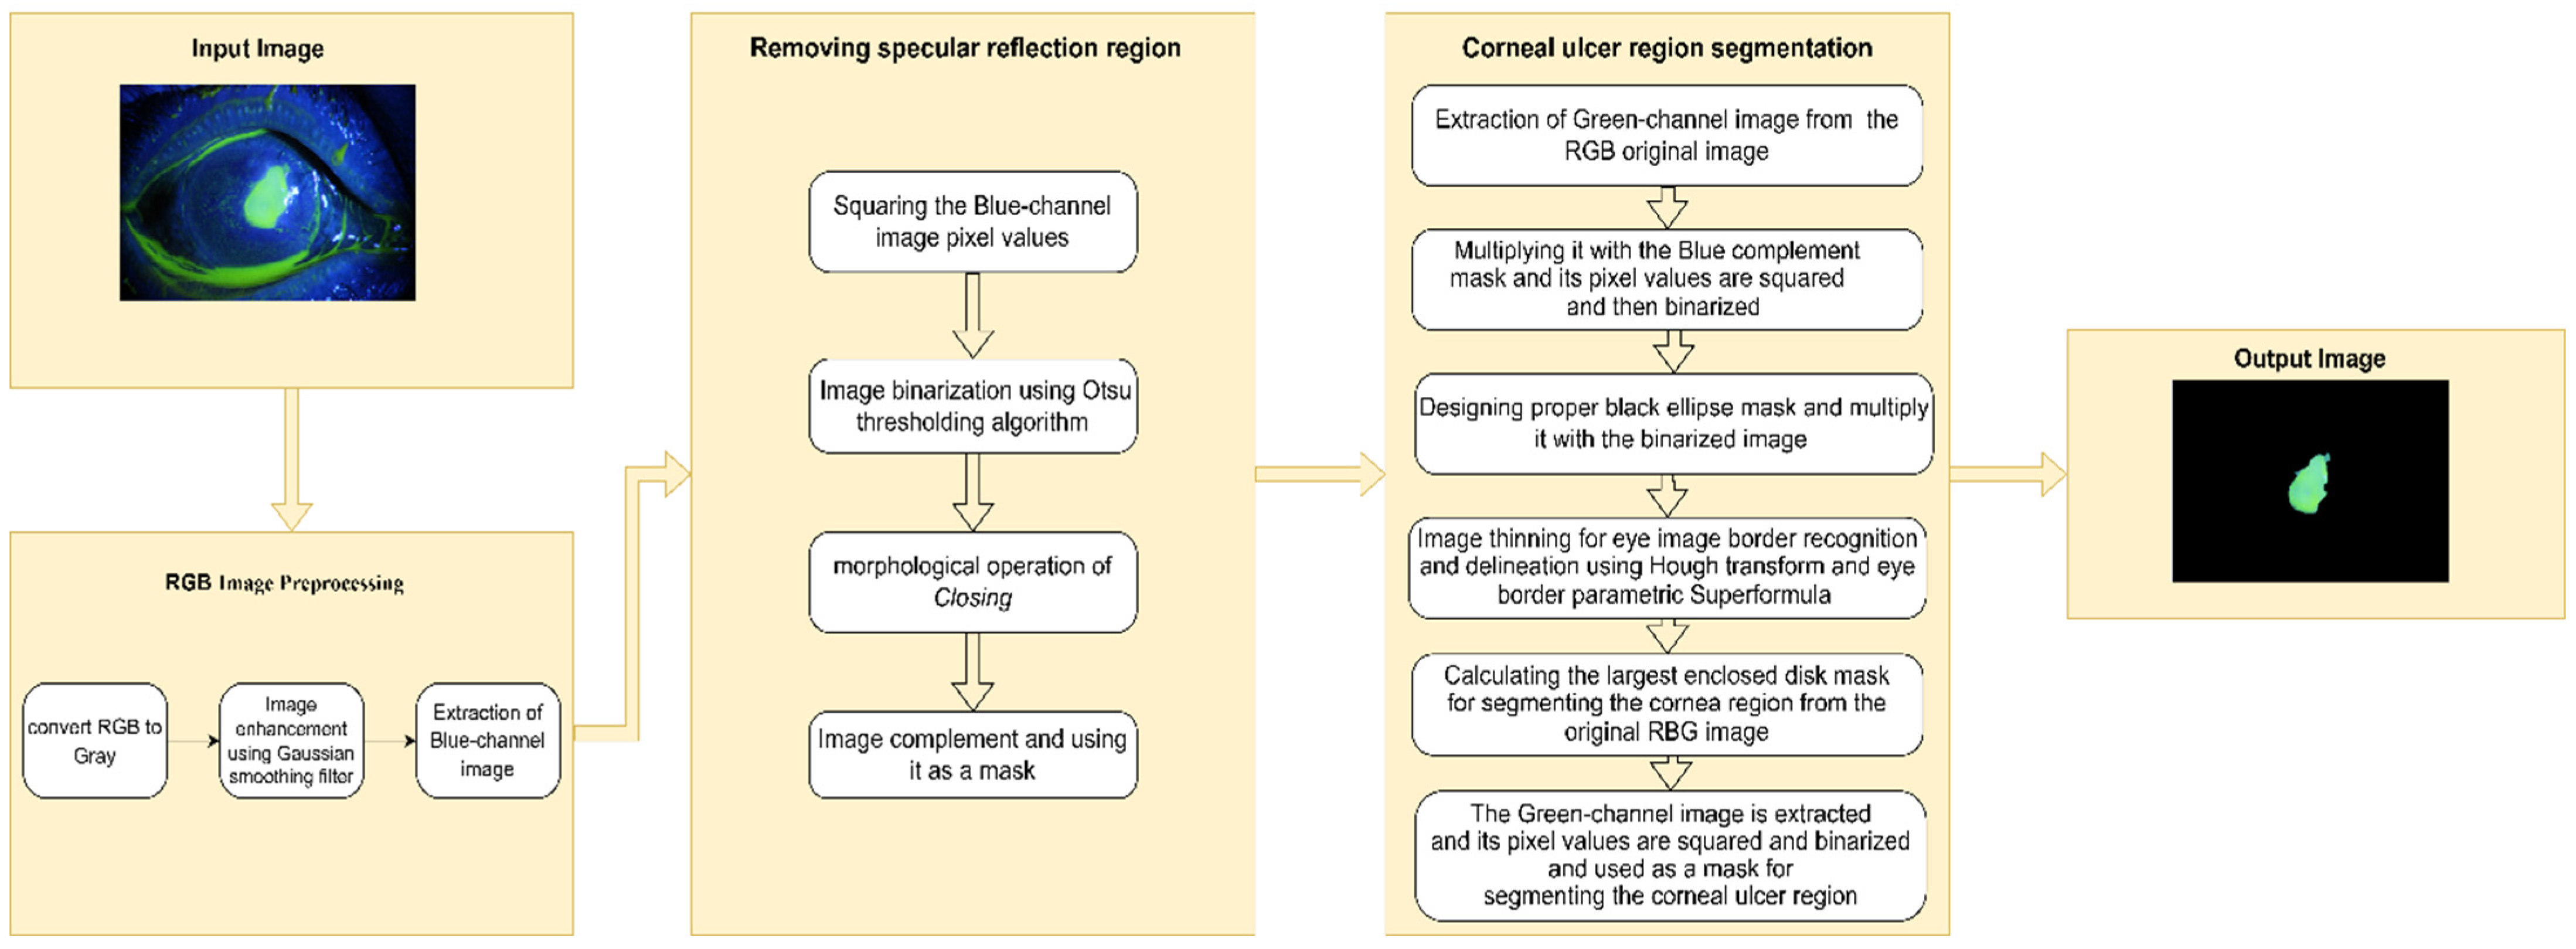
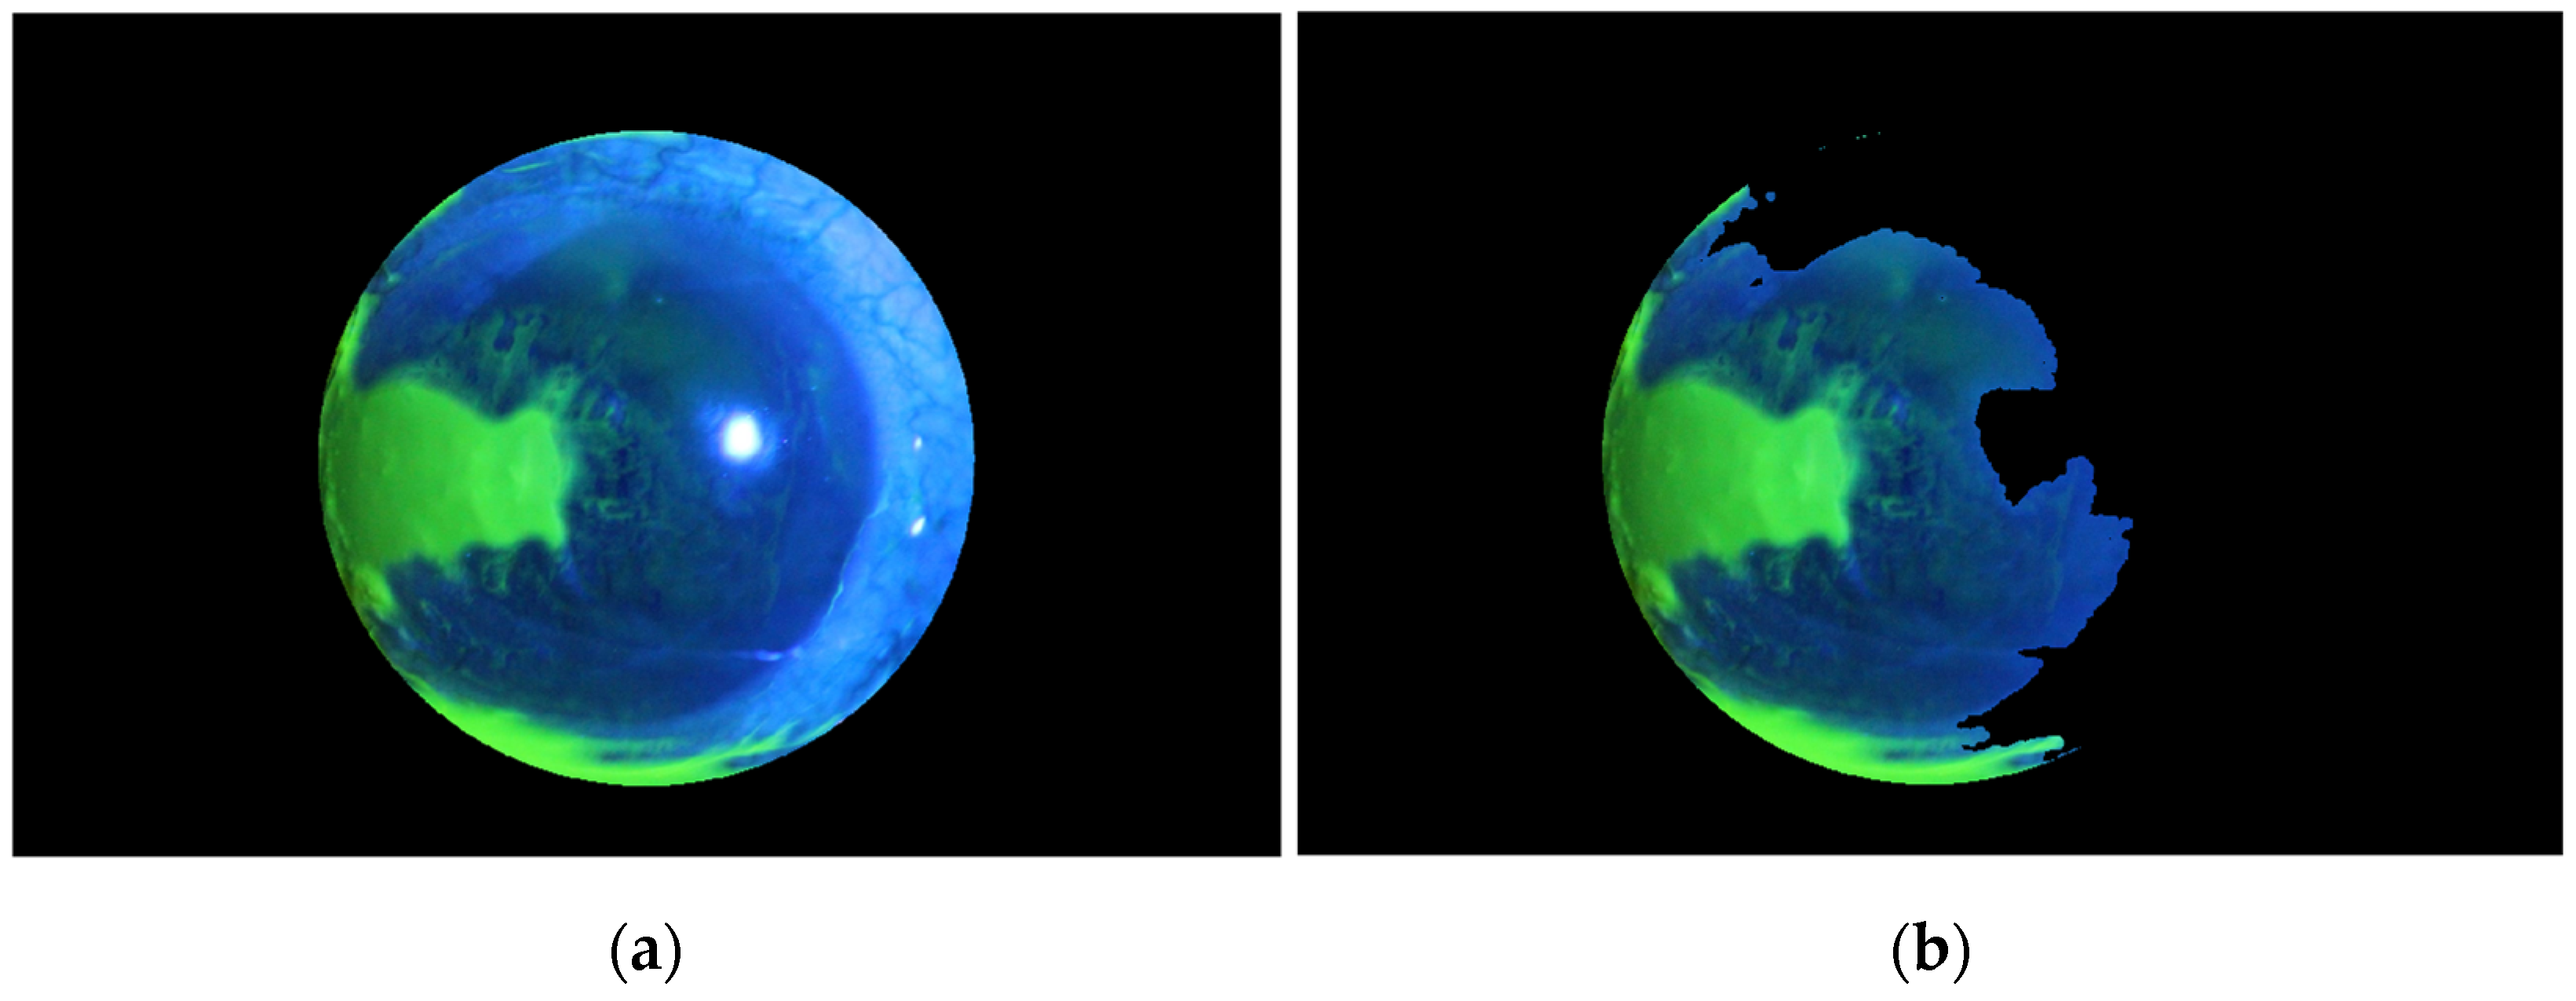
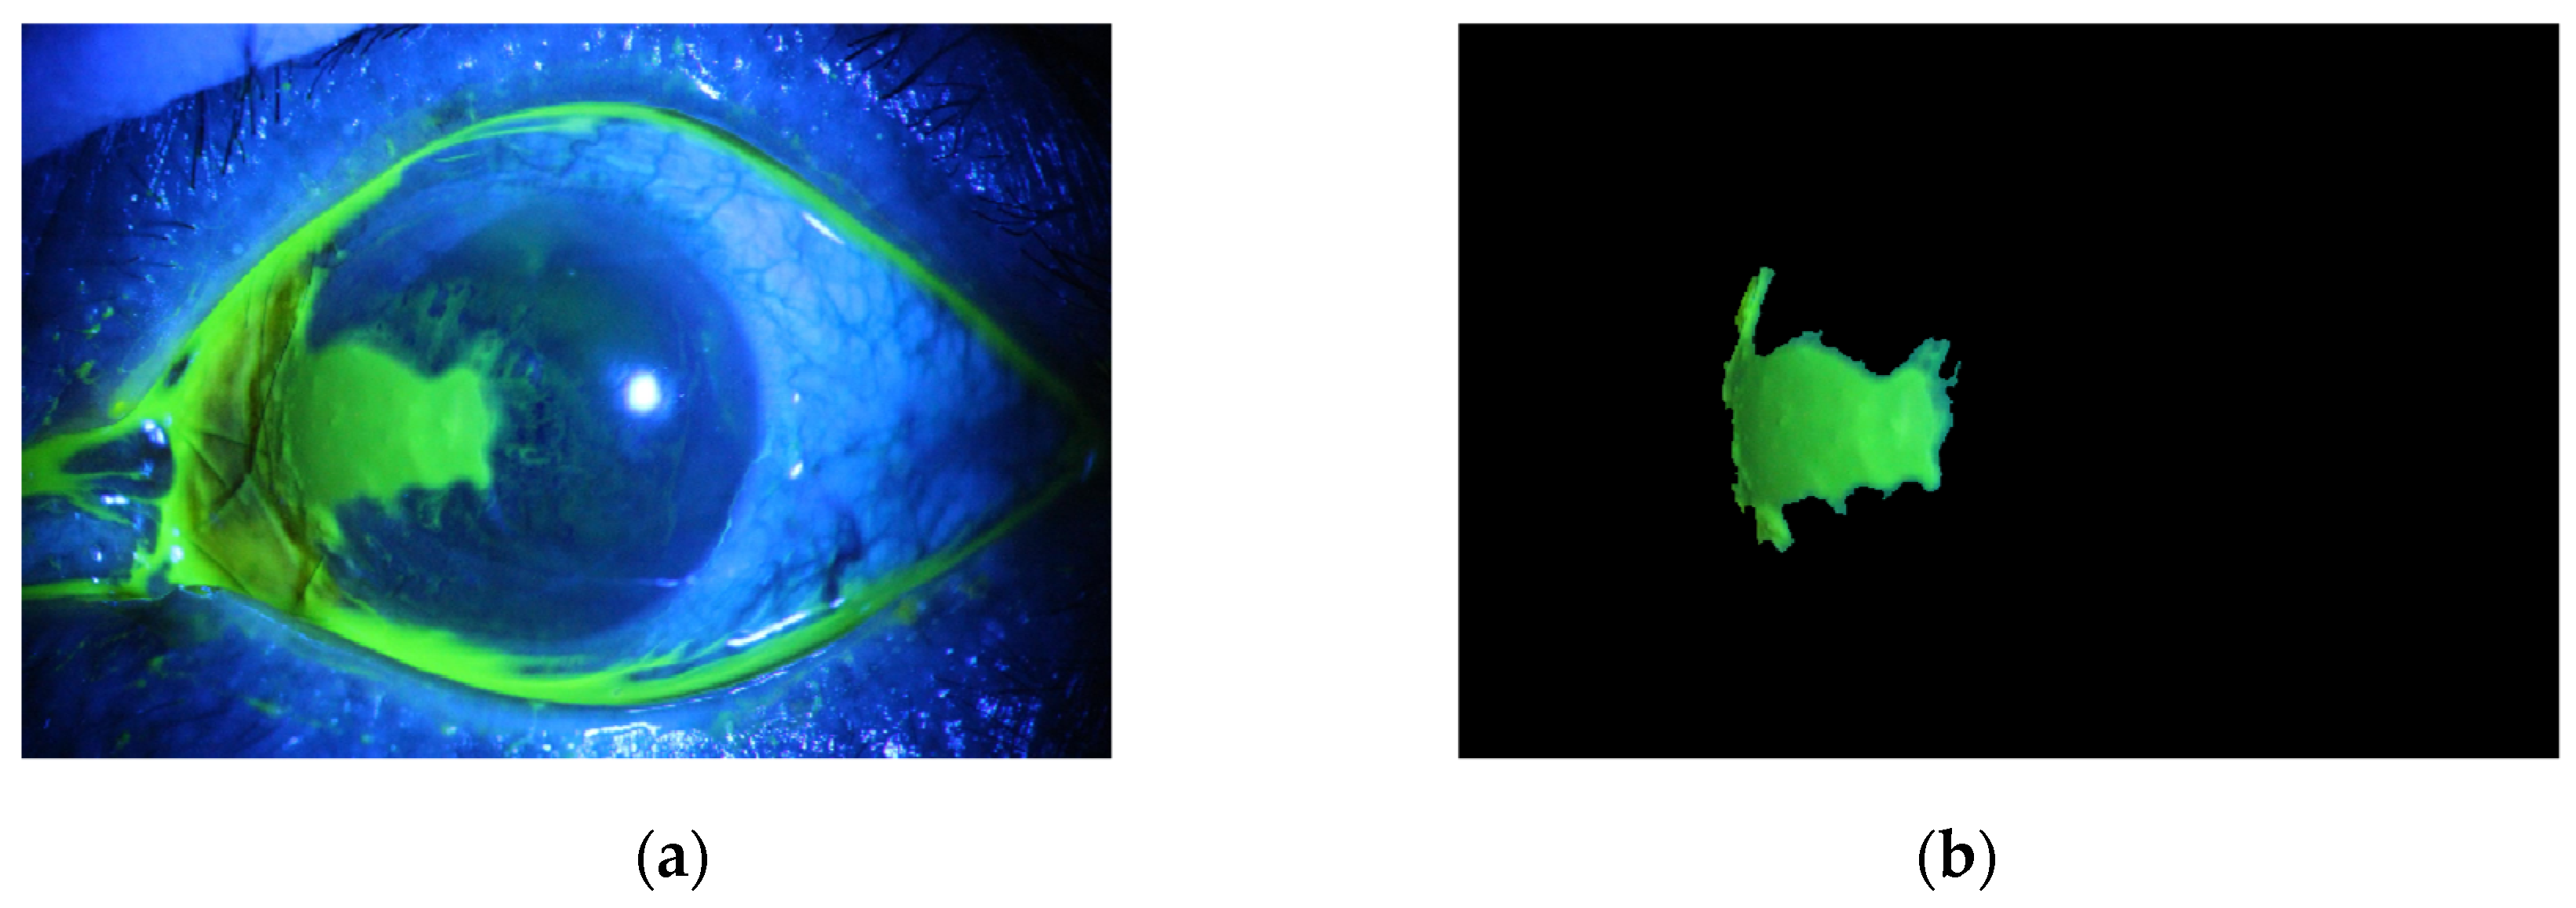
3. Materials and Methods
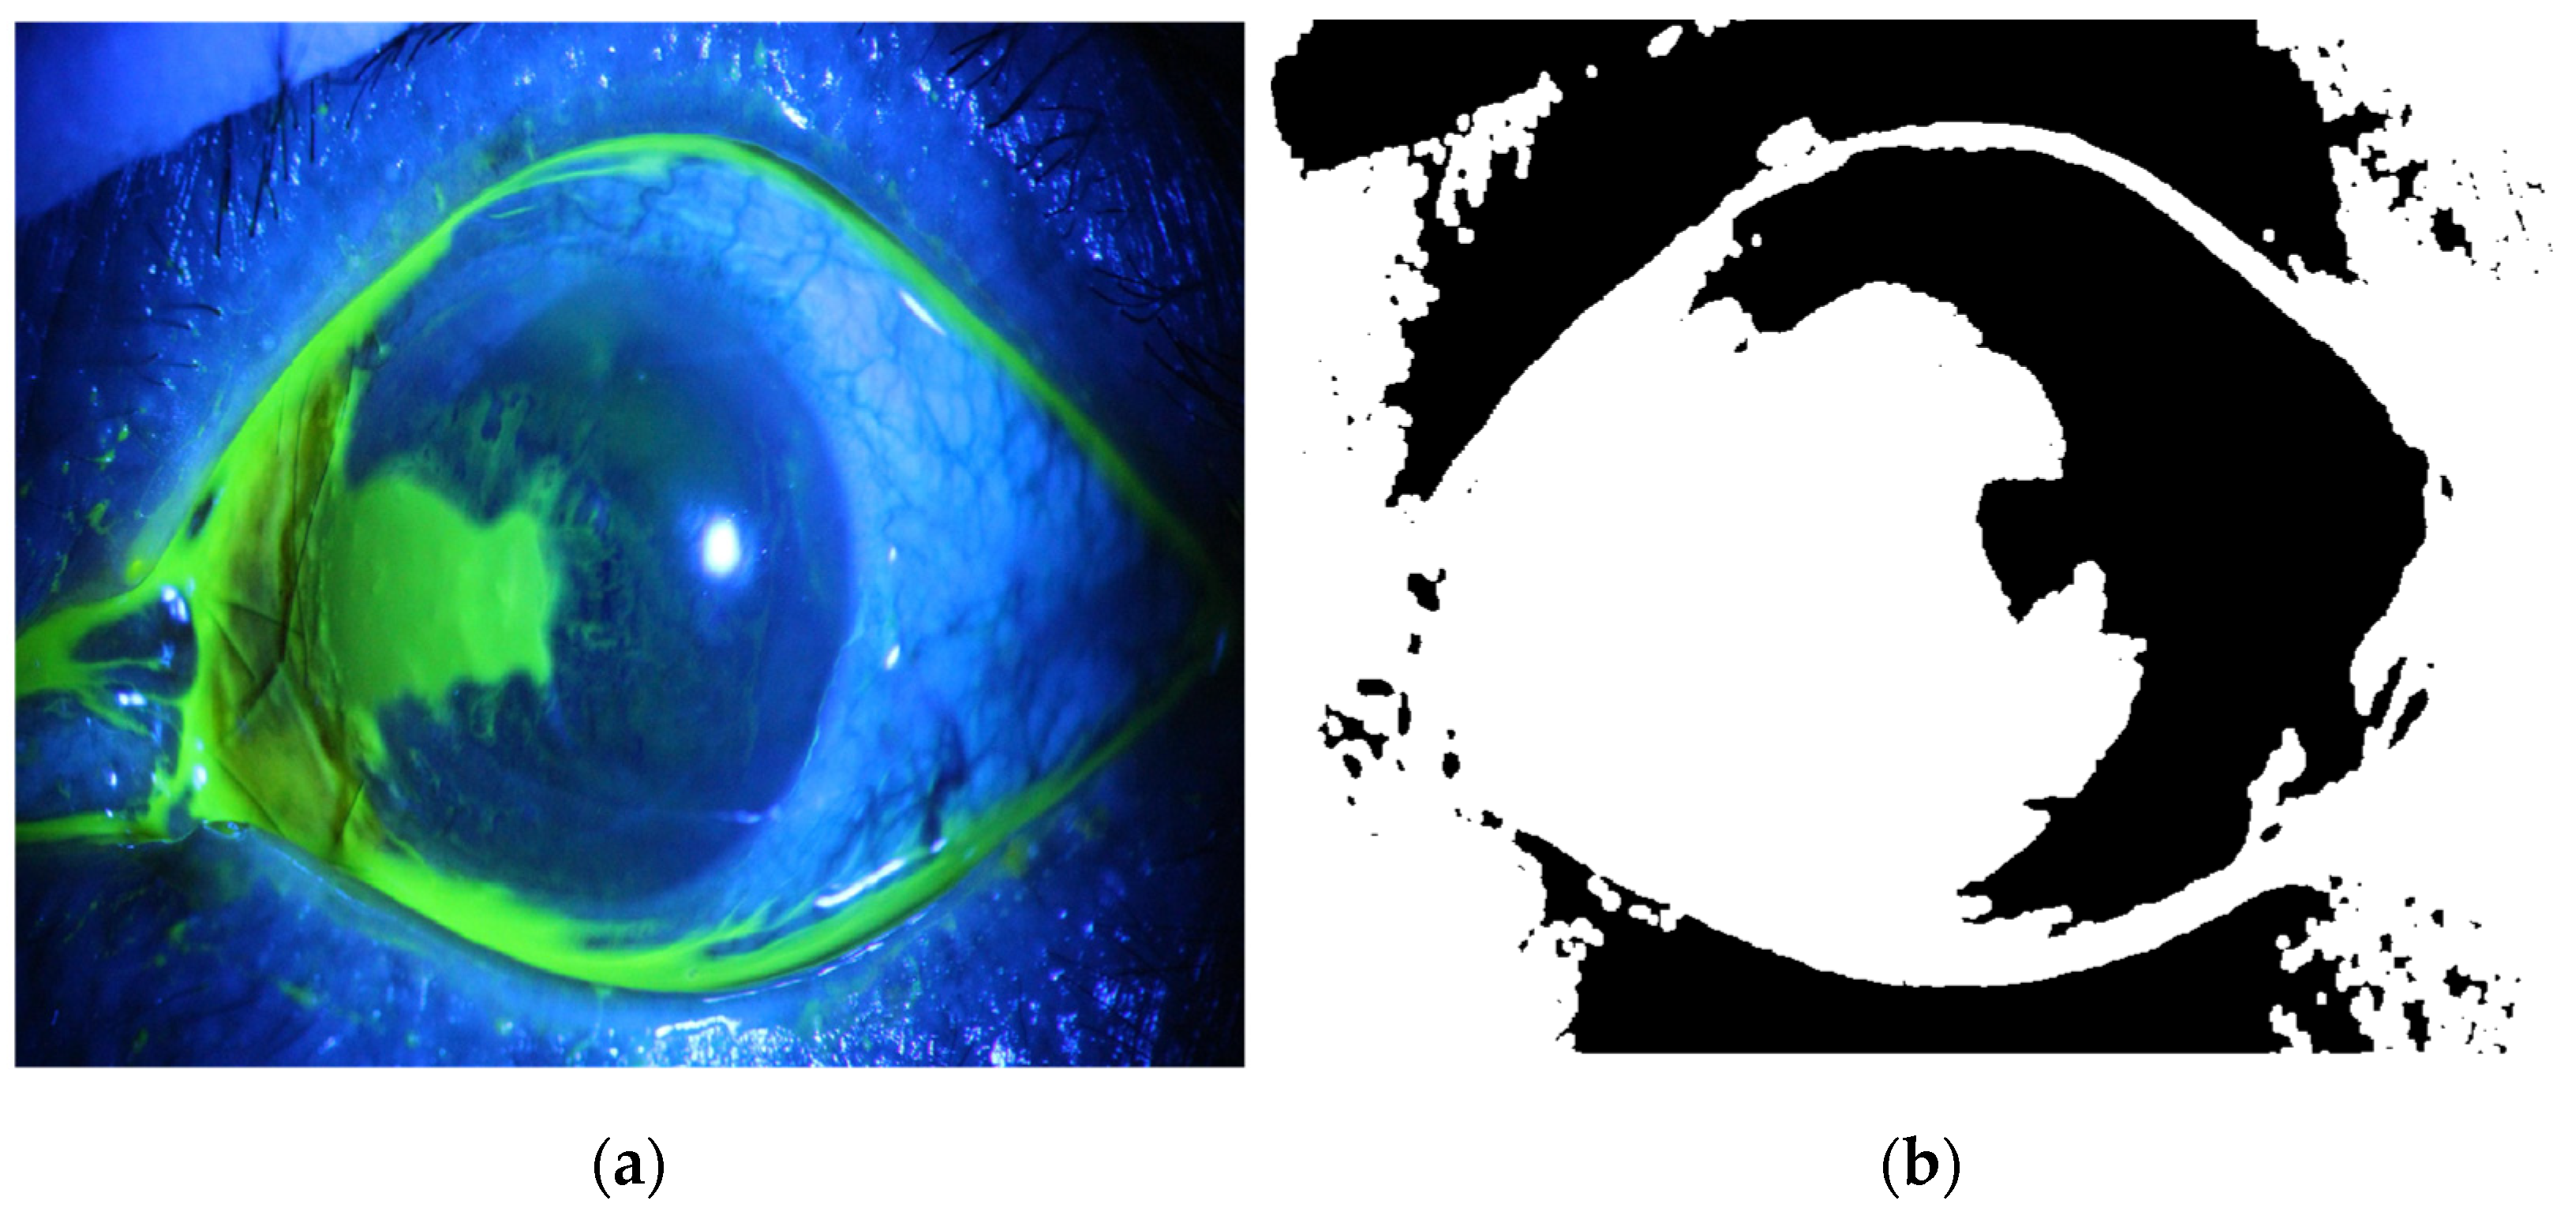
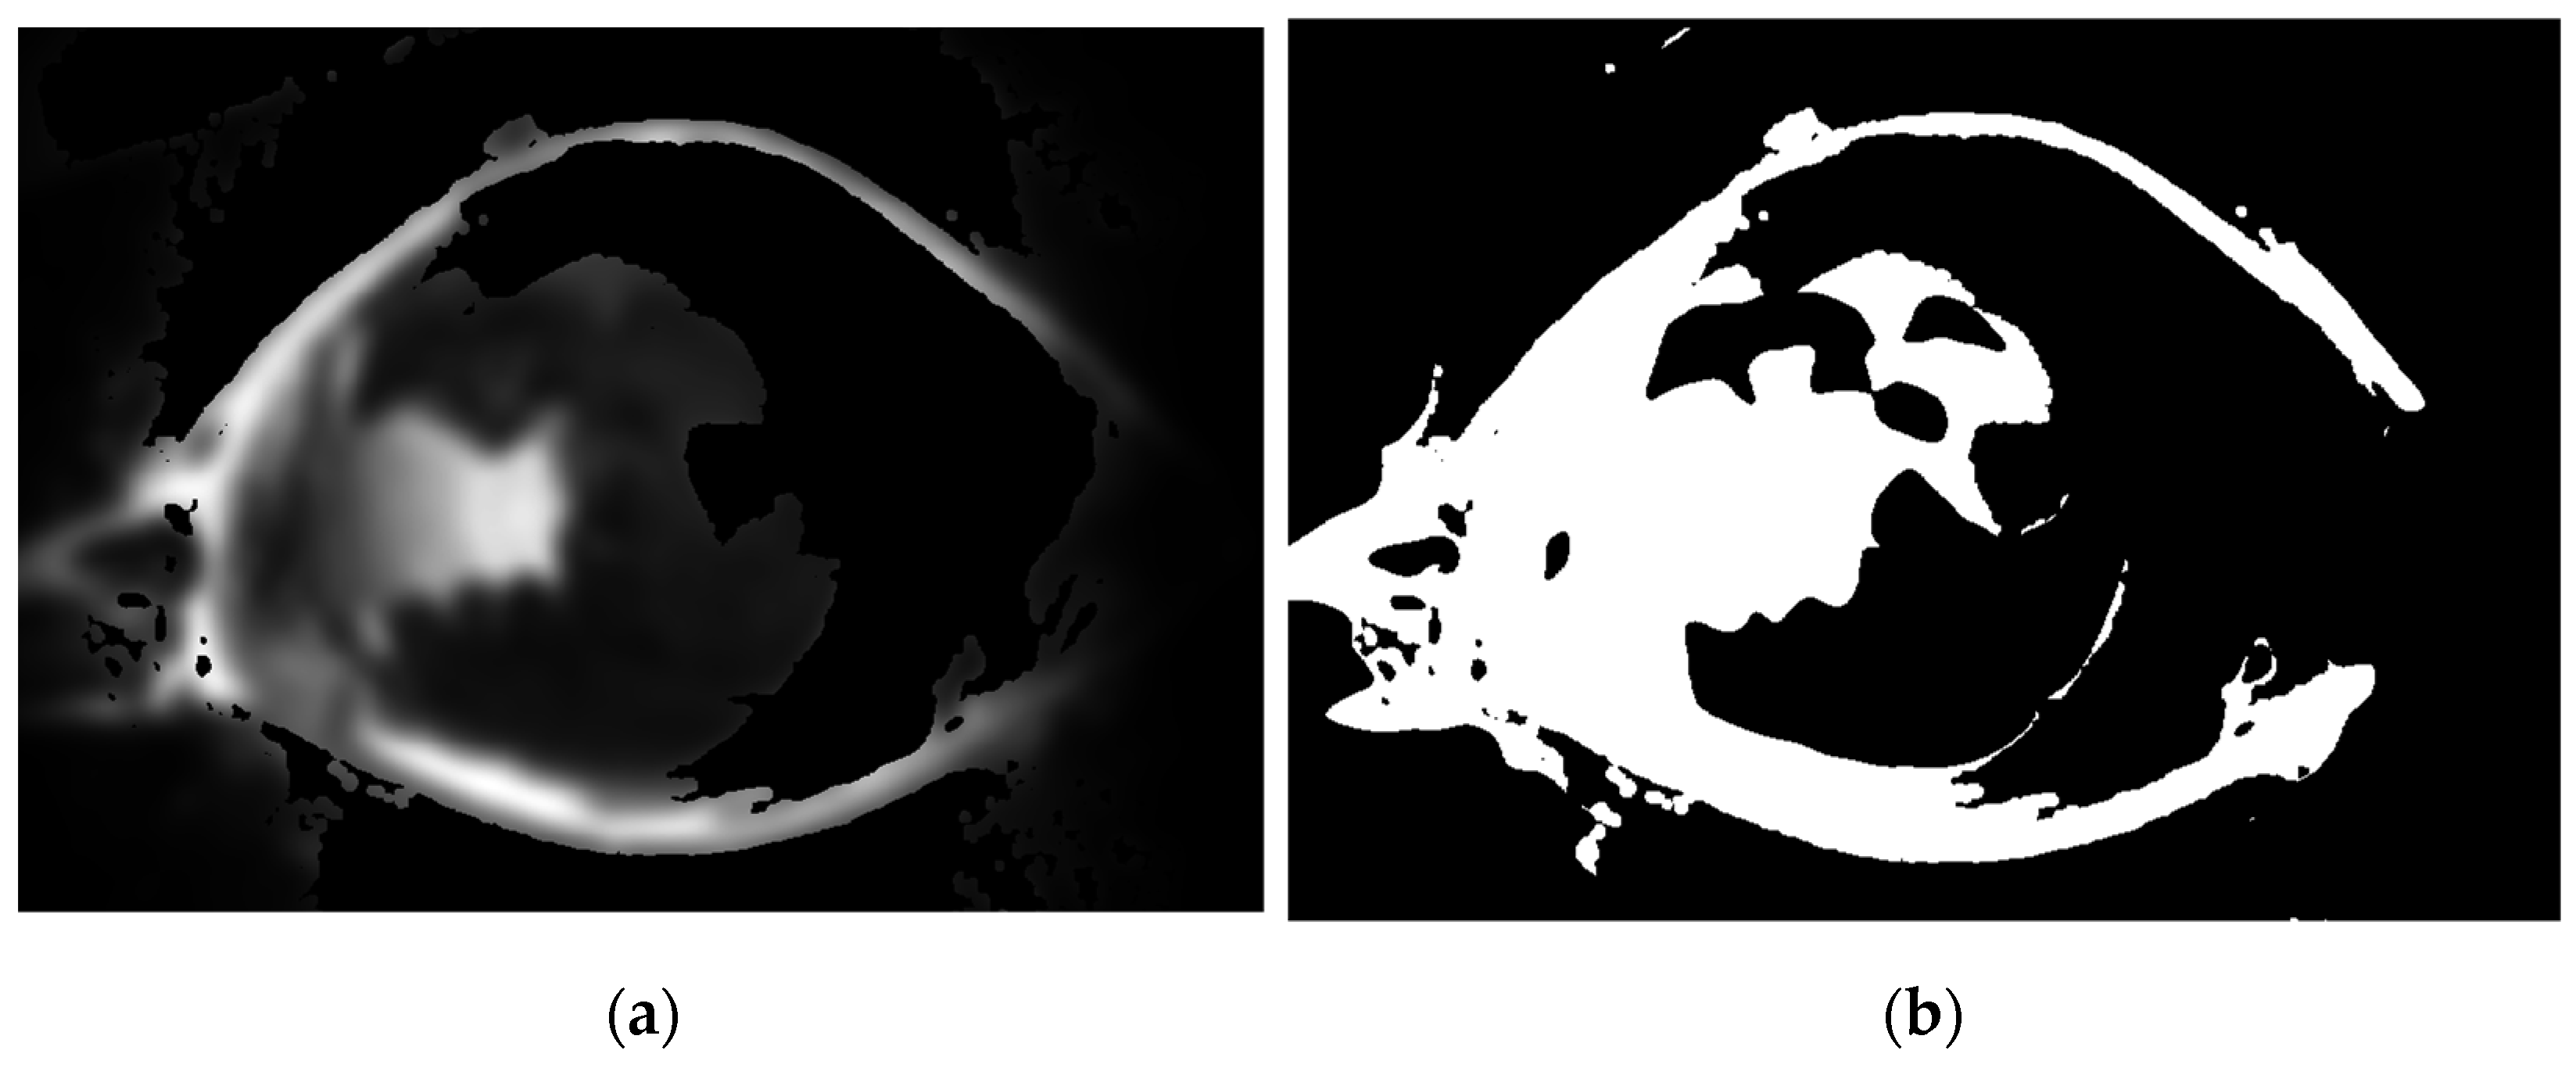
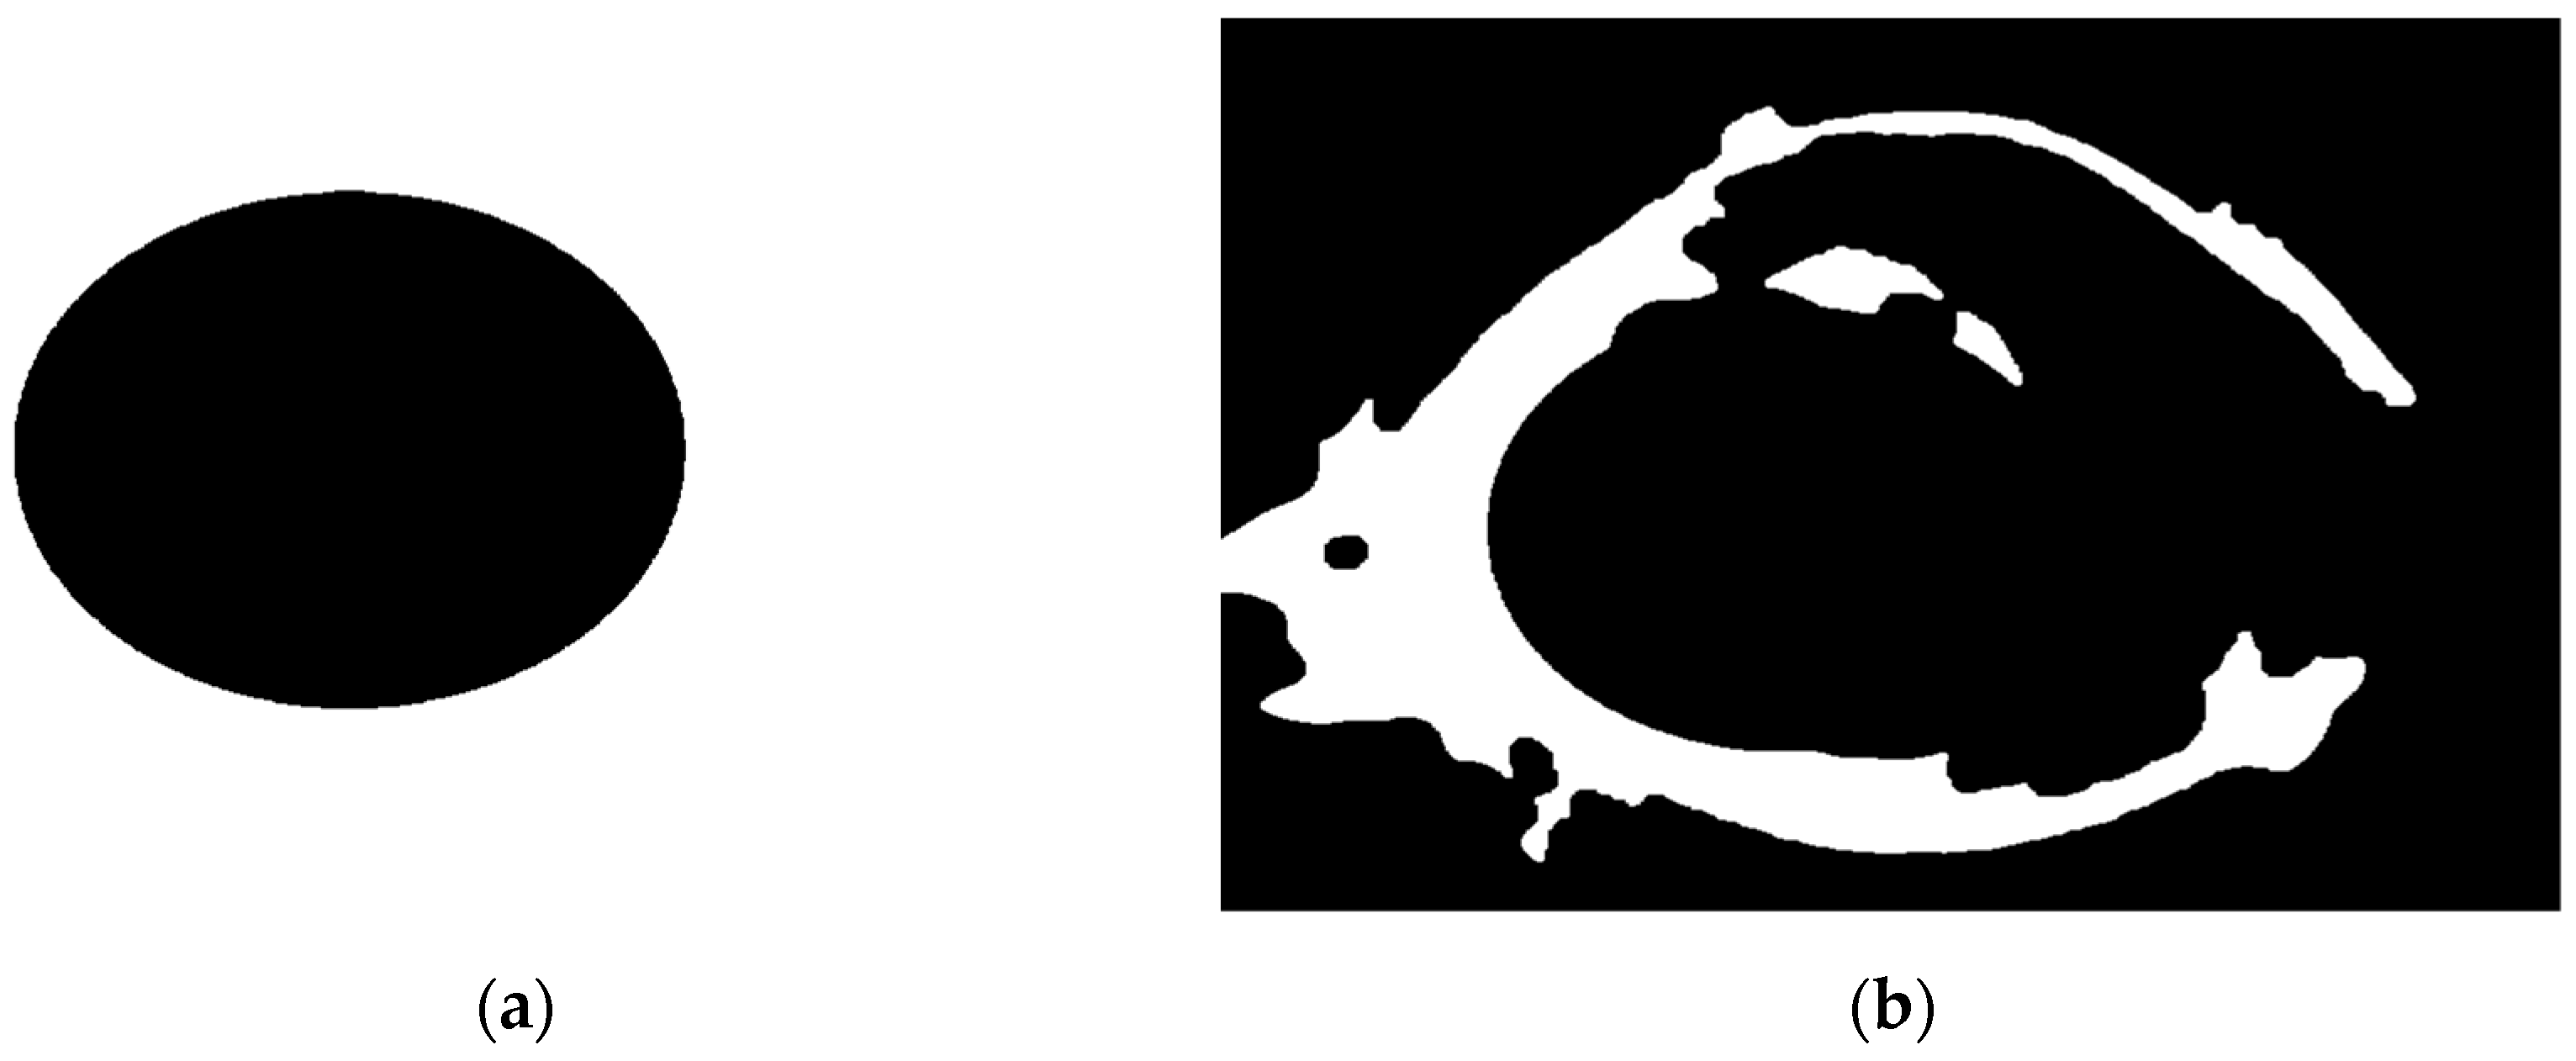
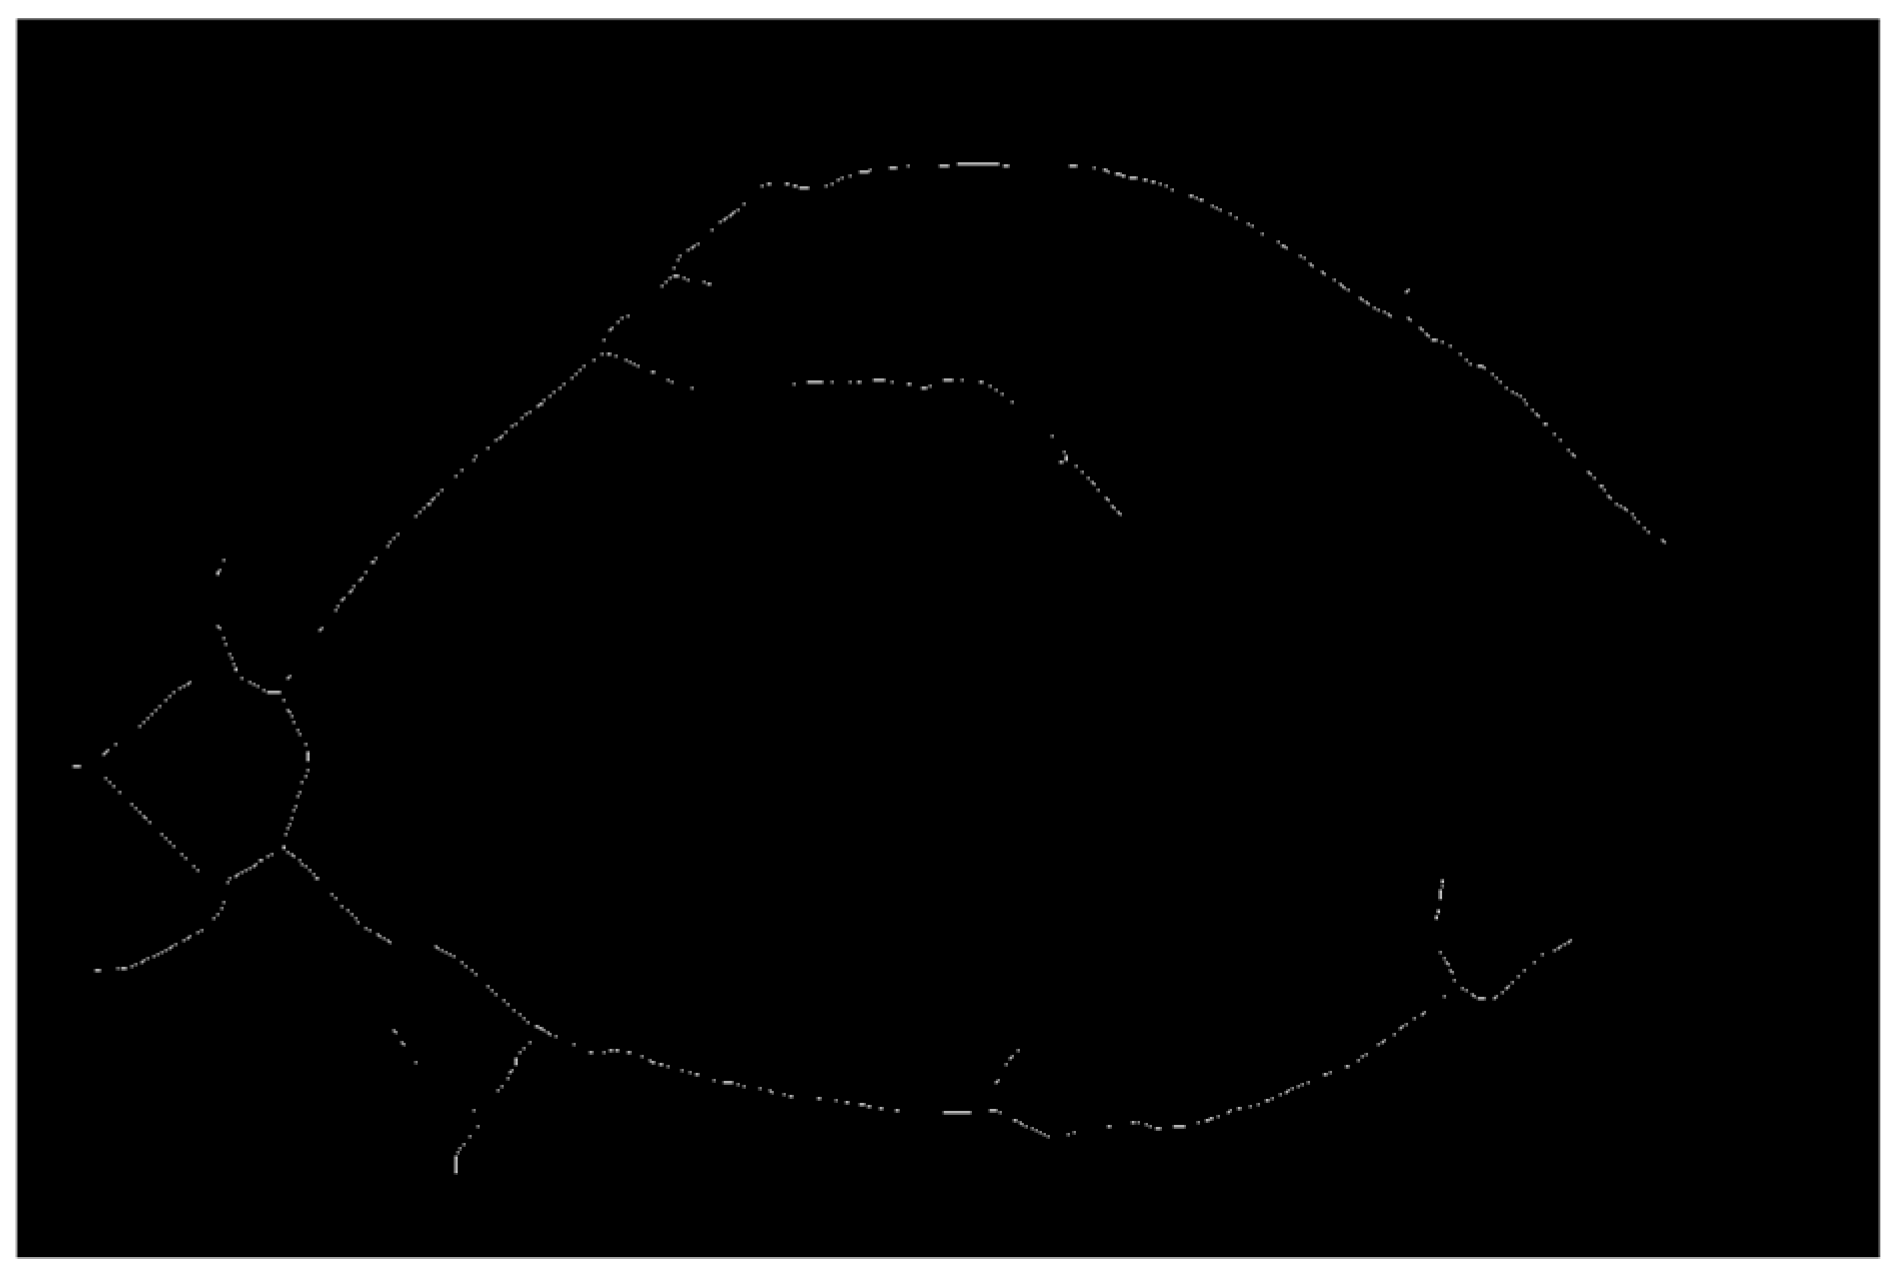
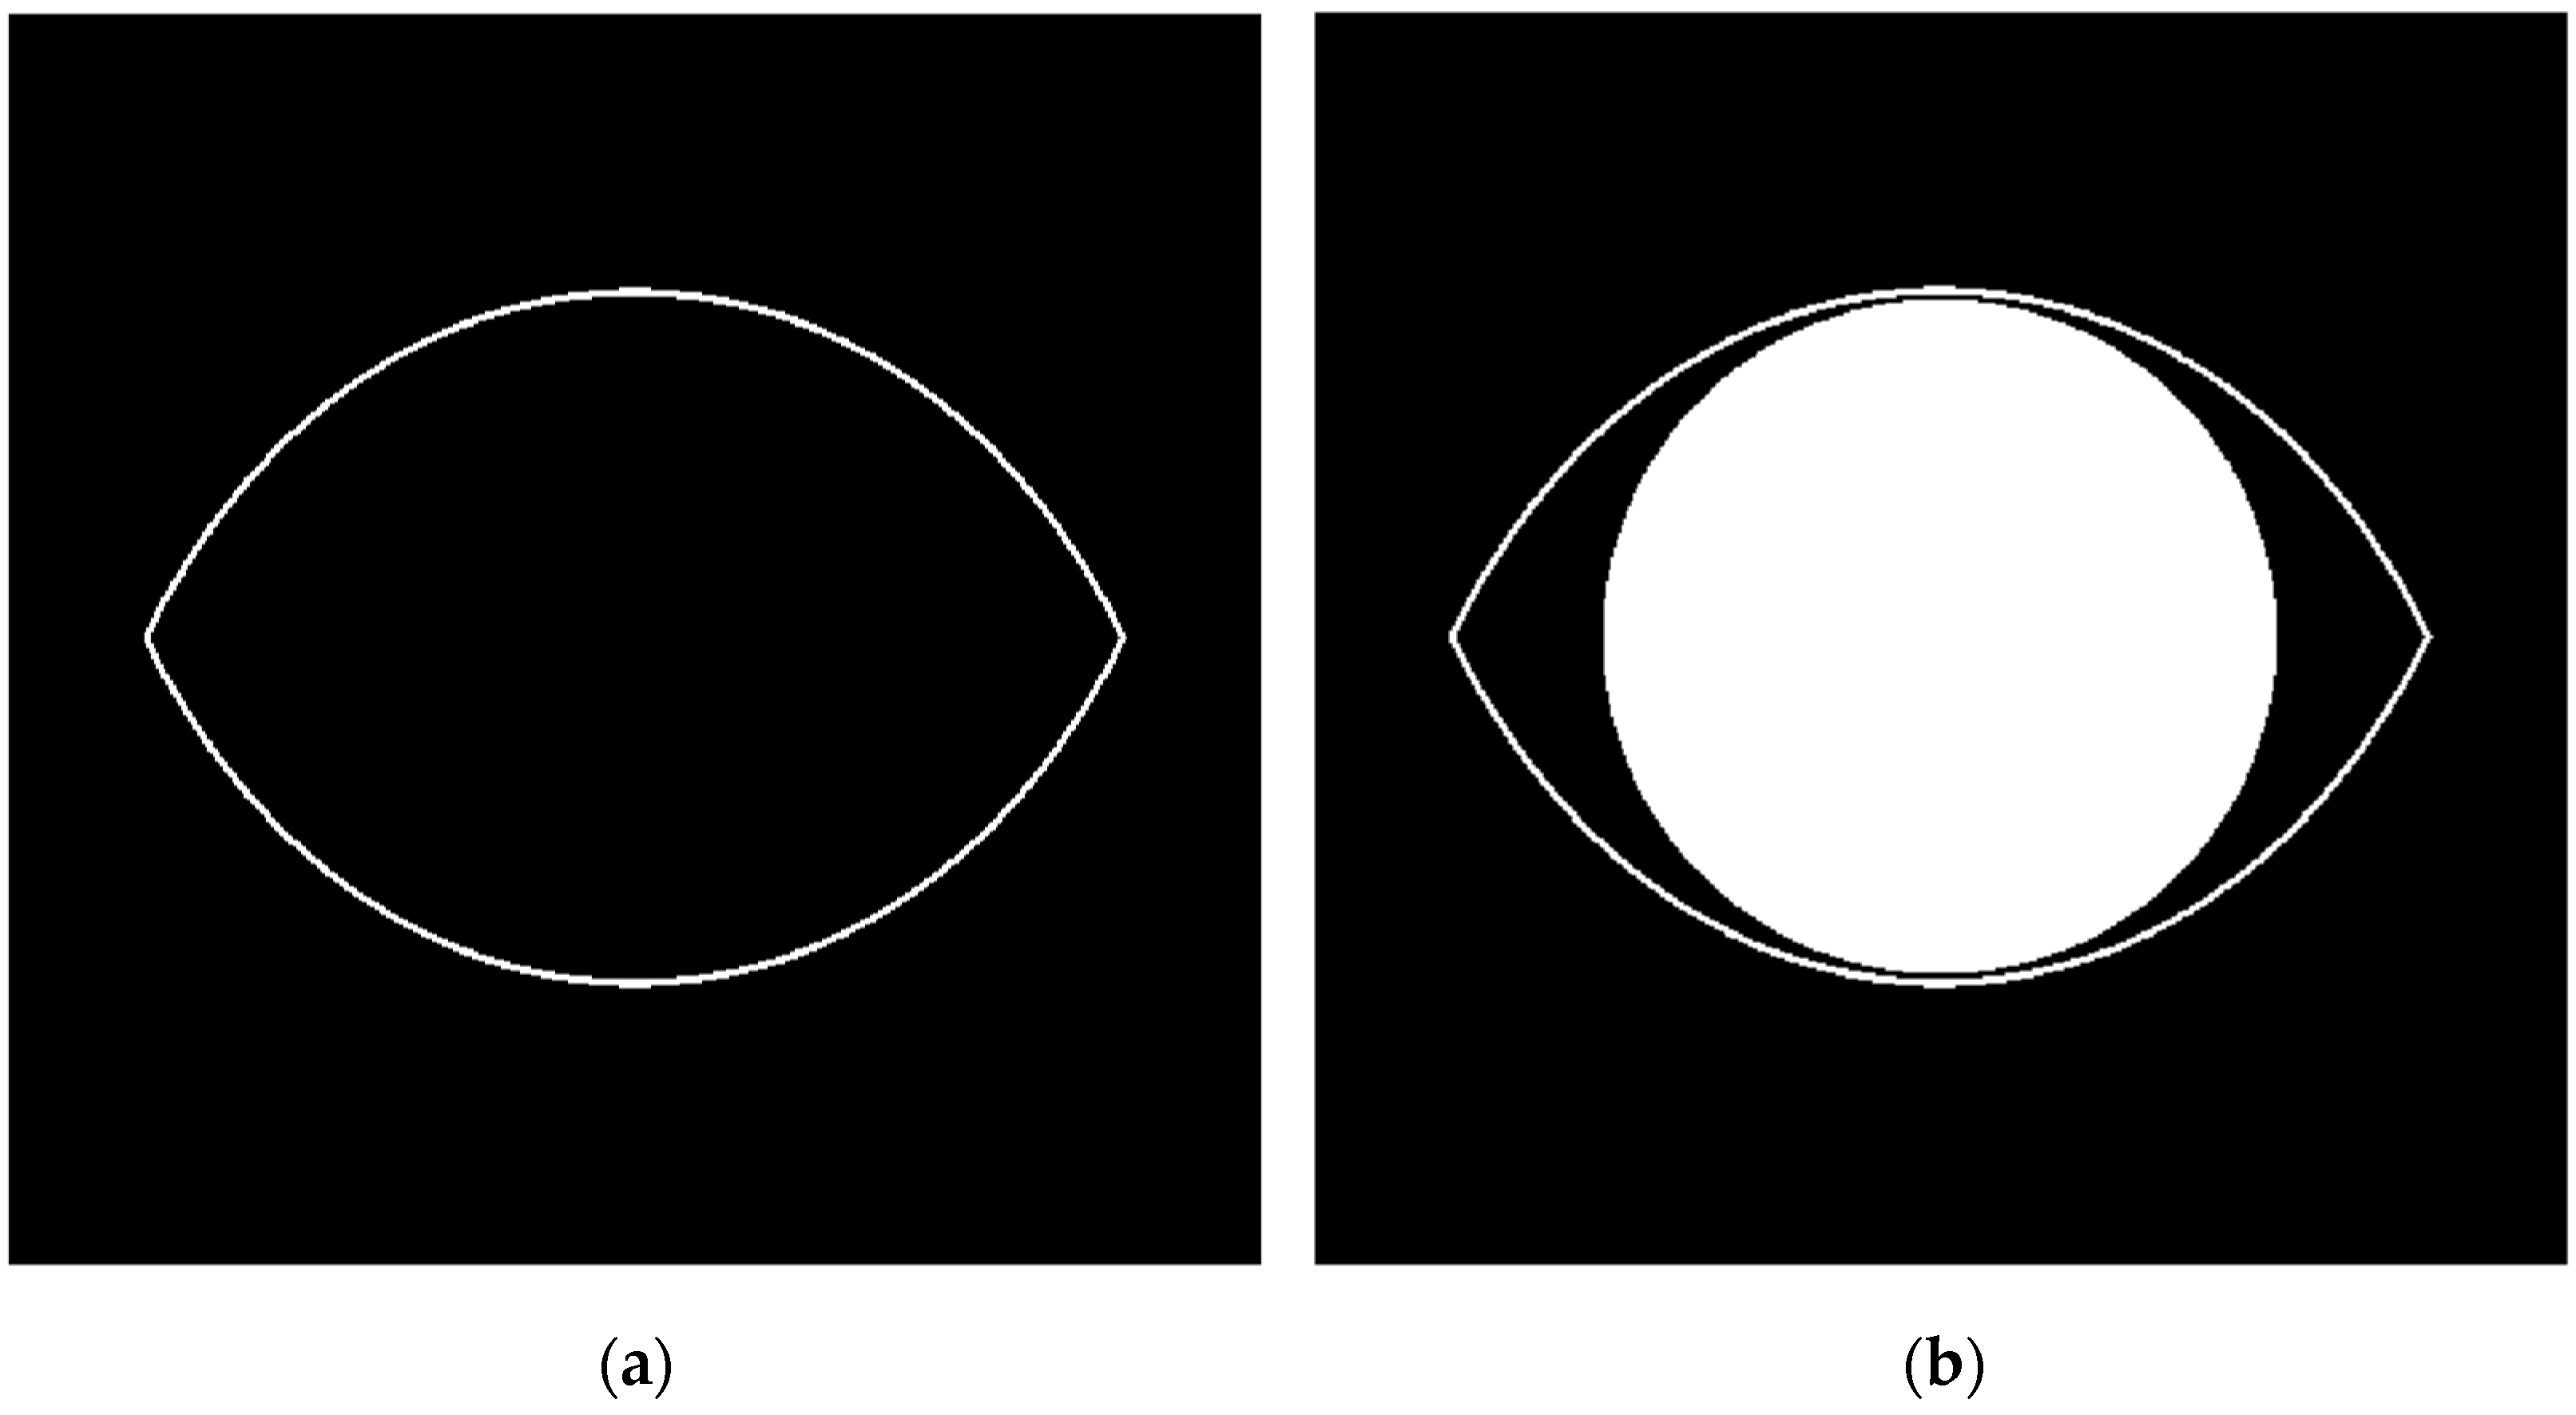
3.1. Image Processing with Hough Transform
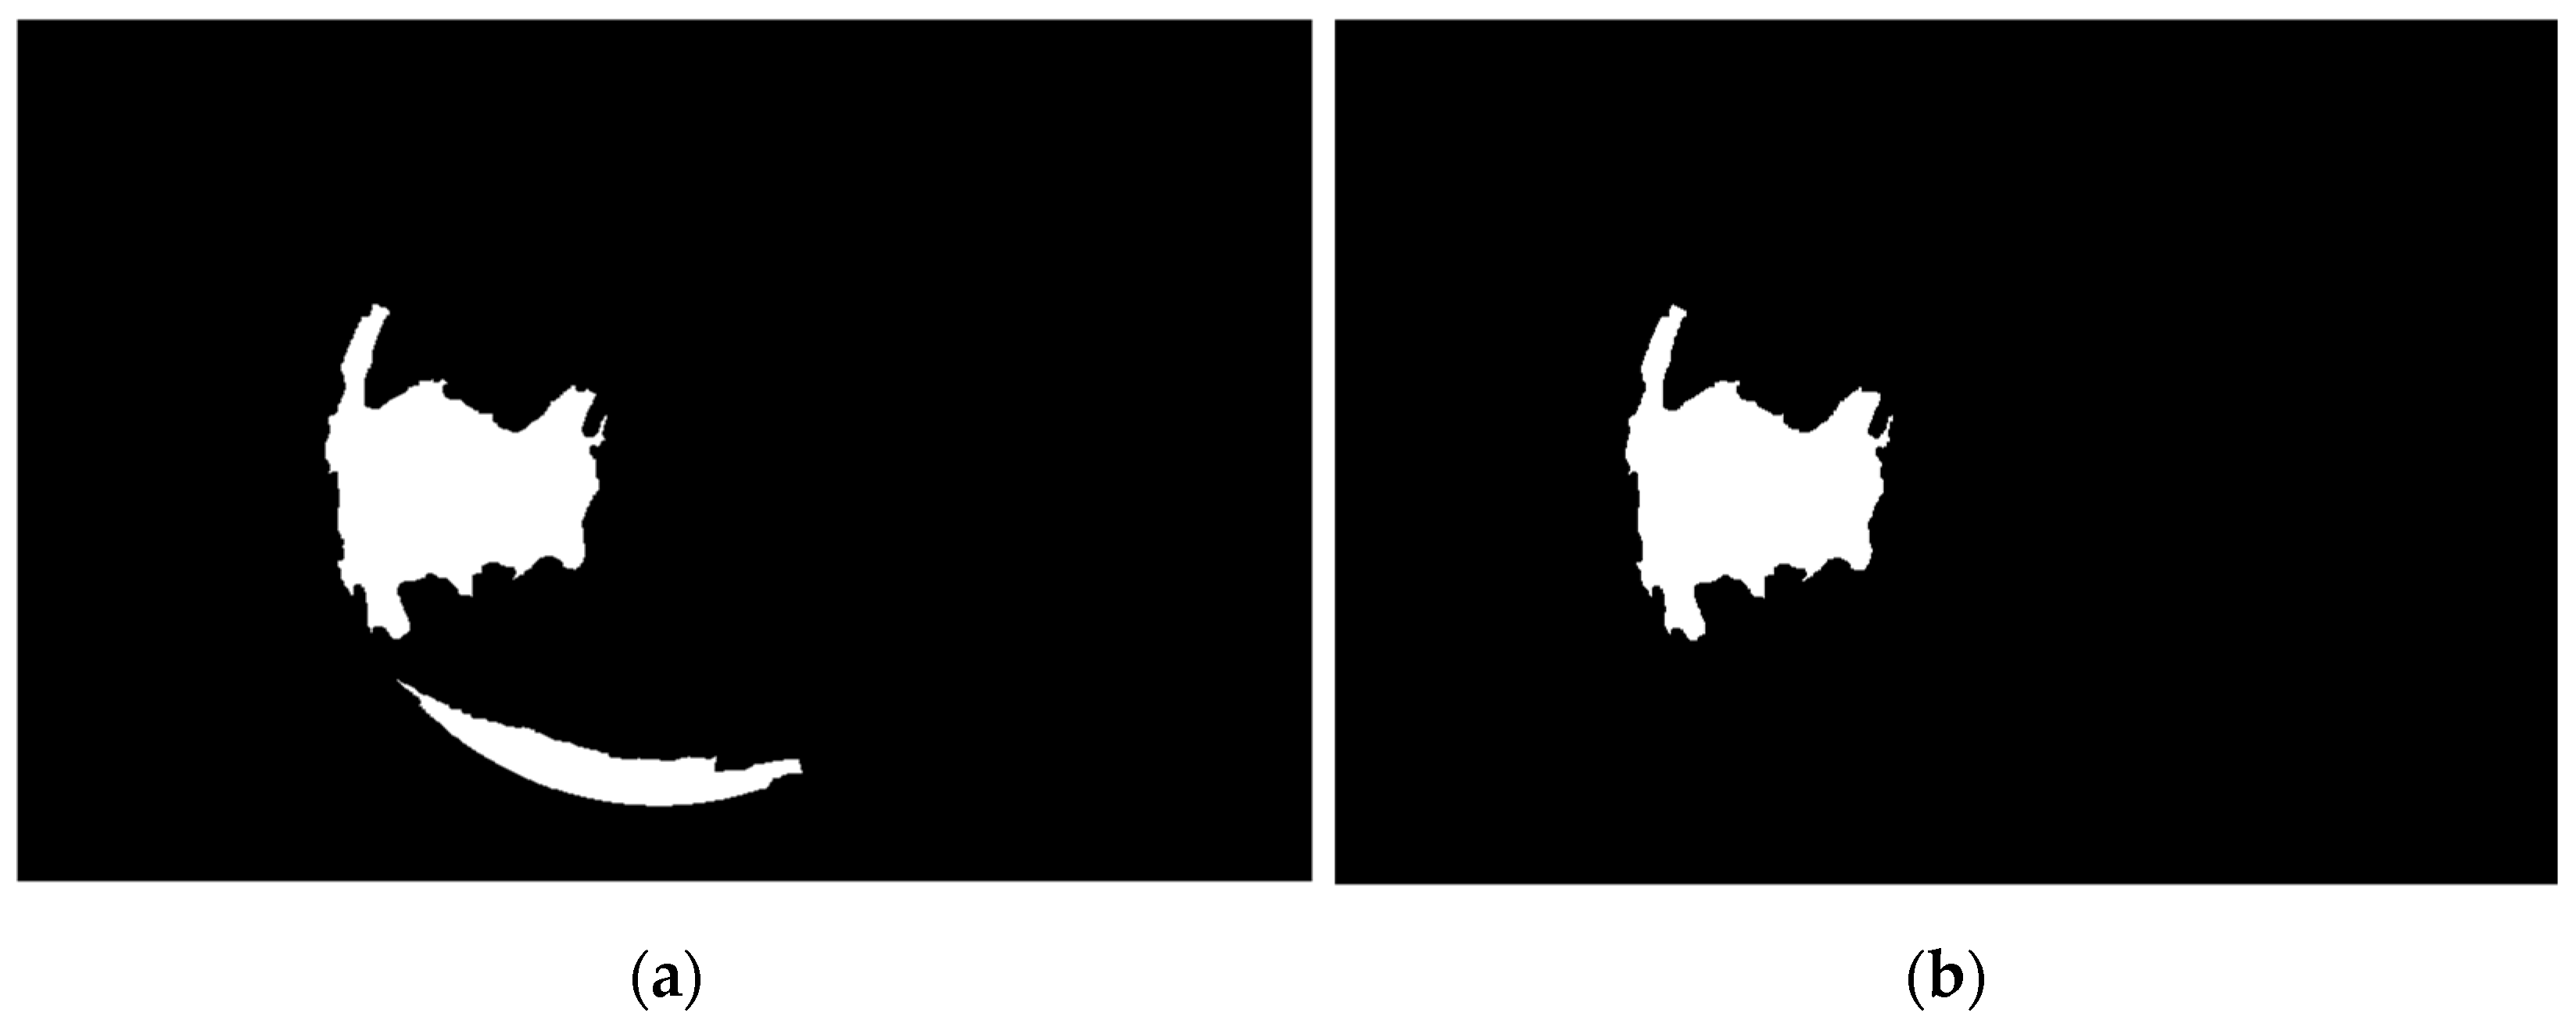
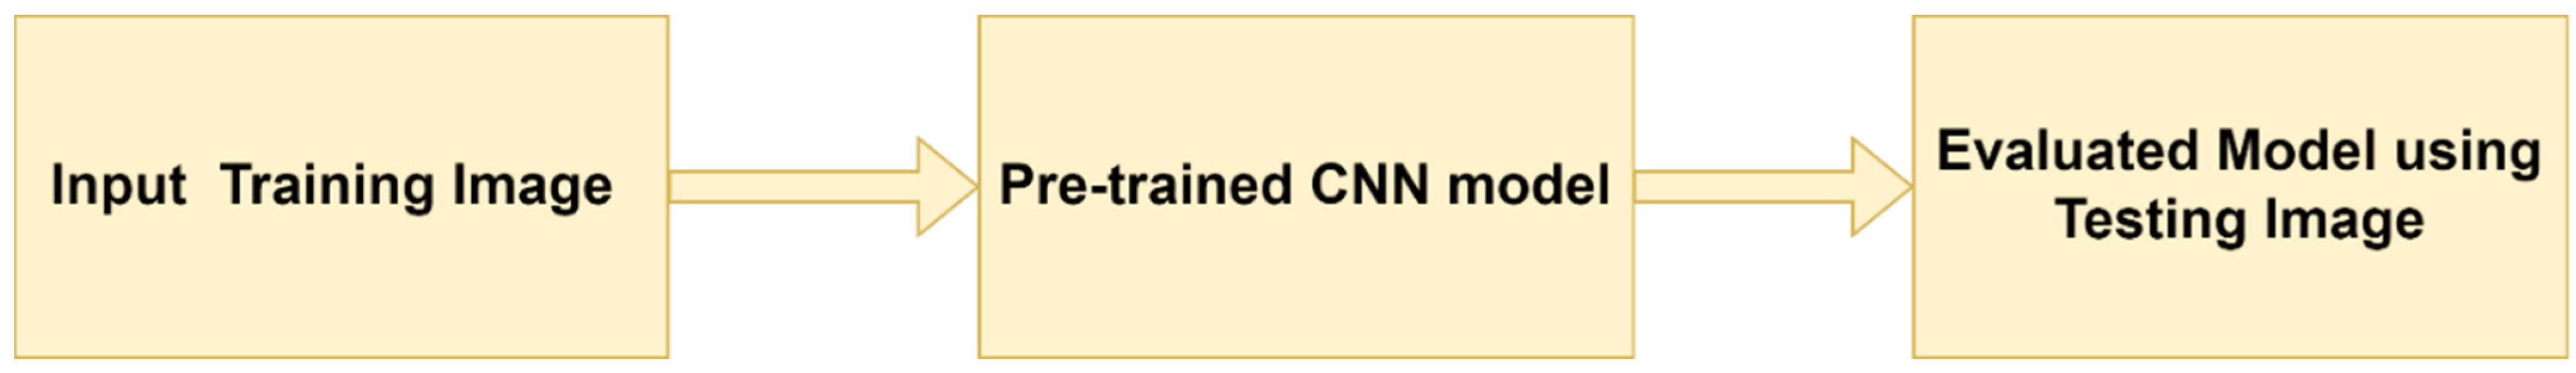
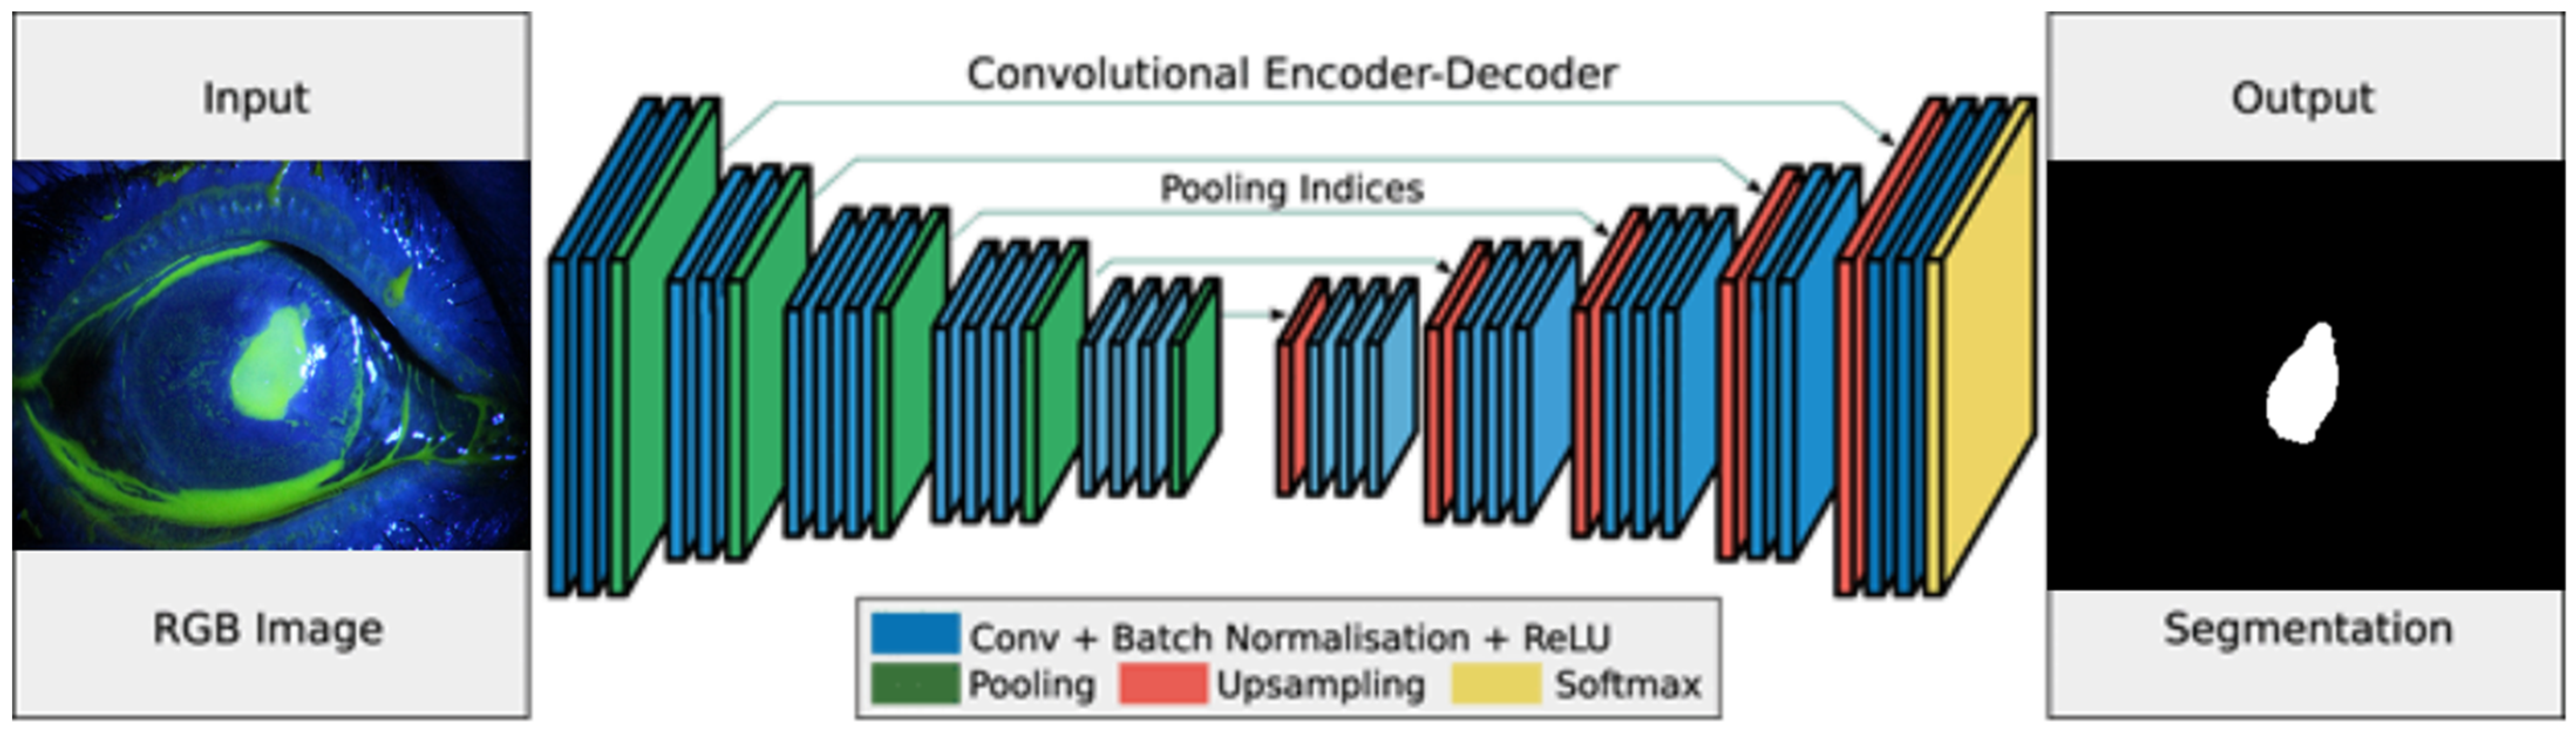
3.2. Semantic Segmentation
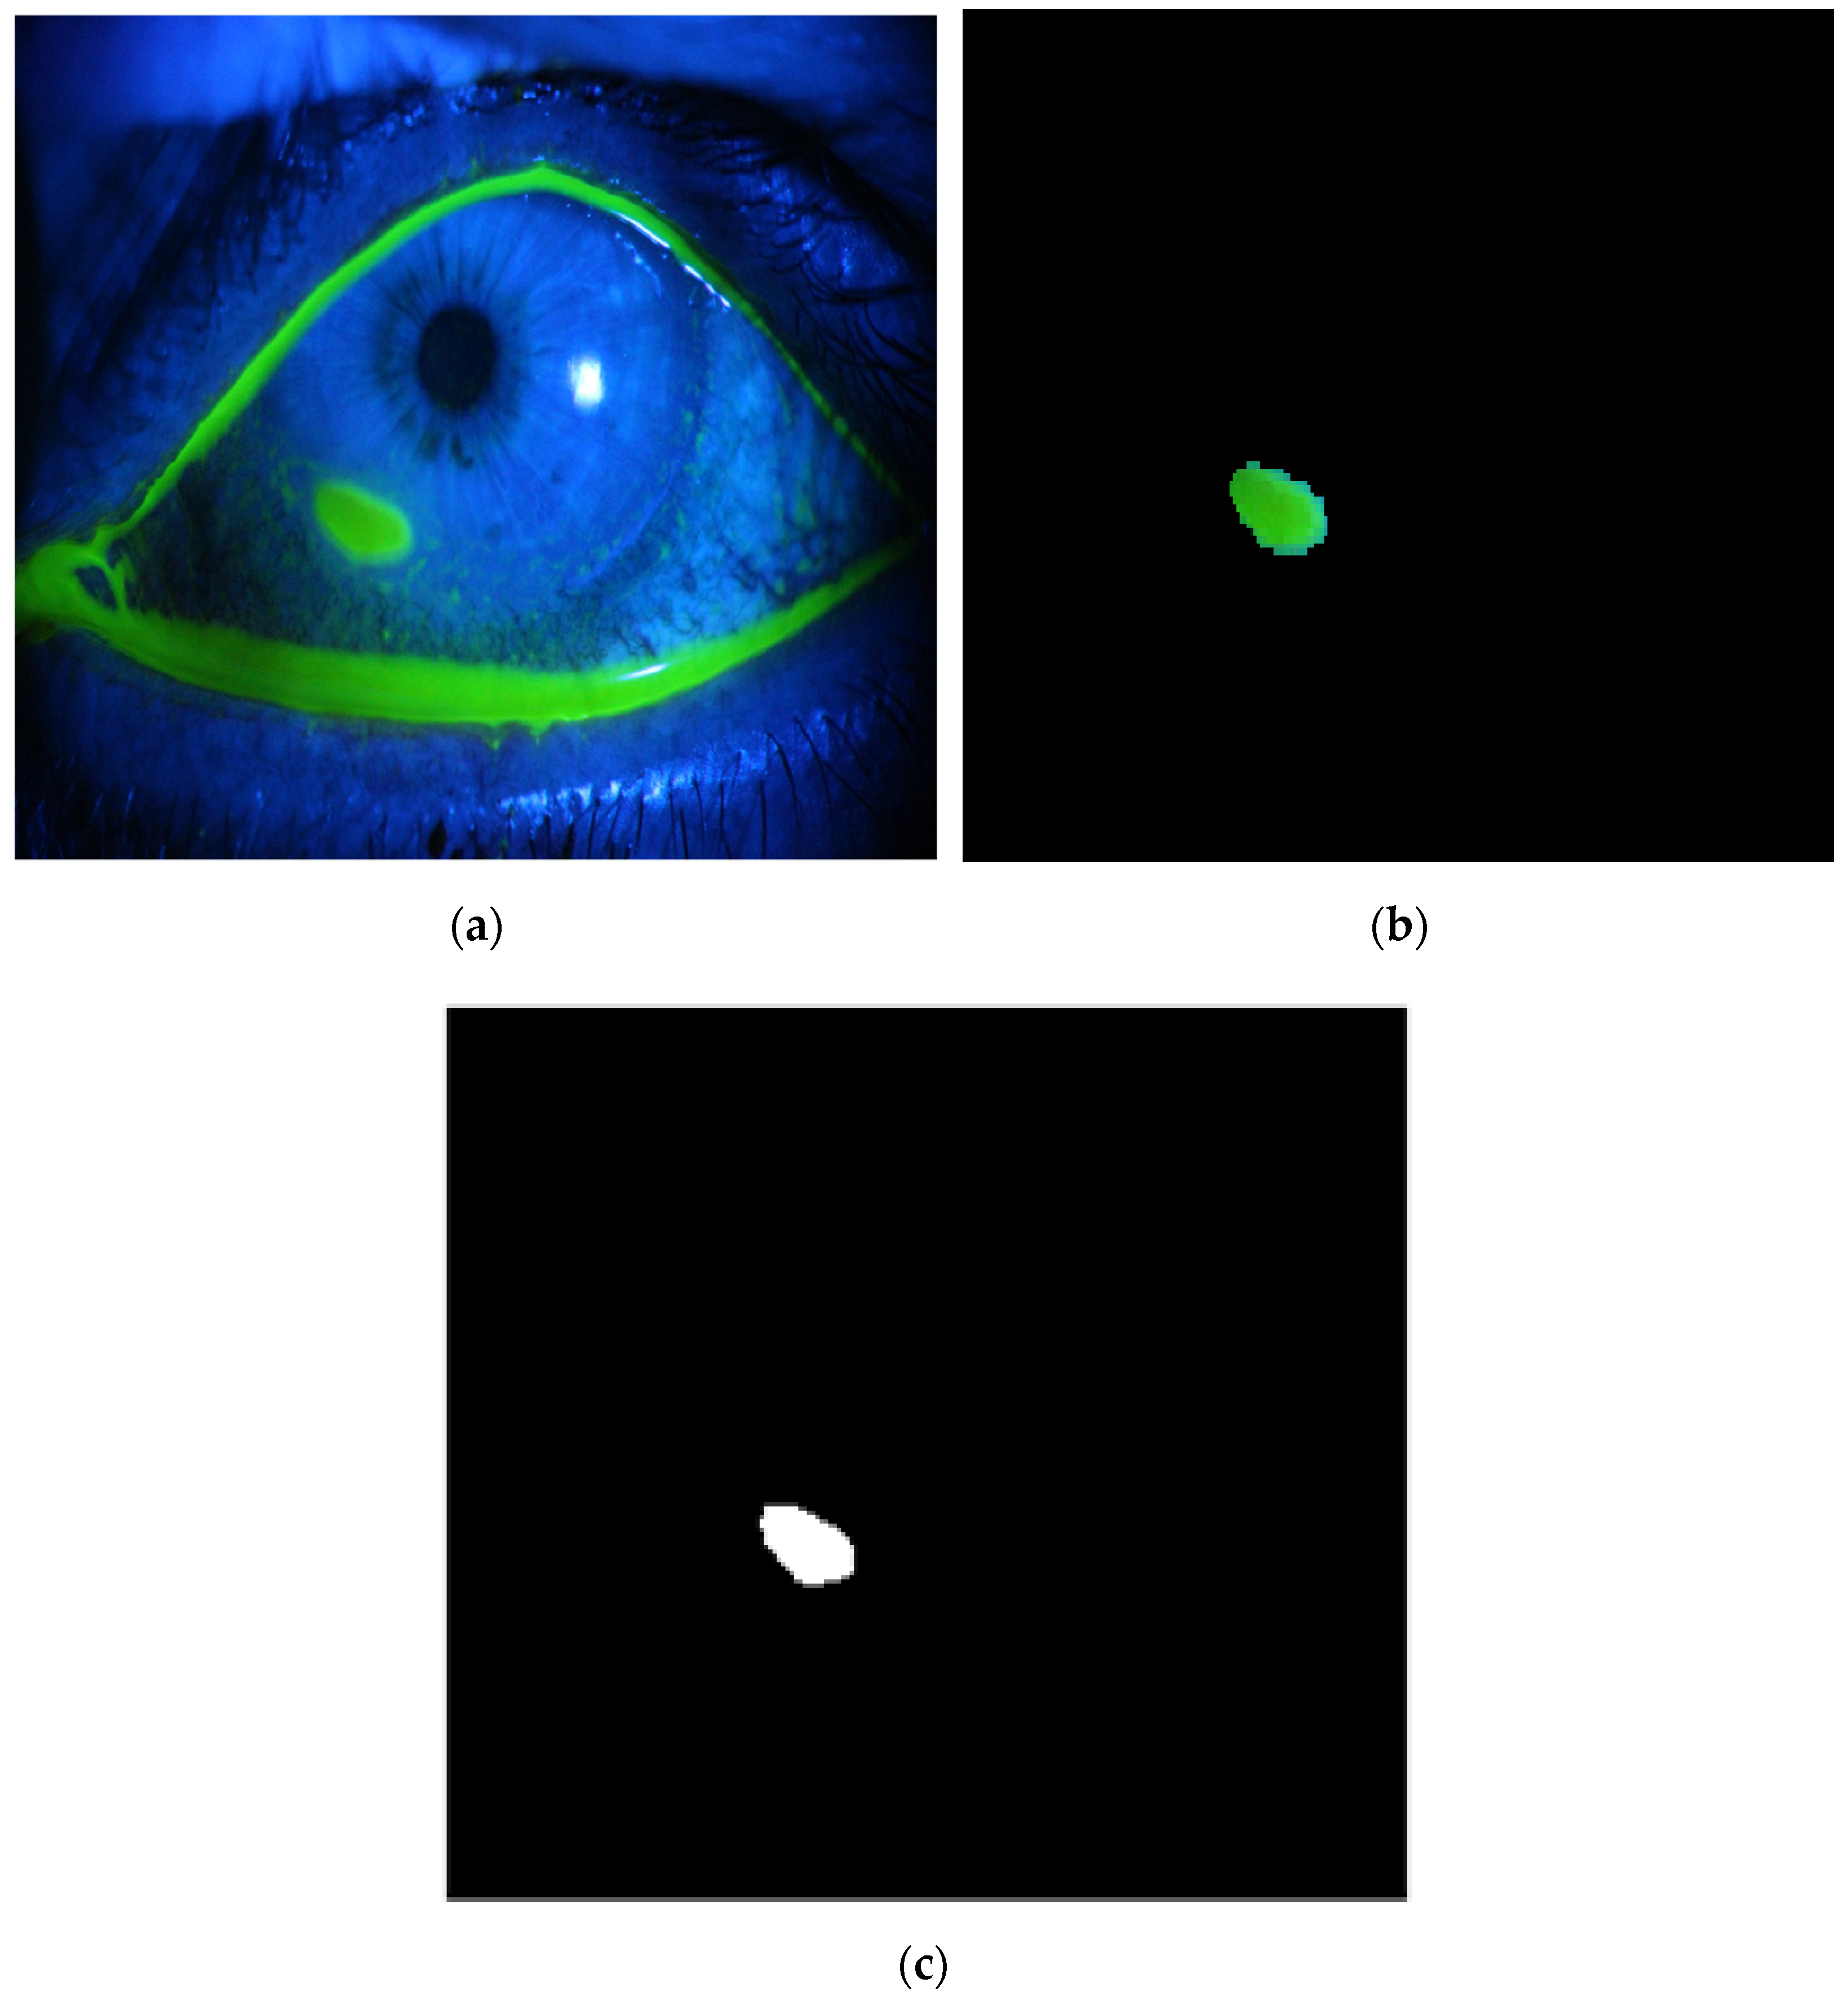
4. Results and Discussion
4.1. Image Processing and Hough Transform
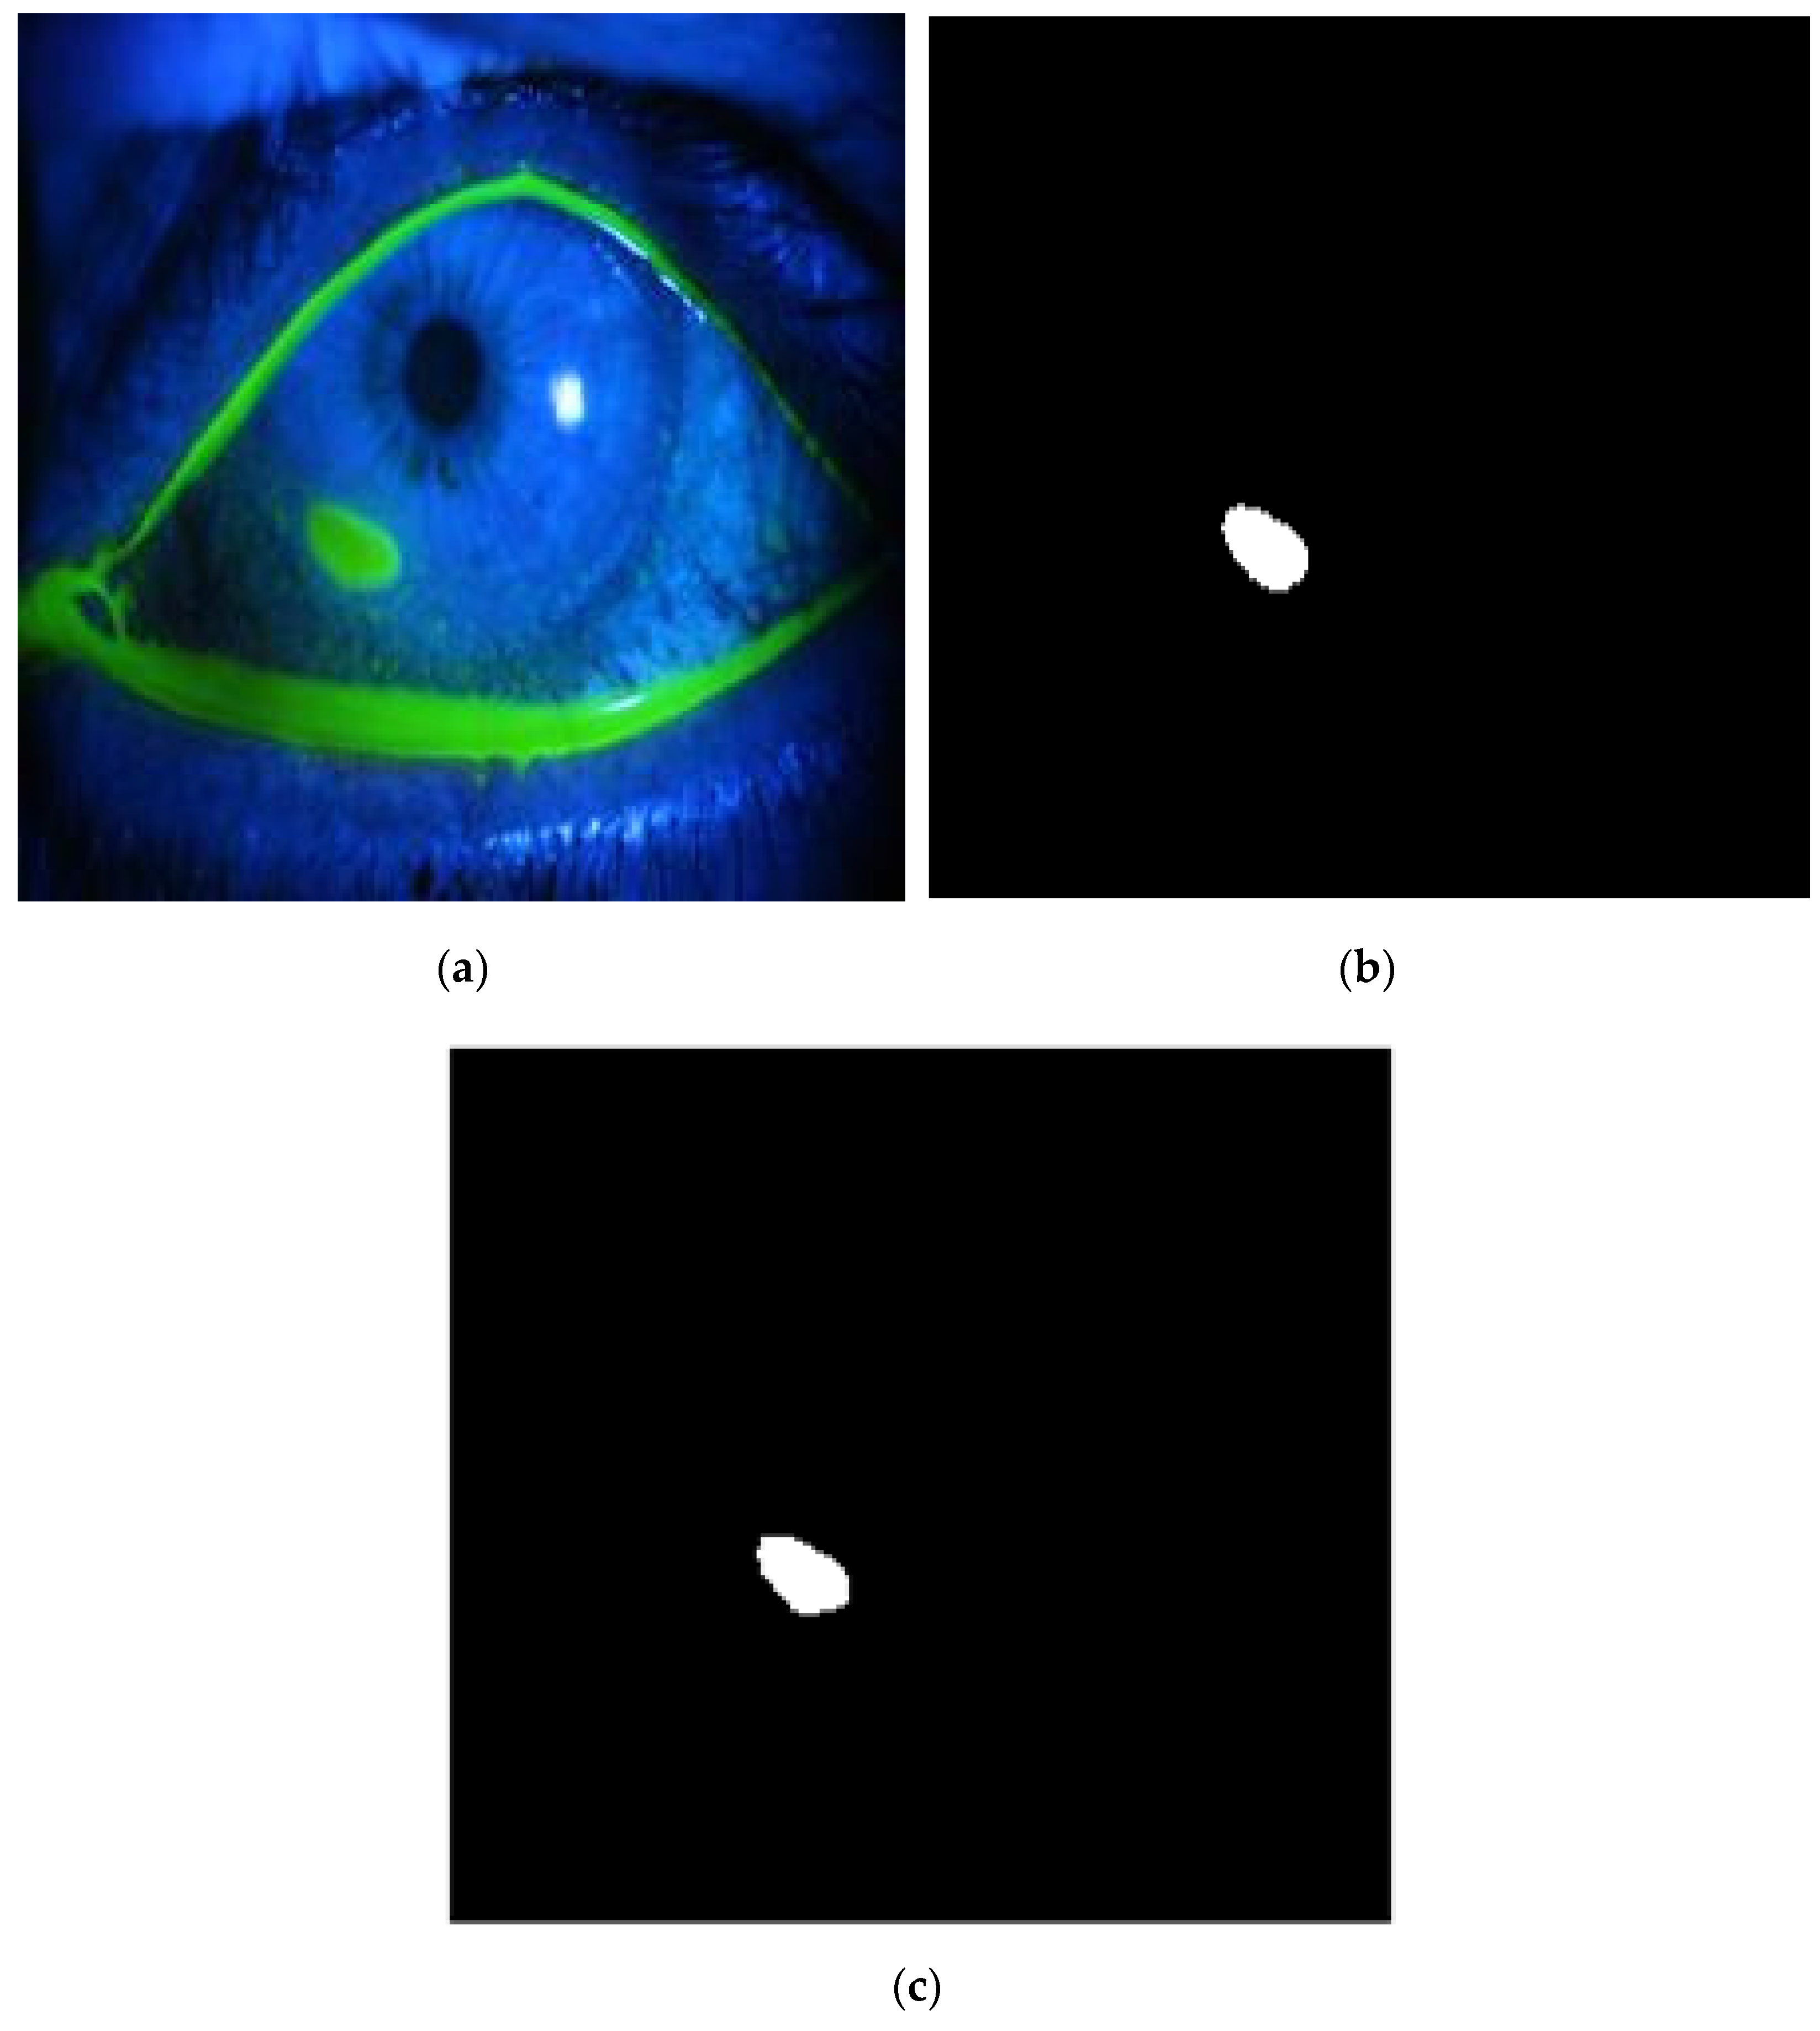
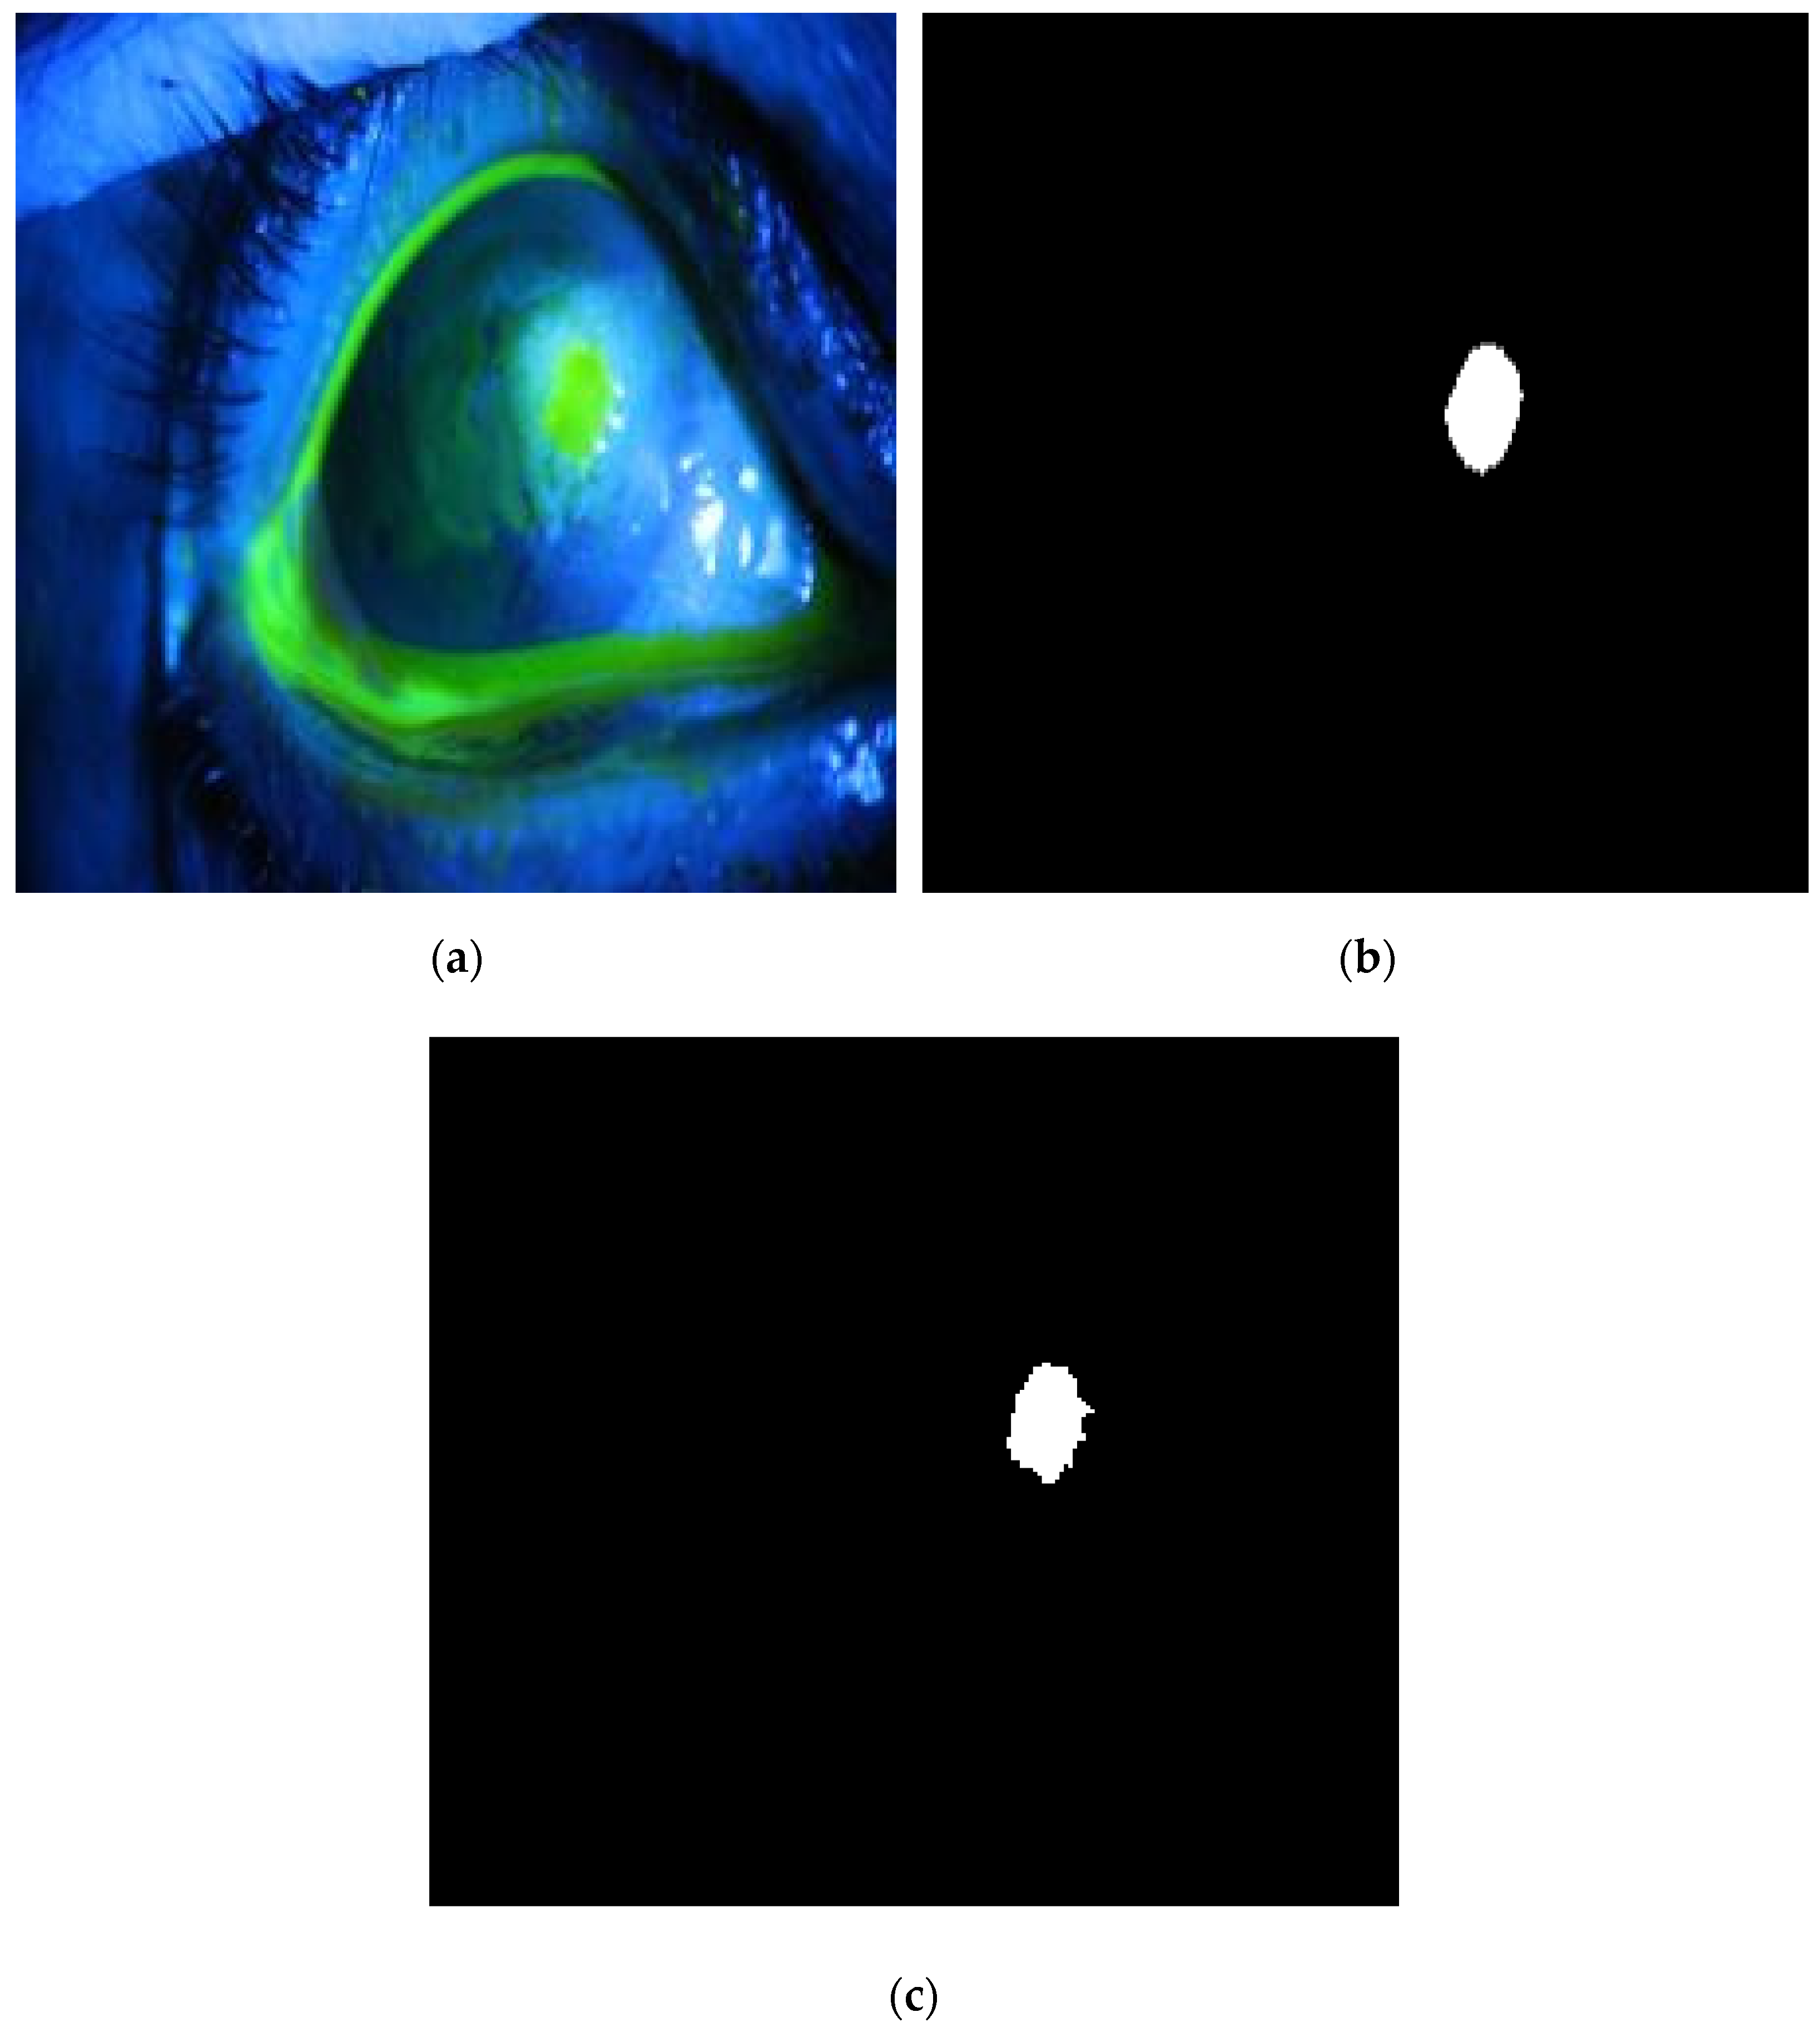
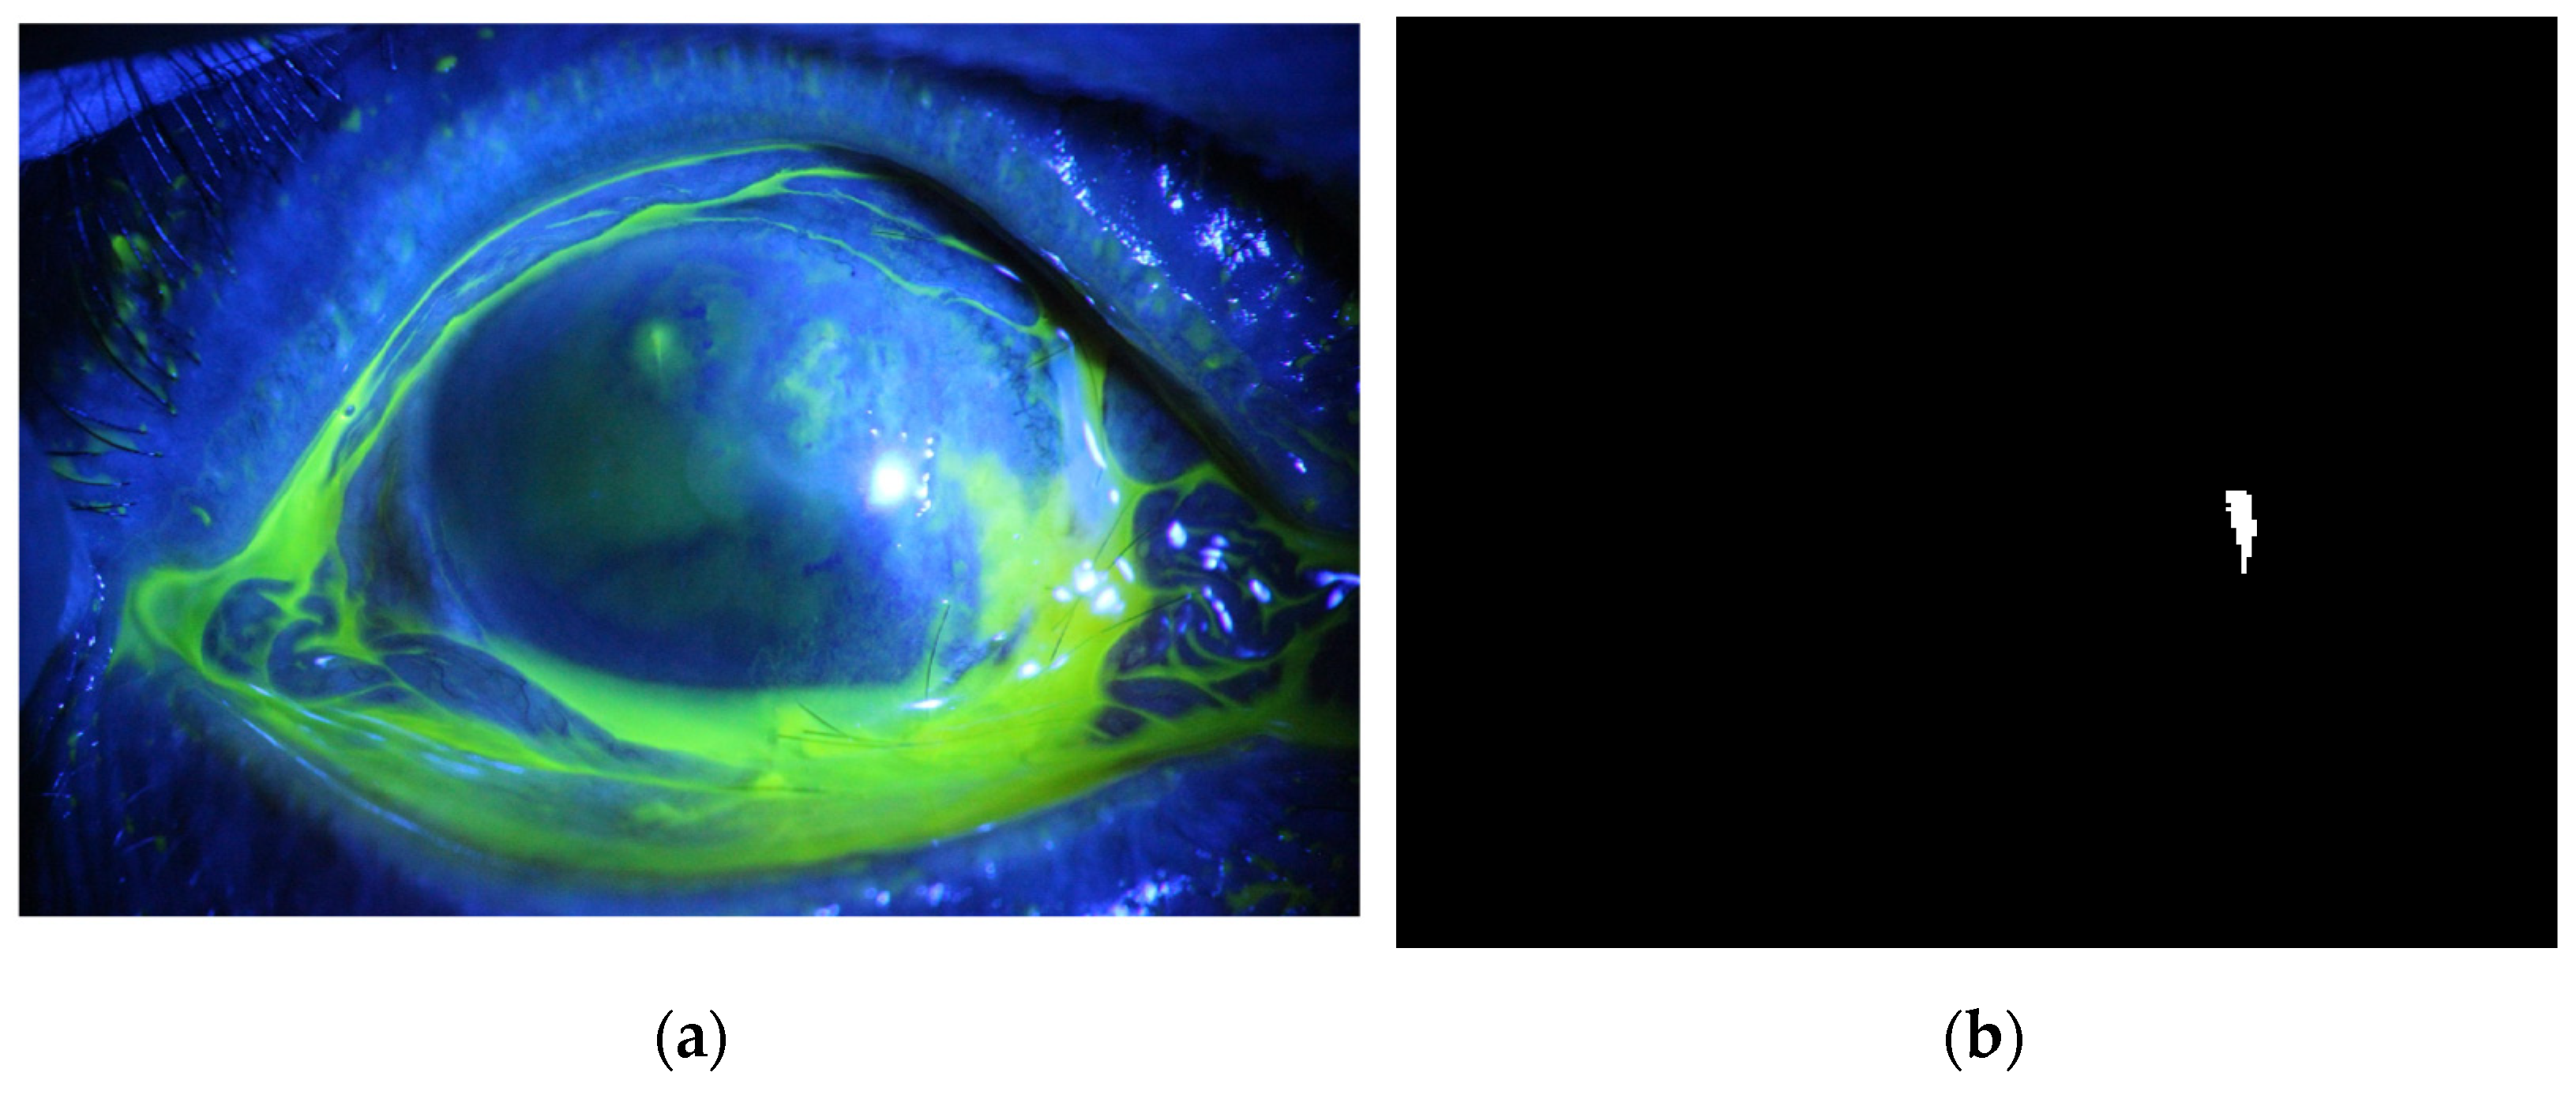
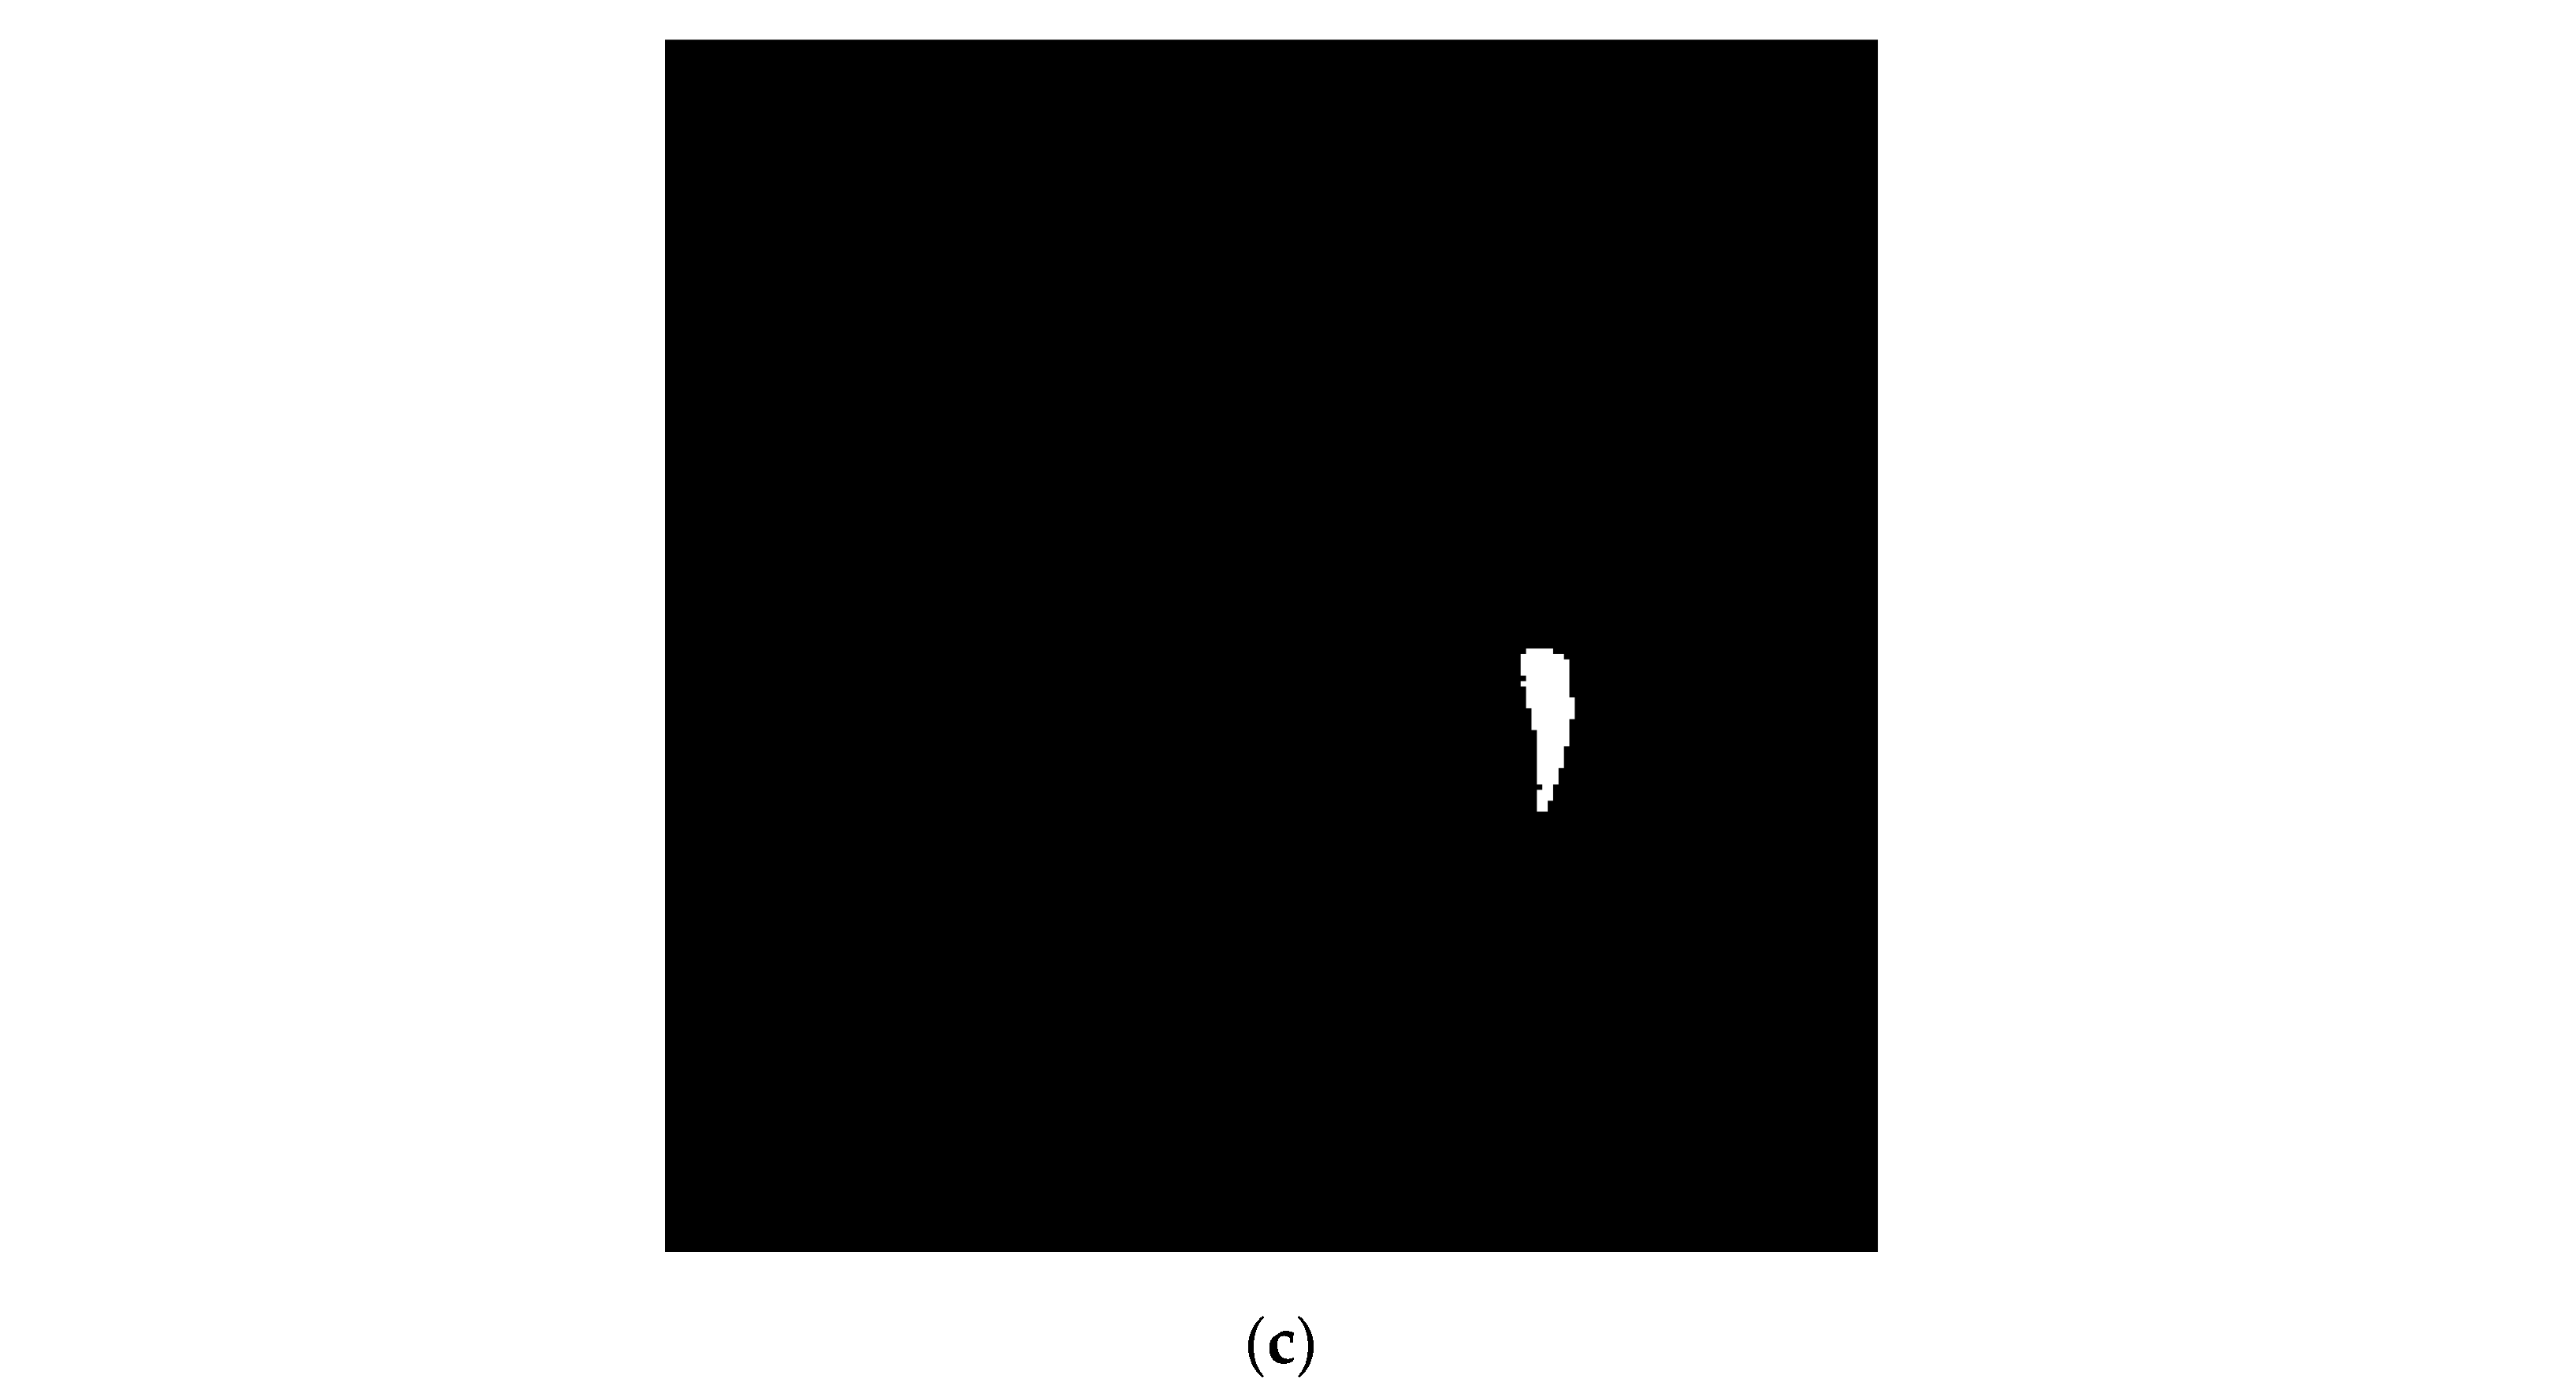
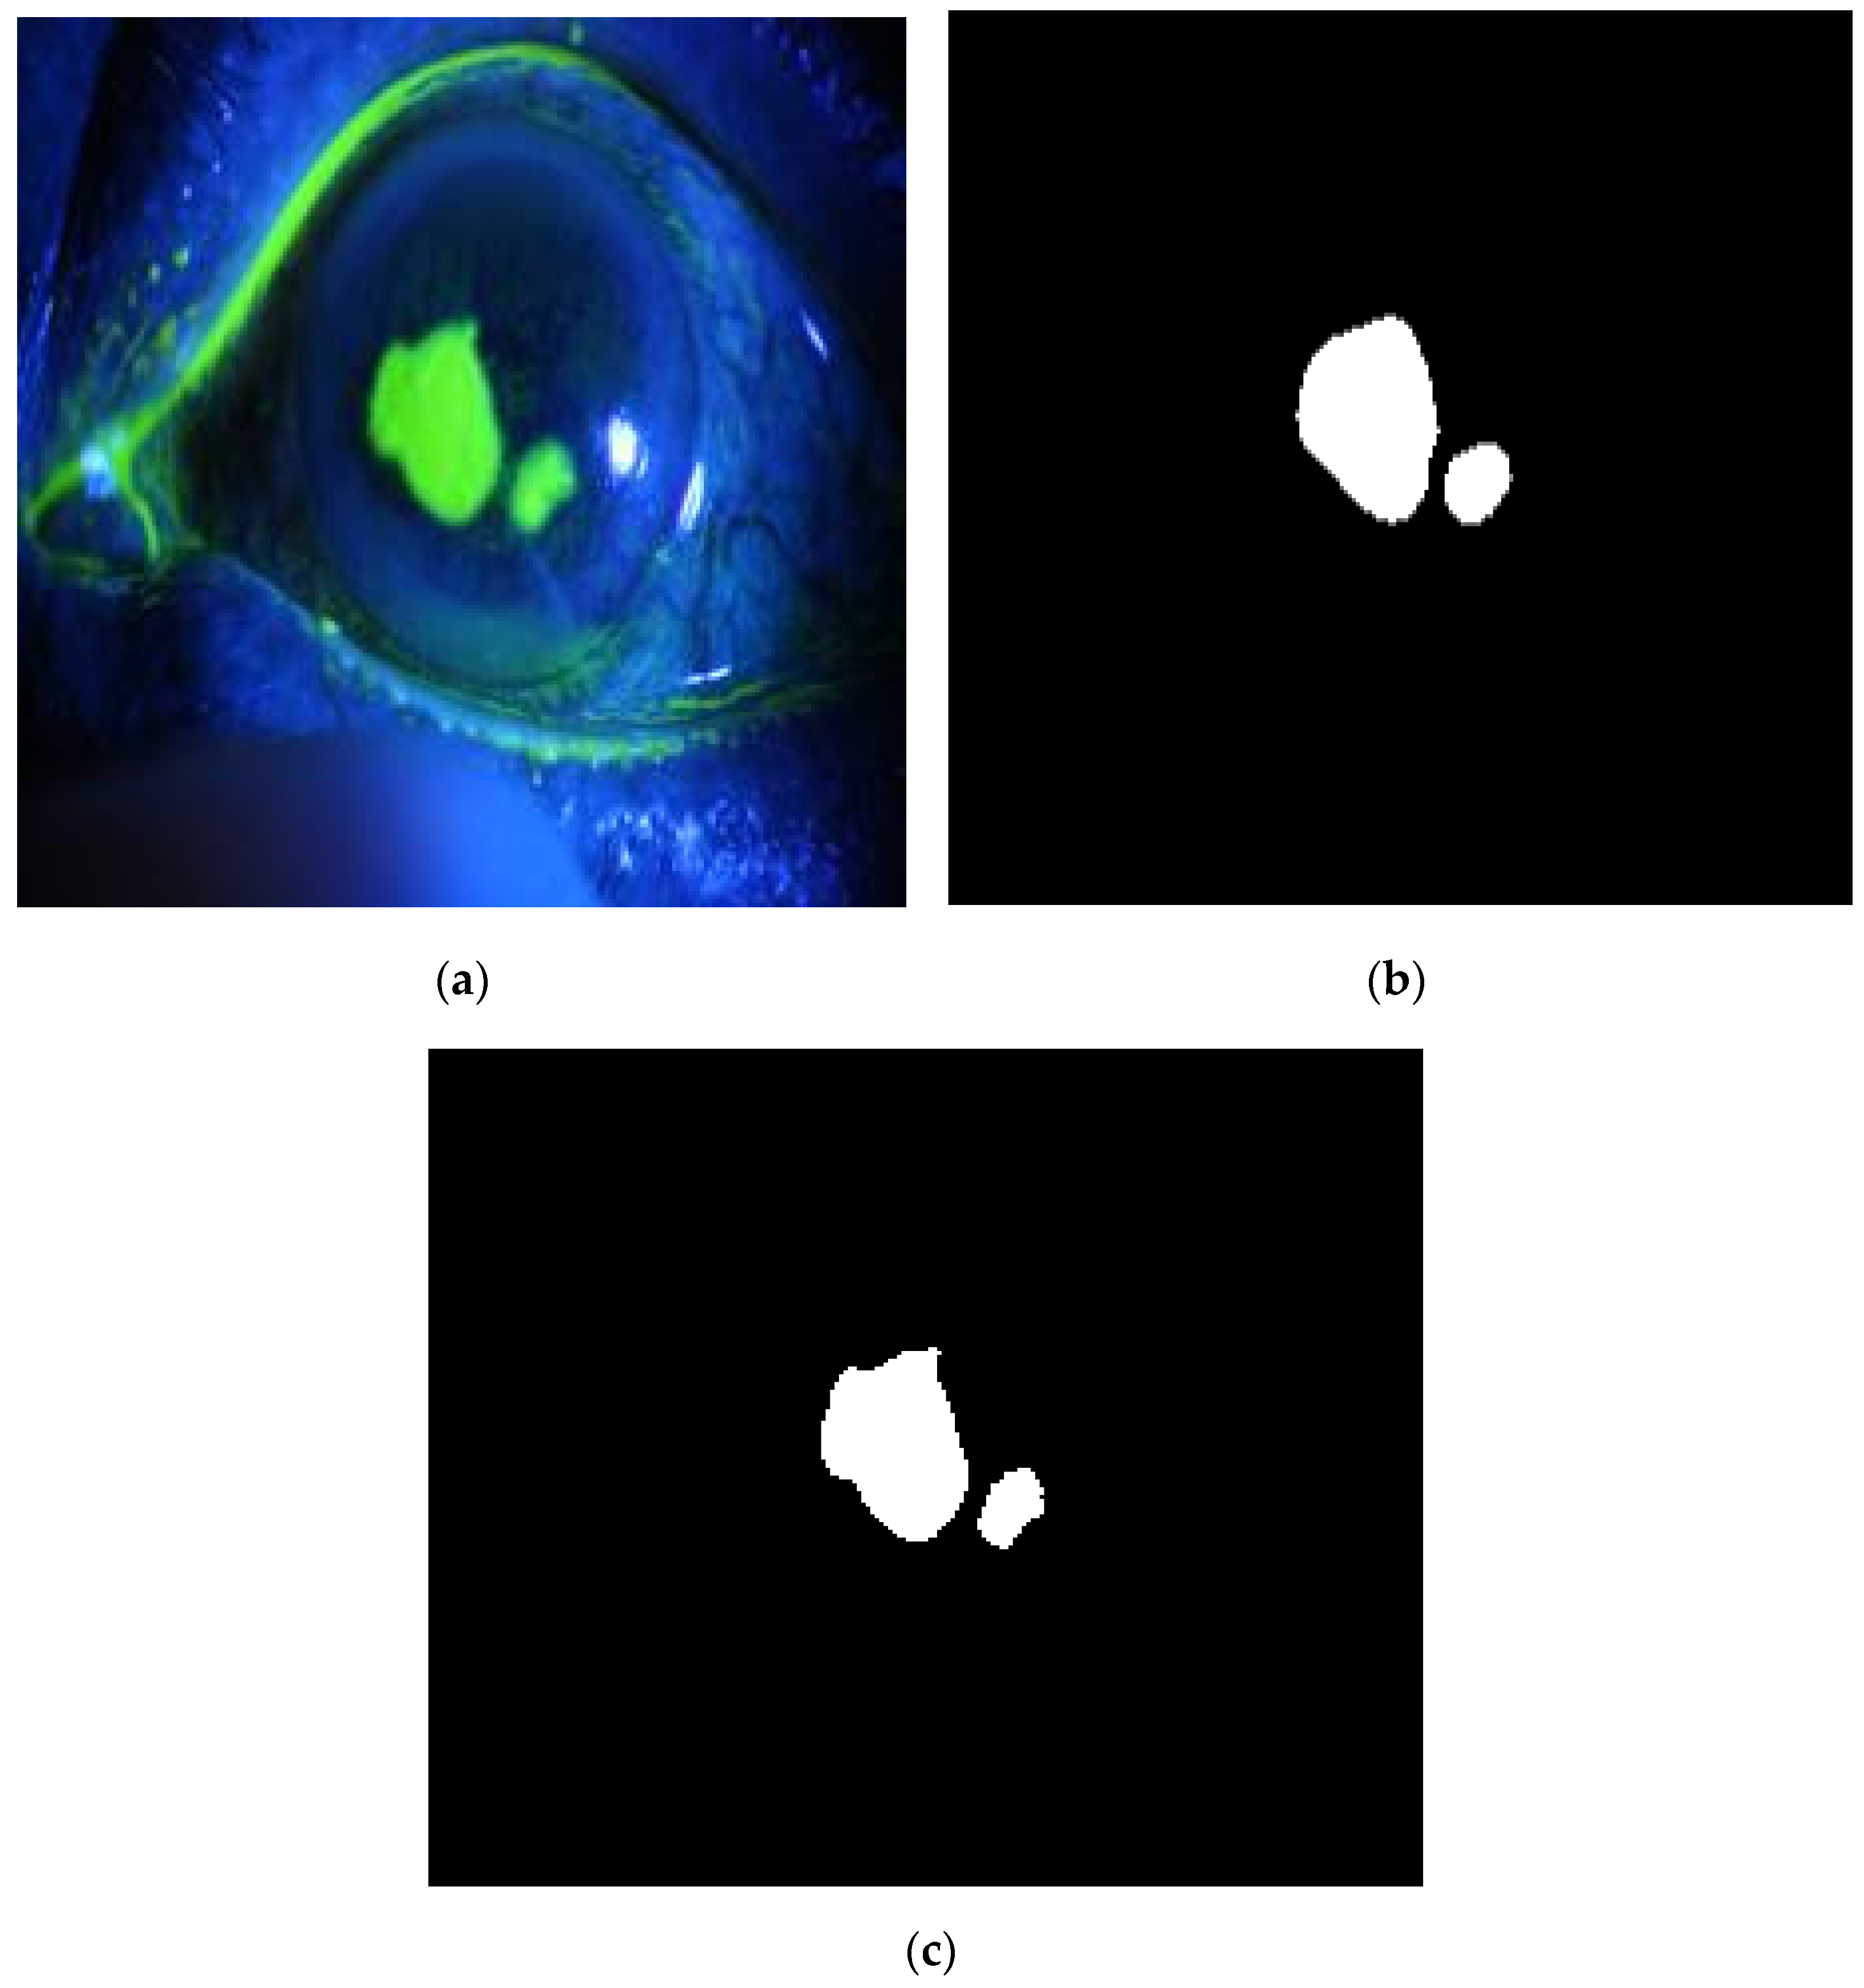
4.2. Semantic Segmentation
5. Conclusions
Author Contributions
Funding
Institutional Review Board Statement
Informed Consent Statement
Data Availability Statement
Acknowledgments
Conflicts of Interest
References
- Alhajraf, K.; Lin, S.R.; Jacobs, D.S. A corneal ring ulcer. Am. J. Ophthalmol. Case Rep. 2020, 20, 100856. [Google Scholar] [CrossRef] [PubMed]
- Mansoor, H.; Tan, H.C.; Lin, M.T.-Y.; Mehta, J.S.; Liu, Y.-C. Diabetic Corneal Neuropathy. J. Clin. Med. 2020, 9, 3956. [Google Scholar] [CrossRef] [PubMed]
- Akram, A.; Debnath, R. An Efficient Automated Corneal Ulcer Detection Method using Convolutional Neural Network. In Proceedings of the 2019 22nd International Conference on Computer and Information Technology (ICCIT), Dhaka, Bangladesh, 18–20 December 2019. [Google Scholar] [CrossRef]
- Im, J.; Kim, D. Corneal Ulcers Detection Using Random Seed Appointment Algorithm. J. Inst. Electron. Inf. Eng. 2019, 56, 53–66. [Google Scholar] [CrossRef]
- Deng, L.; Huang, H.; Yuan, J.; Tang, X. Superpixel-based automatic segmentation of corneal ulcers from ocular staining images. In Proceedings of the 2018 IEEE 23rd International Conference on Digital Signal Processing (DSP), Shanghai, China, 19–21 November 2018; pp. 1–5. [Google Scholar]
- Liu, Z.; Shi, Y.; Zhan, P.; Zhang, Y.; Gong, Y.; Tang, X. Automatic corneal ulcer segmentation combining Gaussian mixture modeling and Otsu method. In Proceedings of the 2019 41st Annual International Conference of the IEEE Engineering in Medicine and Biology Society (EMBC), Berlin, Germany, 23–27 July 2019; pp. 6298–6301. [Google Scholar]
- Loo, J.; Kriegel, M.F.; Tuohy, M.M.; Kim, K.H.; Prajna, V.; Woodward, M.A.; Farsiu, S. Open-source automatic segmentation of ocular structures and biomarkers of microbial keratitis on slit-lamp photography images using deep learning. IEEE J. Biomed. Health Inform. 2020, 25, 88–99. [Google Scholar] [CrossRef]
- Lima, P.V.; de MSVeras, R.; Vogado, L.H.; Portela, H.M.; de Almeida, J.D.; Aires, K.R.; Leite, D. A semiautomatic segmentation approach to corneal lesions. Comput. Electr. Eng. 2020, 84, 106625. [Google Scholar] [CrossRef]
- Lyu, J.; Qiu, J.; Deng, L.; Zhang, Y.; Ye, T.T.T.; Tang, X. Transfer Learning for Automatic Cornea Segmentation based on Ocular Staining Images. In Proceedings of the Fourth International Symposium on Image Computing and Digital Medicine, Shenyang China, 5–7 December 2020; pp. 108–111. [Google Scholar]
- Mayya, V.; Kamath Shevgoor, S.; Kulkarni, U.; Hazarika, M.; Barua, P.D.; Acharya, U.R. Multi-scale convolutional neural network for accurate corneal segmentation in early detection of fungal keratitis. J. Fungi 2021, 7, 850. [Google Scholar] [CrossRef]
- Wang, T.; Zhu, W.; Wang, M.; Chen, Z.; Chen, X. Cu-Segnet: Corneal Ulcer Segmentation Network. In Proceedings of the 2021 IEEE 18th International Symposium on Biomedical Imaging (ISBI), Nice, France, 13–16 April 2021; IEEE: Piscataway, NJ, USA, 2021; pp. 1518–1521. [Google Scholar]
- Wang, T.; Wang, M.; Zhu, W.; Wang, L.; Chen, Z.; Peng, Y.; Chen, X. Semi-MsST-GAN: A Semi-Supervised Segmentation Method for Corneal Ulcer Segmentation in Slit-Lamp Images. Front. Neurosci. 2021, 15, 1705. [Google Scholar] [CrossRef]
- Deng, L.; Lyu, J.; Huang, H.; Deng, Y.; Yuan, J.; Tang, X. The SUSTech-SYSU dataset for automatically segmenting and classifying corneal ulcers. Sci. Data 2020, 7, 23. [Google Scholar] [CrossRef] [Green Version]
- Wang, Z.; Lyu, J.; Luo, W.; Tang, X. Adjacent Scale Fusion and Corneal Position Embedding for Corneal Ulcer Segmentation. Ophthalmic Medical Image Analysis. OMIA 2021. In Lecture Notes in Computer Science; Fu, H., Garvin, M.K., MacGillivray, T., Xu, Y., Zheng, Y., Eds.; Springer: Cham, Switzerland, 2021; Volume 12970. [Google Scholar]
- Alquran, H.; Al-Issa, Y.; Alsalatie, M.; Mustafa, W.A.; Qasmieh, I.A.; Zyout, A. Intelligent Diagnosis and Classification of Keratitis. Diagnostics 2022, 12, 1344. [Google Scholar] [CrossRef]
- Gielis, J. A generic geometric transformation that unifies a wide range of natural and abstract shapes. Am. J. Bot. 2003, 90, 333–338. [Google Scholar] [CrossRef]
- Alquran, H.; Mustafa, W.A.; Qasmieh, I.A.; Yacob, Y.M.; Alsalatie, M.; Al-Issa, Y.; Alqudah, A.M. Cervical Cancer Classification Using Combined Machine Learning and Deep Learning Approach. CMC-Comput. Mater. Contin. 2022, 72, 5117–5134. [Google Scholar] [CrossRef]
- He, K.; Zhang, X.; Ren, S.; Sun, J. Deep residual learning for image recognition. In Proceedings of the IEEE conference on computer vision and pattern recognition, Las Vegas, NV, USA, 27–30 June 2016; pp. 770–778. [Google Scholar]
- Zhou, Q.; Zhu, W.; Li, F.; Yuan, M.; Zheng, L.; Liu, X. Transfer Learning of the ResNet-18 and DenseNet-121 Model Used to Diagnose Intracranial Hemorrhage in CT Scanning. Curr. Pharm. Des. 2022, 28, 287–295. [Google Scholar] [CrossRef] [PubMed]
- Chen, L.C.; Zhu, Y.; Papandreou, G.; Schroff, F.; Adam, H. Encoder-decoder with atrous separable convolution for semantic image segmentation. In Proceedings of the European Conference on Computer Vision (ECCV), Munich, Germany, 8–14 September 2018; pp. 801–818. [Google Scholar]
- Brostow, G.J.; Fauqueur, J.; Cipolla, R. Semantic object classes in video: A high-definition ground truth database. Pattern Recognit. Lett. 2009, 30, 88–97. [Google Scholar] [CrossRef]
- Shah, M. Semantic Segmentation Using Fully Convolutional Networks Over the Years. Meet Shah Blog Website. 2017. Available online: https://meetshah1995.github.io/semantic-segmentation/deep-learning/pytorch/visdom/2017/06/01/semantic-segmentation-over-the-years.html (accessed on 15 September 2022).
- Madani, A.; Namazi, B.; Altieri, M.S.; Hashimoto, D.A.; Rivera, A.M.; Pucher, P.H.; Alseidi, A. Artificial intelligence for intraoperative guidance: Using semantic segmentation to identify surgical anatomy during laparoscopic cholecystectomy. Ann. Surg. 2022, 276, 363–369. [Google Scholar] [CrossRef] [PubMed]
- Irfan, R.; Almazroi, A.A.; Rauf, H.T.; Damaševičius, R.; Nasr, E.A.; Abdelgawad, A.E. Dilated semantic segmentation for breast ultrasonic lesion detection using parallel feature fusion. Diagnostics 2021, 11, 1212. [Google Scholar] [CrossRef]
- Khalifa, N.E.M.; Manogaran, G.; Taha, M.H.N.; Loey, M. A deep learning semantic segmentation architecture for COVID-19 lesions discovery in limited chest CT datasets. Expert Syst. 2022, 39, e12742. [Google Scholar] [CrossRef]
- Tiwari, T.; Saraswat, M. A new modified-unet deep learning model for semantic segmentation. Multimed. Tools Appl. 2022, 1–21. [Google Scholar] [CrossRef]
- Ruiz-Santaquiteria, J.; Bueno, G.; Deniz, O.; Vallez, N.; Cristobal, G. Semantic versus instance segmentation in microscopic algae detection. Eng. Appl. Artificial Intell. 2020, 87, 103271. [Google Scholar] [CrossRef]
- Sambyal, N.; Saini, P.; Syal, R.; Gupta, V. Modified U-Net architecture for semantic segmentation of diabetic retinopathy images. Biocybern. Biomed. Eng. 2020, 40, 1094–1109. [Google Scholar] [CrossRef]
- Kar, J.; Cohen, M.V.; McQuiston, S.P.; Malozzi, C.M. A deep-learning semantic segmentation approach to fully automated MRI-based left-ventricular deformation analysis in cardiotoxicity. Magn. Reson. Imaging 2021, 78, 127–139. [Google Scholar] [CrossRef]
- Nurmaini, S.; Tama, B.A.; Rachmatullah, M.N.; Darmawahyuni, A.; Sapitri, A.I.; Firdaus, F.; Tutuko, B. An improved semantic segmentation with region proposal network for cardiac defect interpretation. Neural Comput. Appl. 2022, 3, 13937–13950. [Google Scholar] [CrossRef]
- Harkat, H.; Nascimento, J.; Bernardino, A. Fire segmentation using a DeepLabv3+ architecture. In Image and Signal Processing for Remote Sensing XXVI; SPIE: Bellingham, WA, USA, 2020; Volume 11533, pp. 134–145. [Google Scholar]


| Global Accuracy | Specificity | Sensitivity | |
|---|---|---|---|
| Training Phase | 99.75% | 99.84% | 96.77% |
| Test Phase | 98.8% | 99.3% | 83.5% |
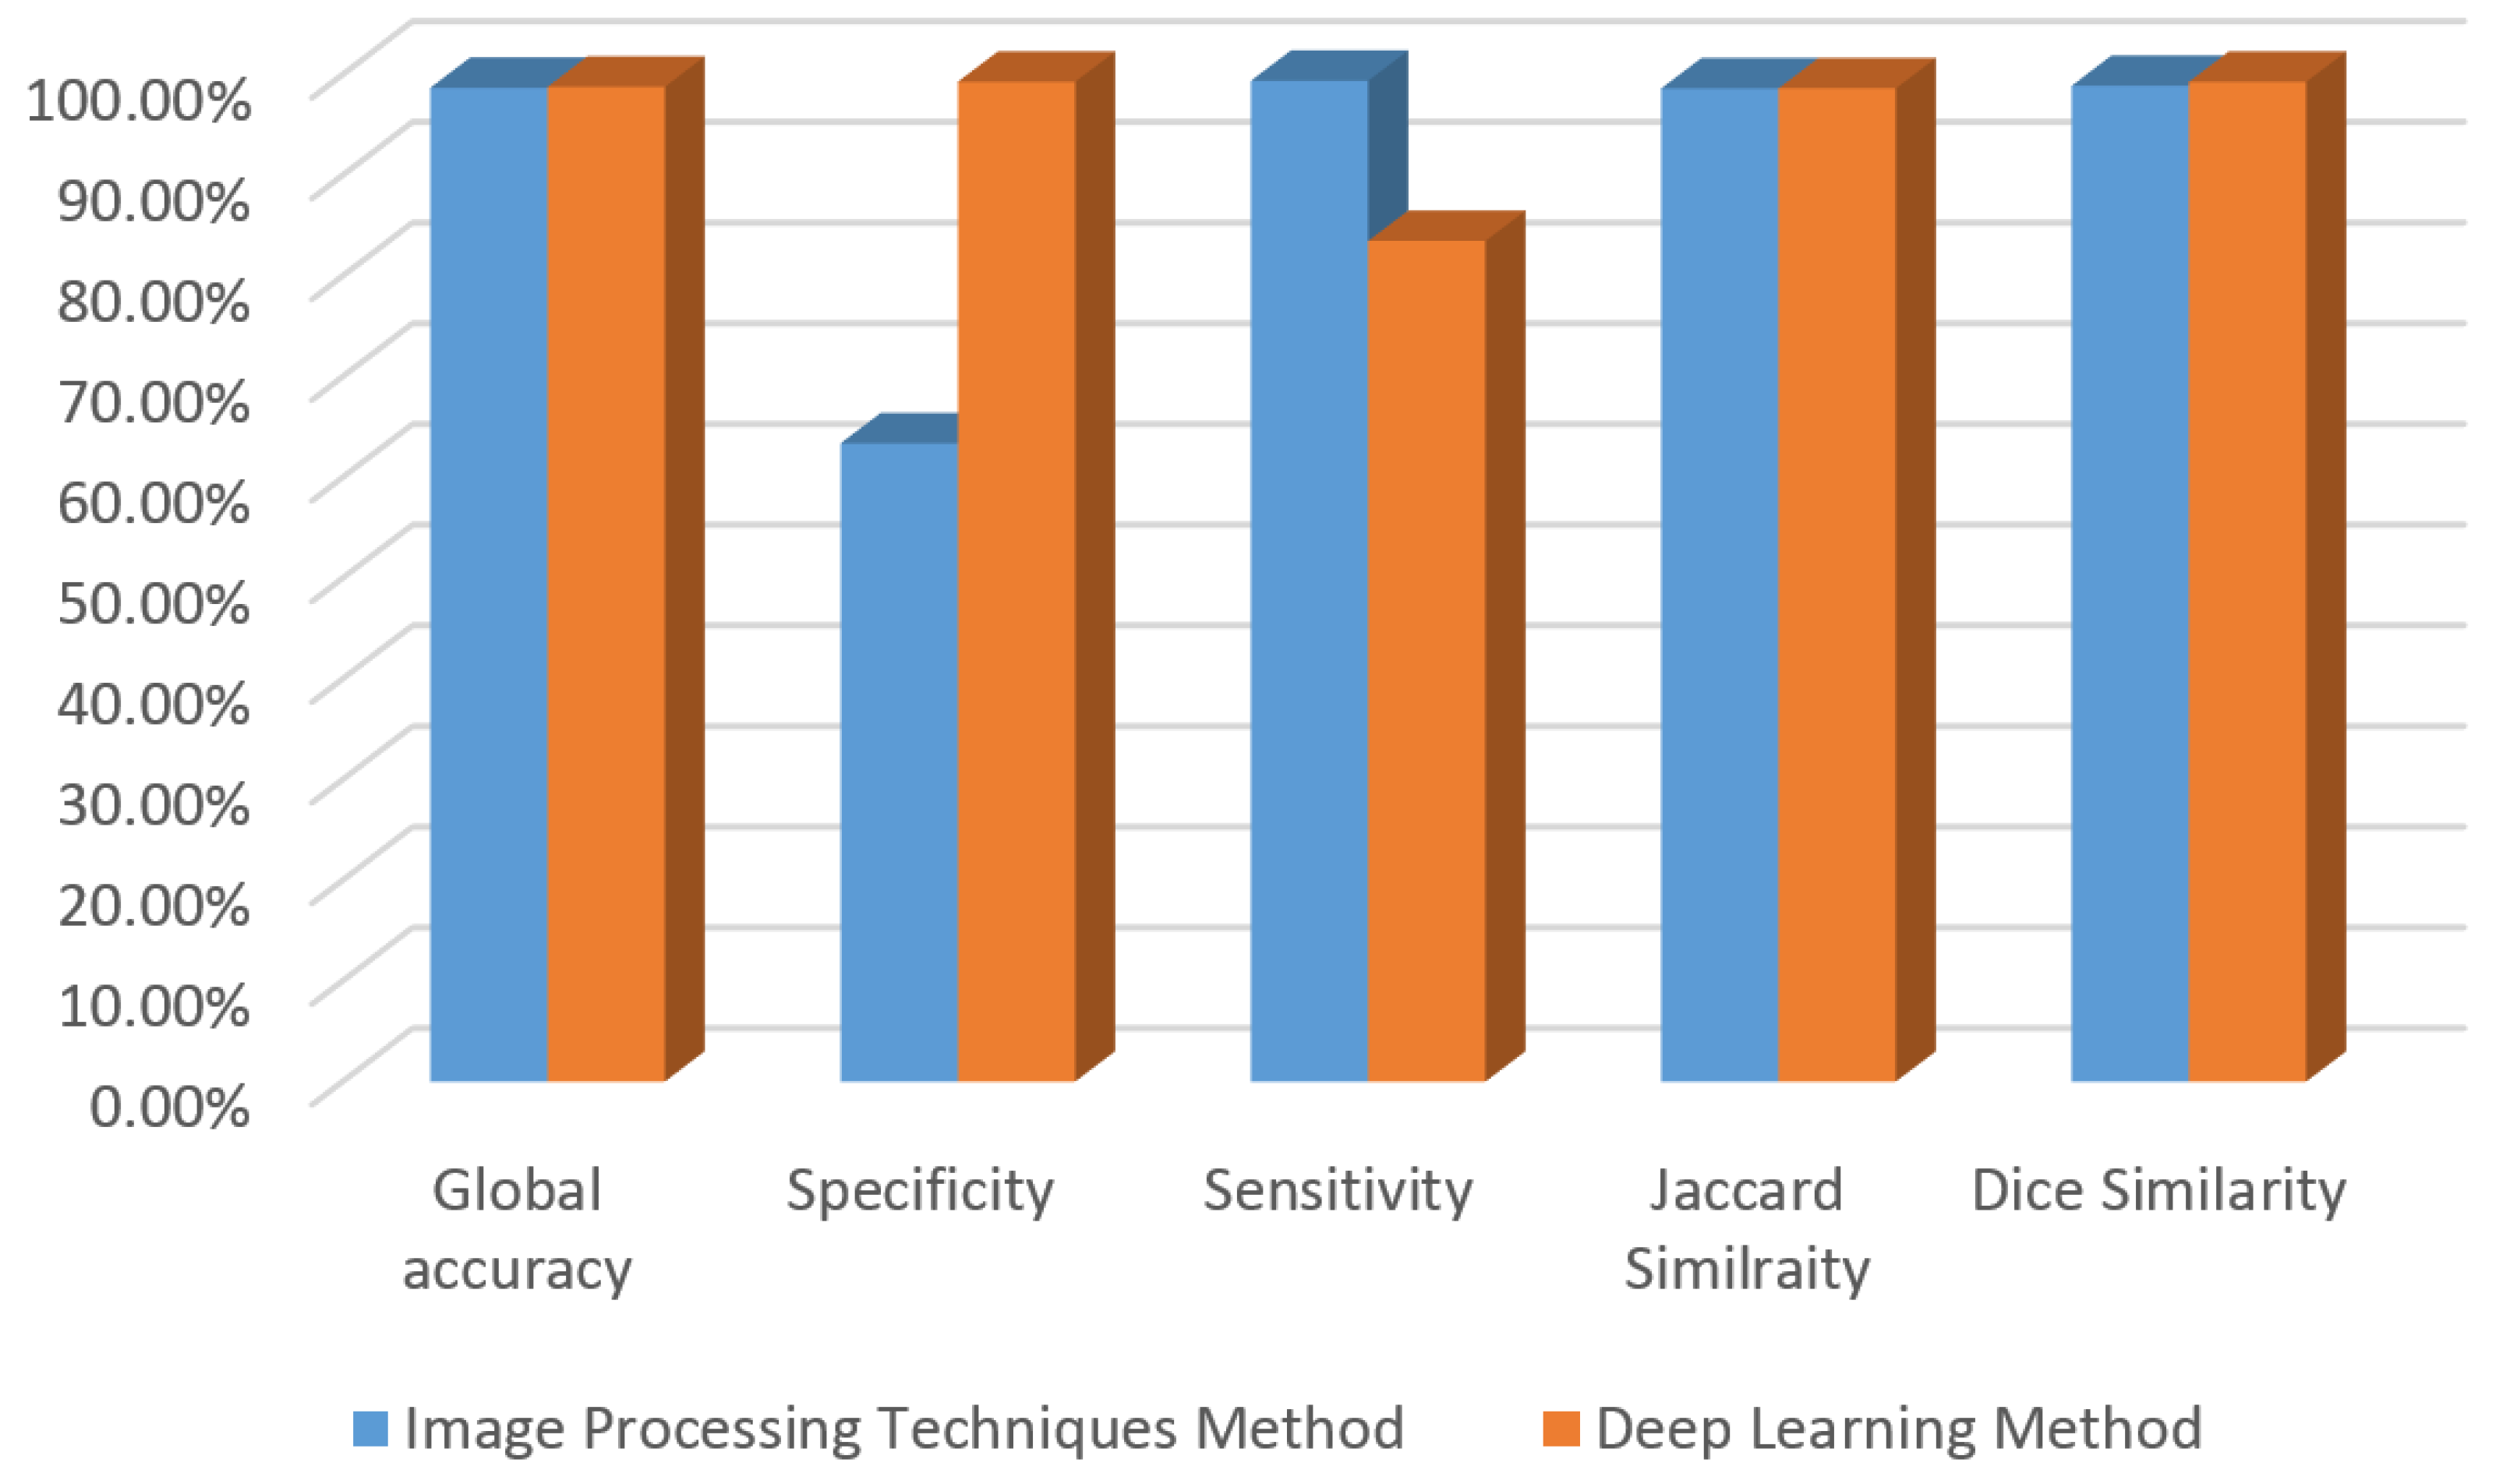
| Method | Global Accuracy | Specificity | Sensitivity | Jaccard Similarity | Dice Similarity |
|---|---|---|---|---|---|
| Image Processing Techniques Method | 98.7% | 63.4% | 99.4% | 98.64% | 98.9% |
| Deep Learning Method | 98.8% | 99.3% | 83.5% | 98.655% | 99.3% |
Publisher’s Note: MDPI stays neutral with regard to jurisdictional claims in published maps and institutional affiliations. |
© 2022 by the authors. Licensee MDPI, Basel, Switzerland. This article is an open access article distributed under the terms and conditions of the Creative Commons Attribution (CC BY) license (https://creativecommons.org/licenses/by/4.0/).
Share and Cite
Qasmieh, I.A.; Alquran, H.; Zyout, A.; Al-Issa, Y.; Mustafa, W.A.; Alsalatie, M. Automated Detection of Corneal Ulcer Using Combination Image Processing and Deep Learning. Diagnostics 2022, 12, 3204. https://doi.org/10.3390/diagnostics12123204
Qasmieh IA, Alquran H, Zyout A, Al-Issa Y, Mustafa WA, Alsalatie M. Automated Detection of Corneal Ulcer Using Combination Image Processing and Deep Learning. Diagnostics. 2022; 12(12):3204. https://doi.org/10.3390/diagnostics12123204
Chicago/Turabian StyleQasmieh, Isam Abu, Hiam Alquran, Ala’a Zyout, Yazan Al-Issa, Wan Azani Mustafa, and Mohammed Alsalatie. 2022. "Automated Detection of Corneal Ulcer Using Combination Image Processing and Deep Learning" Diagnostics 12, no. 12: 3204. https://doi.org/10.3390/diagnostics12123204