
The Role of Noninvasive 13C-Octanoate Breath Test in Assessing the Diagnosis of Nonalcoholic Steatohepatitis

 , , , ,
Abstract
:1. Introduction
2. Materials and Methods
3. Results
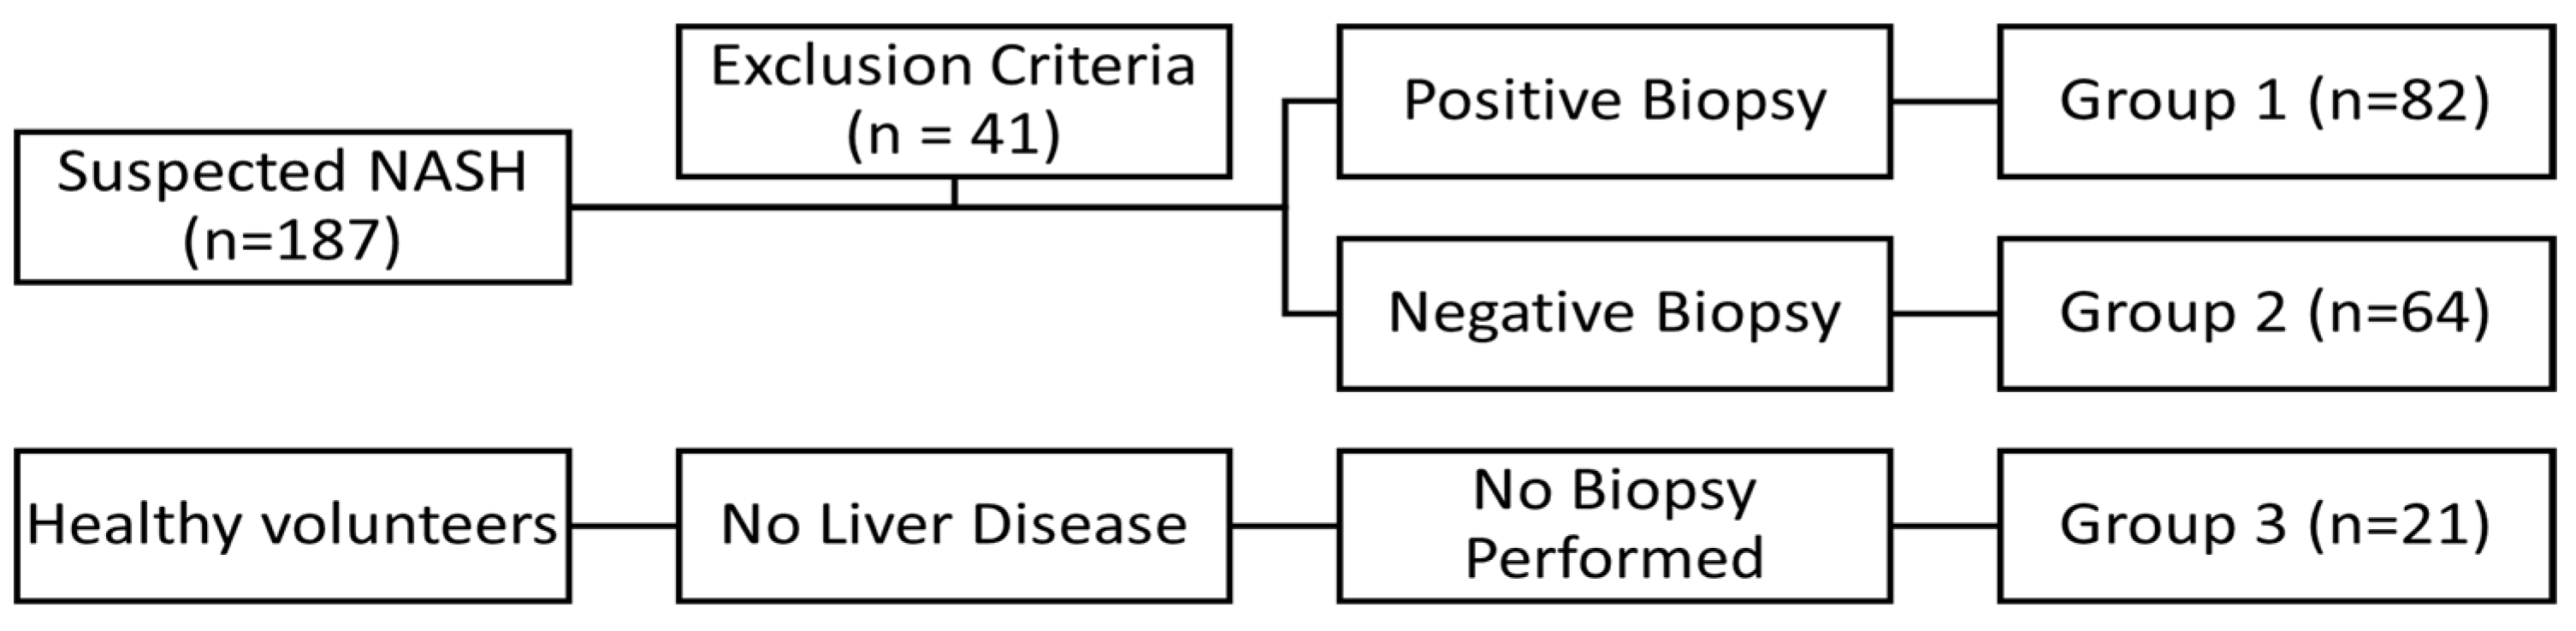
3.1. Characteristics of Patients
3.2. Univariate Analysis
3.3. Bivariate Analysis
3.4. Diagnostic Performance of the 13C Breath Test
4. Discussion
5. Conclusions
Author Contributions
Funding
Institutional Review Board Statement
Informed Consent Statement
Conflicts of Interest
References
- Younossi, Z.M.; Koenig, A.B.; Abdelatif, D.; Fazel, Y.; Henry, L.; Wymer, M. Global epidemiology of nonalcoholic fatty liver disease-Meta-analytic assessment of prevalence, incidence, and outcomes. Hepatology 2016, 64, 73–84. [Google Scholar] [CrossRef] [Green Version]
- Eslam, M.; Sanyal, A.J.; George, J.; on behalf of the International Consensus Panel. MAFLD: A Consensus-Driven Proposed Nomenclature for Metabolic Associated Fatty Liver Disease. Gastroenterology 2020, 158, 1999–2014.e1. [Google Scholar] [CrossRef] [PubMed]
- Younossi, Z.M.; Stepanova, M.; Rafiq, N.; Makhlouf, H.; Younoszai, Z.; Agrawal, R.; Goodman, Z. Pathologic criteria for nonalcoholic steatohepatitis: Interprotocol agreement and ability to predict liver-related mortality. Hepatology 2011, 53, 1874–1882. [Google Scholar] [CrossRef]
- Stepanova, M.; Rafiq, N.; Makhlouf, H.; Agrawal, R.; Kaur, I.; Younoszai, Z.; McCullough, A.; Goodman, Z.; Younossi, Z.M. Predictors of All-Cause Mortality and Liver-Related Mortality in Patients with Non-Alcoholic Fatty Liver Disease (NAFLD). Dig. Dis. Sci. 2013, 58, 3017–3023. [Google Scholar] [CrossRef] [PubMed]
- Pocha, C.; Kolly, P.; Dufour, J.-F. Nonalcoholic Fatty Liver Disease-Related Hepatocellular Carcinoma: A Problem of Growing Magnitude. Semin. Liver Dis. 2015, 35, 304–317. [Google Scholar] [CrossRef]
- Spengler, E.K.; Loomba, R. Recommendations for Diagnosis, Referral for Liver Biopsy, and Treatment of Nonalcoholic Fatty Liver Disease and Nonalcoholic Steatohepatitis. Mayo Clin. Proc. 2015, 90, 1233–1246. [Google Scholar] [CrossRef] [Green Version]
- Ratziu, V.; Charlotte, F.; Heurtier, A.; Gombert, S.; Giral, P.; Bruckert, E.; Grimaldi, A.; Capron, F.; Poynard, T.; LIDO Study Group. Sampling Variability of Liver Biopsy in Nonalcoholic Fatty Liver Disease. Gastroenterology 2005, 128, 1898–1906. [Google Scholar] [CrossRef]
- Fromenty, B.; Robin, M.A.; Igoudjil, A.; Mansouri, A.; Pessayre, D. The ins and outs of mitochondrial dysfunction in NASH. Diabetes Metab. 2004, 30, 121–138. [Google Scholar] [CrossRef]
- Monroe, P.S.; Baker, A.L.; Schneider, J.F.; Krager, P.S.; Klein, P.D.; Schoeller, D. The Aminopyrine Breath Test and Serum Bile Acids Reflect Histologic Severity in Chronic Hepatitis. Hepatology 1982, 2, 317S–322S. [Google Scholar] [CrossRef]
- Ghoos, Y.F.; Maes, B.D.; Geypens, B.J.; Mys, G.; Hiele, M.I.; Rutgeerts, P.J.; Vantrappen, G. Measurement of gastric emptying rate of solids by means of a carbon-labeled octanoic acid breath test. Gastroenterology 1993, 104, 1640–1647. [Google Scholar] [CrossRef]
- DeLany, J.P.; Windhauser, M.M.; Champagne, C.M.; Bray, G.A. Differential oxidation of individual dietary fatty acids in humans. Am. J. Clin. Nutr. 2000, 72, 905–911. [Google Scholar] [CrossRef] [Green Version]
- Nascimbeni, F.; Bedossa, P.; Fedchuk, L.; Pais, R.; Charlotte, F.; Lebray, P.; Poynard, T.; Ratziu, V. Clinical validation of the FLIP algorithm and the SAF score in patients with non-alcoholic fatty liver disease. J. Hepatol. 2020, 72, 828–838. [Google Scholar] [CrossRef] [PubMed]
- Guillot, E.; Vaugelade, P.; Lemarchali, P.; Rat, A.R. Intestinal absorption and liver uptake of medium-chain fatty acids in non-anaesthetized pigs. Br. J. Nutr. 1993, 69, 431–442. [Google Scholar] [CrossRef]
- Papamandjaris, A.A.; Macdougall, D.E.; Jones, P.J. Medium chain fatty acid metabolism and energy expenditure: Obesity treatment implications. Life Sci. 1998, 62, 1203–1215. [Google Scholar] [CrossRef]
- Younossi, Z.M.; Stepanova, M.; Afendy, M.; Fang, Y.; Younossi, Y.; Mir, H.; Srishord, M. Changes in the Prevalence of the Most Common Causes of Chronic Liver Diseases in the United States From 1988 to 2008. Clin. Gastroenterol. Hepatol. 2011, 9, 524–530.e1. [Google Scholar] [CrossRef]
- Kleiner, D.E.; Brunt, E.M. Nonalcoholic Fatty Liver Disease: Pathologic Patterns and Biopsy Evaluation in Clinical Research. Semin. Liver Dis. 2012, 32, 3–13. [Google Scholar] [CrossRef] [Green Version]
- Léveillé, M.; Estall, J.L. Mitochondrial Dysfunction in the Transition from NASH to HCC. Metabolites 2019, 9, 233. [Google Scholar] [CrossRef] [Green Version]
- Dornas, W.; Schuppan, D. Mitochondrial oxidative injury: A key player in nonalcoholic fatty liver disease. Am. J. Gastrointest. Liver Physiol. 2020, 319, G400–G411. [Google Scholar] [CrossRef]
- Lauterburg, B.H. Assessment of Liver Function prior to Hepatic Resection. Swiss Surg. 1999, 5, 92–96. [Google Scholar] [CrossRef]
- Reichen, J. Assessment of Hepatic Function with Xenobiotics. Semin. Liver Dis. 1995, 15, 189–201. [Google Scholar] [CrossRef]
- Dasarathy, S.; Kasumov, T.; Edmison, J.M.; Gruca, L.L.; Bennett, C.; Duenas, C.; Marczewski, S.; McCullough, A.J.; Hanson, R.W.; Kalhan, S.C. Glycine and urea kinetics in nonalcoholic steatohepatitis in human: Effect of intralipid infusion. Am. J. Physiol. Liver Physiol. 2009, 297, G567–G575. [Google Scholar] [CrossRef] [PubMed] [Green Version]
- Sanyal, A.J.; Campbell–Sargent, C.; Mirshahi, F.; Rizzo, W.B.; Contos, M.J.; Sterling, R.K.; Luketic, V.A.; Shiffman, M.L.; Clore, J.N. Nonalcoholic steatohepatitis: Association of insulin resistance and mitochondrial abnormalities. Gastroenterology 2001, 120, 1183–1192. [Google Scholar] [CrossRef] [PubMed]
- Kotronen, A.; Seppälä-Lindroos, A.; Vehkavaara, S.; Bergholm, R.; Frayn, K.N.; Fielding, B.A.; Yki-Järvinen, H. Liver fat and lipid oxidation in humans. Liver Int. 2009, 29, 1439–1446. [Google Scholar] [CrossRef]
- Shalev, T.; Aeed, H.; Sorin, V.; Shahmurov, M.; Didkovsky, E.; Ilan, Y.; Avni, Y.; Shirin, H. Evaluation of the 13C-Octanoate Breath Test as a Surrogate Marker of Liver Damage in Animal Models. Am. J. Dig. Dis. Sci. 2010, 55, 1589–1598. [Google Scholar] [CrossRef] [PubMed]
- Miele, L.; Grieco, A.; Armuzzi, A.; Candelli, M.; Forgione, A.; Gasbarrini, A.; Gasbarrini, G. Hepatic Mitochondrial Beta-Oxidation in Patients with Nonalcoholic Steatohepatitis Assessed by 13C-Octanoate Breath Test. Am. J. Gastroenterol. 2003, 98, 2335–2336. [Google Scholar] [CrossRef] [PubMed]
- Braun, M.; Pappo, O.; Zuckerman, E.; Sulkes, J.; Kitai, Y.; Moreno, M.; Cohen, O.; Weiss, H.; Rotman, Y.; Zamir, D. The Unique Breathid Test System Diagnoses and Predicts the Extent of Hepatic Injury in Patients with Nonalcoholic Fatty Liver Disease. Hepatology 2005, 42, A752. [Google Scholar] [CrossRef]
- Schneider, A.R.J.; Kraut, C.; Lindenthal, B.; Braden, B.; Caspary, W.F.; Stein, J. Total body metabolism of 13C-octanoic acid is preserved in patients with non-alcoholic steatohepatitis, but differs between women and men. Eur. J. Gastroenterol. Hepatol. 2005, 17, 1181–1184. [Google Scholar] [CrossRef] [PubMed]
- Van De Casteele, M.; Luypaerts, A.; Geypens, B.; Fevery, J.; Ghoos, Y.; Nevens, F. Oxidative breakdown of octanoic acid is maintained in patients with cirrhosis despite advanced disease. Neurogastroenterol. Motil. 2003, 15, 113–120. [Google Scholar] [CrossRef]
- Portincasa, P.; Grattagliano, I.; Lauterburg, B.H.; Palmieri, V.O.; Palasciano, G.; Stellaard, F. Liver breath tests non-invasively predict higher stages of non-alcoholic steatohepatitis. Clin. Sci. 2006, 111, 135–143. [Google Scholar] [CrossRef] [Green Version]
- Banasch, M.; Ellrichmann, M.; Tannapfel, A.; Schmidt, W.; Goetze, O. The non-invasive 13C-methionine breath test detects hepatic mitochondrial dysfunction as a marker of disease activity in non-alcoholic steatohepatitis. Eur. J. Med. Res. 2011, 16, 258–264. [Google Scholar] [CrossRef] [PubMed]
- Molina-Molina, E.; Shanmugam, H.; Di Palo, D.; Grattagliano, I.; Portincasa, P. Exploring Liver Mitochondrial Function 13C-Stable Isotope Breath Tests: Implications in Clinical Biochemistry. In Mitochondrial Regulation. Methods in Molecular Biology Palmeira; Palmeira, C.M., Rolo, A.P., Eds.; Humana: New York, NY, USA, 2021; Volume 2310. [Google Scholar] [CrossRef]
- Mansouri, A.; Gattolliat, C.-H.; Asselah, T. Mitochondrial Dysfunction and Signaling in Chronic Liver Diseases. Gastroenterology 2018, 155, 629–647. [Google Scholar] [CrossRef] [Green Version]
- Niederreiter, L.; Tilg, H. Cytokines and fatty liver diseases. Liver Res. 2018, 2, 14–20. [Google Scholar] [CrossRef]
- Pessayre, D.; Fromenty, B. NASH: A mitochondrial disease. J. Hepatol. 2005, 42, 928–940. [Google Scholar] [CrossRef] [PubMed]
- Singh, S.; Khera, R.; Allen, A.M.; Murad, M.H.; Loomba, R. Comparative effectiveness of pharmacological interventions for nonalcoholic steatohepatitis: A systematic review and network meta-analysis. Hepatology 2015, 62, 1417–1432. [Google Scholar] [CrossRef]
- Furnari, M.; Savarino, V.; Giannini, E.G. Use of liver breath tests to assess severity of nonalcoholic fatty liver disease. Rev. Recent Clin. Trials 2015, 9, 178–184. [Google Scholar] [CrossRef]
- Moldoveanu, A.C.; Fierbinteanu-Braticevici, C.G. A Primer into the Current State of Artificial Intelligence in Gastroenterology. J. Gastrointest. Liver Dis. 2022, 31, 244–253. [Google Scholar] [CrossRef]


| 0 | 1 | 2 | 3 | 4 | |
|---|---|---|---|---|---|
| Steatosis | 0 | 43 | 53 | 50 | 0 |
| Activity | 60 | 4 | 19 | 48 | 15 |
| Fibrosis | 63 | 66 | 15 | 2 | 0 |
| Variable | Group 1 | Group 2 | Group 3 | Method | df | p-Value |
|---|---|---|---|---|---|---|
| Number | 82 | 64 | 21 | |||
| Sex (M/F) | 42 M|40 F | 28 M|36 F | 8 M|13 F | Chi Square | 2 | 0.467 |
| Age (years) | 51.09 (SD = 12.03) | 48.31 (SD = 12.49) | 48.67 (SD = 7.49) | ANOVA | 2 | 0.337 |
| Blood glucose (mg/dL) | 116.2 (SD = 37.14) | 121.94 (SD = 47.51) | 119.48 (SD = 36.67) | KW | 2 | 0.504 |
| Urea (mg/dL) | 34.73 (SD = 8.09) | 34.05 (SD = 12.67) | 39.05 (SD = 15.78) | KW | 2 | 0.181 |
| Creatinine (mg/dL) | 0.79 (SD = 0.36) | 0.9 (SD = 0.19) | 0.86 (SD = 0.16) | KW | 2 | 0.737 |
| Total Bilirubin (mg/dL) | 1.11 (SD = 0.32) | 0.65 (SD = 0.59) | 0.59 (SD = 0.62) | KW | 2 | <0.001 * |
| Direct Bilirubin (mg/dL) | 0.34 (SD = 0.15) | 0.16 (SD = 0.16) | 0.13 (SD = 0.13) | KW | 2 | <0.001 * |
| ALP (mg/dL) | 86.24 (SD = 20.28) | 75.27 (SD = 20.76) | 74.57 (SD = 21.29) | KW | 2 | 0.047 * |
| GGT (U/L) | 169.39 (SD = 163.87) | 71.75 (SD = 63.24) | 60.1 (SD = 60.11) | KW | 2 | 0.004 * |
| Cholesterol (mg/dL) | 188.13 (SD = 38.15) | 199.3 (SD = 36.16) | 202.86 (SD = 37.08) | KW | 2 | <0.001 * |
| HDL Cholesterol (mg/dL) | 39.73 (SD = 15.66) | 48.95 (SD = 19.67) | 48.05 (SD = 16.13) | KW | 2 | <0.001 * |
| LDL Cholesterol (mg/dL) | 126.53 (SD = 29.12) | 111.53 (SD = 23.71) | 119.51 (SD = 25.82) | KW | 2 | <0.001 * |
| Triglycerides (mg/dL) | 113.05 (SD = 50.05) | 208.45 (SD = 76.73) | 199.52 (SD = 63.22) | KW | 2 | <0.001 * |
| AST (U/L) | 115.49 (SD = 110.09) | 25.92 (SD = 7.65) | 26.62 (SD = 6.07) | KW | 2 | <0.001 * |
| ALT (U/L) | 159.35 (SD = 157.67) | 44.42 (SD = 12.38) | 46.95 (SD = 14.45) | KW | 2 | <0.001 * |
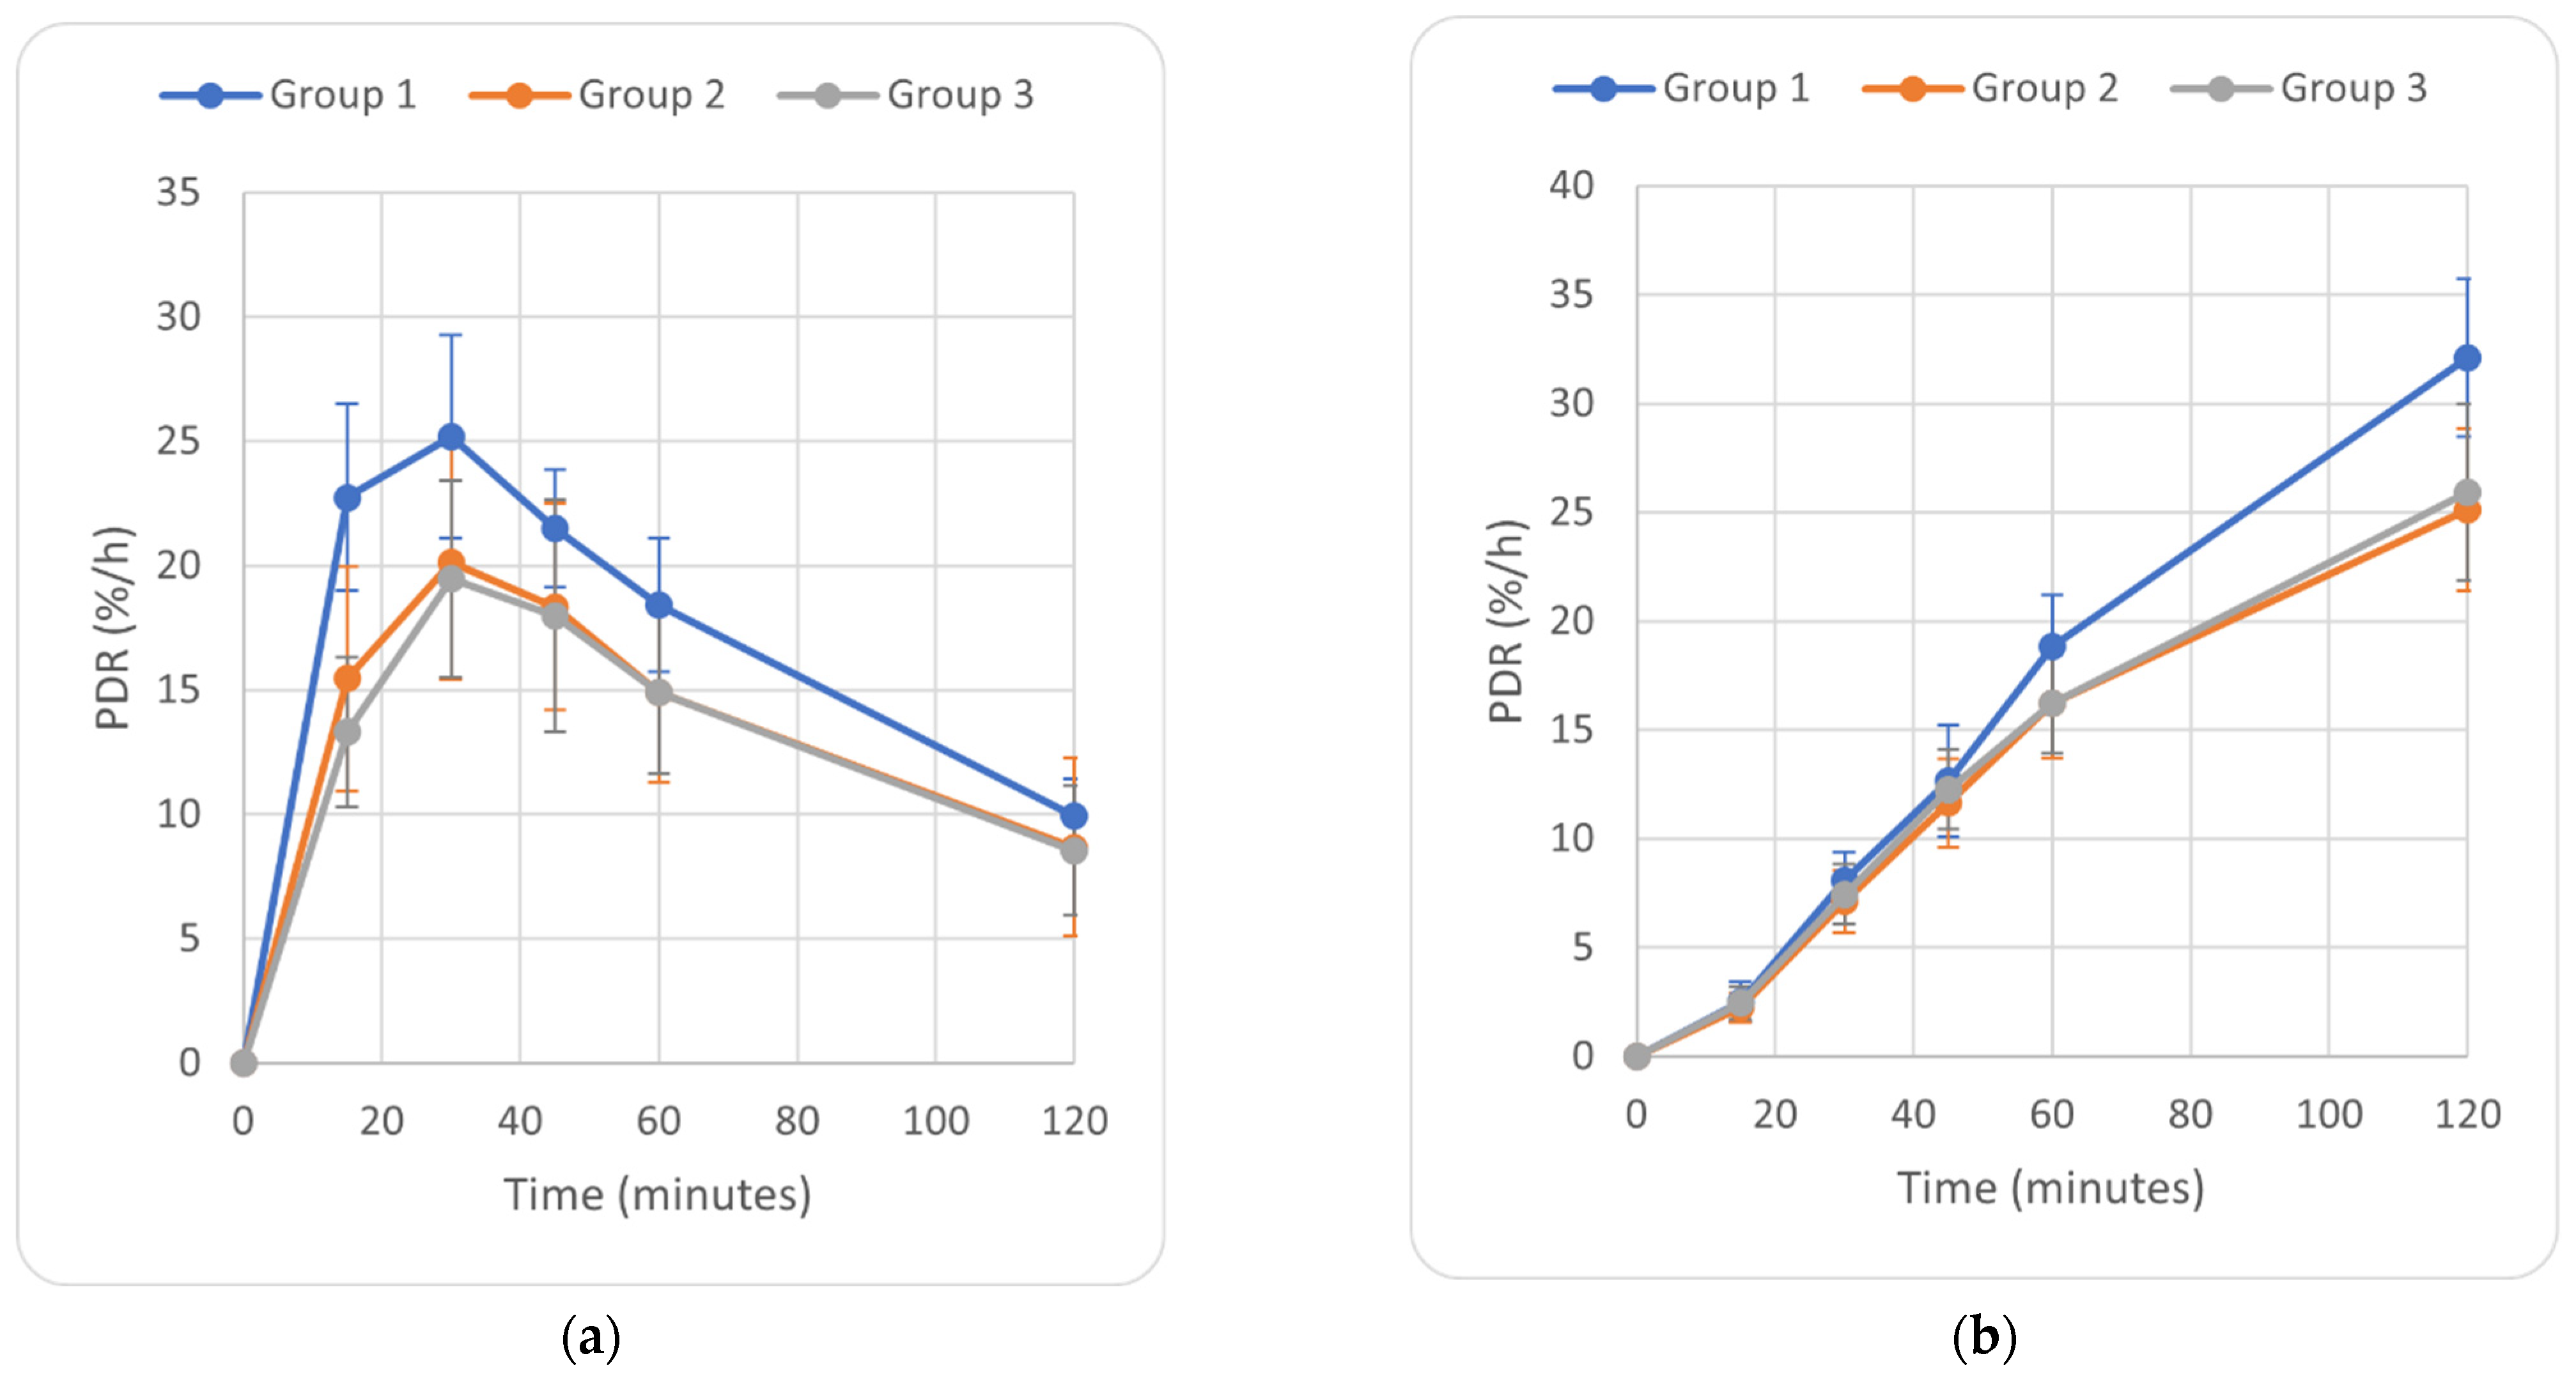
| PDR at 15 min (%/h) | 22.75 (SD = 3.78) | 15.45 (SD = 4.5) | 13.3 (SD = 3.02) | KW | 2 | 0.072 * |
| PDR at 30 min (%/h) | 25.2 (SD = 4.09) | 20.14 (SD = 4.7) | 19.47 (SD = 3.97) | KW | 2 | <0.001 * |
| PDR at 45 min (%/h) | 21.5 (SD = 2.36) | 18.35 (SD = 4.16) | 17.98 (SD = 4.68) | KW | 2 | <0.001 * |
| PDR at 60 min (%/h) | 18.42 (SD = 2.7) | 14.91 (SD = 3.6) | 14.9 (SD = 3.23) | KW | 2 | <0.001 * |
| PDR at 120 min (%/h) | 9.92 (SD = 1.52) | 8.68 (SD = 3.56) | 8.54 (SD = 2.6) | KW | 2 | 0.001 * |
| cPDR at 15 min (%) | 2.52 (SD = 0.91) | 2.24 (SD = 0.68) | 2.46 (SD = 0.76) | KW | 2 | 0.212 |
| cPDR at 30 min (%) | 8.1 (SD = 1.29) | 7.12 (SD = 1.44) | 7.45 (SD = 1.38) | KW | 2 | 0.031 * |
| cPDR at 45 min (%) | 12.65 (SD = 2.56) | 11.63 (SD = 2.02) | 12.28 (SD = 1.84) | KW | 2 | <0.001 * |
| cPDR at 60 min (%) | 18.86 (SD = 2.34) | 16.22 (SD = 2.5) | 16.23 (SD = 2.33) | KW | 2 | <0.001 * |
| cPDR at 120 min (%) | 32.11 (SD = 3.62) | 25.11 (SD = 3.71) | 25.93 (SD = 4.06) | KW | 2 | <0.001 * |
| Variable | p-Value (Group 1 vs. Group 2) | p-Value (Group 1 vs. Group 3) | p-Value (Group 2 vs. Group 3) | Method |
|---|---|---|---|---|
| Total Bilirubin (mg/dL) | <0.001 * | <0.001 * | 0.968 | Dunn |
| Direct Bilirubin (mg/dL) | <0.001 * | <0.001 * | 0.722 | Dunn |
| ALP (mg/dL) | <0.001 * | 0.050 | 0.900 | Dunn |
| GGT (U/L) | <0.001 * | <0.001 * | 0.900 | Dunn |
| Cholesterol (mg/dL) | <0.001 * | <0.001 * | 0.520 | Dunn |
| HDL Cholesterol (mg/dL) | <0.001 * | 0.120 | 0.900 | Dunn |
| LDL Cholesterol (mg/dL) | <0.001 * | 0.547 | 0.460 | Dunn |
| Triglycerides (mg/dL) | <0.001 * | <0.001 * | 0.830 | Dunn |
| AST (U/L) | <0.001 * | <0.001 * | 0.961 | Dunn |
| ALT (U/L) | <0.001 * | <0.001 * | 0.662 | Dunn |
| PDR at 15 min (%/h) | <0.001 * | 0.008 * | 0.961 | Dunn |
| PDR at 30 min (%/h) | <0.001 * | <0.001 * | 0.810 | Dunn |
| PDR at 45 min (%/h) | <0.001 * | <0.001 * | 0.900 | Dunn |
| PDR at 60 min (%/h) | <0.001 * | <0.001 * | 0.900 | Dunn |
| PDR at 120 min (%/h) | 0.010 * | 0.082 | 0.900 | Dunn |
| cPDR at 15 min (%) | 0.090 | 0.900 | 0.521 | Dunn |
| cPDR at 30 min (%) | <0.001 * | 0.125 | 0.600 | Dunn |
| cPDR at 45 min (%) | 0.021 * | 0.782 | 0.500 | Dunn |
| cPDR at 60 min (%) | <0.001 * | <0.001 * | 0.900 | Dunn |
| cPDR at 120 min (%) | <0.001 * | <0.001 * | 0.664 | Dunn |
| Steatosis (S) | Inflammatory Activity (A) | Fibrosis (F) | |
|---|---|---|---|
| Age | −0.01 | 0.01 | 0.17 |
| Blood glucose | 0.03 | −0.05 | −0.03 |
| Urea | −0.15 | 0.05 | 0.10 |
| Creatinine | −0.09 | −0.14 | −0.06 |
| Total Bilirubin | 0.20 | 0.56 | 0.41 |
| Direct Bilirubin | 0.10 | 0.56 | 0.38 |
| ALP | −0.07 | 0.22 | 0.15 |
| GGT | 0.06 | 0.17 | 0.18 |
| Cholesterol | −0.12 | −0.16 | −0.17 |
| HDL Cholesterol | −0.06 | −0.16 | −0.13 |
| LDL Cholesterol | −0.04 | 0.15 | 0.11 |
| Triglycerides | 0.02 | −0.58 | −0.43 |
| AST | −0.06 | 0.64 | 0.40 |
| ALT | −0.08 | 0.64 | 0.41 |
| PDR at 15 min | 0.09 | 0.65 | 0.40 |
| PDR at 30 min | −0.01 | 0.47 | 0.35 |
| PDR at 45 min | 0.03 | 0.39 | 0.32 |
| PDR at 60 min | 0.06 | 0.46 | 0.33 |
| PDR at 120 min | 0.04 | 0.32 | 0.28 |
| cPDR at 15 min | −0.09 | 0.13 | 0.06 |
| cPDR at 30 min | −0.07 | 0.16 | 0.11 |
| cPDR at 45 min | 0.00 | 0.39 | 0.27 |
| cPDR at 60 min | −0.15 | 0.31 | 0.22 |
| cPDR at 120 min | 0.08 | 0.69 | 0.46 |
| Variable | AUROC | 95% CI Interval | Cutoff | Sensitivity | Specificity | PPV | NPV | |
|---|---|---|---|---|---|---|---|---|
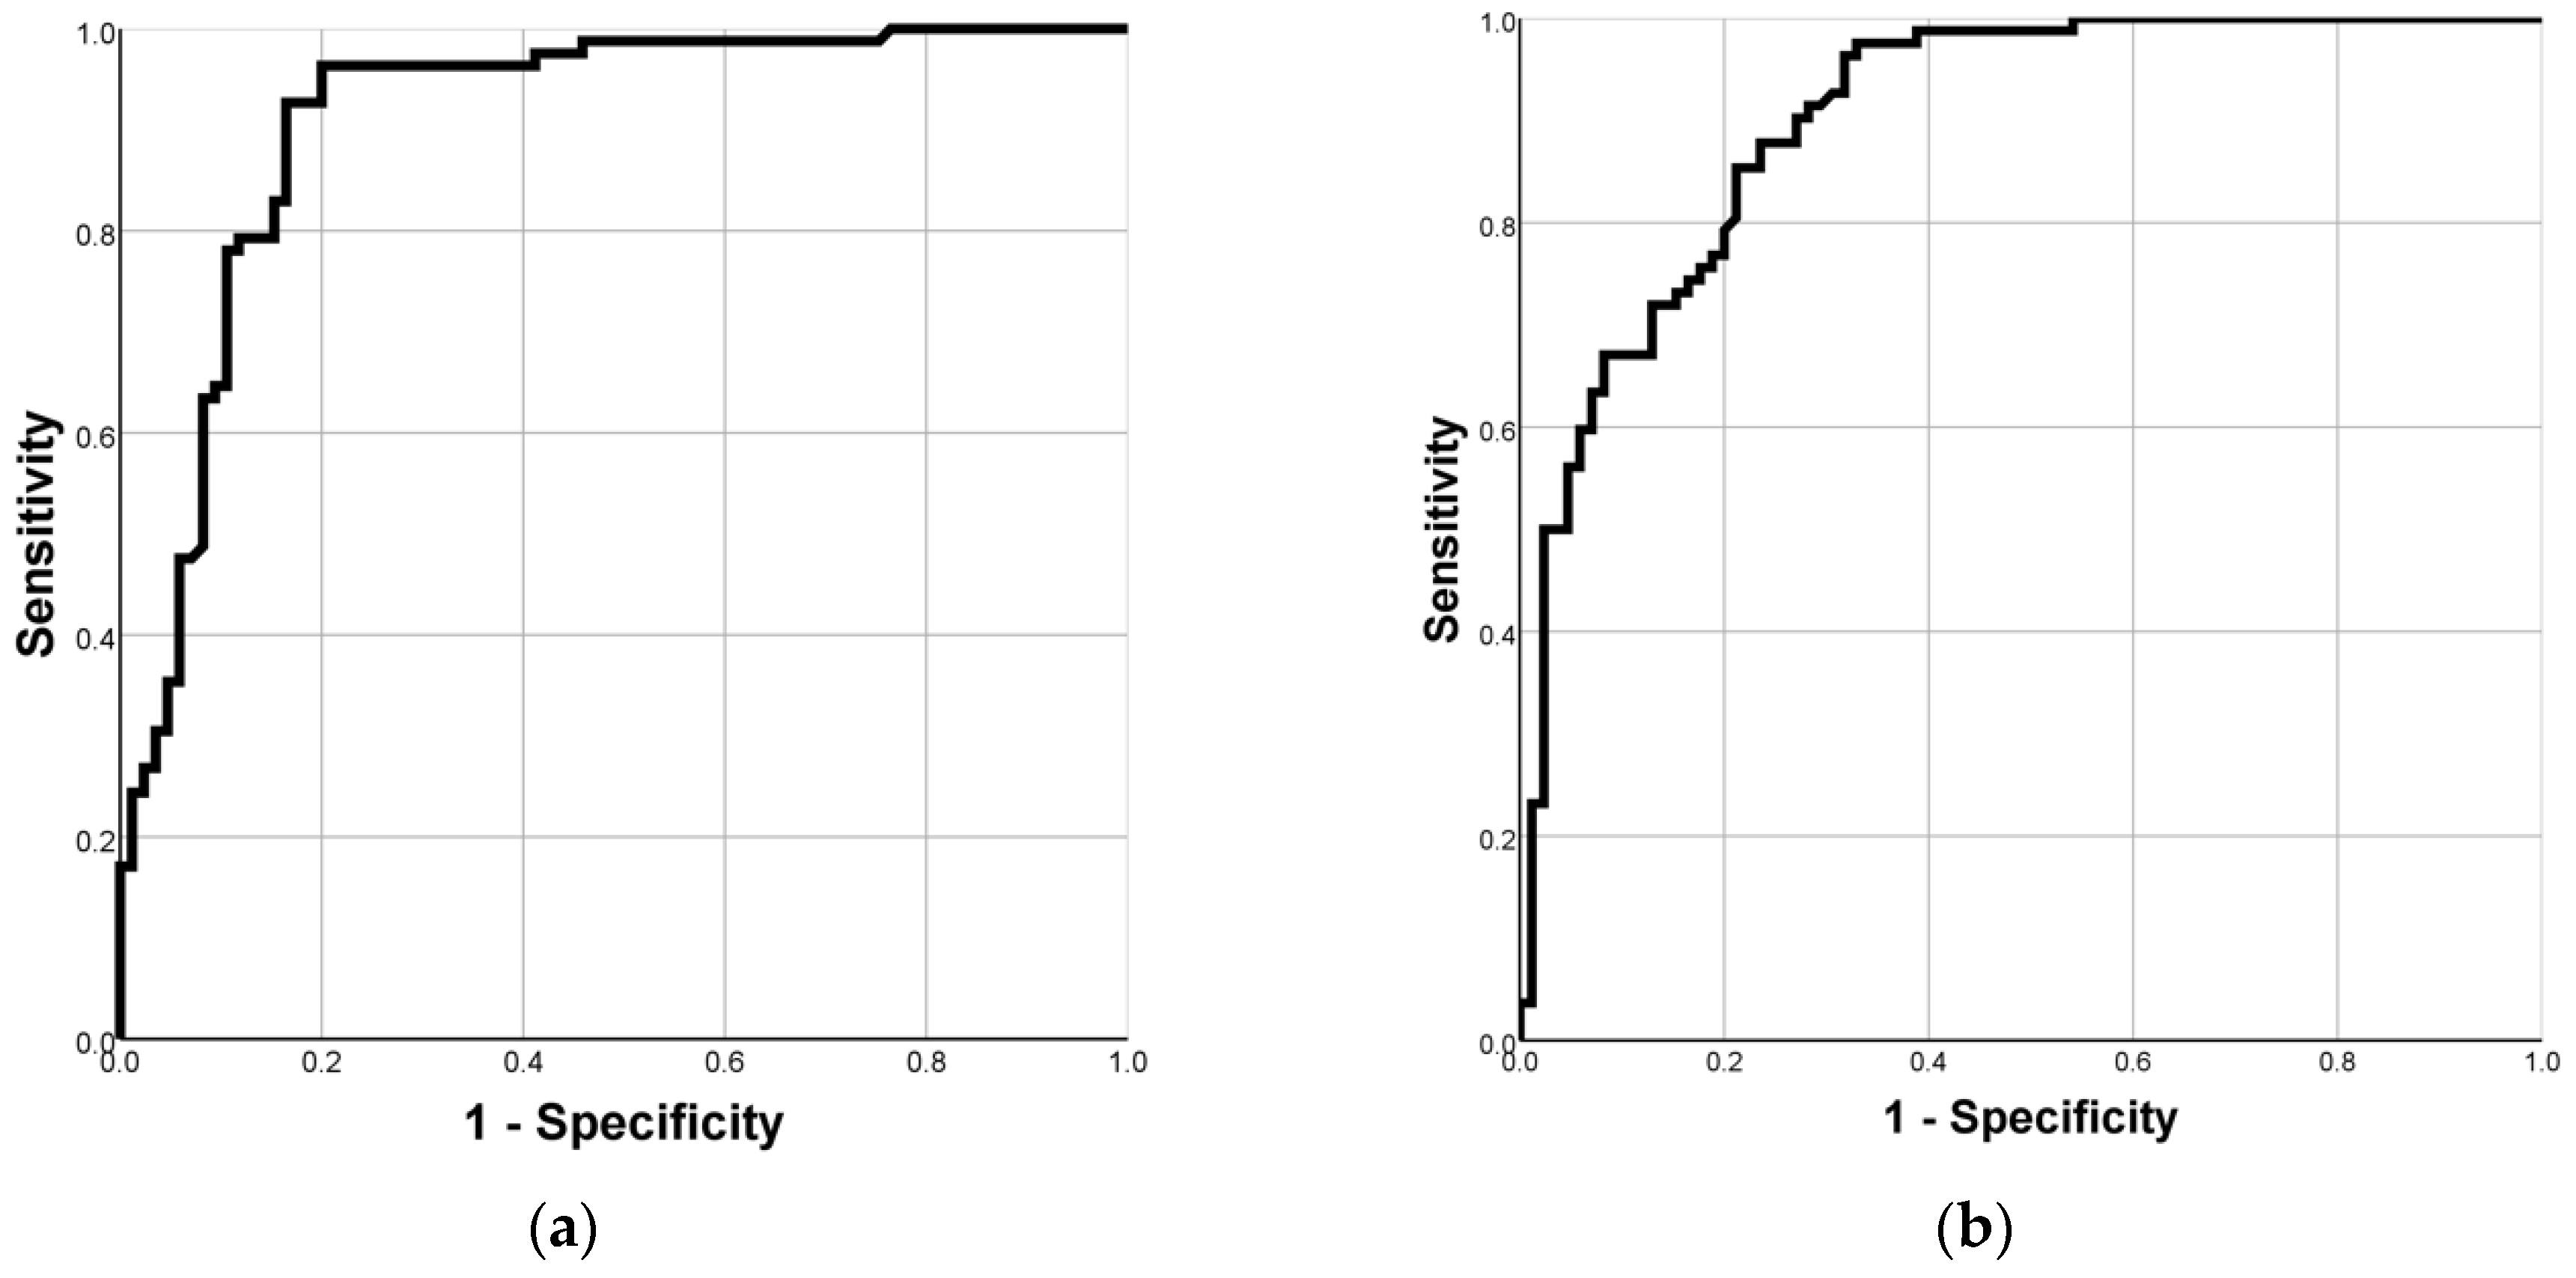
| PDR at 15 min | 0.902 | 0.855 | 0.949 | 17.14 | 95% | 74% | 78% | 94% |
| PDR at 30 min | 0.811 | 0.746 | 0.876 | 20.85 | 86% | 66% | 71% | 84% |
| PDR at 45 min | 0.735 | 0.656 | 0.813 | 17.99 | 95% | 53% | 66% | 92% |
| PDR at 60 min | 0.788 | 0.716 | 0.860 | 15.86 | 86% | 71% | 73% | 85% |
| PDR at 120 min | 0.667 | 0.581 | 0.753 | 8.46 | 83% | 54% | 63% | 77% |
| cPDR at 15 min | 0.563 | 0.475 | 0.652 | 3.31 | 21% | 98% | 89% | 56% |
| cPDR at 30 min | 0.681 | 0.601 | 0.762 | 7.83 | 63% | 68% | 65% | 66% |
| cPDR at 45 min | 0.592 | 0.505 | 0.679 | 13.69 | 36% | 82% | 66% | 57% |
| cPDR at 60 min | 0.780 | 0.710 | 0.849 | 16.05 | 91% | 55% | 66% | 87% |
| cPDR at 120 min | 0.899 | 0.853 | 0.945 | 29.02 | 81% | 86% | 85% | 83% |
Publisher’s Note: MDPI stays neutral with regard to jurisdictional claims in published maps and institutional affiliations. |
© 2022 by the authors. Licensee MDPI, Basel, Switzerland. This article is an open access article distributed under the terms and conditions of the Creative Commons Attribution (CC BY) license (https://creativecommons.org/licenses/by/4.0/).
Share and Cite
Fierbinteanu-Braticevici, C.; Calin-Necula, A.-M.; Enciu, V.-T.; Goran, L.; Pantea Stoian, A.; Ancuta, I.; Viasu, O.; Moldoveanu, A.C. The Role of Noninvasive 13C-Octanoate Breath Test in Assessing the Diagnosis of Nonalcoholic Steatohepatitis. Diagnostics 2022, 12, 2935. https://doi.org/10.3390/diagnostics12122935
Fierbinteanu-Braticevici C, Calin-Necula A-M, Enciu V-T, Goran L, Pantea Stoian A, Ancuta I, Viasu O, Moldoveanu AC. The Role of Noninvasive 13C-Octanoate Breath Test in Assessing the Diagnosis of Nonalcoholic Steatohepatitis. Diagnostics. 2022; 12(12):2935. https://doi.org/10.3390/diagnostics12122935
Chicago/Turabian StyleFierbinteanu-Braticevici, Carmen, Ana-Maria Calin-Necula, Vlad-Teodor Enciu, Loredana Goran, Anca Pantea Stoian, Ioan Ancuta, Octav Viasu, and Alexandru Constantin Moldoveanu. 2022. "The Role of Noninvasive 13C-Octanoate Breath Test in Assessing the Diagnosis of Nonalcoholic Steatohepatitis" Diagnostics 12, no. 12: 2935. https://doi.org/10.3390/diagnostics12122935