

Isolation and Quantification of Plasma Cell-Free DNA Using Different Manual and Automated Methods

Abstract
:1. Introduction
2. Materials and Methods
2.1. Plasma Samples
2.2. Sample Processing
2.3. cfDNA Isolation
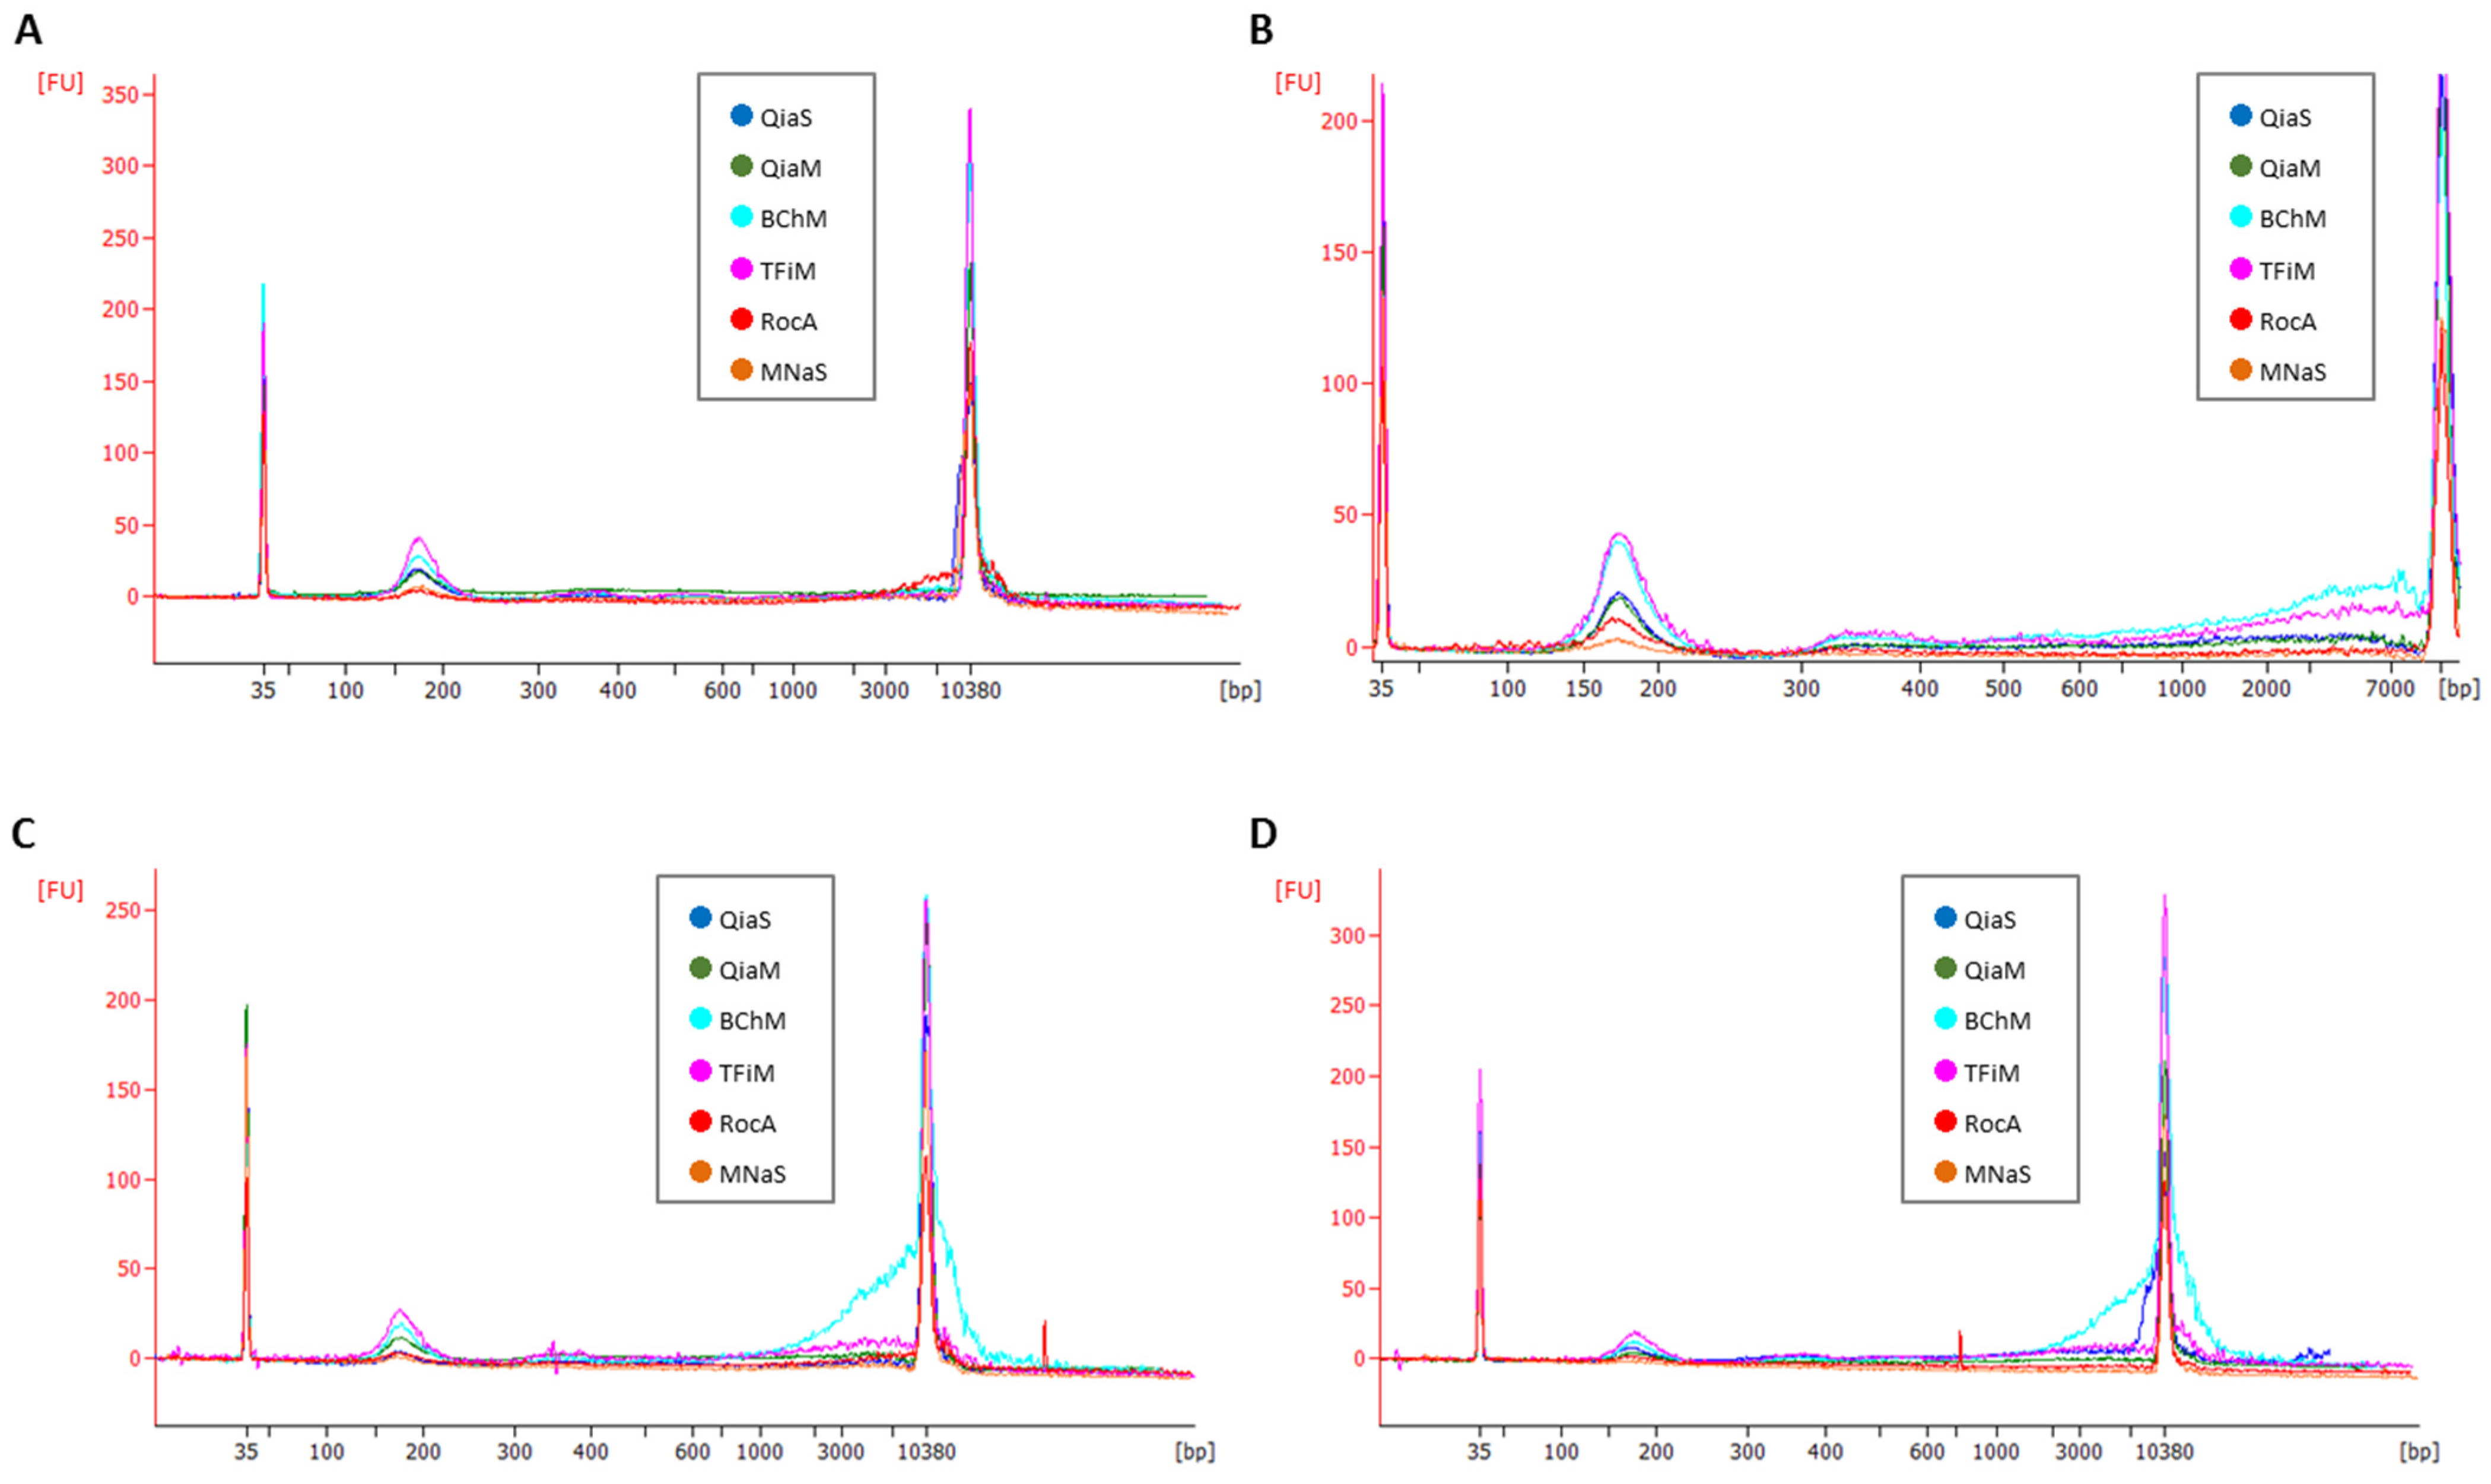
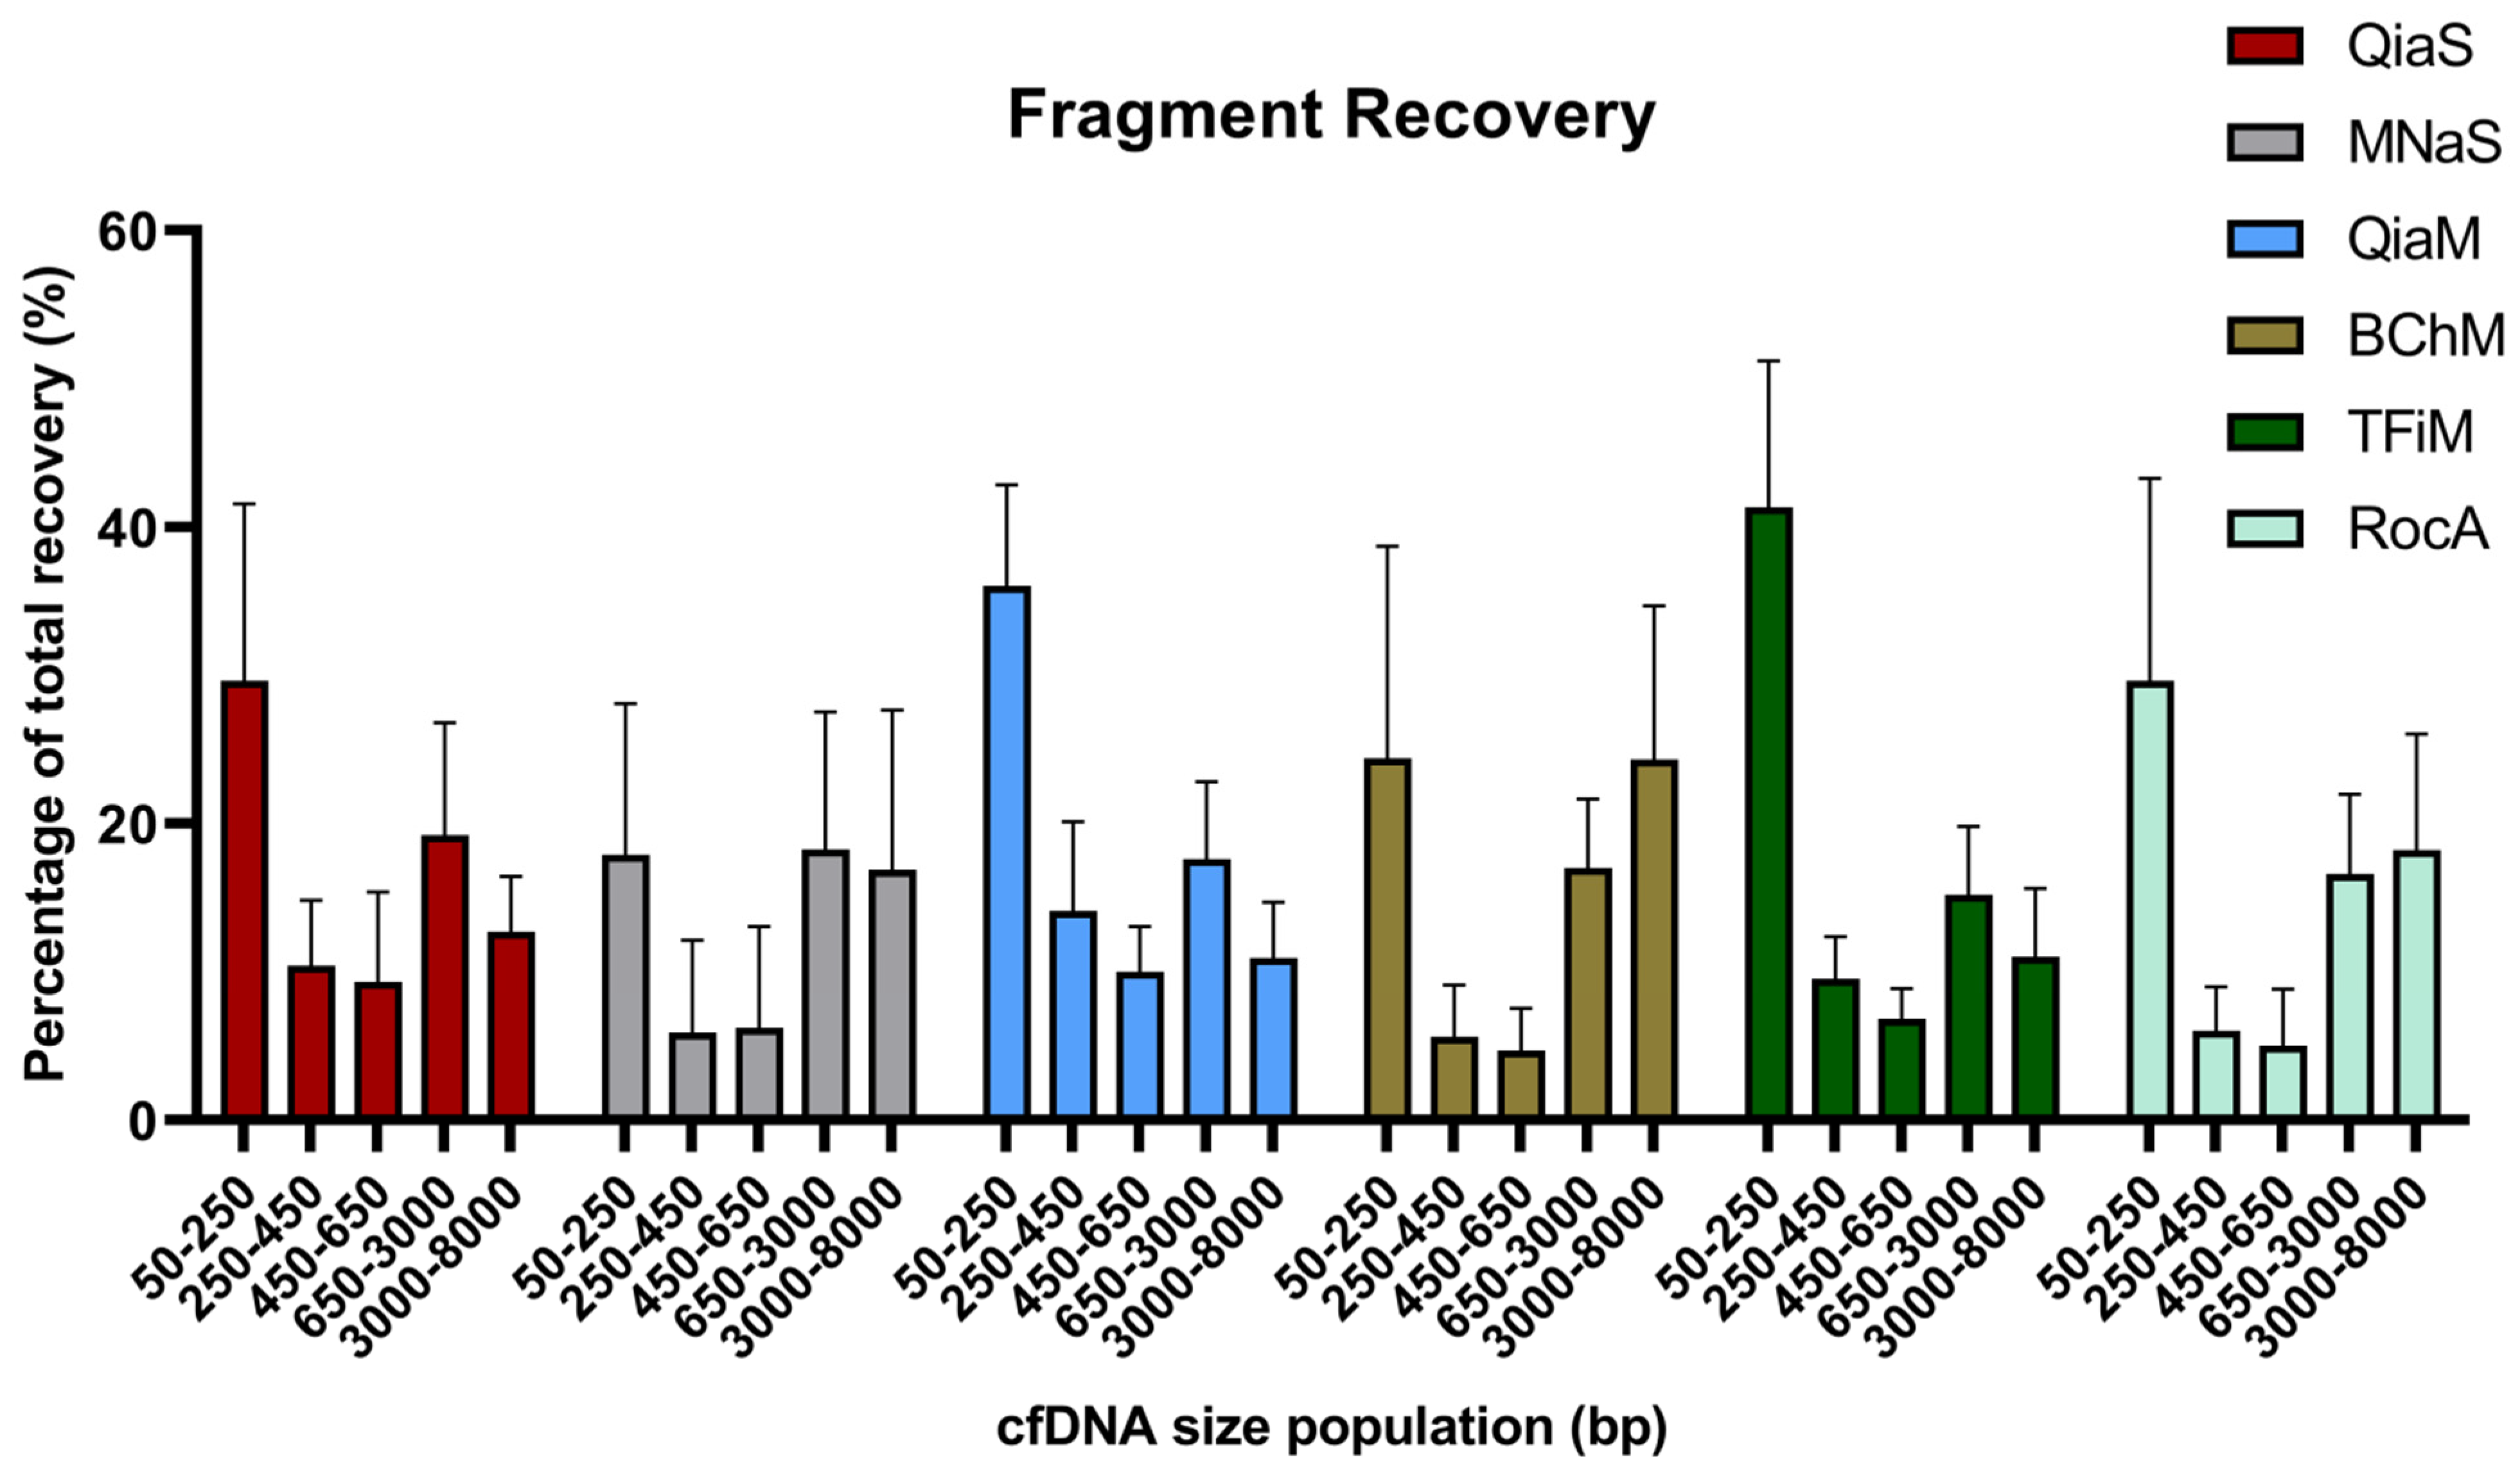
2.4. cfDNA Quantification and DNA Sizing
2.5. Statistics
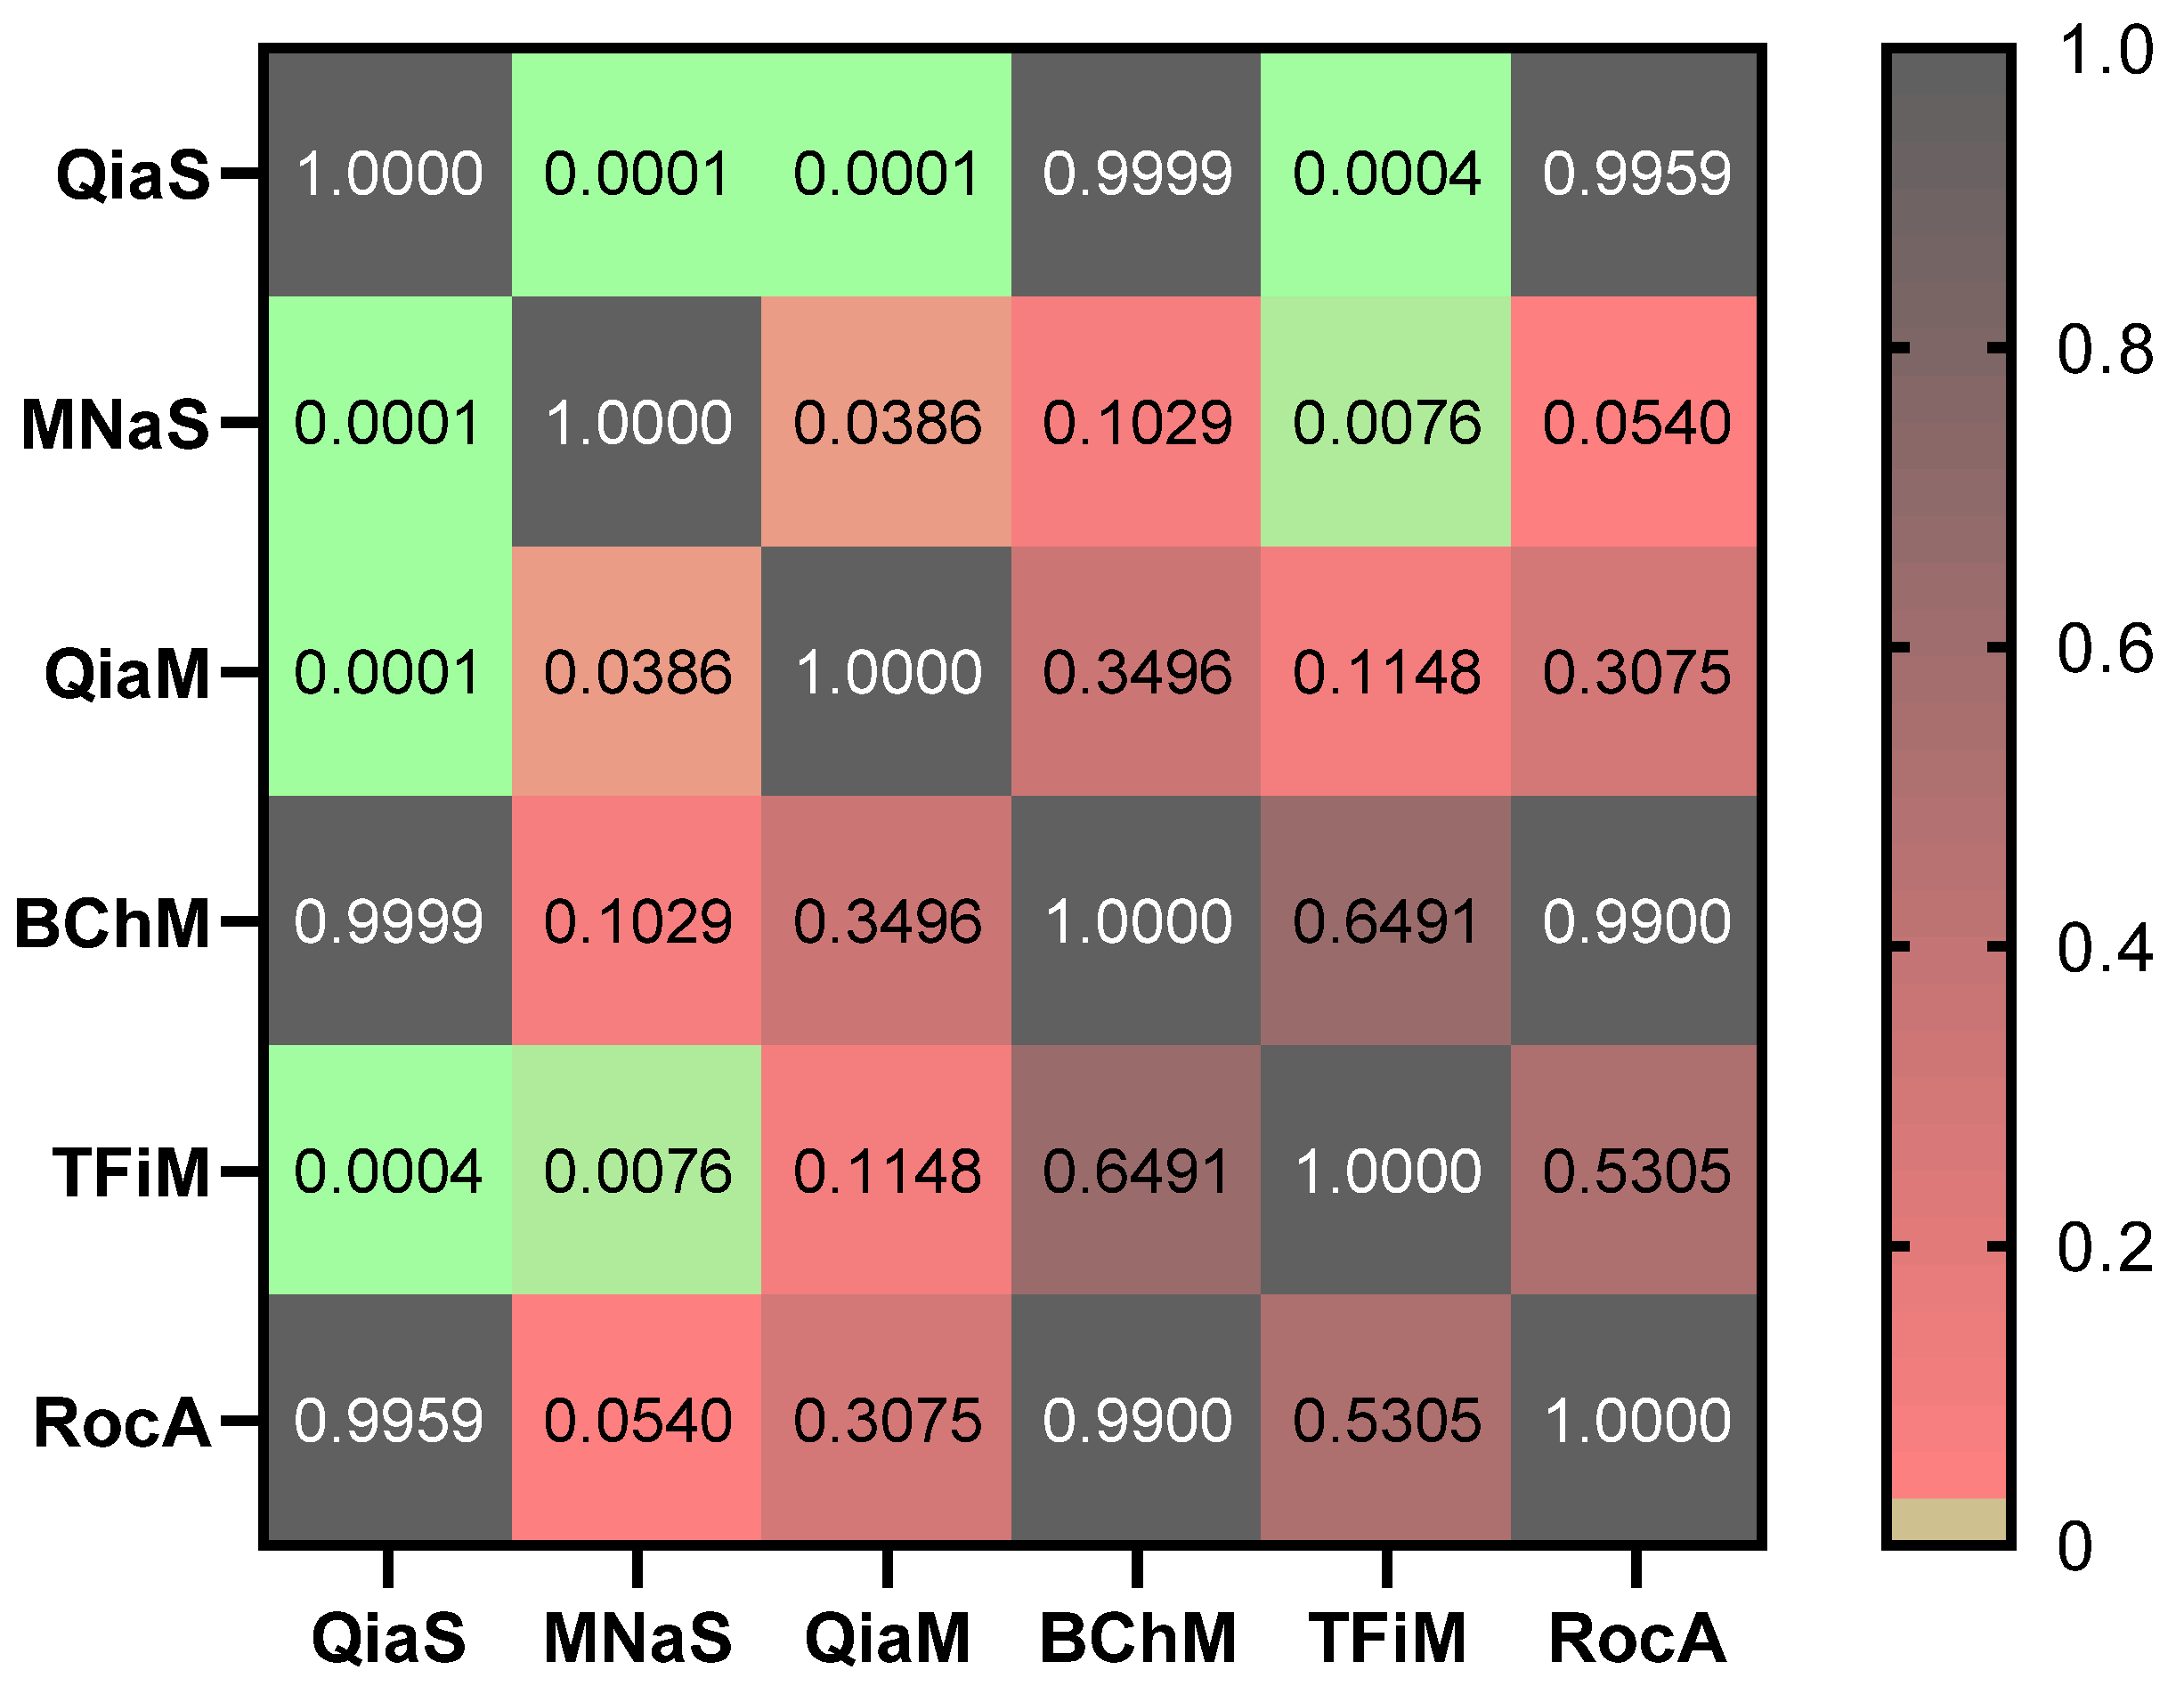
3. Results and Discussion
4. Conclusions
Author Contributions
Funding
Institutional Review Board Statement
Informed Consent Statement
Data Availability Statement
Conflicts of Interest
References
- Lee, H.; Park, C.; Na, W.; Park, K.H.; Shin, S. Precision cell-free DNA extraction for liquid biopsy by integrated microfluidics. NPJ Precis. Oncol. 2020, 4, 3. [Google Scholar] [CrossRef] [PubMed] [Green Version]
- Chu, D.; Park, B.H. Liquid biopsy: Unlocking the potentials of cell-free DNA. Virchows Arch. 2017, 471, 147–154. [Google Scholar] [CrossRef]
- Fleischhacker, M.; Schmidt, B. Circulating nucleic acids (CNAs) and cancer—A survey. Biochim. Biophys Acta 2007, 1775, 181–232. [Google Scholar] [CrossRef] [PubMed]
- Perkins, G.; Yap, T.A.; Pope, L.; Cassidy, A.M.; Dukes, J.P.; Riisnaes, R.; Massard, C.; Cassier, P.A.; Miranda, S.; Clark, J.; et al. Multi-Purpose Utility of Circulating Plasma DNA Testing in Patients with Advanced Cancers. PLoS ONE 2012, 7, e47020. [Google Scholar] [CrossRef] [PubMed]
- Markus, H.; Contente-Cuomo, T.; Farooq, M.; Liang, W.S.; Borad, M.J.; Sivakumar, S.; Gollins, S.; Tran, N.L.; Dhruv, H.D.; Berens, M.E.; et al. Evaluation of pre-analytical factors affecting plasma DNA analysis. Sci. Rep. 2018, 8, 7375. [Google Scholar] [CrossRef] [Green Version]
- Bronkhorst, A.J.; Aucamp, J.; Pretorius, P.J. Cell-free DNA: Preanalytical variables. Clin. Chim. Acta 2015, 450, 243–253. [Google Scholar] [CrossRef] [PubMed]
- Bronkhorst, A.J.; Ungerer, V.; Holdenrieder, S. The emerging role of cell-free DNA as a molecular marker for cancer management. Biomol. Detect. Quantif. 2019, 17, 100087. [Google Scholar] [CrossRef]
- Heitzer, E.; van den Broek, D.; Denis, M.G.; Hofman, P.; Hubank, M.; Mouliere, F.; Paz-Ares, L.; Schuuring, E.; Sültmann, H.; Vainer, G.; et al. Recommendations for a practical implementation of circulating tumor DNA mutation testing in metastatic non-small-cell lung cancer. ESMO Open 2022, 7, 100399. [Google Scholar] [CrossRef] [PubMed]
- Underhill, H.R.; Kitzman, J.O.; Hellwig, S.; Welker, N.C.; Daza, R.; Baker, D.N.; Gligorich, K.M.; Rostomily, R.C.; Bronner, M.P.; Shendure, J. Fragment Length of Circulating Tumor DNA. PLoS Genet. 2016, 12, e1006162. [Google Scholar] [CrossRef] [Green Version]
- Peneder, P.; Stütz, A.M.; Surdez, D.; Krumbholz, M.; Semper, S.; Chicard, M.; Sheffield, N.C.; Pierron, G.; Lapouble, E.; Tötzl, M.; et al. Multimodal analysis of cell-free DNA whole-genome sequencing for pediatric cancers with low mutational burden. Nat. Commun. 2021, 12, 3230. [Google Scholar] [CrossRef]
- Cristiano, S.; Leal, A.; Phallen, J.; Fiksel, J.; Adleff, V.; Bruhm, D.C.; Jensen, S.Ø.; Medina, J.E.; Hruban, C.; White, J.R.; et al. Genome-wide cell-free DNA fragmentation in patients with cancer. Nature 2019, 570, 385–389. [Google Scholar] [CrossRef]
- Zvereva, M.; Roberti, G.; Durand, G.; Voegele, C.; Nguyen, M.D.; Delhomme, T.M.; Chopard, P.; Fabianova, E.; Adamcakova, Z.; Holcatova, I.; et al. Circulating tumour-derived KRAS mutations in pancreatic cancer cases are predominantly carried by very short fragments of cell-free DNA. EBioMedicine 2020, 55, 102462. [Google Scholar] [CrossRef]
- Yu, S.C.Y.; Jiang, P.; Peng, W.; Cheng, S.H.; Cheung, Y.T.T.; Tse, O.Y.O.; Shang, H.; Poon, L.C.; Leung, T.Y.; Chan, K.C.A.; et al. Single-molecule sequencing reveals a large population of long cell-free DNA molecules in maternal plasma. Proc. Natl. Acad. Sci. USA 2021, 118, e2114937118. [Google Scholar] [CrossRef] [PubMed]
- Zuo, S.; Yi, Y.; Wang, C.; Li, X.; Zhou, M.; Peng, Q.; Zhou, J.; Yang, Y.; He, Q. Extrachromosomal Circular DNA (eccDNA): From Chaos to Function. Front. Cell Dev. Biol. 2021, 9, 792555. [Google Scholar] [CrossRef]
- Choy, L.Y.L.; Peng, W.; Jiang, P.; Cheng, S.H.; Yu, S.C.Y.; Shang, H.; Tse, O.Y.O.; Wong, J.; Wong, V.W.; Wong, G.L.H.; et al. Single-molecule Sequencing Enables Long Cell-free DNA Detection and Direct Methylation Analysis for Cancer Patients. Clin. Chem. 2022, 68, 1151–1163. [Google Scholar] [CrossRef] [PubMed]
- van der Vaart, M.; Pretorius, P.J. Is the role of circulating DNA as a biomarker of cancer being prematurely overrated? Clin. Biochem. 2010, 43, 26–36. [Google Scholar] [CrossRef]
- Diefenbach, R.J.; Lee, J.H.; Kefford, R.F.; Rizos, H. Evaluation of commercial kits for purification of circulating free DNA. Cancer Genet. 2018, 228–229, 21–27. [Google Scholar] [CrossRef] [PubMed]
- Jain, M.; Balatsky, A.V.; Revina, D.B.; Samokhodskaya, L.M. Direct comparison of QIAamp DSP Virus Kit and QIAamp Circulating Nucleic Acid Kit regarding cell-free fetal DNA isolation from maternal peripheral blood. Mol. Cell Probes 2019, 43, 13–19. [Google Scholar] [CrossRef]
- Mauger, F.; Dulary, C.; Daviaud, C.; Deleuze, J.F.; Tost, J. Comprehensive evaluation of methods to isolate, quantify, and characterize circulating cell-free DNA from small volumes of plasma. Anal. Bioanal. Chem. 2015, 407, 6873–6878. [Google Scholar] [CrossRef]
- Devonshire, A.S.; Whale, A.S.; Gutteridge, A.; Jones, G.; Cowen, S.; Foy, C.A.; Huggett, J.F. Towards standardisation of cell-free DNA measurement in plasma: Controls for extraction efficiency, fragment size bias and quantification. Anal. Bioanal. Chem. 2014, 406, 6499–6512. [Google Scholar] [CrossRef]
- Barrett, A.N.; Thadani, H.A.; Laureano-Asibal, C.; Ponnusamy, S.; Choolani, M. Stability of cell-free DNA from maternal plasma isolated following a single centrifugation step. Prenat. Diagn. 2014, 34, 1283–1288. [Google Scholar] [CrossRef]
- Bronkhorst, A.J.; Ungerer, V.; Holdenrieder, S. Comparison of methods for the isolation of cell-free DNA from cell culture supernatant. Tumour Biol. 2020, 42, 1010428320916314. [Google Scholar] [CrossRef]
- Maass, K.K.; Schad, P.S.; Finster, A.M.E.; Puranachot, P.; Rosing, F.; Wedig, T.; Schwarz, N.; Stumpf, N.; Pfister, S.M.; Pajtler, K.W. From Sampling to Sequencing: A Liquid Biopsy Pre-Analytic Workflow to Maximize Multi-Layer Genomic Information from a Single Tube. Cancers 2021, 13, 3002. [Google Scholar] [CrossRef] [PubMed]
- Solassol, J.; Quantin, X.; Larrieux, M.; Senal, R.; Audran, P.; Grand, D.; Mangé, A.; Diamandis, E.P.; Vendrell, J.A. Comparison of five cell-free DNA isolation methods to detect the EGFR T790M mutation in plasma samples of patients with lung cancer. Clin. Chem. Lab. Med. (CCLM) 2018, 56, e243–e246. [Google Scholar] [CrossRef]
- Cédile, O.; Veyhe, S.R.; Hansen, M.H.; Titlestad, K.; Nyvold, C.G. Investigation of circulating DNA integrity after blood collection. BioTechniques 2021, 71, 550–555. [Google Scholar] [CrossRef] [PubMed]
- van Ginkel, J.H.; van den Broek, D.A.; van Kuik, J.; Linders, D.; de Weger, R.; Willems, S.M.; Huibers, M.M.H. Preanalytical blood sample workup for cell-free DNA analysis using Droplet Digital PCR for future molecular cancer diagnostics. Cancer Med. 2017, 6, 2297–2307. [Google Scholar] [CrossRef] [PubMed]


| Product | Code | Type | Can Be Automated | Isolation Volume (mL) | Elution Volume (µL) |
|---|---|---|---|---|---|
| QIAamp Circulating Nucleic Acid Kit (Qiagen) | QiaS | spin column (vacuum manifold) | no | 1 | 50 |
| NucleoSpin Plasma XS (Macherey-Nagel) | MNaS | spin column | no | <0.24 | 5–30 |
| QIAmp MinElute ccfDNA Mini Kit (Qiagen) | QiaM | magnetic beads | yes | 1–4 | 20–80 |
| cfPure Cell-Free DNA Extraction Kit (BioChain) | BChM | magnetic beads | yes | 1–10 | 15–50 |
| MagMAX Cell-Free DNA Isolation Kit (Thermo Fisher Scientific) | TFiM | magnetic beads | yes | 0.5–10 | 15–50 |
| MagNA Pure 24 Total NA Isolation Kit (Roche) | RocA | magnetic beads (automated) | - | 2 | 50/100 |
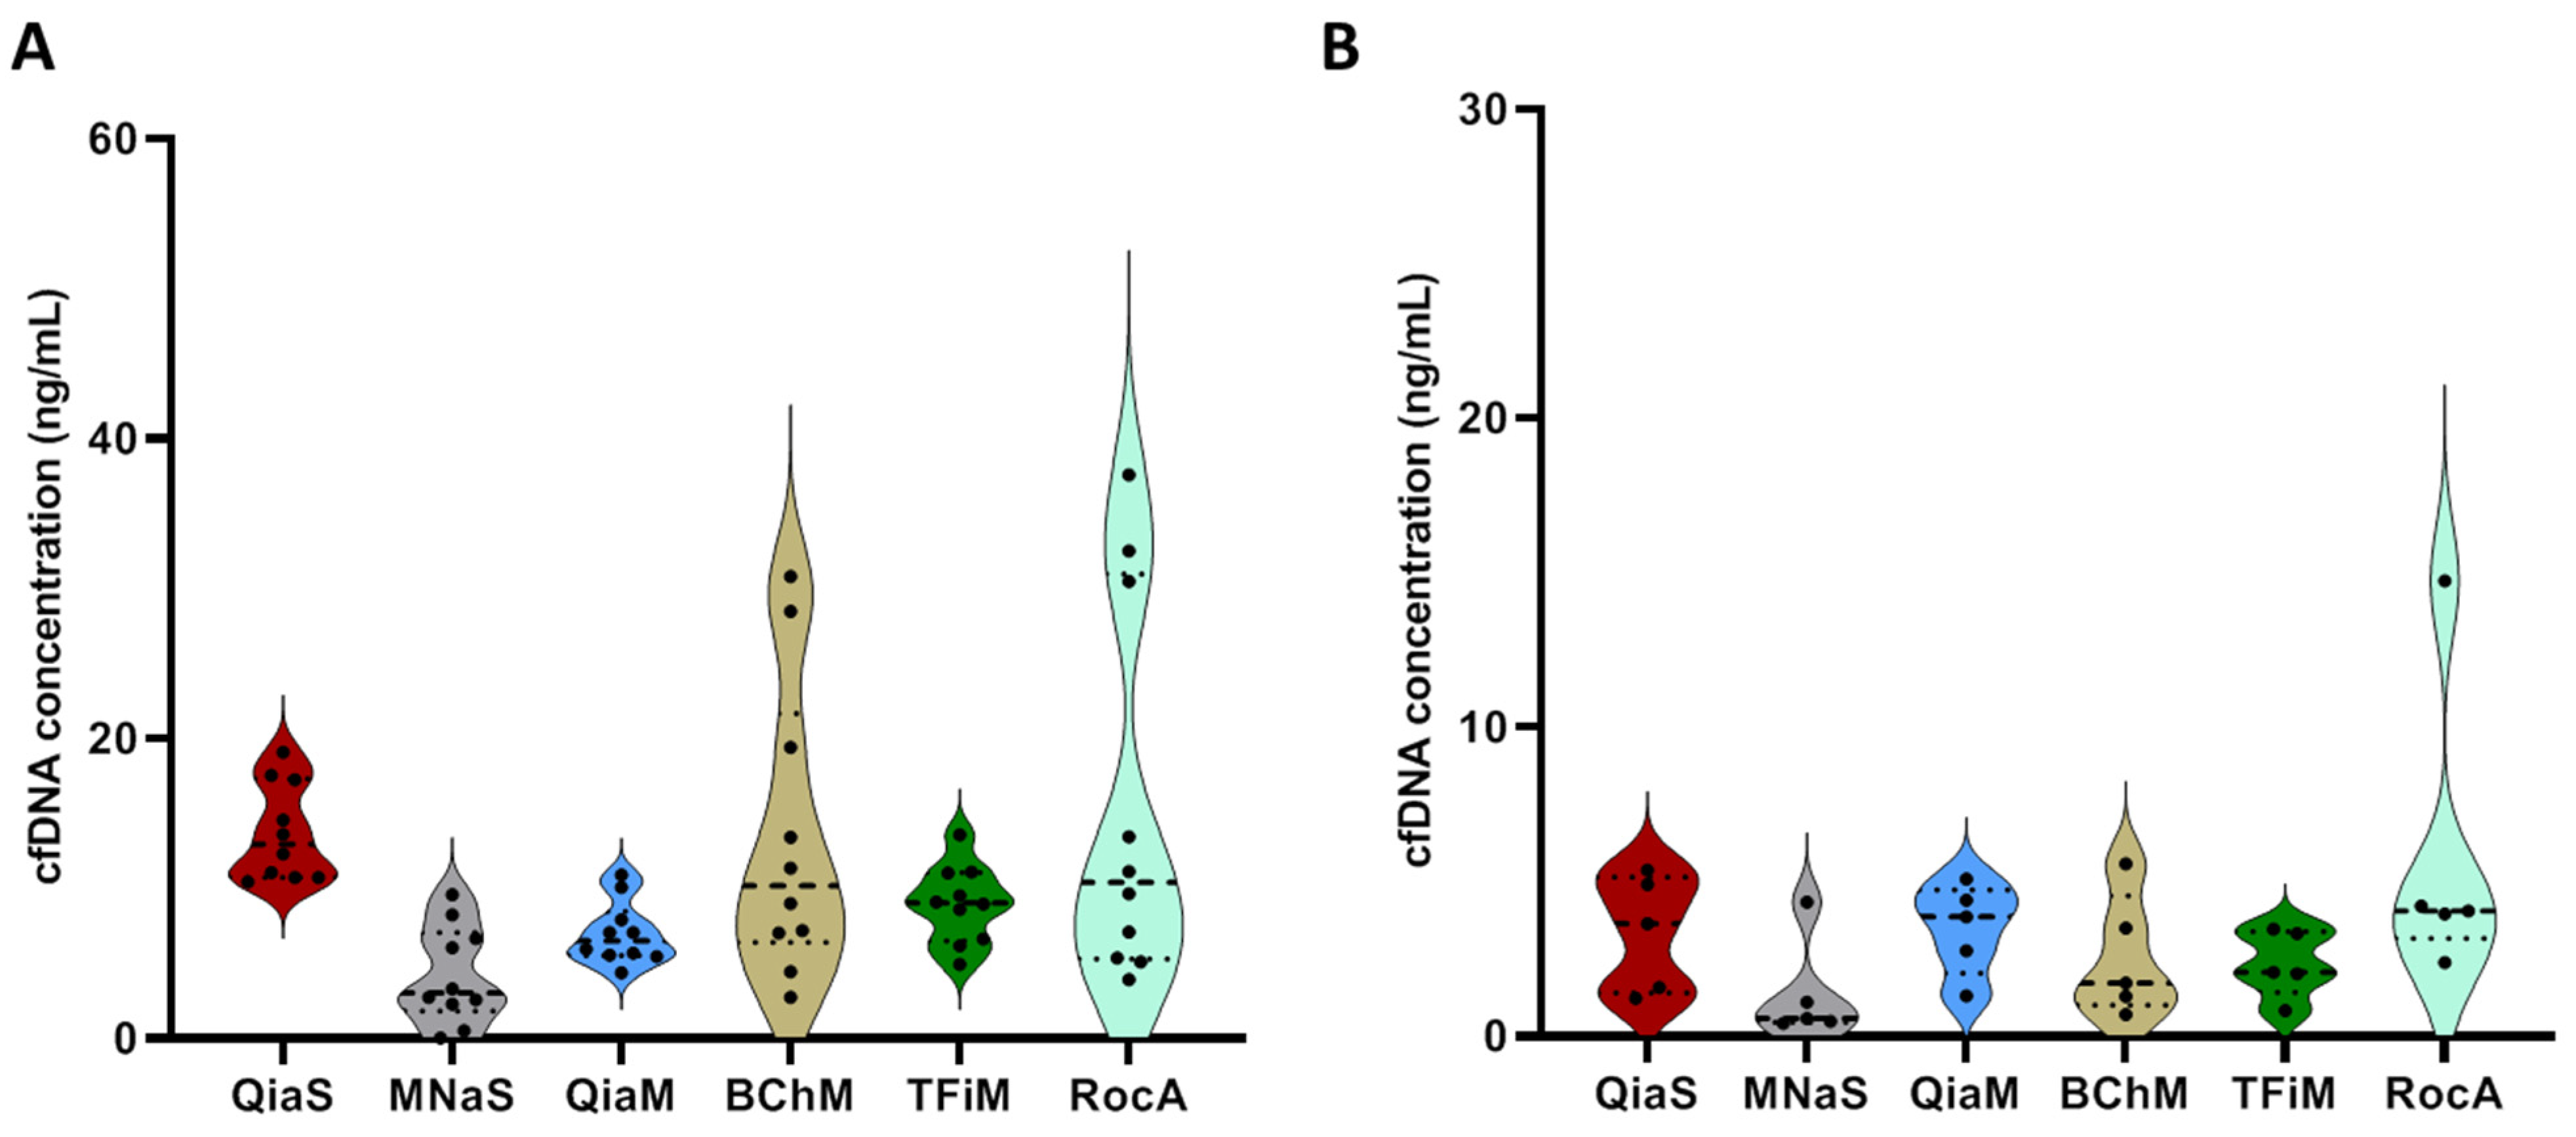
| Kit | Code | Median Conc. (ng/mL) | CV% Range | Median CV% |
|---|---|---|---|---|
| QIAamp Circulating Nucleic Acid Kit | QiaS | 13.0 | 8.3–21.9 | 11.8 |
| NucleoSpin Plasma XS | MNaS | 3.0 | 3.1–64.8 | 16.2 |
| QIAmp MinElute ccfDNA Mini Kit | QiaM | 6.5 | 5.3–29.6 | 20.0 |
| cfPure Cell-Free DNA Extraction Kit | BChM | 10.2 | 3.5–52.4 | 34.6 |
| MagMAX Cell-Free DNA Isolation Kit | TFiM | 9.0 | 2.9–75.2 | 21.5 |
| MagNA Pure 24 Total NA Isolation Kit | RocA | 10.4 | 3.2–44.4 | 16.0 |
Publisher’s Note: MDPI stays neutral with regard to jurisdictional claims in published maps and institutional affiliations. |
© 2022 by the authors. Licensee MDPI, Basel, Switzerland. This article is an open access article distributed under the terms and conditions of the Creative Commons Attribution (CC BY) license (https://creativecommons.org/licenses/by/4.0/).
Share and Cite
Polatoglou, E.; Mayer, Z.; Ungerer, V.; Bronkhorst, A.J.; Holdenrieder, S. Isolation and Quantification of Plasma Cell-Free DNA Using Different Manual and Automated Methods. Diagnostics 2022, 12, 2550. https://doi.org/10.3390/diagnostics12102550
Polatoglou E, Mayer Z, Ungerer V, Bronkhorst AJ, Holdenrieder S. Isolation and Quantification of Plasma Cell-Free DNA Using Different Manual and Automated Methods. Diagnostics. 2022; 12(10):2550. https://doi.org/10.3390/diagnostics12102550
Chicago/Turabian StylePolatoglou, Eleni, Zsuzsanna Mayer, Vida Ungerer, Abel J. Bronkhorst, and Stefan Holdenrieder. 2022. "Isolation and Quantification of Plasma Cell-Free DNA Using Different Manual and Automated Methods" Diagnostics 12, no. 10: 2550. https://doi.org/10.3390/diagnostics12102550