
The Effect of Submaximal Exercise on Jugular Venous Pulse Assessed by a Wearable Cervical Plethysmography System

 ,
,  , , and
Abstract
:1. Introduction
2. Materials and Methods
- Age from 18 to 30 years.
- BMI < 28 kg·m−2.
- Good health condition.
- Use of supplement affecting venous volume.
- Postural defects.
- Sport professionalism.
2.1. Experimental Activity
- Supine for 2 min: laying down on a bed, breathing normally.
- Standing still for 2 min: standing distributing the body load equally on the 2 feet, breathing normally.
- Leg-press 6-repetition maximum (6-RM): the 6-RM test techniques was performed according to the recommendation from the American College of Sports Medicine (ACMS) guidelines for exercise testing and prescription [16,17,18]. The subject warmed up, completing a number of submaximal repetitions. The 6-RM load was determined selecting an initial weight that is within the ~50–70% individual perceived capacity. Load is progressively increased by 5–10% until the subject was able to complete the 6th repetition but not over. Once the ideal load was identified, the subject was invited to perform 3 sets of 6-RM with and interval of 30 s in between the series.
- 2 km walking test: the test followed the description made by Oja et al. [19]. Initially, a 5-min warm-up was performed, with the aim to achieve the maximum comfortable speed on treadmill that the participants were able to maintain for 2 km, by rating of perceived exertion 13–14 (Borg 0–20) [20]. The duration of the test varied from a minimum of 17 to a maximum of 21.5 min. Two experienced exercise physiologists supervised all the exercise tests and sessions.
2.2. Wearable Cervical Plethysmography System
2.3. Data Processing
2.4. Statistical Analysis
3. Results
4. Discussion
5. Conclusions
Author Contributions
Funding
Institutional Review Board Statement
Informed Consent Statement
Data Availability Statement
Conflicts of Interest
References
- Drazner, M.H.; Rame, J.E.; Stevenson, L.W.; Dries, D.L. Prognostic importance of elevated jugular venous pressure and a third heart sound in patients with heart failure. N. Engl. J. Med. 2001, 345, 574–581. [Google Scholar] [CrossRef]
- Lipton, B. Estimation of central venous pressure by ultrasound of the internal jugular vein. Am. J. Emerg. Med. 2000, 18, 432–434. [Google Scholar] [CrossRef] [PubMed] [Green Version]
- Sisini, F.; Tessari, M.; Gadda, G.; Di Domenico, G.; Taibi, A.; Menegatti, E.; Gambaccini, M.; Zamboni, P. An ultrasonographic technique to assess the jugular venous pulse: A proof of concept. Ultrasound Med. Biol. 2015, 41, 1334–1341. [Google Scholar] [CrossRef] [PubMed]
- Amelard, R.; Hughson, R.L.; Greaves, D.K.; Pfisterer, K.J.; Leung, J.; Clausi, D.A.; Wong, A. Non-contact hemodynamic imaging reveals the jugular venous pulse waveform. Sci. Rep. 2017, 9, 40150. [Google Scholar] [CrossRef] [PubMed]
- Taibi, A.; Gadda, G.; Gambaccini, M.; Menegatti, E.; Sisini, F.; Zamboni, P. Investigation of cerebral venous outflow in microgravity. Physiol. Meas. 2017, 38, 1939–1952. [Google Scholar] [CrossRef]
- Garcia-Lopez, I.; Rodriguez-Villegas, E. Extracting the Jugular Venous Pulse from Anterior Neck Contact Photoplethysmography. Sci. Rep. 2020, 10, 3466. [Google Scholar] [CrossRef] [Green Version]
- Zamboni, P.; Malagoni, A.M.; Menegatti, E.; Ragazzi, R.; Tavoni, V.; Tessari, M.; Beggs, C.B. Central venous pressure estimation from ultrasound assessment of the jugular venous pulse. PLoS ONE 2020, 15, e0240057. [Google Scholar] [CrossRef]
- Zamboni, P.; Sisini, F.; Menegatti, E.; Taibi, A.; Gadda, G.; Tavoni, V.; Malagoni, A.M.; Tessari, M.; Gianesini, S.; Gambaccini, M. Ultrasound Monitoring of Jugular Venous Pulse during Space Missions: Proof of Concept. Ultrasound Med. Biol. 2018, 44, 726–733. [Google Scholar] [CrossRef]
- Du, J.; Cui, J.; Yang, J.; Wang, P.; Zhang, L.; Luo, B.; Han, B. Alterations in Cerebral Hemodynamics During Microgravity: A Literature Review. Med. Sci. Monit. 2021, 27, e928108. [Google Scholar] [CrossRef]
- Jirak, P.; Mirna, M.; Rezar, R.; Motloch, L.J.; Lichtenauer, M.; Jordan, J.; Binneboessel, S.; Tank, J.; Limper, U.; Jung, C. How spaceflight challenges human cardiovascular health. Eur. J. Prev. Cardiol. 2022, 29, 1399–1411. [Google Scholar] [CrossRef]
- Proto, A.; Conti, D.; Menegatti, E.; Taibi, A.; Gadda, G. Plethysmography System to Monitor the Jugular Venous Pulse: A Feasibility Study. Diagnostics 2021, 11, 2390. [Google Scholar] [CrossRef]
- Hellsten, Y.; Nyberg, M. Cardiovascular Adaptations to Exercise Training. Compr. Physiol. 2015, 6, 1–32. [Google Scholar] [CrossRef] [PubMed]
- Ide, K.; Secher, N.H. Cerebral blood flow and metabolism during exercise. Prog. Neurobiol. 2000, 61, 397–414. [Google Scholar] [CrossRef]
- Sato, K.; Oba, N.; Washio, T.; Sasaki, H.; Oue, A.; Otsuki, A.; Sadamoto, T.; Ogoh, S. Relationship between cerebral arterial inflow and venous outflow during dynamic supine exercise. Physiol. Rep. 2017, 5, e13292. [Google Scholar] [CrossRef] [PubMed]
- Kasai, K.; Kawasaki, T.; Hashimoto, S.; Inami, S.; Shindo, A.; Shiraishi, H.; Matoba, S. Response of Jugular Venous Pressure to Exercise in Patients with Heart Failure and Its Prognostic Usefulness. Am. J. Cardiol. 2020, 125, 1524–1528. [Google Scholar] [CrossRef] [PubMed]
- Dohoney, P.; Chromiak, J.A.; Lemire, D.; Abadie, B.R.; Kovacs, C. Prediction of one repetition maximum (1-RM) strength from a 4-6 RM and a 7-10 RM submaximal strength test in healthy young adult males. JEP Online 2002, 5, 54–59. [Google Scholar]
- Reynolds, J.M.; Gordon, T.J.; Robergs, R.A. Prediction of one repetition maximum strength from multiple repetition maximum testing and anthropometry. J. Strength. Cond. Res. 2006, 20, 584–592. [Google Scholar] [CrossRef] [PubMed] [Green Version]
- Dumke, L.C. Health-related physical fitness testing and prescription. In ACMS’s Guidelines for Exercise Testing and Prescription, 10th ed.; Riebe, D., Ehrman, J.K., Liguori, G., Magal, M., Eds.; Wolters Kluwer: Philadelphia, PA, USA, 2018; pp. 94–101. [Google Scholar]
- Oja, P.; Laukkanen, R.; Pasanen, M.; Tyry, T.; Vuori, I. A 2-km walking test for assessing the cardiorespiratory fitness of healthy adults. Int. J. Sports Med. 1991, 12, 356–362. [Google Scholar] [CrossRef] [PubMed]
- Chen, M.J.; Fan, X.; Moe, S.T. Criterion-related validity of the Borg ratings of perceived exertion scale in healthy individuals: A meta-analysis. J. Sports Sci. 2002, 20, 873–899. [Google Scholar] [CrossRef] [PubMed]
- Pelizzari, L.; Laganà, M.M.; Jakimovski, D.; Bergsland, N.; Hagemeier, J.; Baselli, G.; Zivadinov, R. Neck Vessel Cross-Sectional Area Measured with MRI: Scan-Rescan Reproducibility for Longitudinal Evaluations. J. Neuroimaging 2018, 28, 48–56. [Google Scholar] [CrossRef] [PubMed] [Green Version]
- Zlebic, C.; Ivanisevic, N.; Kisic, M.; Blaz, N.; Menicanin, A.; Zivanov, L.; Damnjanovic, M. Comparison of resistive and capacitive strain gauge sensors printed on polyimide substrate using ink-jet printing technology. In Proceedings of the 29th International Conference on Microelectronics, MIEL 2014, Belgrade, Serbia, 12–14 May 2014. [Google Scholar]
- Proto, A.; Bibbo, D.; Conforto, S.; Schmid, M. A new microcontroller-based system to optimize the digital conversion of signals originating from load cells built-in into pedals. In Proceedings of the 10th IEEE Biomedical Circuits and Systems Conference, BioCAS 2014, Lausanne, Switzerland, 22–24 October 2014. [Google Scholar]
- Krizea, M.; Gialelis, J.; Protopsaltis, G.; Mountzouris, C.; Theodorou, G. Empowering People with a User-Friendly Wearable Platform for Unobtrusive Monitoring of Vital Physiological Parameters. Sensors 2022, 22, 5226. [Google Scholar] [CrossRef] [PubMed]
- Elgendi, M.; Liang, Y.; Ward, R. Toward Generating More Diagnostic Features from Photoplethysmogram Waveforms. Diseases 2018, 6, 20. [Google Scholar] [CrossRef] [PubMed] [Green Version]
- Georgieva-Tsaneva, G.; Gospodinova, E.; Cheshmedzhiev, K. Cardiodiagnostics Based on Photoplethysmographic Signals. Diagnostics 2022, 12, 412. [Google Scholar] [CrossRef]
- Applefeld, M.M. The jugular venous pressure and pulse contour. In Clinical Methods: The History, Physical, and Laboratory Examinations; Walker, H.K., Hall, W.D., Hurst, J.W., Eds.; Butterworth: Boston, MA, USA, 1990. [Google Scholar]
- Chua Chiaco, J.M.; Parikh, N.I.; Fergusson, D.J. The jugular venous pressure revisited. Cleve. Clin. J. Med. 2013, 80, 638–644. [Google Scholar] [CrossRef] [PubMed] [Green Version]
- Peter, L.; Proto, A.; Cerny, M. Investigation of a possibility of ECG and PPG common measurement. In World Congress on Medical Physics and Biomedical Engineering 2018; Springer: Singapore, 2019; Volume 68, pp. 851–855. [Google Scholar] [CrossRef]
- Sisini, F. Physical description of the blood flow from the internal jugular vein to the right atrium of the heart: New ultrasound application perspectives. arXiv 2016, arXiv:1604.05171. [Google Scholar]
- Gisolf, J.; van Lieshout, J.J.; van Heusden, K.; Pott, F.; Stok, W.J.; Karemaker, J.M. Human cerebral venous outflow pathway depends on posture and central venous pressure. J. Physiol. 2004, 560, 317–327. [Google Scholar] [CrossRef]
- Zamboni, P.; Menegatti, E.; Conforti, P.; Shepherd, S.; Tessari, M.; Beggs, C. Assessment of cerebral venous return by a novel plethysmography method. J. Vasc. Surg. 2012, 56, 677–685. [Google Scholar] [CrossRef] [Green Version]
- Valdueza, J.M.; von Munster, T.; Hoffman, O.; Schreiber, S.; Einhaupl, K.M. Postural dependency of the cerebral venous outflow. Lancet 2000, 355, 200–201. [Google Scholar] [CrossRef]
- Proto, A.; Peter, P.; Cerny, M.; Penhaker, M.; Bibbo, D.; Conforto, S.; Schmid, M. Human Body Energy Harvesting Solutions for Wearable Technologies. In Proceedings of the IEEE 20th International Conference on e-Health Networking, Applications and Services, Healthcom 2018, Ostrava, Czech Republic, 17–20 September 2018. [Google Scholar]
- Padmanabhan, M.; Yuan, P.; Chada, G.; Nguyen, H.V. Physician-Friendly Machine Learning: A Case Study with Cardiovascular Disease Risk Prediction. J. Clin. Med. 2019, 8, 1050. [Google Scholar] [CrossRef] [Green Version]
- Vescio, B.; Nisticò, R.; Augimeri, A.; Quattrone, A.; Crasà, M.; Quattrone, A. Development and Validation of a New Wearable Mobile Device for the Automated Detection of Resting Tremor in Parkinson’s Disease and Essential Tremor. Diagnostics 2021, 11, 200. [Google Scholar] [CrossRef]
- Aich, S.; Youn, J.; Chakraborty, S.; Pradhan, P.M.; Park, J.H.; Park, S.; Park, J. A Supervised Machine Learning Approach to Detect the On/Off State in Parkinson’s Disease Using Wearable Based Gait Signals. Diagnostics 2020, 10, 421. [Google Scholar] [CrossRef] [PubMed]
- Record, J.D.; Ziegelstein, R.C.; Christmas, C.; Rand, C.S.; Hanyok, L.A. Delivering Personalized Care at a Distance: How Telemedicine Can Foster Getting to Know the Patient as a Person. J. Pers. Med. 2021, 11, 137. [Google Scholar] [CrossRef] [PubMed]
- Vashist, S.K.; Schneider, E.M.; Luong, J.H. Commercial Smartphone-Based Devices and Smart Applications for Personalized Healthcare Monitoring and Management. Diagnostics 2014, 4, 104–128. [Google Scholar] [CrossRef]
- El-Rashidy, N.; El-Sappagh, S.; Islam, S.M.R.; El-Bakry, H.M.; Abdelrazek, S. Mobile Health in Remote Patient Monitoring for Chronic Diseases: Principles, Trends, and Challenges. Diagnostics 2021, 11, 607. [Google Scholar] [CrossRef] [PubMed]
- Capalbo, I.; Penhaker, M.; Peter, L.; Proto, A. Consumer perceptions on smart wearable devices for medical and wellness purposes. In Proceedings of the IEEE Technology and Engineering Management Conference, TEMSCON 2019, Atlanta, GA, USA, 12–14 June 2019. [Google Scholar]


| JVP Parameter | Supine: Mean ± σ | Standing: Mean ± σ | Leg Press: Mean ± σ | Walking: Mean ± σ | p-Value: |
|---|---|---|---|---|---|
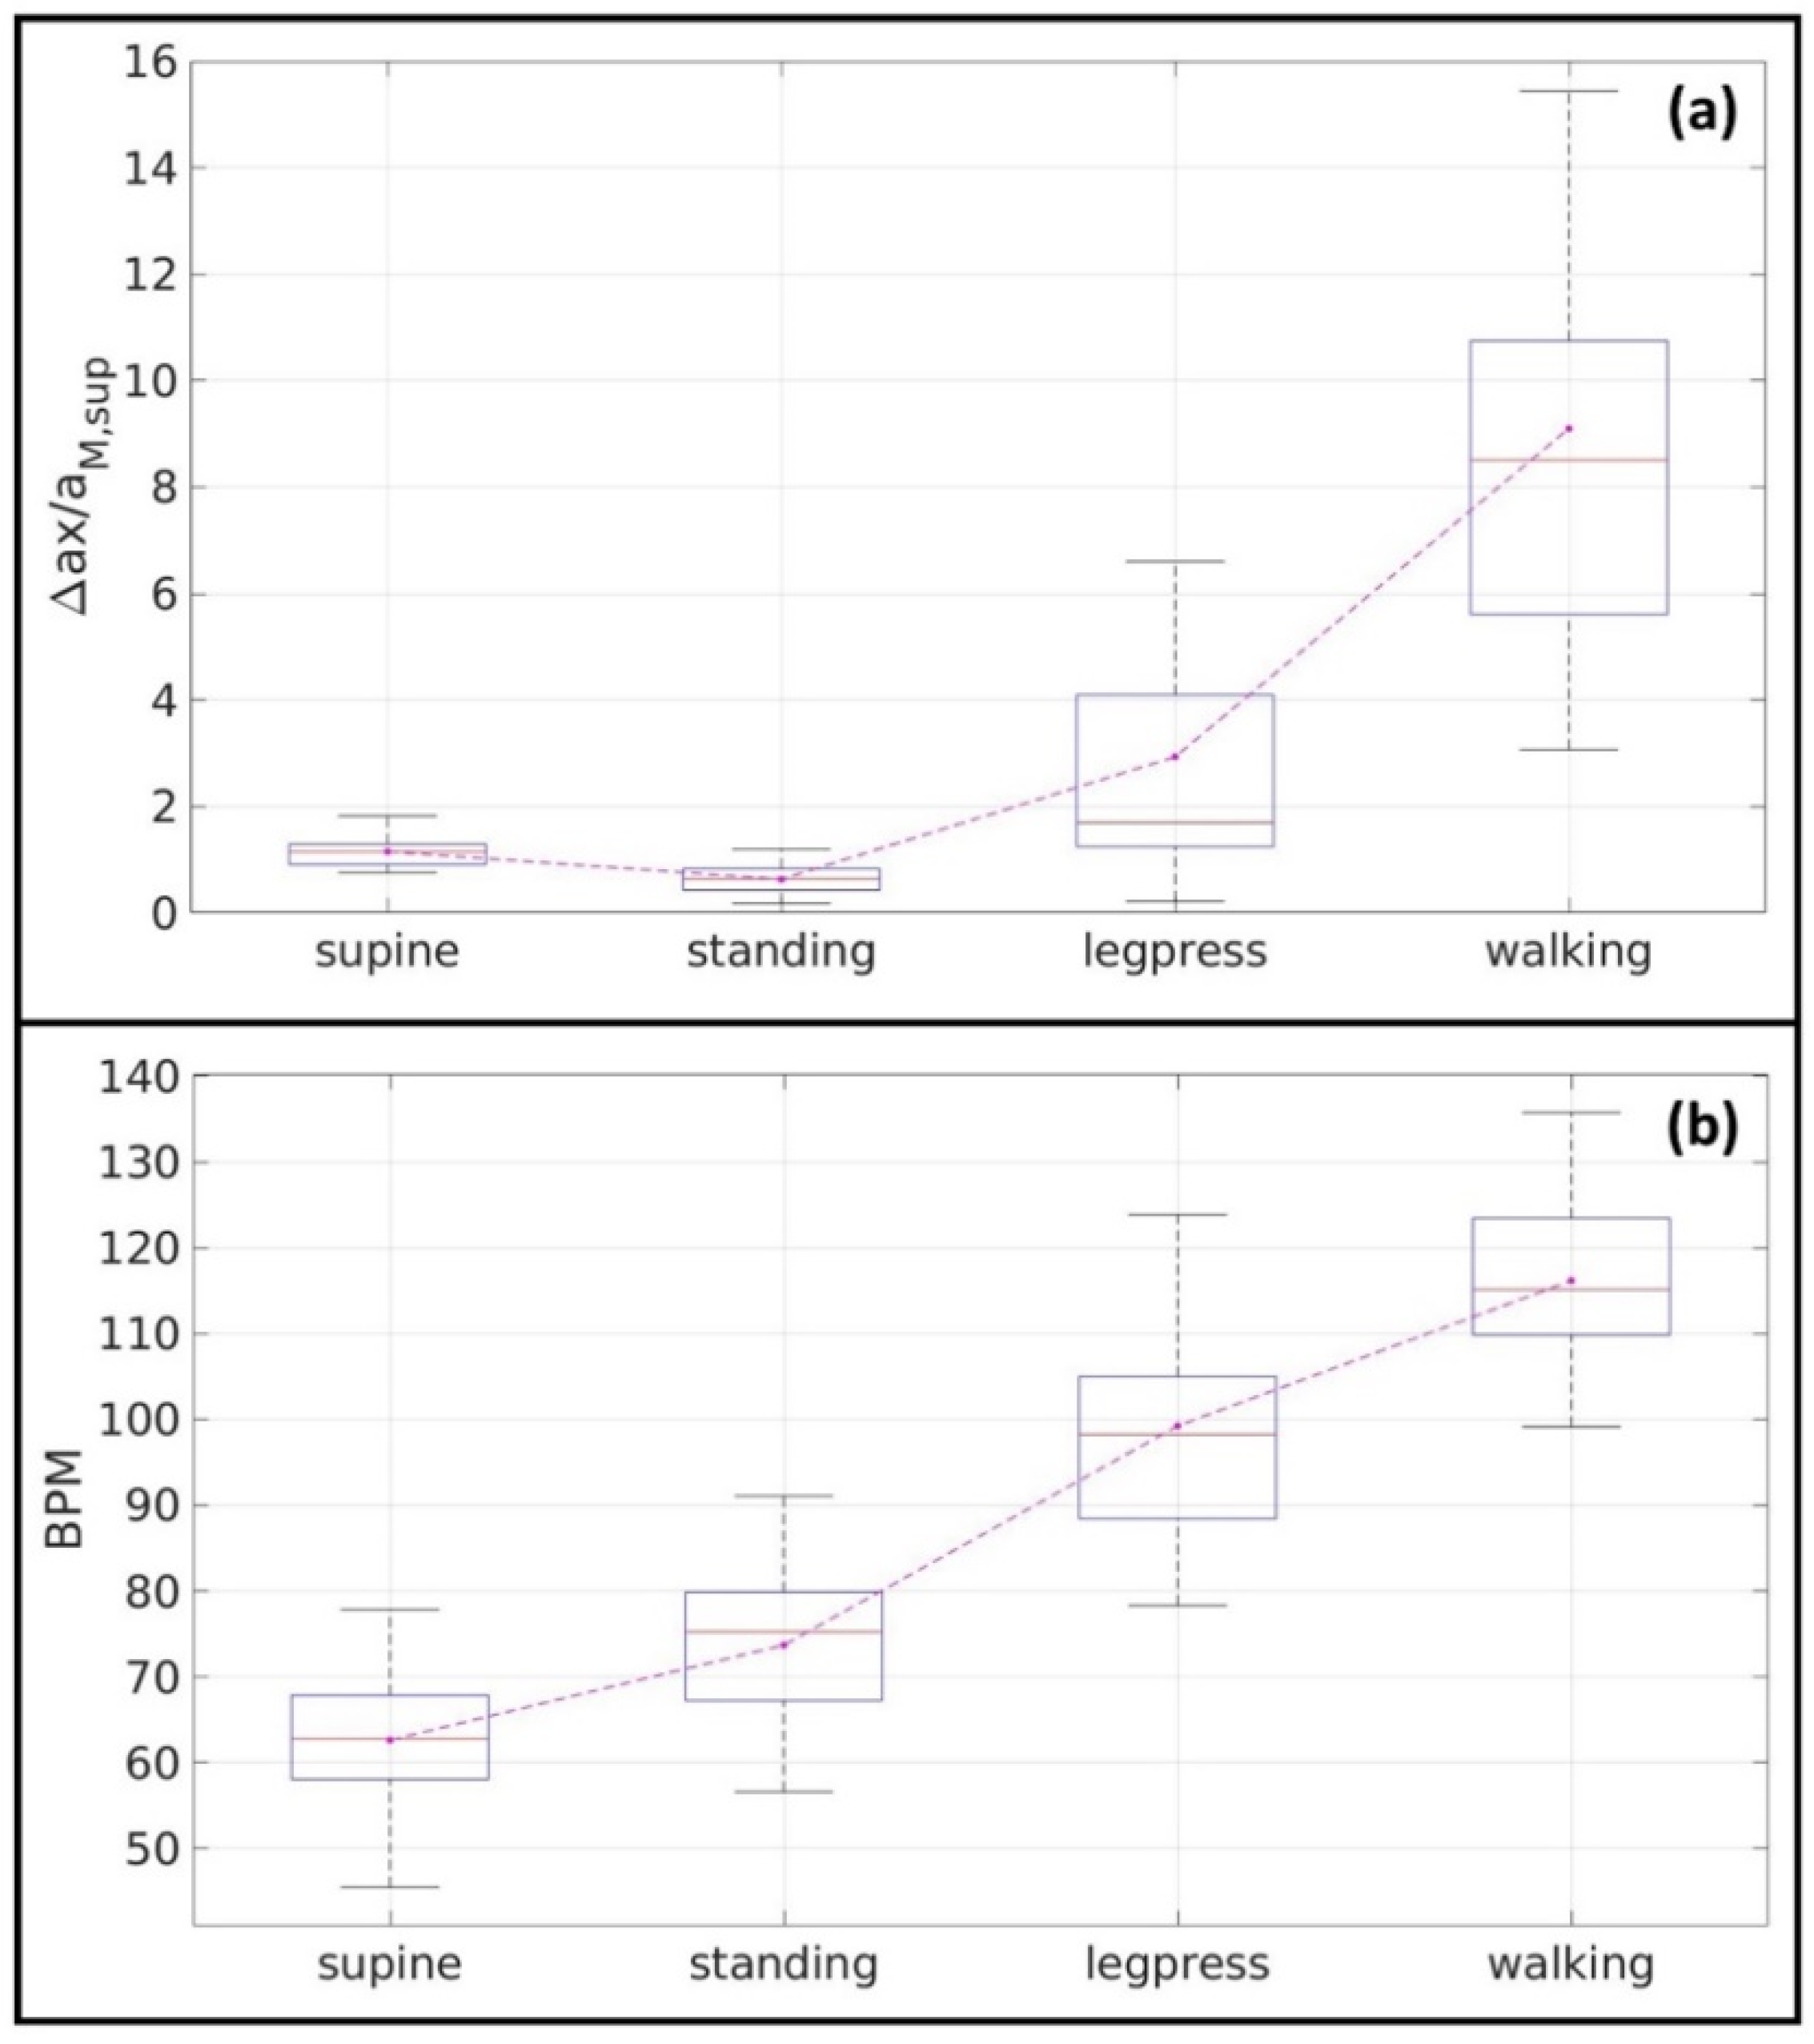
| 0.5 ± 0.1 | 0.3 ± 0.1 | 1.3 ± 1.2 | 4.7 ± 2.8 | 0.0001 | |
| −0.6 ± 0.2 | −0.3±0.1 | −1.6 ± 1.5 | −4.3 ± 2.3 | 0.0001 | |
| 1.1 ± 0.3 | 0.6± 0.2 | 2.9 ± 2.6 | 9.1 ± 5.1 | 0.0001 | |
| heartbeat rate (BPM) | 63 ± 9 | 74 ± 10 | 99 ± 12 | 116 ± 10 | 0.0001 |
Publisher’s Note: MDPI stays neutral with regard to jurisdictional claims in published maps and institutional affiliations. |
© 2022 by the authors. Licensee MDPI, Basel, Switzerland. This article is an open access article distributed under the terms and conditions of the Creative Commons Attribution (CC BY) license (https://creativecommons.org/licenses/by/4.0/).
Share and Cite
Menegatti, E.; Proto, A.; Paternò, G.; Gadda, G.; Gianesini, S.; Raisi, A.; Pagani, A.; Piva, T.; Zerbini, V.; Mazzoni, G.; et al. The Effect of Submaximal Exercise on Jugular Venous Pulse Assessed by a Wearable Cervical Plethysmography System. Diagnostics 2022, 12, 2407. https://doi.org/10.3390/diagnostics12102407
Menegatti E, Proto A, Paternò G, Gadda G, Gianesini S, Raisi A, Pagani A, Piva T, Zerbini V, Mazzoni G, et al. The Effect of Submaximal Exercise on Jugular Venous Pulse Assessed by a Wearable Cervical Plethysmography System. Diagnostics. 2022; 12(10):2407. https://doi.org/10.3390/diagnostics12102407
Chicago/Turabian StyleMenegatti, Erica, Antonino Proto, Gianfranco Paternò, Giacomo Gadda, Sergio Gianesini, Andrea Raisi, Anselmo Pagani, Tommaso Piva, Valentina Zerbini, Gianni Mazzoni, and et al. 2022. "The Effect of Submaximal Exercise on Jugular Venous Pulse Assessed by a Wearable Cervical Plethysmography System" Diagnostics 12, no. 10: 2407. https://doi.org/10.3390/diagnostics12102407