
Systemic Inflammatory Biomarkers and Chest CT Findings as Predictors of Acute Limb Ischemia Risk, Intensive Care Unit Admission, and Mortality in COVID-19 Patients
 ,
,
Abstract
:1. Introduction
2. Materials and Methods
2.1. Study Design
2.2. Data Collection
2.3. Systemic Inflammatory Markers
2.4. Acute Limb Ischemia Diagnosis
2.5. Chest CT Findings
2.6. Study Outcomes
2.7. Statistical Analysis
3. Results
3.1. Baseline Characteristics of All Patients, Classified According to the ALI Risk
3.2. Baseline Characteristics of All Patients, Classified by Mortality Risk
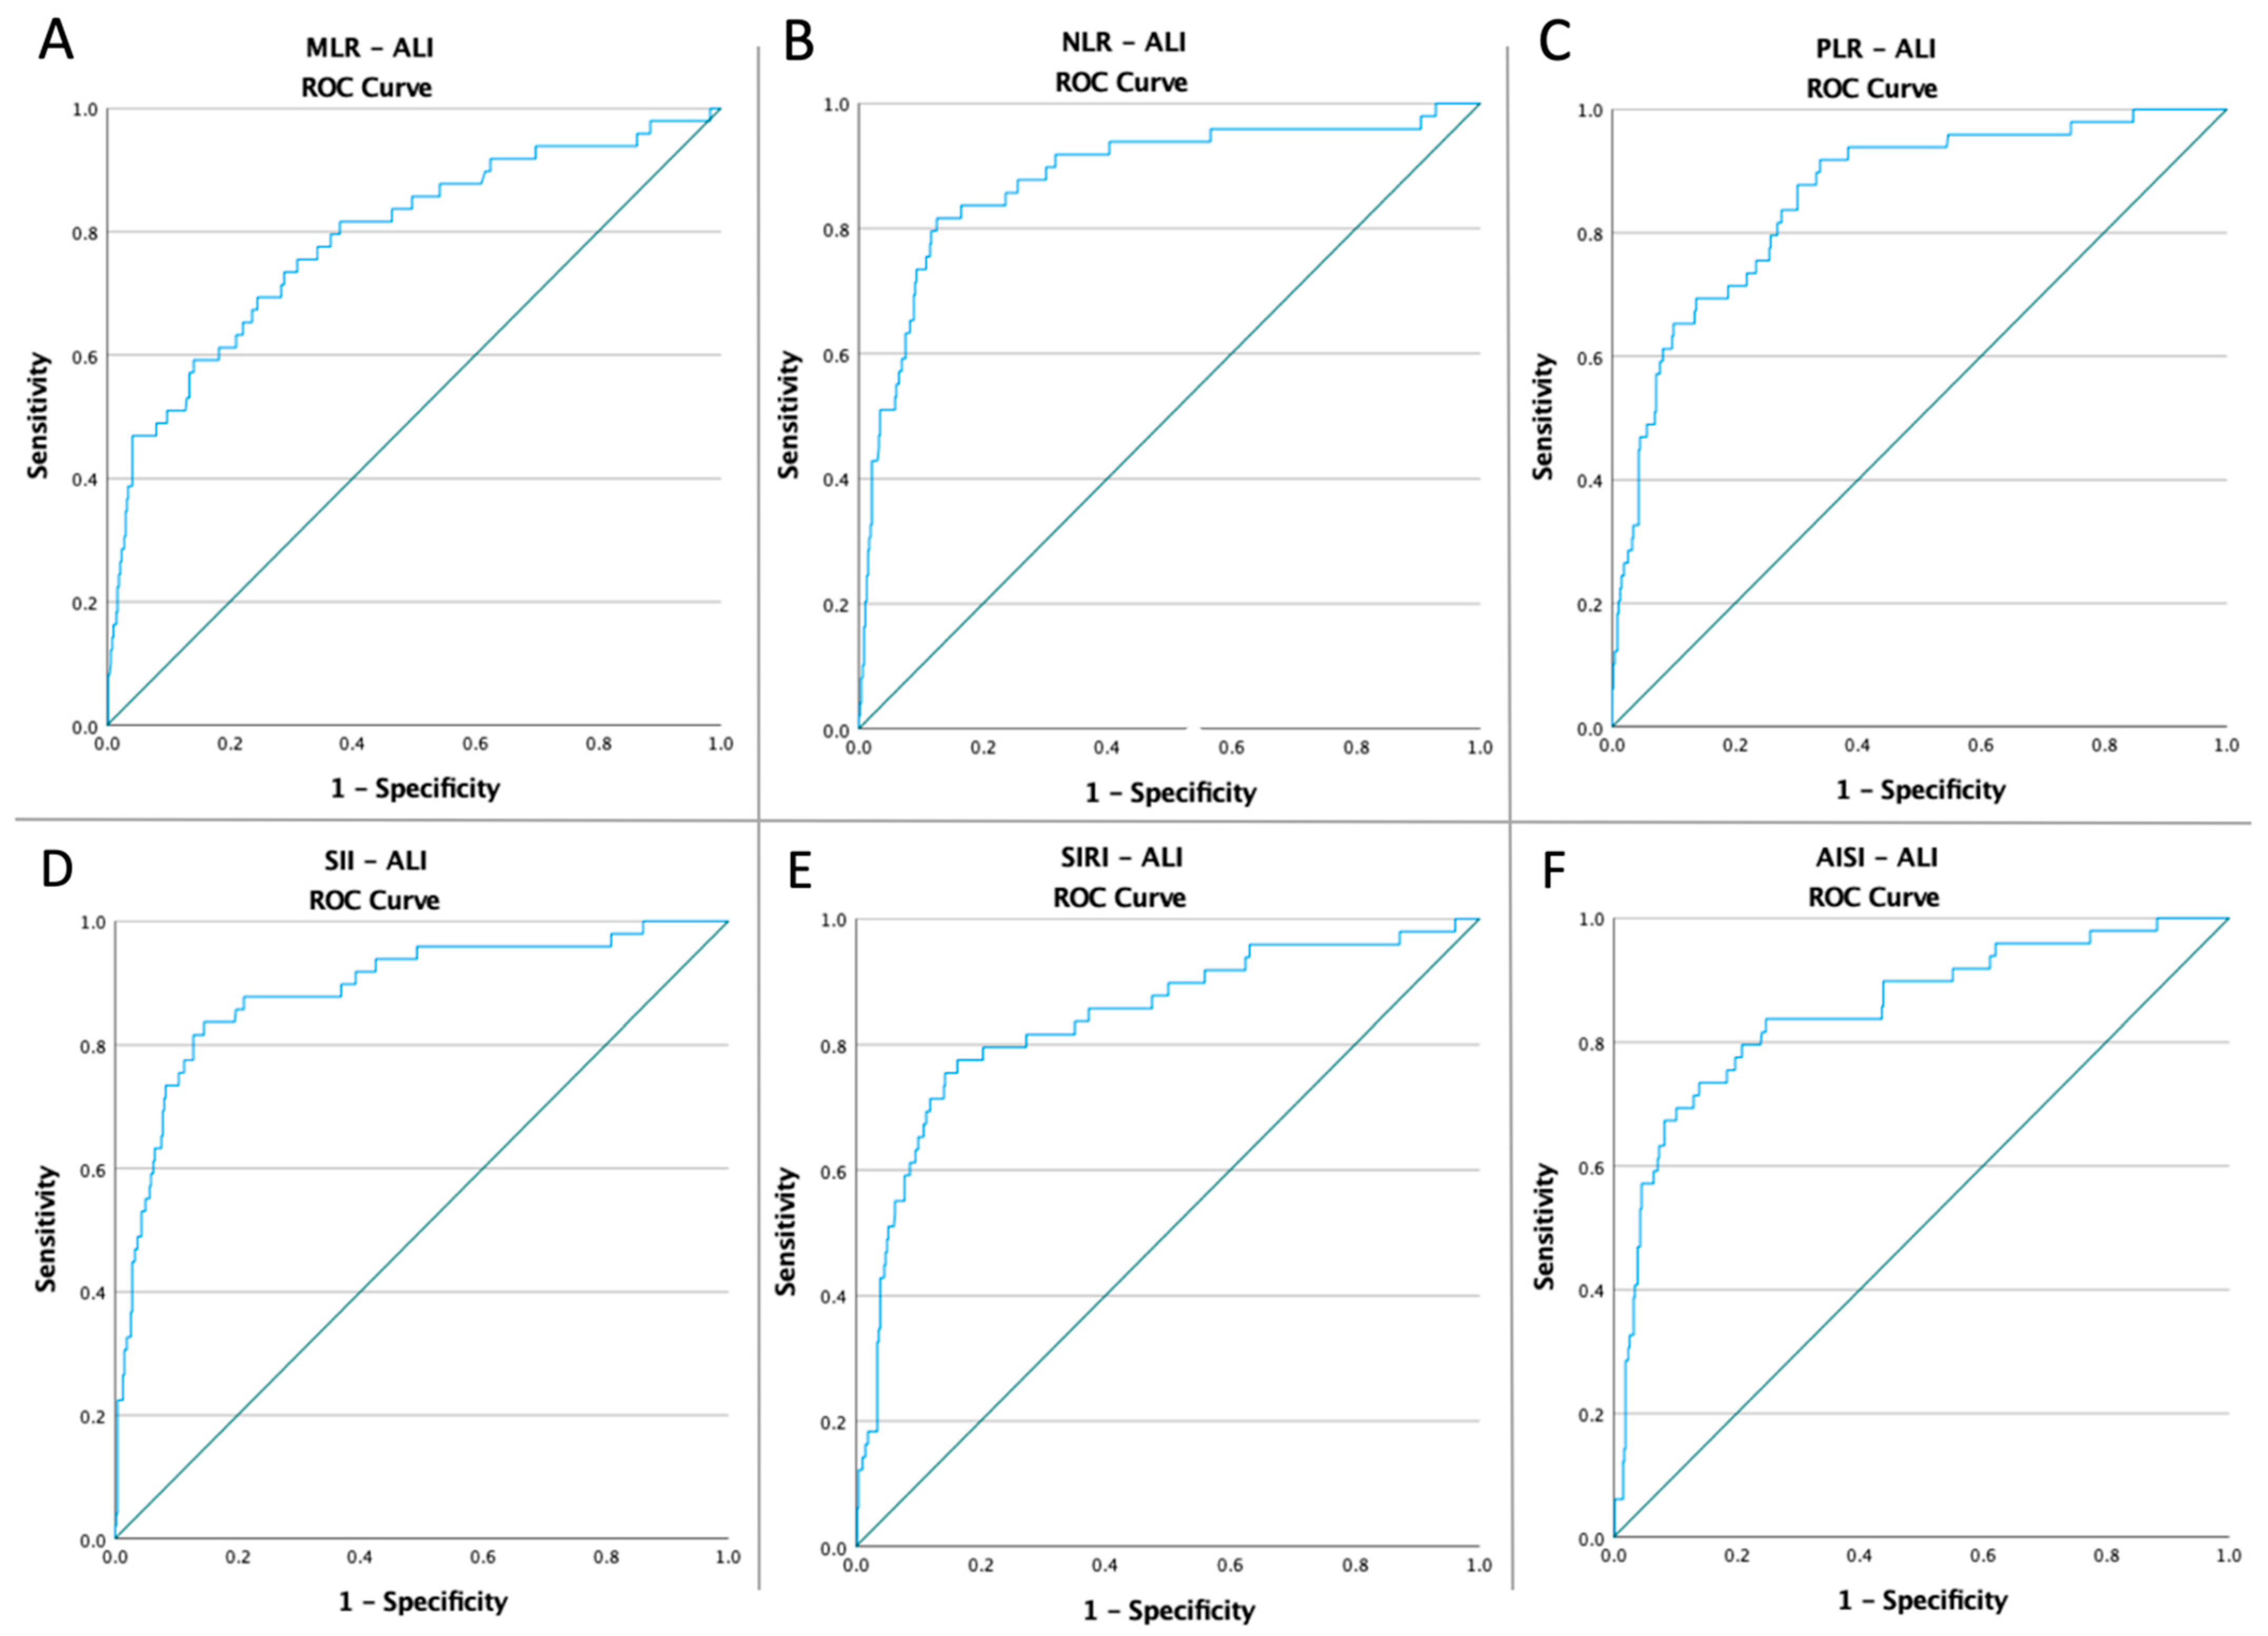
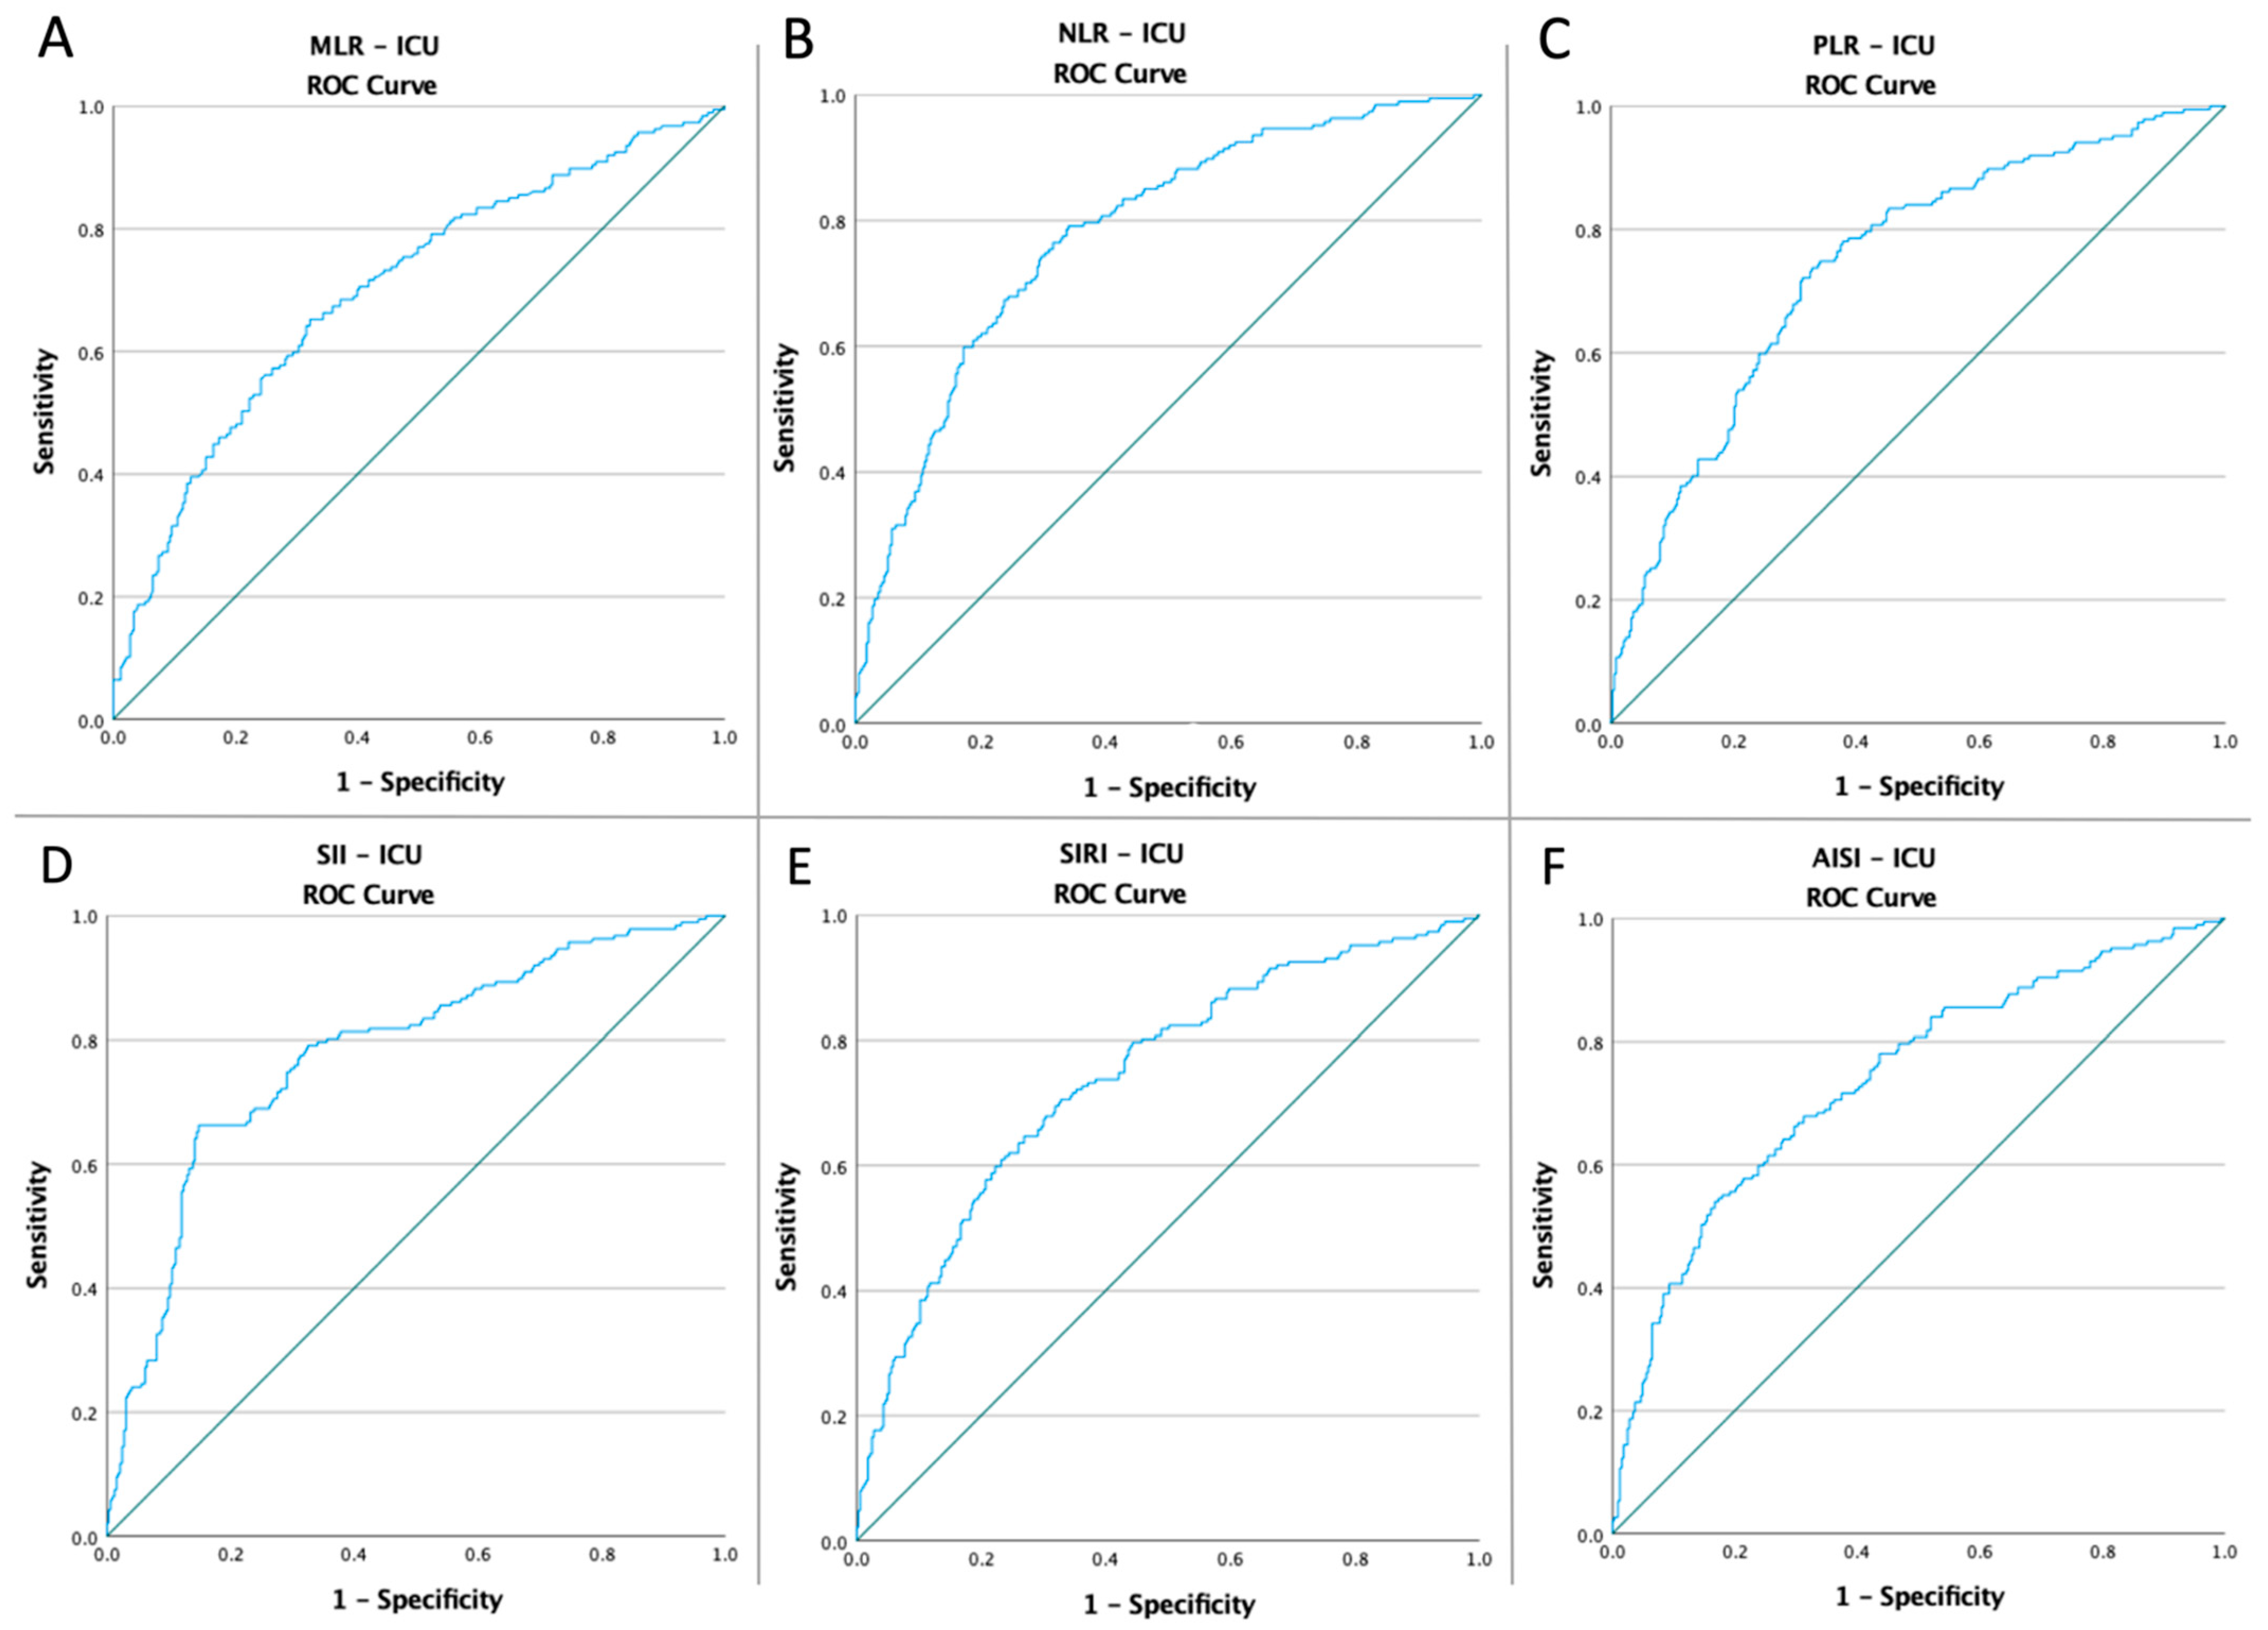
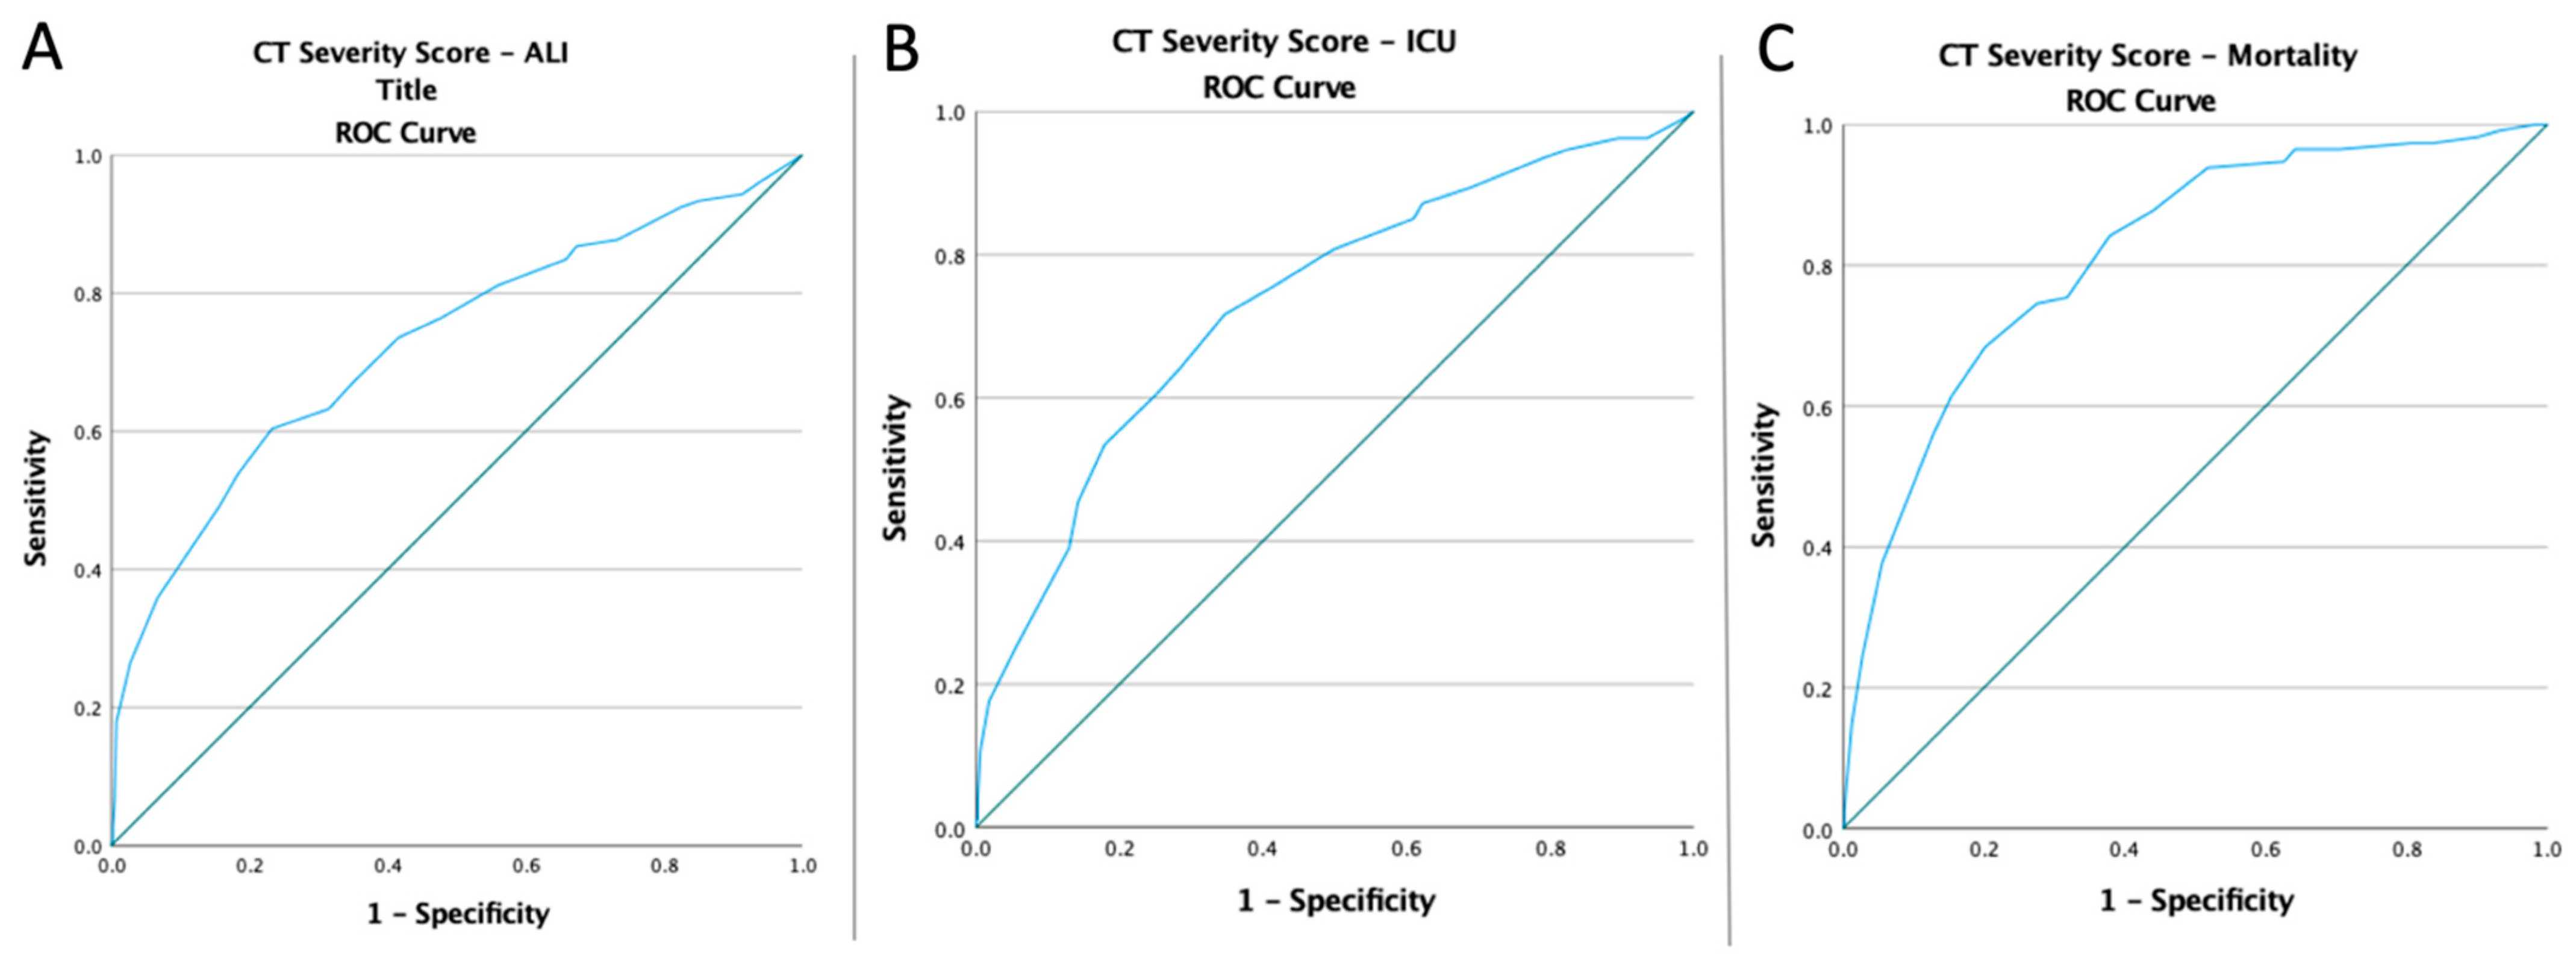
3.3. ROC Curves, Optimal Cut-Off Values, AUC, Predictive Accuracy of Inflammatory Markers, and CT Severity Score
3.4. Univariate and Multivariate Analyses of Inflammatory Biomarkers, the Chest CT Severity Score, and Adverse Events in All Patients
3.5. Baseline Characteristics and Multivariate analysis of ALI Patients, Divided According to the Mortality Risk
4. Discussion
5. Conclusions
Author Contributions
Funding
Institutional Review Board Statement
Informed Consent Statement
Acknowledgments
Conflicts of Interest
References
- COVID Live—Coronavirus Statistics—Worldometer. Available online: https://www.worldometers.info/coronavirus/ (accessed on 26 August 2022).
- Mureșan, A.V.; Russu, E.; Arbănași, E.M.; Kaller, R.; Hosu, I.; Arbănași, E.M.; Voidăzan, S.T. Negative Impact of the COVID-19 Pandemic on Kidney Disease Management—A Single-Center Experience in Romania. J. Clin. Med. 2022, 11, 2452. [Google Scholar] [CrossRef] [PubMed]
- Muresan, A.V.; Russu, E.; Arbanasi, E.M.; Kaller, R.; Voidăzan, S.T.; Arbanasi, E.M. Impact of COVID-19 Pandemic on Vascular Surgery Unit Activity in Central Romania. Front. Surg. 2022. [Google Scholar] [CrossRef]
- Zaim, S.; Chong, J.H.; Sankaranarayanan, V.; Harky, A. COVID-19 and Multiorgan Response. Curr. Probl. Cardiol. 2020, 45, 100618. [Google Scholar] [CrossRef] [PubMed]
- Rodrigues, T.S.; de Sá, K.S.G.; Ishimoto, A.Y.; Becerra, A.; Oliveira, S.; Almeida, L.; Gonçalves, A.V.; Perucello, D.B.; Andrade, W.A.; Castro, R.; et al. Inflammasomes Are Activated in Response to SARS-CoV-2 Infection and Are Associated with COVID-19 Severity in Patients. J. Exp. Med. 2020, 218, e20201707. [Google Scholar] [CrossRef]
- Li, J.; Huang, D.Q.; Zou, B.; Yang, H.; Hui, W.Z.; Rui, F.; Yee, N.T.S.; Liu, C.; Nerurkar, S.N.; Kai, J.C.Y.; et al. Epidemiology of COVID-19: A Systematic Review and Meta-Analysis of Clinical Characteristics, Risk Factors, and Outcomes. J. Med. Virol. 2021, 93, 1449–1458. [Google Scholar] [CrossRef]
- Petrilli, C.M.; Jones, S.A.; Yang, J.; Rajagopalan, H.; O’Donnell, L.; Chernyak, Y.; Tobin, K.A.; Cerfolio, R.J.; Francois, F.; Horwitz, L.I. Factors Associated with Hospital Admission and Critical Illness among 5279 People with Coronavirus Disease 2019 in New York City: Prospective Cohort Study. BMJ 2020, 369, m1966. [Google Scholar] [CrossRef]
- Gao, Y.; Ding, M.; Dong, X.; Zhang, J.; Kursat Azkur, A.; Azkur, D.; Gan, H.; Sun, Y.; Fu, W.; Li, W.; et al. Risk Factors for Severe and Critically Ill COVID-19 Patients: A Review. Allergy 2021, 76, 428–455. [Google Scholar] [CrossRef]
- Guan, W.-J.; Ni, Z.-Y.; Hu, Y.; Liang, W.-H.; Ou, C.-Q.; He, J.-X.; Liu, L.; Shan, H.; Lei, C.-L.; Hui, D.S.C.; et al. Clinical Characteristics of Coronavirus Disease 2019 in China. N. Engl. J. Med. 2020, 382, 1708–1720. [Google Scholar] [CrossRef]
- Alhazzani, W.; Evans, L.; Alshamsi, F.; Moller, M.H.; Ostermann, M.; Prescott, H.C.; Arabi, Y.M.; Loeb, M.; Ng Gong, M.; Fan, E.; et al. Surviving Sepsis Campaign Guidelines on the Management of Adults With Coronavirus Disease 2019 (COVID-19) in the ICU: First Update. Crit. Care Med. 2021, 49, e219–e234. [Google Scholar] [CrossRef]
- Glavinic, R.; Marcic, L.; Dumancic, S.; Pavicic Ivelja, M.; Jeličić, I.; Kalibovic Govorko, D.; Medvedec Mikić, I. Acute Arterial Thrombosis of Lower Extremities in COVID-19 Patients. J. Clin. Med. 2022, 11, 1538. [Google Scholar] [CrossRef]
- Strazzulla, A.; Abroug Ben Halima, S.; Chouchane, I.; Rezek, M.; Pinto Stiebler, M.; Hamrouni, S.; Maalaoui, M.; Ghriss, N.; Guedec-Ghelfi, R.; Moini, C.; et al. The Predictive Value of Cell Blood Count Parameters to Diagnose Pulmonary Embolism in Patients with SARS-CoV-2 Infection: A Case Control Study. Antibiotics 2022, 11, 60. [Google Scholar] [CrossRef] [PubMed]
- Seo, J.-W.; Kim, D.-Y.; Yun, N.; Kim, D.-M. Coronavirus Disease 2019-Associated Coagulopathy. Microorganisms 2022, 10, 1556. [Google Scholar] [CrossRef] [PubMed]
- Spiezia, L.; Boscolo, A.; Poletto, F.; Cerruti, L.; Tiberio, I.; Campello, E.; Navalesi, P.; Simioni, P. COVID-19-Related Severe Hypercoagulability in Patients Admitted to Intensive Care Unit for Acute Respiratory Failure. Thromb. Haemost. 2020, 120, 998–1000. [Google Scholar] [CrossRef] [PubMed]
- Lippi, G.; Favaloro, E.J. D-Dimer Is Associated with Severity of Coronavirus Disease 2019: A Pooled Analysis. Thromb. Haemost. 2020, 120, 876–878. [Google Scholar] [CrossRef] [PubMed]
- Henry, B.M.; de Oliveira, M.H.S.; Benoit, S.; Plebani, M.; Lippi, G. Hematologic, Biochemical and Immune Biomarker Abnormalities Associated with Severe Illness and Mortality in Coronavirus Disease 2019 (COVID-19): A Meta-Analysis. Clin. Chem. Lab. Med. CCLM 2020, 58, 1021–1028. [Google Scholar] [CrossRef]
- Veerasuri, S.; Kulkarni, S.R.; Wilson, W.R.; Paravastu, S.C.V. Bilateral Acute Lower Limb Ischemia Secondary to COVID-19. Vasc. Endovasc. Surg. 2021, 55, 196–199. [Google Scholar] [CrossRef]
- Jenner, W.J.; Gorog, D.A. Incidence of Thrombotic Complications in COVID-19. J. Thromb. Thrombolysis 2021, 52, 999–1006. [Google Scholar] [CrossRef]
- Middeldorp, S.; Coppens, M.; van Haaps, T.F.; Foppen, M.; Vlaar, A.P.; Müller, M.C.A.; Bouman, C.C.S.; Beenen, L.F.M.; Kootte, R.S.; Heijmans, J.; et al. Incidence of Venous Thromboembolism in Hospitalized Patients with COVID-19. J. Thromb. Haemost. 2020, 18, 1995–2002. [Google Scholar] [CrossRef]
- Llitjos, J.-F.; Leclerc, M.; Chochois, C.; Monsallier, J.-M.; Ramakers, M.; Auvray, M.; Merouani, K. High Incidence of Venous Thromboembolic Events in Anticoagulated Severe COVID-19 Patients. J. Thromb. Haemost. 2020, 18, 1743–1746. [Google Scholar] [CrossRef]
- Connors, J.M.; Levy, J.H. COVID-19 and Its Implications for Thrombosis and Anticoagulation. Blood 2020, 135, 2033–2040. [Google Scholar] [CrossRef]
- Thachil, J.; Tang, N.; Gando, S.; Falanga, A.; Cattaneo, M.; Levi, M.; Clark, C.; Iba, T. ISTH Interim Guidance on Recognition and Management of Coagulopathy in COVID-19. J. Thromb. Haemost. 2020, 18, 1023–1026. [Google Scholar] [CrossRef] [PubMed]
- Lee, S.G.; Fralick, M.; Sholzberg, M. Coagulopathy Associated with COVID-19. CMAJ 2020, 192, E583. [Google Scholar] [CrossRef] [PubMed]
- Ranucci, M.; Ballotta, A.; Di Dedda, U.; Baryshnikova, E.; Dei Poli, M.; Resta, M.; Falco, M.; Albano, G.; Menicanti, L. The Procoagulant Pattern of Patients with COVID-19 Acute Respiratory Distress Syndrome. J. Thromb. Haemost. 2020, 18, 1747–1751. [Google Scholar] [CrossRef] [PubMed]
- Cipolloni, L.; Sessa, F.; Bertozzi, G.; Baldari, B.; Cantatore, S.; Testi, R.; D’Errico, S.; Di Mizio, G.; Asmundo, A.; Castorina, S.; et al. Preliminary Post-Mortem COVID-19 Evidence of Endothelial Injury and Factor VIII Hyperexpression. Diagnostics 2020, 10, 575. [Google Scholar] [CrossRef] [PubMed]
- Maier, C.L.; Truong, A.D.; Auld, S.C.; Polly, D.M.; Tanksley, C.-L.; Duncan, A. COVID-19-Associated Hyperviscosity: A Link between Inflammation and Thrombophilia? Lancet 2020, 395, 1758–1759. [Google Scholar] [CrossRef]
- Björck, M.; Earnshaw, J.J.; Acosta, S.; Bastos Gonçalves, F.; Cochennec, F.; Debus, E.S.; Hinchliffe, R.; Jongkind, V.; Koelemay, M.J.W.; Menyhei, G.; et al. Editor’s Choice—European Society for Vascular Surgery (ESVS) 2020 Clinical Practice Guidelines on the Management of Acute Limb Ischaemia. Eur. J. Vasc. Endovasc. Surg. 2020, 59, 173–218. [Google Scholar] [CrossRef]
- Creager, M.A.; Kaufman, J.A.; Conte, M.S. Acute Limb Ischemia. N. Engl. J. Med. 2012, 366, 2198–2206. [Google Scholar] [CrossRef]
- Eliason, J.L.; Wainess, R.M.; Proctor, M.C.; Dimick, J.B.; Cowan, J.A.; Upchurch, G.R.; Stanley, J.C.; Henke, P.K. A National and Single Institutional Experience in the Contemporary Treatment of Acute Lower Extremity Ischemia. Ann. Surg. 2003, 238, 382–389. [Google Scholar] [CrossRef]
- Earnshaw, J.J.; Whitman, B.; Foy, C. National Audit of Thrombolysis for Acute Leg Ischemia (NATALI): Clinical Factors Associated with Early Outcome. J. Vasc. Surg. 2004, 39, 1018–1025. [Google Scholar] [CrossRef]
- Seyit, M.; Avci, E.; Nar, R.; Senol, H.; Yilmaz, A.; Ozen, M.; Oskay, A.; Aybek, H. Neutrophil to Lymphocyte Ratio, Lymphocyte to Monocyte Ratio and Platelet to Lymphocyte Ratio to Predict the Severity of COVID-19. Am. J. Emerg. Med. 2021, 40, 110–114. [Google Scholar] [CrossRef]
- Rose, J.; Suter, F.; Furrer, E.; Sendoel, A.; Stüssi-Helbling, M.; Huber, L.C. Neutrophile-to-Lymphocyte Ratio (NLR) Identifies Patients with Coronavirus Infectious Disease 2019 (COVID-19) at High Risk for Deterioration and Mortality—A Retrospective, Monocentric Cohort Study. Diagnostics 2022, 12, 1109. [Google Scholar] [CrossRef] [PubMed]
- Sarkar, S.; Kannan, S.; Khanna, P.; Singh, A.K. Role of Platelet-to-Lymphocyte Count Ratio (PLR), as a Prognostic Indicator in COVID-19: A Systematic Review and Meta-Analysis. J. Med. Virol. 2022, 94, 211–221. [Google Scholar] [CrossRef] [PubMed]
- Regolo, M.; Vaccaro, M.; Sorce, A.; Stancanelli, B.; Colaci, M.; Natoli, G.; Russo, M.; Alessandria, I.; Motta, M.; Santangelo, N.; et al. Neutrophil-to-Lymphocyte Ratio (NLR) Is a Promising Predictor of Mortality and Admission to Intensive Care Unit of COVID-19 Patients. J. Clin. Med. 2022, 11, 2235. [Google Scholar] [CrossRef]
- Moisa, E.; Corneci, D.; Negoita, S.; Filimon, C.R.; Serbu, A.; Negutu, M.I.; Grintescu, I.M. Dynamic Changes of the Neutrophil-to-Lymphocyte Ratio, Systemic Inflammation Index, and Derived Neutrophil-to-Lymphocyte Ratio Independently Predict Invasive Mechanical Ventilation Need and Death in Critically Ill COVID-19 Patients. Biomedicines 2021, 9, 1656. [Google Scholar] [CrossRef] [PubMed]
- Citu, C.; Gorun, F.; Motoc, A.; Sas, I.; Gorun, O.M.; Burlea, B.; Tuta-Sas, I.; Tomescu, L.; Neamtu, R.; Malita, D.; et al. The Predictive Role of NLR, d-NLR, MLR, and SIRI in COVID-19 Mortality. Diagnostics 2022, 12, 122. [Google Scholar] [CrossRef] [PubMed]
- Fois, A.G.; Paliogiannis, P.; Scano, V.; Cau, S.; Babudieri, S.; Perra, R.; Ruzzittu, G.; Zinellu, E.; Pirina, P.; Carru, C.; et al. The Systemic Inflammation Index on Admission Predicts In-Hospital Mortality in COVID-19 Patients. Molecules 2020, 25, 5725. [Google Scholar] [CrossRef]
- Gawaz, M.; Langer, H.; May, A.E. Platelets in Inflammation and Atherogenesis. J. Clin. Investig. 2005, 115, 3378–3384. [Google Scholar] [CrossRef]
- Drugescu, A.; Roca, M.; Zota, I.M.; Costache, A.-D.; Gavril, O.I.; Gavril, R.S.; Vasilcu, T.F.; Mitu, O.; Esanu, I.M.; Roca, I.-C.; et al. Value of the Neutrophil to Lymphocyte Ratio and Platelet to Lymphocyte Ratio in Predicting CPET Performance in Patients with Stable CAD and Recent Elective PCI. Med. Kaunas Lith. 2022, 58, 814. [Google Scholar] [CrossRef]
- Kurtul, A.; Yarlioglues, M.; Murat, S.N.; Ergun, G.; Duran, M.; Kasapkara, H.A.; Demircelik, M.B.; Cetin, M.; Ocek, A.H. Usefulness of the Platelet-to-Lymphocyte Ratio in Predicting Angiographic Reflow after Primary Percutaneous Coronary Intervention in Patients with Acute ST-Segment Elevation Myocardial Infarction. Am. J. Cardiol. 2014, 114, 342–347. [Google Scholar] [CrossRef]
- Arbănași, E.M.; Mureșan, A.V.; Coșarcă, C.M.; Kaller, R.; Bud, T.I.; Hosu, I.; Voidăzan, S.T.; Arbănași, E.M.; Russu, E. Neutrophil-to-Lymphocyte Ratio and Platelet-to-Lymphocyte Ratio Impact on Predicting Outcomes in Patients with Acute Limb Ischemia. Life 2022, 12, 822. [Google Scholar] [CrossRef]
- Taşoğlu, I.; Çiçek, O.F.; Lafcı, G.; Kadiroğulları, E.; Sert, D.E.; Demir, A.; Cavus, U.; Colak, N.; Songur, M.; Hodo, B. Usefulness of Neutrophil/Lymphocyte Ratio as a Predictor of Amputation after Embolectomy for Acute Limb Ischemia. Ann. Vasc. Surg. 2014, 28, 606–613. [Google Scholar] [CrossRef]
- Russu, E.; Mureșan, A.V.; Arbănași, E.M.; Kaller, R.; Hosu, I.; Voidăzan, S.; Arbănași, E.M.; Coșarcă, C.M. The Predictive Role of NLR and PLR in Outcome and Patency of Lower Limb Revascularization in Patients with Femoropopliteal Disease. J. Clin. Med. 2022, 11, 2620. [Google Scholar] [CrossRef]
- Mureșan, A.V.; Russu, E.; Arbănași, E.M.; Kaller, R.; Hosu, I.; Arbănași, E.M.; Voidăzan, S.T. The Predictive Value of NLR, MLR, and PLR in the Outcome of End-Stage Kidney Disease Patients. Biomedicines 2022, 10, 1272. [Google Scholar] [CrossRef]
- Altunoren, O.; Akkus, G.; Sezal, D.T.; Ciftcioglu, M.; Guzel, F.B.; Isiktas, S.; Torun, G.I.; Uyan, M.; Sokmen, M.F.; Sevim, H.A.; et al. Does Neutrophyl to Lymphocyte Ratio Really Predict Chronic Kidney Disease Progression? Int. Urol. Nephrol. 2019, 51, 129–137. [Google Scholar] [CrossRef]
- Qi, Q.; Zhuang, L.; Shen, Y.; Geng, Y.; Yu, S.; Chen, H.; Liu, L.; Meng, Z.; Wang, P.; Chen, Z. A Novel Systemic Inflammation Response Index (SIRI) for Predicting the Survival of Patients with Pancreatic Cancer after Chemotherapy. Cancer 2016, 122, 2158–2167. [Google Scholar] [CrossRef]
- Li, S.; Yang, Z.; Du, H.; Zhang, W.; Che, G.; Liu, L. Novel Systemic Inflammation Response Index to Predict Prognosis after Thoracoscopic Lung Cancer Surgery: A Propensity Score-Matching Study. ANZ J. Surg. 2019, 89, E507–E513. [Google Scholar] [CrossRef]
- Shen, Y.-J.; Qian, L.-Q.; Ding, Z.-P.; Luo, Q.-Q.; Zhao, H.; Xia, W.-Y.; Fu, Y.-Y.; Feng, W.; Zhang, Q.; Yu, W.; et al. Prognostic Value of Inflammatory Biomarkers in Patients With Stage I Lung Adenocarcinoma Treated With Surgical Dissection. Front. Oncol. 2021, 11, 711206. [Google Scholar] [CrossRef]
- Rutherford, R.B.; Baker, J.D.; Ernst, C.; Johnston, K.W.; Porter, J.M.; Ahn, S.; Jones, D.N. Recommended Standards for Reports Dealing with Lower Extremity Ischemia: Revised Version. J. Vasc. Surg. 1997, 26, 517–538. [Google Scholar] [CrossRef]
- Saeed, G.A.; Gaba, W.; Shah, A.; Al Helali, A.A.; Raidullah, E.; Al Ali, A.B.; Elghazali, M.; Ahmed, D.Y.; Al Kaabi, S.G.; Almazrouei, S. Correlation between Chest CT Severity Scores and the Clinical Parameters of Adult Patients with COVID-19 Pneumonia. Radiol. Res. Pract. 2021, 2021, e6697677. [Google Scholar] [CrossRef]
- Lieveld, A.W.E.; Azijli, K.; Teunissen, B.P.; van Haaften, R.M.; Kootte, R.S.; van den Berk, I.A.H.; van der Horst, S.F.B.; de Gans, C.; van de Ven, P.M.; Nanayakkara, P.W.B. Chest CT in COVID-19 at the ED: Validation of the COVID-19 Reporting and Data System (CO-RADS) and CT Severity Score: A Prospective, Multicenter, Observational Study. Chest 2021, 159, 1126–1135. [Google Scholar] [CrossRef]
- Wang, R.; He, M.; Yin, W.; Liao, X.; Wang, B.; Jin, X.; Ma, Y.; Yue, J.; Bai, L.; Liu, D.; et al. The Prognostic Nutritional Index Is Associated with Mortality of COVID-19 Patients in Wuhan, China. J. Clin. Lab. Anal. 2020, 34, e23566. [Google Scholar] [CrossRef] [PubMed]
- Simon, P.; Le Borgne, P.; Lefevbre, F.; Cipolat, L.; Remillon, A.; Dib, C.; Hoffmann, M.; Gardeur, I.; Sabah, J.; Kepka, S.; et al. Platelet-to-Lymphocyte Ratio (PLR) Is Not a Predicting Marker of Severity but of Mortality in COVID-19 Patients Admitted to the Emergency Department: A Retrospective Multicenter Study. J. Clin. Med. 2022, 11, 4903. [Google Scholar] [CrossRef] [PubMed]
- Magro, C.; Mulvey, J.J.; Berlin, D.; Nuovo, G.; Salvatore, S.; Harp, J.; Baxter-Stoltzfus, A.; Laurence, J. Complement Associated Microvascular Injury and Thrombosis in the Pathogenesis of Severe COVID-19 Infection: A Report of Five Cases. Transl. Res. J. Lab. Clin. Med. 2020, 220, 1–13. [Google Scholar] [CrossRef] [PubMed]
- Cheruiyot, I.; Kipkorir, V.; Ngure, B.; Misiani, M.; Munguti, J.; Ogeng’o, J. Arterial Thrombosis in Coronavirus Disease 2019 Patients: A Rapid Systematic Review. Ann. Vasc. Surg. 2021, 70, 273–281. [Google Scholar] [CrossRef]
- Roncati, L.; Manenti, A.; Manco, G.; Farinetti, A.; Mattioli, A.V. COVID-19 Thromboembolic Complications: Deepening Immunoinflammatory Features. J. Vasc. Surg. 2021, 74, 1048–1049. [Google Scholar] [CrossRef] [PubMed]
- Roncati, L.; Manenti, A.; Farinetti, A.; Manco, G.; Mattioli, A.V. Toward a Unified Pathophysiology in COVID-19 Acute Aortopathies. J. Vasc. Surg. 2021, 74, 1771–1772. [Google Scholar] [CrossRef] [PubMed]
- Roncati, L.; Ligabue, G.; Fabbiani, L.; Malagoli, C.; Gallo, G.; Lusenti, B.; Nasillo, V.; Manenti, A.; Maiorana, A. Type 3 Hypersensitivity in COVID-19 Vasculitis. Clin. Immunol. Orlando Fla 2020, 217, 108487. [Google Scholar] [CrossRef]
- Pasqui, E.; de Donato, G.; Giannace, G.; Panzano, C.; Alba, G.; Cappelli, A.; Setacci, C.; Palasciano, G. The Relation between Neutrophil/Lymphocyte and Platelet/Lymphocyte Ratios with Mortality and Limb Amputation after Acute Limb Ischaemia. Vascular 2022, 30, 267–275. [Google Scholar] [CrossRef]
- Gary, T.; Pichler, M.; Belaj, K.; Hafner, F.; Gerger, A.; Froehlich, H.; Eller, P.; Pilger, E.; Brodmann, M. Neutrophil-to-Lymphocyte Ratio and Its Association with Critical Limb Ischemia in PAOD Patients. PLoS ONE 2013, 8, e56745. [Google Scholar] [CrossRef]
- Gary, T.; Pichler, M.; Belaj, K.; Hafner, F.; Gerger, A.; Froehlich, H.; Eller, P.; Rief, P.; Hackl, G.; Pilger, E.; et al. Platelet-to-Lymphocyte Ratio: A Novel Marker for Critical Limb Ischemia in Peripheral Arterial Occlusive Disease Patients. PLoS ONE 2013, 8, e67688. [Google Scholar] [CrossRef] [Green Version]
- Halmaciu, I.; Arbănași, E.M.; Kaller, R.; Mureșan, A.V.; Arbănași, E.M.; Bacalbasa, N.; Suciu, B.A.; Cojocaru, I.I.; Runcan, A.I.; Grosu, F.; et al. Chest CT Severity Score and Systemic Inflammatory Biomarkers as Predictors of the Need for Invasive Mechanical Ventilation and of COVID-19 Patients’ Mortality. Diagnostics 2022, 12, 2089. [Google Scholar] [CrossRef] [PubMed]


| Variables | All Patients n = 510 | non-ALI n = 461 | ALI n = 49 | p Value (OR; CI 95%) |
|---|---|---|---|---|
| Age mean ± SD (min–max) | 70.44 ± 11.05 (25–94) | 70 ± 11.08 (25–92) | 73.89 ± 13.15 (33–94) | 0.051 |
| Male sex no. (%) | 305 (59.80%) | 284 (61.60%) | 21 (42.85%) | 0.01 (0.46; 0.25–0.84) |
| Comorbidities and Risk Factors | ||||
| AH, no. (%) | 307 (60.20%) | 276 (59.87%) | 31 (63.27%) | 0.64 (1.15; 0.62–2.12) |
| IHD, no. (%) | 171 (33.53%) | 155 (33.62%) | 16 (32.65%) | 0.89 (0.95; 0.51–1.79) |
| AF, no. (%) | 132 (25.88%) | 109 (23.64%) | 23 (46.94%) | 0.0006 (2.85; 1.56–5.20) |
| CHF, no. (%) | 194 (38.04%) | 177 (38.39%) | 17 (34.69%) | 0.61 (0.85; 0.45–1.58) |
| MI, no. (%) | 147 (28.82%) | 130 (28.20%) | 17 (34.69%) | 0.34 (1.35; 0.72–2.52) |
| T2D, no. (%) | 196 (38.43%) | 176 (38.18%) | 20 (40.82%) | 0.71 (1.11; 0.61–2.03) |
| COPD, no. (%) | 94 (18.43%) | 84 (18.22%) | 10 (20.41%) | 0.70 (1.15; 0.55–2.39) |
| PAD, no. (%) | 217 (42.55%) | 187 (40.56%) | 30 (61.22%) | 0.006 (2.31; 1.26–4.23) |
| Dyslipidemia, no. (%) | 218 (42.75%) | 197 (42.73%) | 21 (42.86%) | 0.98 (1.00; 0.55–1.82) |
| CKD, no. (%) | 102 (20%) | 90 (19.52%) | 12 (24.49%) | 0.40 (1.33; 0.67–2.66) |
| CVA, no. (%) | 154 (30.20%) | 134 (29.07%) | 20 (40.82%) | 0.09 (1.68; 0.91–3.07) |
| Obesity, no. (%) | 142 (27.84%) | 125 (27.11%) | 17 (34.69%) | 0.26 (1.42; 0.76–2.66) |
| Tobacco, no. (%) | 175 (34.31%) | 154 (33.41%) | 21 (42.86%) | 0.18 (1.49; 0.82–2.71) |
| Chest CT Findings | ||||
| Consolidation, no. (%) | 148 (29.01%) | 134 (29.06%) | 14 (28.57%) | 0.94 |
| Pleural Effusion, no. (%) | 42 (8.23%) | 37 (8.02%) | 5 (10.20%) | 0.59 |
| Ground Glass-Opacities, no. (%) | 278 (54.5%) | 246 (53.36%) | 32 (65.3%) | 0.11 |
| Crazy paving, no. (%) | 59 (11.56%) | 51 (11.06%) | 8 (16.32%) | 0.27 |
| Right Upper Lobe, median [Q1–Q3] | 2 [1–3] | 2 [1–3] | 3 [2–4] | <0.0001 |
| Right Middle Lobe, median [Q1–Q3] | 3 [1–4] | 2 [1–3] | 4 [2–4] | <0.0001 |
| Right Lower Lobe, median [Q1–Q3] | 3 [2–4] | 3 [2–4] | 4 [3–4] | <0.0001 |
| Left Upper Lobe, median [Q1–Q3] | 2 [1–3] | 2 [1–3] | 3 [2–4] | <0.0001 |
| Left Lower Lobe, median [Q1–Q3] | 2 [2–4] | 2 [1–3] | 3 [2–4] | <0.0001 |
| CT Severity Score, median [Q1–Q3] | 12 [8–17] | 11 [7–15] | 17 [12–20] | <0.0001 |
| Laboratory Data | ||||
| Hemoglobin g/dL, median [Q1–Q3] | 13.23 [11.5–14.51] | 13.35 [11.56–14.57] | 12.7 [11.1–14] | 0.058 |
| Hematocrit %, median [Q1–Q3] | 40.4 [35.62–44.1] | 40.59 [35.9–44.11] | 38.7 [31.6–43.2] | 0.06 |
| Neutrophils ×103/uL, median [Q1–Q3] | 6.58 [4.80–8.95] | 6.26 [4.69–8.44] | 11.29 [7.96–14.65] | <0.0001 |
| Lymphocytes ×103/uL, median [Q1–Q3] | 1.73 [1.21–2.32] | 1.78 [1.3–2.4] | 0.85 [0.57–1.16] | <0.0001 |
| Monocyte ×103/uL, median [Q1–Q3] | 0.63 [0.47–0.85] | 0.63 [0.47–0.83] | 0.70 [0.49–1.15] | 0.09 |
| PLT ×103/uL, median [Q1–Q3] | 243 [199–300.22] | 242.9 [195.5–295.1] | 278.1 [207–378] | 0.007 |
| Glucose mg/dL, median [Q1–Q3] | 112 [95–142] | 110 [94–138] | 132.3 [103.1–169] | 0.002 |
| Cholesterol mg/dL, median [Q1–Q3] | 176.05 [145.12–210] | 177.3 [145.2–211.4] | 160.8 [139.2–189] | 0.01 |
| Triglyceride mg/dL, median [Q1–Q3] | 115.4 [90.92–159.37] | 115.4 [91.4–160] | 105.7 [87.3–149.2] | 0.01 |
| Potassium mmol/L, median [Q1–Q3] | 4.35 [3.91–5.03] | 4.35 [3.91–5.06] | 4.3 [3.85–4.89] | 0.25 |
| Sodium mmol/L, median [Q1–Q3] | 140 [139–142] | 140 [139–142] | 140 [140–142] | 0.08 |
| BUN mg/dL, median [Q1–Q3] | 42.8 [32.3–55.6] | 42.4 [32.2–55.1] | 46.2 [34.2–72.5] | 0.04 |
| Creatinine mg/dL, median [Q1–Q3] | 0.91 [0.76–1.12] | 0.90 [0.75–1.11] | 1 [0.8–1.24] | 0.07 |
| MLR, median [Q1–Q3] | 0.35 [0.25–0.57] | 0.33 [0.24–0.52] | 0.81 [0.45–1.38] | <0.0001 |
| NLR, median [Q1–Q3] | 3.75 [2.28–7.06] | 3.49 [2.19–6.06] | 15.16 [9.40–20.26] | <0.0001 |
| PLR, median [Q1–Q3] | 138.21 [104.65–207.15] | 131.96 [100.33–187.15] | 316.66 [189.62–466.76] | <0.0001 |
| SII, median [Q1–Q3] | 915.68 [531.03–1781.99] | 825.21 [518.37–1490.54] | 3751.57 [2384.21–5769.75] | <0.0001 |
| SIRI, median [Q1–Q3] | 2.22 [1.26–5.2] | 2.10 [1.20–4.20] | 10.87 [6.32–13.74] | <0.0001 |
| AISI, median [Q1–Q3] | 540.05 [291.27–1340.78] | 496.97 [280–1052.86] | 3115.66 [1387.50–4576.21] | <0.0001 |
| Outcomes | ||||
| ALI, no. (%) | 49 (9.61%) | - | 49 (100%) | <0.0001 |
| ICU, no. (%) | 187 (36.67%) | 149 (32.32%) | 38 (77.55%) | <0.0001 (7.23; 3.59–14.55) |
| Mortality, no. (%) | 114 (22.35%) | 87 (18.87%) | 27 (55.10%) | <0.0001 (5.27; 2.86–9.70) |
| Hospital stays, day median [Q1–Q3] | 8 [5–11] | 8 [5–11] | 8 [5–12] | 0.44 |
| Variables | Survivors n = 396 | Non-Survivors n = 114 | p Value (OR; CI 95%) |
|---|---|---|---|
| Age mean ± SD (min–max) | 69.60 ± 10.84 (25–92) | 73.35 ± 11.34 (41–94) | 0.001 |
| Male sex no. (%) | 247 (62.37%) | 58 (50.88%) | 0.02 (0.62; 0.41–0.95) |
| Comorbidities | |||
| AH, no. (%) | 228 (57.78%) | 79 (69.30%) | 0.02 (1.66; 1.06–2.59) |
| IHD, no. (%) | 138 (34.85%) | 33 (28.95%) | 0.24 (0.76; 0.48–1.19) |
| AF, no. (%) | 86 (21.72%) | 46 (40.35%) | 0.0001 (2.43; 1.56–3.80) |
| CHF, no. (%) | 152 (38.38%) | 42 (36.84%) | 0.76 (0.93; 0.60–1.44) |
| MI, no. (%) | 116 (29.29%) | 31 (27.19%) | 0.66 (0.90; 0.56–1.43) |
| T2D, no. (%) | 150 (37.88%) | 46 (40.35%) | 0.63 (1.10; 0.72–1.69) |
| COPD, no. (%) | 77 (19.44%) | 17 (14.91%) | 0.27 (0.72; 0.40–1.28) |
| PAD, no. (%) | 141 (35.61%) | 76 (66.67%) | <0.0001 (3.61; 2.32–5.61) |
| Dyslipidemia, no. (%) | 168 (42.42%) | 50 (43.86%) | 0.78 (1.06; 0.69–1.61) |
| CKD, no. (%) | 76 (19.19%) | 26 (22.81%) | 0.39 (1.24; 0.75–2.05) |
| CVA, no. (%) | 116 (29.29%) | 38 (33.33%) | 0.40 (1.20; 0.77–1.88) |
| Obesity, no. (%) | 114 (28.79%) | 28 (24.56%) | 0.37 (0.80; 0.49–1.29) |
| Tobacco, no. (%) | 134 (33.84%) | 41 (35.96%) | 0.67 (1.09; 0.71–1.69) |
| Chest CT Findings | |||
| Consolidation, no. (%) | 106 (26.76%) | 42 (36.84%) | 0.03 |
| Pleural Effusion, no. (%) | 27 (6.81%) | 15 (13.15%) | 0.03 |
| GGO, no. (%) | 197 (49.74%) | 81 (71.05%) | 0.0001 |
| Crazy paving, no. (%) | 35 (8.83%) | 24 (21.05%) | 0.0005 |
| Right Upper Lobe, median [Q1–Q3] | 2 [1–3] | 3 [2–4] | <0.0001 |
| Right Middle Lobe, median [Q1–Q3] | 2 [1–3] | 4 [3–4] | <0.0001 |
| Right Lower Lobe, median [Q1–Q3] | 2 [2–3] | 4 [3–4] | <0.0001 |
| Left Upper Lobe, median [Q1–Q3] | 2 [1–3] | 3 [2–4] | <0.0001 |
| Left Lower Lobe, median [Q1–Q3] | 2 [1–3] | 4 [3–4] | <0.0001 |
| CT Severity Score, median [Q1–Q3] | 11 [7–15] | 18 [14.25–19] | <0.0001 |
| Laboratory Data | |||
| Hemoglobin g/dL, median [Q1–Q3] | 13.5 [11.9–14.61] | 12.35 [10.1–14.07] | <0.0001 |
| Hematocrit %, median [Q1–Q3] | 40.82 [36.77–44.3] | 36.84 [31.91–42.77] | <0.0001 |
| Neutrophils ×103/uL, median [Q1–Q3] | 5.83 [4.52–7.77] | 9.43 [7.46–13.18] | <0.0001 |
| Lymphocytes ×103/uL, median [Q1–Q3] | 1.85 [1.35–2.46] | 1.20 [0.82–1.70] | <0.0001 |
| Monocyte ×103/uL, median [Q1–Q3] | 0.61 [0.47–0.81] | 0.72 [0.52–1.12] | 0.0002 |
| PLT ×103/uL, median [Q1–Q3] | 238.35 [192.97–284.25] | 257.5 [211.77–352] | 0.0006 |
| Glucose mg/dL, median [Q1–Q3] | 106.65 [93–134] | 132.65 [104.25–162.42] | <0.0001 |
| Cholesterol mg/dL, median [Q1–Q3] | 177.95 [145.97–208.4] | 165.75 [142.9–214.22] | 0.20 |
| Triglyceride mg/dL, median [Q1–Q3] | 117.3 [91.62–158.1] | 107 [86.5–167.18] | 0.24 |
| Potassium mmol/L, median [Q1–Q3] | 4.37 [3.91–4.94] | 4.31 [3.85–5.13] | 0.44 |
| Sodium mmol/L, median [Q1–Q3] | 140 [139–142] | 141 [139–142] | 0.051 |
| BUN mg/dL, median [Q1–Q3] | 41.9 [32.27–54.8] | 45.5 [32.72–67.8] | 0.01 |
| Creatinine mg/dL, median [Q1–Q3] | 0.9 [0.75–1.11] | 0.97 [0.78–1.22] | 0.06 |
| MLR, median [Q1–Q3] | 0.32 [0.23–0.47] | 0.62 [0.39–0.91] | <0.0001 |
| NLR, median [Q1–Q3] | 3.01 [2.05–5.05] | 8.45 [5.62–14.52] | <0.0001 |
| PLR, median [Q1–Q3] | 128.22 [94.94–168.33] | 229.83 [150.97–350.71] | <0.0001 |
| SII, median [Q1–Q3] | 719.53 [482.92–1290.48] | 2303.58 [1457.83–3783.06] | <0.0001 |
| SIRI, median [Q1–Q3] | 1.86 [1.11–3.42] | 6.93 [3.75–12.02] | <0.0001 |
| AISI, median [Q1–Q3] | 425.93 [257.41–857.88] | 2100.38 [894.26–3333.88] | <0.0001 |
| Outcomes | |||
| ALI, no. (%) | 29 (7.32%) | 20 (17.54%) | <0.0001 (5.74; 3.57–9.25) |
| ICU, no. (%) | 108 (27.27%) | 79 (699.3%) | <0.0001 (6.01; 3.81–9.48) |
| Mortality, no. (%) | - | 114 (100%) | <0.0001 |
| Hospital Stays, Day Median [Q1–Q3] | 8 [5–11] | 7 [4–12] | 0.25 |
| Variables | Cut-Off | AUC | Std. Error | 95% CI | Sensitivity | Specificity | p Value |
|---|---|---|---|---|---|---|---|
| ALI | |||||||
| MLR NLR PLR | 0.49 | 0.787 | 0.038 | 0.713–0.862 | 71.4% | 71.6% | <0.0001 |
| 8.34 | 0.882 | 0.029 | 0.824–0.939 | 81.6% | 87.4% | <0.0001 | |
| 178.99 | 0.858 | 0.028 | 0.803–0.912 | 81.6% | 73.1% | <0.0001 | |
| SII | 2219.28 | 0.888 | 0.028 | 0.834–0.942 | 81.6% | 87.2% | <0.0001 |
| SIRI | 5.04 | 0.839 | 0.034 | 0.773–0.905 | 79.6% | 79.6% | <0.0001 |
| AISI | 1296.62 | 0.851 | 0.032 | 0.789–0.913 | 79.6% | 79.2% | <0.0001 |
| CT Severity Score | 15.50 | 0.725 | 0.030 | 0.665–0.784 | 60.4% | 76.7% | <0.0001 |
| ICU | |||||||
| MLR NLR PLR | 0.39 | 0.700 | 0.024 | 0.652–0.748 | 65.2% | 67.8% | <0.0001 |
| 3.71 | 0.780 | 0.021 | 0.739–0.821 | 79.1% | 65.9% | <0.0001 | |
| 142.61 | 0.743 | 0.022 | 0.699–0.787 | 73.8% | 67.2% | <0.0001 | |
| SII | 1413.38 | 0.779 | 0.022 | 0.736–0.821 | 66.3% | 85.1% | <0.0001 |
| SIRI | 2.33 | 0.740 | 0.023 | 0.696–0.785 | 70.6% | 67.2% | <0.0001 |
| AISI | 650.58 | 0.738 | 0.023 | 0.692–0.783 | 67.9% | 68.7% | <0.0001 |
| CT Severity Score | 12.50 | 0.733 | 0.023 | 0.687–0.779 | 71.7% | 65.3% | <0.0001 |
| Mortality | |||||||
| MLR NLR PLR | 0.45 | 0.758 | 0.027 | 0.706–0.811 | 68.4% | 74% | <0.0001 |
| 4.57 | 0.845 | 0.019 | 0.807–0.882 | 86.8% | 72% | <0.0001 | |
| 177.51 | 0.775 | 0.026 | 0.724–0.825 | 68.4% | 77.5% | <0.0001 | |
| SII | 1346.51 | 0.850 | 0.020 | 0.811–0.889 | 82.5% | 77.8% | <0.0001 |
| SIRI | 4.02 | 0.823 | 0.022 | 0.780–0.867 | 73.7% | 80.1% | <0.0001 |
| AISI | 973.59 | 0.830 | 0.023 | 0.786–0.874 | 74.6% | 79.5% | <0.0001 |
| CT Severity Score | 14.50 | 0.816 | 0.022 | 0.773–0.860 | 74.6% | 72.5% | <0.0001 |
| ALI | ICU | Mortality | |
|---|---|---|---|
| Low-MLR vs. high-MLR | 6/341 (1.76%) vs. 43/169 (25.44%) p < 0.0001 OR:19.05 CI: (7.91–45.86) | 64/276 (23.19%) vs. 123/234 (52.56%) p < 0.0001 OR:3.67 CI: (2.51–5.36) | 35/316 (11.08%) vs. 79/194 (40.72%) p < 0.0001 OR:5.51 CI: (3.50–8.67) |
| Low-NLR vs. high-NLR | 12/411 (2.92%) vs. 37/99 (37.37%) p < 0.0001 OR:19.84 CI: (9.81–40.11) | 39/252 (15.48%) vs. 148/258 (57.36%) p < 0.0001 OR:7.34 CI: (4.82–11.19) | 15/297 (5.05%) vs. 99/213 (46.48%) p < 0.0001 OR:16.32 CI: (9.09–29.30) |
| Low-PLR vs. high-PLR | 6/346 (1.73%) vs. 43/164 (26.22%) p < 0.0001 OR:20.13 CI: (8.36–48.50) | 49/266 (18.42%) vs. 138/244 (56.56%) p < 0.0001 OR:5.76 CI: (3.86–8.60) | 36/343 (10.50%) vs. 78/167 (46.71%) p < 0.0001 OR:7.47 CI: (4.71–11.83) |
| Low-SII vs. high-SII | 12/411 (2.92%) vs. 37/99 (37.37%) p < 0.0001 OR:19.84 CI: (9.81–40.11) | 63/338 (18.64%) vs. 124/172 (72.09%) p < 0.0001 OR:11.27 CI: (7.32–17.35) | 20/328 (20%) vs. 94/182 (51.65%) p < 0.0001 OR:16.98 CI: (9.92–29.06) |
| Low-SIRI vs. high-SIRI | 10/341 (2.93%) vs. 39/169 (23.08%) p < 0.0001 OR:9.93 CI: (4.81–20.47) | 55/269 (20.45%) vs. 132/241 (54.77%) p < 0.0001 OR:4.71 CI: (3.19–6.95) | 30/346 (8.67%) vs. 84/164 (51.22%) p < 0.0001 OR:11.06 CI: (6.81–17.94) |
| Low-AISI vs. high-AISI | 10/375 (2.67%) vs. 39/135 (28.89%) p < 0.0001 OR:14.82 CI: (7.14–30.77) | 60/282 (21.28%) vs. 127/228 (55.70%) p < 0.0001 OR:4.65 CI: (3.16–6.84) | 29/344 (8.43%) vs. 85/166 (51.20%) p < 0.0001 OR:11.39 CI: (7.003–18.55) |
| Low-CT Severity Score vs. high-CT Severity Score | 8/352 (2.27%) vs. 41/158 (25.95%) p < 0.0001 OR:15.06 CI: (6.86–33.07) | 58/264 (21.97%) vs. 129/246 (52.44%) p < 0.0001 OR:3.91 CI: (2.66–5.74) | 29/316 (9.18%) vs. 85/194 (43.81%) p < 0.0001 OR:7.71 CI: (4.79–12.41) |
| ALI | ICU | Mortality | |||||||
|---|---|---|---|---|---|---|---|---|---|
| OR | 95% CI | p Value | OR | 95% CI | p Value | OR | 95% CI | p Value | |
| Age > 70 Male sex AH | 1.03 | 0.99–1.06 | 0.051 | 1.42 | 0.98–2.05 | 0.059 | 1.50 | 0.97–2.30 | 0.06 |
| 0.63 | 0.41–0.97 | 0.003 | 0.59 | 0.41–0.85 | 0.006 | 0.62 | 0.41–0.95 | 0.02 | |
| 1.23 | 0.52–2.77 | 0.14 | 1.54 | 0.92–2.58 | 0.09 | 1.69 | 0.90–3.19 | 0.10 | |
| AF | 2.85 | 1.56–5.20 | <0.001 | 1.27 | 0.85–1.91 | 0.24 | 2.43 | 1.56–3.80 | <0.001 |
| PAD | 2.31 | 1.26–4.23 | 0.006 | 1.12 | 0.78–1.61 | 0.52 | 3.61 | 2.32–5.61 | <0.001 |
| High-MLR High-NLR High-PLR | 6.82 | 3.51–13.28 | <0.001 | 3.67 | 2.51–5.36 | <0.001 | 5.51 | 3.50–8.67 | <0.001 |
| 30.28 | 13.97–65.60 | <0.001 | 7.34 | 4.82–11.19 | <0.001 | 16.32 | 9.09–29.30 | <0.001 | |
| 12.07 | 7.71–21.77 | <0.001 | 5.76 | 3.86–8.60 | <0.001 | 7.47 | 4.71–11.83 | <0.001 | |
| High-SII | 30.28 | 13.97–65.60 | <0.001 | 11.27 | 7.32–17.35 | <0.001 | 16.45 | 9.60–28.16 | <0.001 |
| High-SIRI | 15.22 | 7.33–31.62 | <0.001 | 4.71 | 3.19–6.96 | <0.001 | 11.06 | 6.81–17.94 | <0.001 |
| HIgh-AISI | 14.82 | 7.14–30.77 | <0.001 | 4.65 | 3.16–6.85 | <0.001 | 11.39 | 7.003–18.55 | <0.001 |
| High CT Severity Score | 14.71 | 6.12–35.33 | <0.001 | 4.98 | 3.33–7.44 | <0.001 | 09.89 | 6.23–21.79 | <0.001 |
| ALI Patients n = 49 | Survivors n = 22 | Non-Survivors n = 27 | p Value | ||||||
|---|---|---|---|---|---|---|---|---|---|
| Rutherford Classification | |||||||||
| I, no. (%) | 8 (16.33%) | 7 (31.82%) | 1 (3.70%) | 0.02 | |||||
| IIA, no. (%) | 13 (26.53%) | 7 (31.82%) | 6 (22.22%) | 0.45 | |||||
| IIB, no. (%) | 15 (30.61%) | 6 (27.27%) | 9 (33.33%) | 0.64 | |||||
| III, no. (%) | 13 (26.53%) | 2 (9.09%) | 11 (40.74) | 0.02 | |||||
| Side Involved | |||||||||
| Unilateral, no. (%) | 40 (81.63%) | 19 (86.36%) | 21 (77.78%) | 0.44 | |||||
| Bilateral, no. (%) | 9 (18.37%) | 3 (13.64%) | 6 (22.22%) | ||||||
| Arterial Segment Involved | |||||||||
| Aorto-Iliac, no. (%) | 6 (12.24%) | 2 (9.09%) | 4 (14.81%) | 0.54 | |||||
| Femoral, no. (%) | 13 (26.53%) | 11 (50%) | 2 (7.41%) | 0.003 | |||||
| Popliteal, no. (%) | 14 (28.57%) | 6 (27.27%) | 8 (29.63%) | 0.85 | |||||
| Infrapopliteal, no. (%) | 13 (26.53%) | 2 (9.09%) | 11 (40.74%) | 0.02 | |||||
| Upper Limb, no. (%) | 3 (6.12%) | 1 (4.55%) | 2 (7.41%) | 0.68 | |||||
| Outcomes | |||||||||
| ICU, no. (%) | 38 (77.55%) | 14 (63.63%) | 24 (88.89%) | 0.04 | |||||
| Multivariate analysis | |||||||||
| ICU | Mortality | ||||||||
| OR | 95% CI | p value | OR | 95% CI | p value | ||||
| RC I | 0.20 | 0.04–1.02 | 0.054 | 0.08 | 0.009–0.73 | 0.02 | |||
| RC III | 1.83 | 0.34–9.88 | 0.48 | 4.72 | 1.17–18.52 | 0.04 | |||
| Femoral | 0.18 | 0.04–0.79 | 0.02 | 0.08 | 0.01–0.42 | 0.003 | |||
| Infrapopliteal | 4.61 | 0.52–40.27 | 0.16 | 6.87 | 1.32–35.57 | 0.02 | |||
Publisher’s Note: MDPI stays neutral with regard to jurisdictional claims in published maps and institutional affiliations. |
© 2022 by the authors. Licensee MDPI, Basel, Switzerland. This article is an open access article distributed under the terms and conditions of the Creative Commons Attribution (CC BY) license (https://creativecommons.org/licenses/by/4.0/).
Share and Cite
Arbănași, E.M.; Halmaciu, I.; Kaller, R.; Mureșan, A.V.; Arbănași, E.M.; Suciu, B.A.; Coșarcă, C.M.; Cojocaru, I.I.; Melinte, R.M.; Russu, E. Systemic Inflammatory Biomarkers and Chest CT Findings as Predictors of Acute Limb Ischemia Risk, Intensive Care Unit Admission, and Mortality in COVID-19 Patients. Diagnostics 2022, 12, 2379. https://doi.org/10.3390/diagnostics12102379
Arbănași EM, Halmaciu I, Kaller R, Mureșan AV, Arbănași EM, Suciu BA, Coșarcă CM, Cojocaru II, Melinte RM, Russu E. Systemic Inflammatory Biomarkers and Chest CT Findings as Predictors of Acute Limb Ischemia Risk, Intensive Care Unit Admission, and Mortality in COVID-19 Patients. Diagnostics. 2022; 12(10):2379. https://doi.org/10.3390/diagnostics12102379
Chicago/Turabian StyleArbănași, Emil Marian, Ioana Halmaciu, Réka Kaller, Adrian Vasile Mureșan, Eliza Mihaela Arbănași, Bogdan Andrei Suciu, Cătălin Mircea Coșarcă, Ioana Iulia Cojocaru, Razvan Marian Melinte, and Eliza Russu. 2022. "Systemic Inflammatory Biomarkers and Chest CT Findings as Predictors of Acute Limb Ischemia Risk, Intensive Care Unit Admission, and Mortality in COVID-19 Patients" Diagnostics 12, no. 10: 2379. https://doi.org/10.3390/diagnostics12102379