
The Bacterial Nucleoid: From Electron Microscopy to Polymer Physics—A Personal Recollection

Bacterial Cell Biology, Swammerdam Institute for Life Sciences (SILS), University of Amsterdam, 1098 XH Amsterdam, The Netherlands
Life 2023, 13(4), 895; https://doi.org/10.3390/life13040895
Submission received: 2 March 2023
/
Revised: 22 March 2023
/
Accepted: 24 March 2023
/
Published: 28 March 2023
(This article belongs to the Special Issue Novel Principles and Methods in Bacterial Cell Cycle Physiology: Celebrating the Charles E. Helmstetter Prize in 2022)
Abstract
:In the 1960s, electron microscopy did not provide a clear answer regarding the compact or dispersed organization of the bacterial nucleoid. This was due to the necessary preparation steps of fixation and dehydration (for embedding) and freezing (for freeze-fracturing). Nevertheless, it was possible to measure the lengths of nucleoids in thin sections of slow-growing Escherichia coli cells, showing their gradual increase along with cell elongation. Later, through application of the so-called agar filtration method for electron microscopy, we were able to perform accurate measurements of cell size and shape. The introduction of confocal and fluorescence light microscopy enabled measurements of size and position of the bacterial nucleoid in living cells, inducing the concepts of “nucleoid occlusion” for localizing cell division and of “transertion” for the final step of nucleoid segregation. The question of why the DNA does not spread throughout the cytoplasm was approached by applying polymer-physical concepts of interactions between DNA and proteins. This gave a mechanistic insight in the depletion of proteins from the nucleoid, in accordance with its low refractive index observed by phase-contrast microscopy. Although in most bacterial species, the widely conserved proteins of the ParABS-system play a role in directing the segregation of newly replicated DNA strands, the basis for the separation and opposing movement of the chromosome arms was proposed to lie in preventing intermingling of nascent daughter strands already in the early replication bubble. E. coli, lacking the ParABS system, may be suitable for investigating this basic mechanism of DNA strand separation and segregation.
1. Electron and Light Microscopy
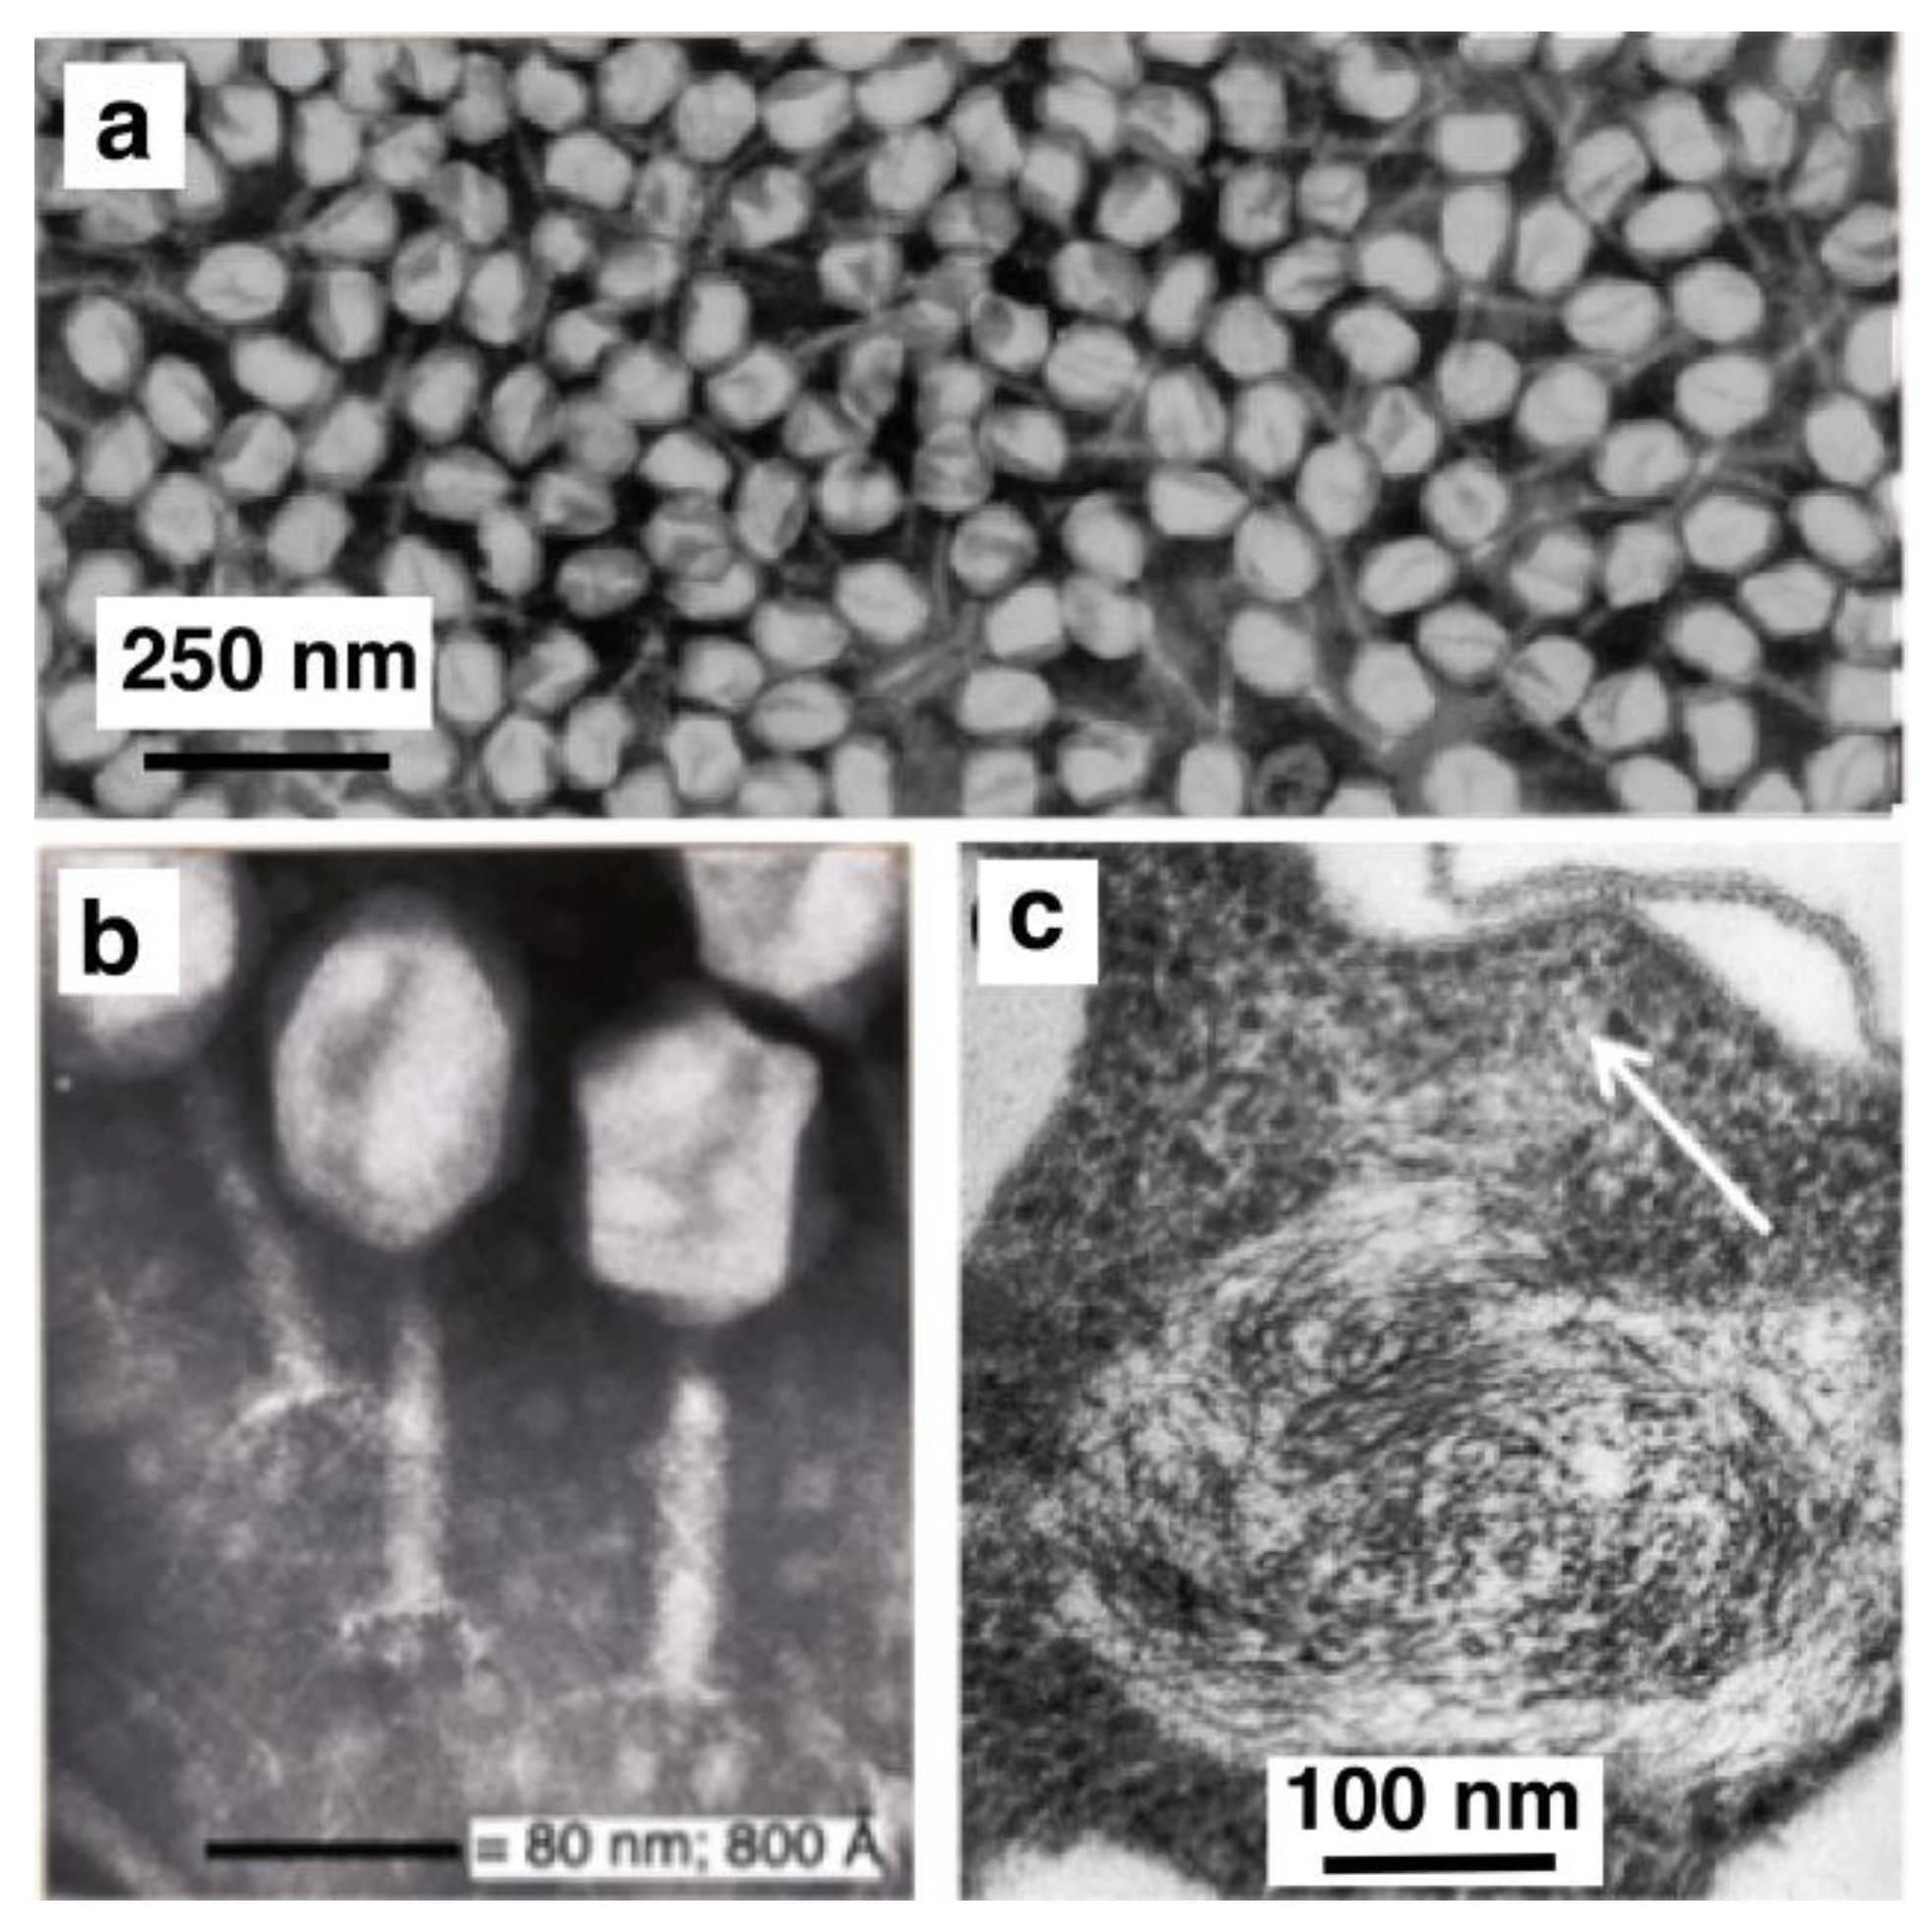
In 1966, the preparation of T2-phages that I purified during my master’s degree program was photographed at the Laboratory of Electron Microscopy in Amsterdam by Nanne Nanninga (Figure 1a,b). The preparation was pure and satisfied the director, Dr. Woutera van Iterson, who consequently accepted me later as a Ph.D. student. I also remember how van Iterson and I looked together at the pictures of highly magnified photographs of thin sections of Escherichia coli cells, fixed by the Ryter–Kellenberger method [1], in which aggregated DNA threads and poly-ribosomes can be distinguished. As in the case of mesosomes in Bacillus subtilis (see below), van Iterson saw in the continuation of DNA threads through the cytoplasm towards the plasma membrane (arrow in Figure 1c), a confirmation of the first model for bacterial DNA segregation, in which Jacob, Brenner and Cuzin [2] proposed a connection between DNA and the plasma membrane.
Nanninga, however, was skeptical. At that time, around 1970, he was involved in applying the freeze-fracture technique to B. subtilis cells which were expected to contain mesosomes. These membranous organelles had no clear function, but in the thin sections studied by van Iterson, they were often seen in contact with nucleoids [3]. The shadowed replicas of unfixed, freeze-fractured B. subtilis cells, however, did not show any sign of mesosomes; these only appeared in the freeze-fractures when cells were previously fixed (causing permeabilization of the plasma membrane); for instance, with osmium tetroxide used for thin sectioning. A similar phenomenon seemed to occur with the variable visibility in freeze fractures of the E. coli nucleoid: the latter could not always be distinguished, probably due to ice crystal formation. These problems and, in addition, the difference in nucleoid appearance between osmium tetroxide and glutaraldehyde fixed [4] led Nanninga to stimulate the development of a confocal scanning light microscope [5,6], which promised to bridge the gap in resolution between electron and light microscopy.
2. Cell Size, Shape and Growth Models
While in the lab, the interpretation of electron micrographs of fixed or frozen cells led to emotional and unsolvable discussions about mesosomes [7], I had found, in the small library of the institute, the book: “Control of macromolecular synthesis”, by Maaløe and Kjeldgaard [8]. Especially intriguing, there was a scheme of the nucleoid and cytoplasm (see their Figure 7-1, at the end of the book [8]). During my Ph.D. program, I also tried to understand the Helmstetter–Cooper model published in 1968 [9]. There was nobody in my surroundings who knew about this model, but there was interest in my study of thin-sectioned nucleoids showing that replication and segregation went hand in hand during the cell cycle [10]. After obtaining my Ph.D. in 1974, I had the opportunity to visit the laboratory of Charles Helmstetter in Buffalo (New York), where I also met Olga Pierucci. Travelling for the first time in the US, and also meeting scientists such as Herb Kubitschek, Arthur Koch and Elio Schaechter, was an impressive and stimulating experience.
Another important stimulating event occurred when I participated at the Lunteren Lectures on Molecular Genetics of 1974. There, I showed measurements of the size and shape of E. coli mutant cells [11], prepared by the agar filtration method developed by Kellenberger [12,13]. After my presentation, Arieh Zaritsky approached me with a clear message: “We have to meet and talk about cell shape!”. Having already received his Ph.D. at the laboratory of Bob Pritchard (Leicester, UK), Arieh seemed to understand the recent physiological experiments of Maaløe and Kjeldgaard, as well as the Helmstetter–Cooper model that described the coordination between chromosome replication and cell division [14,15]. This was the beginning of a still-lasting cooperation [16] that started with learning how to culture E. coli cells under steady state conditions while analyzing shape changes during a nutritional shift-up of cells prepared by agar filtration and understanding the distinction between the two completely different physiological states of “thymine starvation” and “thymine limitation” [17].
Together with Nanne Nanninga, Arieh Zaritsky, Bob Rosenberger, Norman Grover, Wim Voorn and Luud Koppes, the electron microscope measurements of fixed and air-dried cells were compared to growth models that predicted the observed shape of length distributions; we discussed cell elongation modes (linear with a rate doubling or exponential), shape changes and correlations between cell cycle events such as initiation of DNA replication (derived from radio-autograms) and initiation of cell constriction, the so-called C+D-T period. In 1993, Voorn, Koppes and Grover, remarked in a short paper [18] that a newly developed “incremental-size model” could not be rejected. Previously, the occurrence of “a constant size increment” during the C+D-T period was mentioned in Figure 6 of Koppes et al. [19] and Figure 1 of Koppes and Nanninga [20], suggesting a strong positive correlation between the events of initiation of DNA replication and initiation of cell constriction.
More than 20 years later, the same model was going to basically cause an explosion of studies [21,22]. This revival of the model can be ascribed to Suckjoon Jun, who gave it the name “adder”, writing: “The beauty of this “adder” is that it automatically ensures size homeostasis” (see also the Movie S1, “Size convergence by adder principle, related to Figure 3” in [23]). According to this now widely accepted adder model, based on measurements of living cells, often grown in microfluidic devices, cells do not sense their size (sizer model) nor their age (timer model), but add a constant size, between birth and division, that is independent of birth size. Whether and how cells could “sense” a constant size increment in large and small newborn cells is still unknown. However, measuring the amount of DNA in large and small prospective daughter cells in fast-growing E. coli cells [24] showed an increased amount of DNA (20% higher) in large siblings. This observation is in agreement with the prediction that large newborns initiate DNA replication earlier [25]. In addition, nucleoid segregation was found to be advanced in these larger prospective daughter cells, allowing them to divide earlier, as to be expected from the adder model. Confirmation of this adder-like behavior based on DNA replication and segregation has to await visualization of differently sized siblings in quantitative time-lapse experiments, as performed by the group of Jaan Männik [26].
3. Nucleoid Occlusion and Transertion
During his short-term EMBO-fellowship visit to Amsterdam in 1977, Arieh Zaritsky proposed to organize together with Nanne Nanninga the first EMBO workshop on bacterial duplication. It was held in 1980 in Noordwijkerhout (The Netherlands) with leaders in the field of bacterial physiology, such as Donachie, Grover, Helmstetter, Koch, Kubitschek, Maaløe, Messer, Pierucci, Pritchard and Schwarz.
Arieh organized the second workshop in Sede Boqer (Israel) in 1984, which I attended after enjoying a sabbatical leave in the lab of Jim Walker at the University of Texas at Austin. While continuing our cooperation, the study of populations of cell division mutants in Amsterdam was greatly facilitated by Norbert Vischer, who listened to our wishes for measuring cell properties and who translated them into practical software for image analysis and visualization of results [27]. This also enabled us to develop an interactive cell cycle simulation (CCS) program [28], which was used for decades to predict behavior of emerging cell-cycle mutants and to teach students the Helmstetter–Cooper model [29].
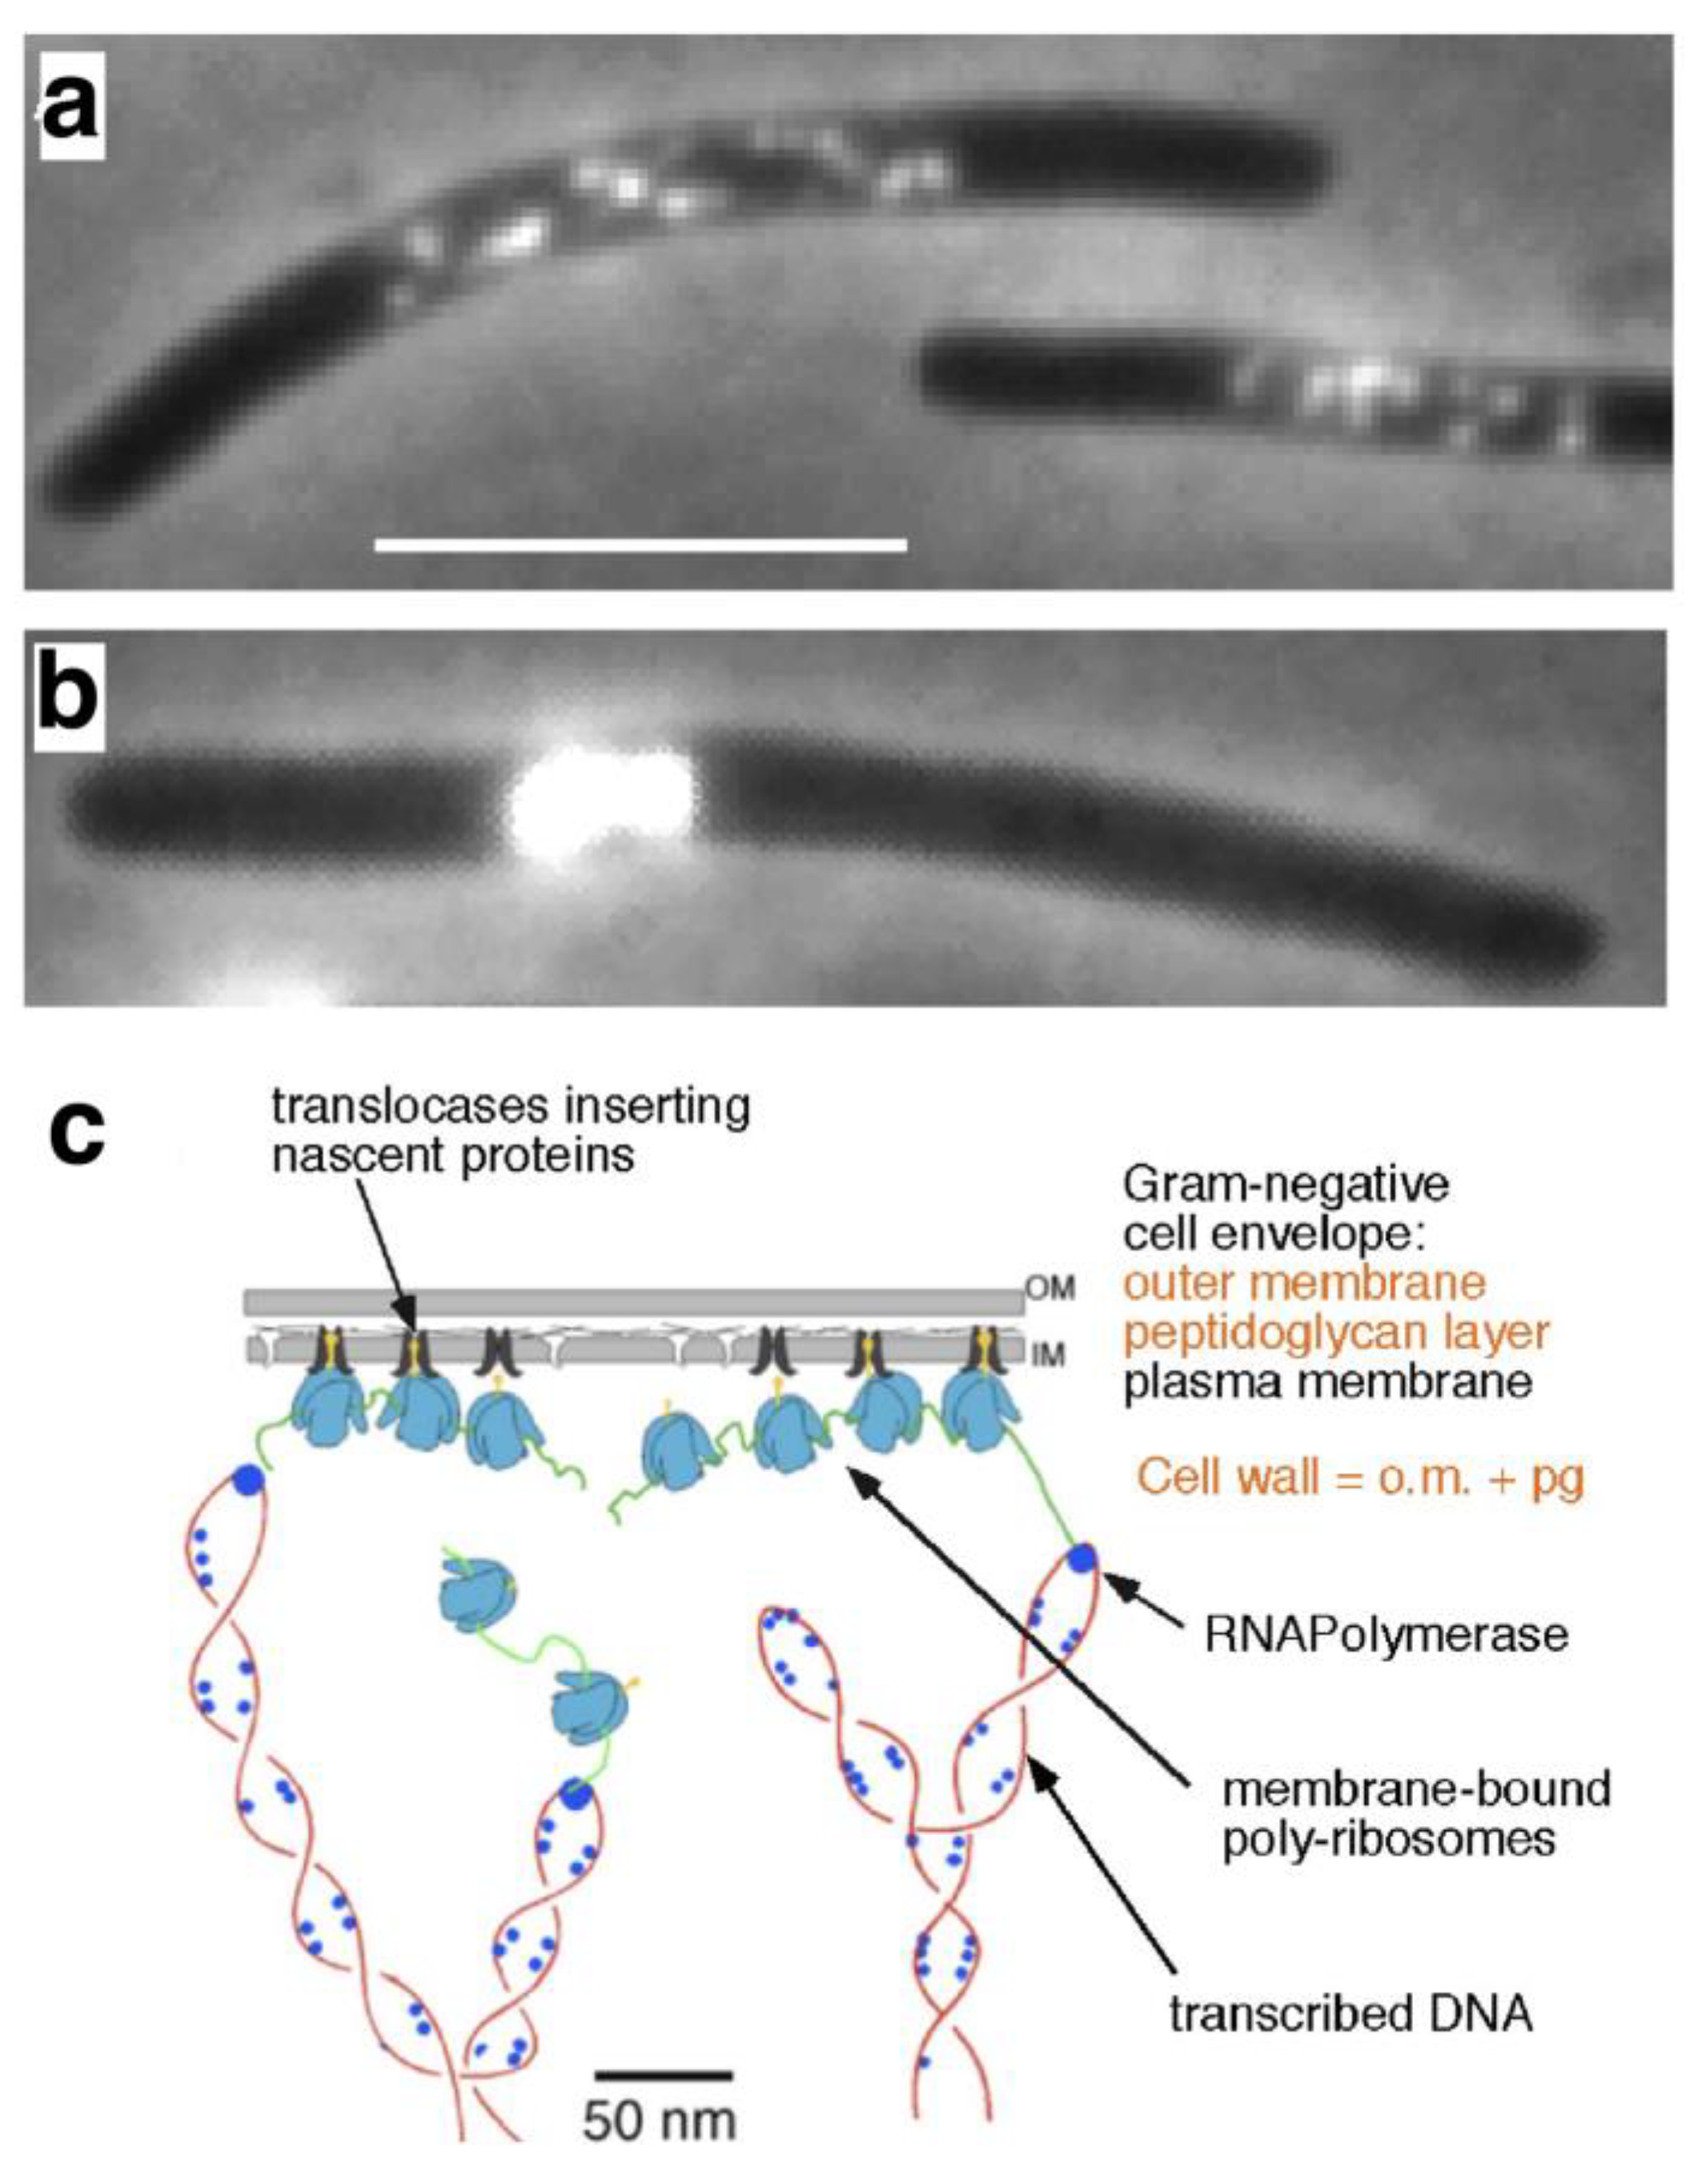
It was also during this period that, together with Nanninga, Wientjes and Zaritsky and Ph.D. students (Egbert Mulder, Marko Roos, Peter Taschner, Frank Trueba, Jacques Valkenburg and Joop van Helvoort), the concept of “nucleoid occlusion” was developed [30]. The term was coined by Larry Rothfiel and originally applied to the idea that transcriptional activity around the nucleoid occludes the increased rate of peptidoglycan synthesis necessary to initiate constriction [31]. Along with the ideas of Vic Norris [32], our observations on E. coli nucleoids and quantitative measurements by Evelien Pas, Peter Huls and Norbert Vischer resulted in the formulation of the “transertion model”. Observations of an expansion of non-replicating nucleoids by active protein synthesis [33], their compaction and fusion by inhibition of protein synthesis with chloramphenicol [34] and re-segregation after release from inhibition that occurred faster than cell elongation [35] led to the proposal that coupled transcription–translation–translocation of envelope proteins (transertion) could play an active role in DNA segregation (Figure 2).
However, about 20 years later, this idea could be falsified with the help of constructs made by Flemming Hansen (Denmark). Because the positioning of the left (L) and right (R) chromosome arms during replication showed a similar ordering pattern in either growing cells (e.g., L-ori-R L-ori-R or L-ori-R-R-ori-L), or during run-off DNA replication in protein-synthesis inhibited cells, transertion could not play a role in the mere movement of the chromosome arms [36]. This movement was proposed to be the passive result of DNA synthesis itself rather than of active protein synthesis (see Section 5). It should be noted, however, that active transertion influences the ordering pattern of the left and right chromosome arms and is still required for separation and movement of the entire daughter nucleoids into the prospective daughter cells [36].
Figure 2.
(a,b) Filaments of E. coli dnaX (Ts) grown at restrictive temperature (42 °C) for several mass doublings, fixed with 0.1% osmium tetroxide and stained with DAPI. (a) While DNA synthesis stops immediately, cells continue to grow, forming SOS-filaments. During elongation, the original nucleoid is pulled apart into small lobules. (b) Upon growth inhibition with 300 µg/mL chloramphenicol the DNA lobules re-compact into a confined region [34]. Bar in (a) also holds for (b) and represents 5 µm. (c) Schematic representation of the “transertion model” [37].

4. Physical DNA Model
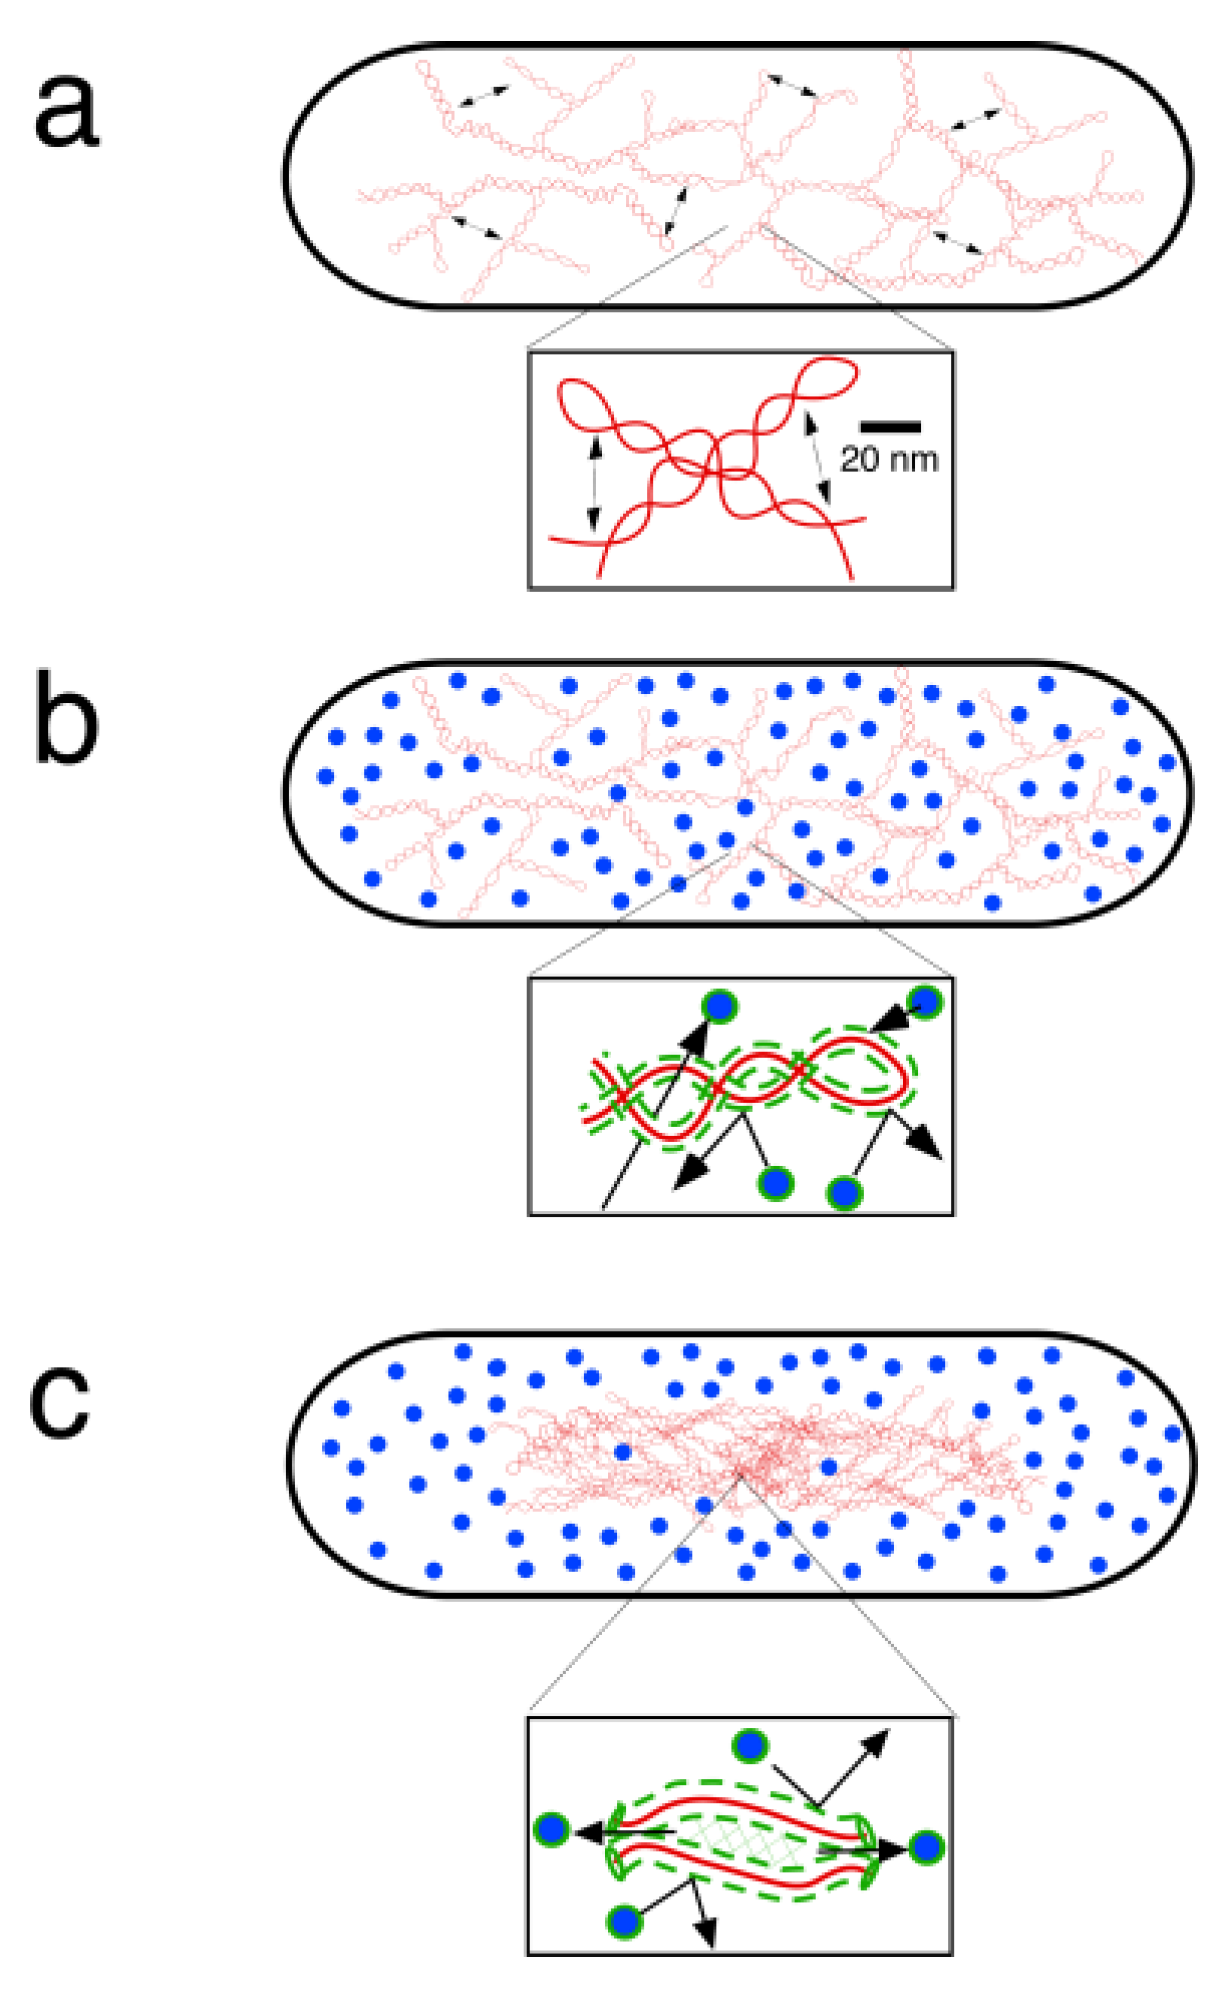
However, what about the remaining controversy concerning the dispersed or compact organization of DNA in the bacterial nucleoid? During and after my Ph.D., I remained fascinated by Figure 7-1 of Maaløe and Kjeldgaard [8] and I was glad that, with the help of Theo Odijk, we could make a similar figure, based on our measurements of nucleoid volume [38], on recent data of macromolecular concentrations in E. coli cells [39] and on Odijk’s free-energy approach of calculating the excluded-volume interactions between soluble proteins and DNA [40]. This so-called depletion theory (see explanation in [41]) formulates the free energy of the system that tends to reach equilibrium by minimizing its total free energy. The theory considers the free energy of self-interactions between DNA supercoils and of cross-interactions between DNA and soluble, cytoplasmic proteins and predicts a phase separation between nucleoid and cytoplasm as described in Figure 3.
Together with colleagues such as the late Michiel Meijer [43], Paul Sloof [44] and, subsequently, with Suckjoon Jun [45], we finally succeeded in reproducibly liberating nucleoids from E. coli spheroplasts by osmotic shock and in measuring the size of free-floating nucleoids under different crowding conditions (e.g., PEG; see Figure 9C in [46]). We also calculated the very small diffusion coefficient of a DNA region near oriC in isolated nucleoids [47] and, with Steve Elmore, Michiel Müller, Norbert Vischer and Theo Odijk, also in living cells [48].
Finally, a model for the bacterial nucleoid could be developed [49] (see [45] for microfluidics experiments). In the model, the DNA is represented by branched supercoils, partly relaxed through association with DNA-binding proteins and cross-linked by a substantial number of physical entanglements and/or proteins into a homogeneous, core-less network, without any sign of a “highly ordered structure”, as often proposed. While during osmotic shock of the spheroplasts, the nucleoids enlarge about 100 fold in volume, the liberated and DAPI-stained nucleoids expand further under continued UV irradiation (Figures 2 and 4 in ref. [49]).
In all our experiments, a distinctive substructure of granules (diameter ~ 2 µm) became visible during this expansion, showing Brownian motion. It is tempting to speculate that these granules correspond with the uncrosslinked blobs calculated by Odijk to have a radius of gyration of ~0.9 µm (see Appendix B in [49]).
5. Segregation of Chromosome Arms
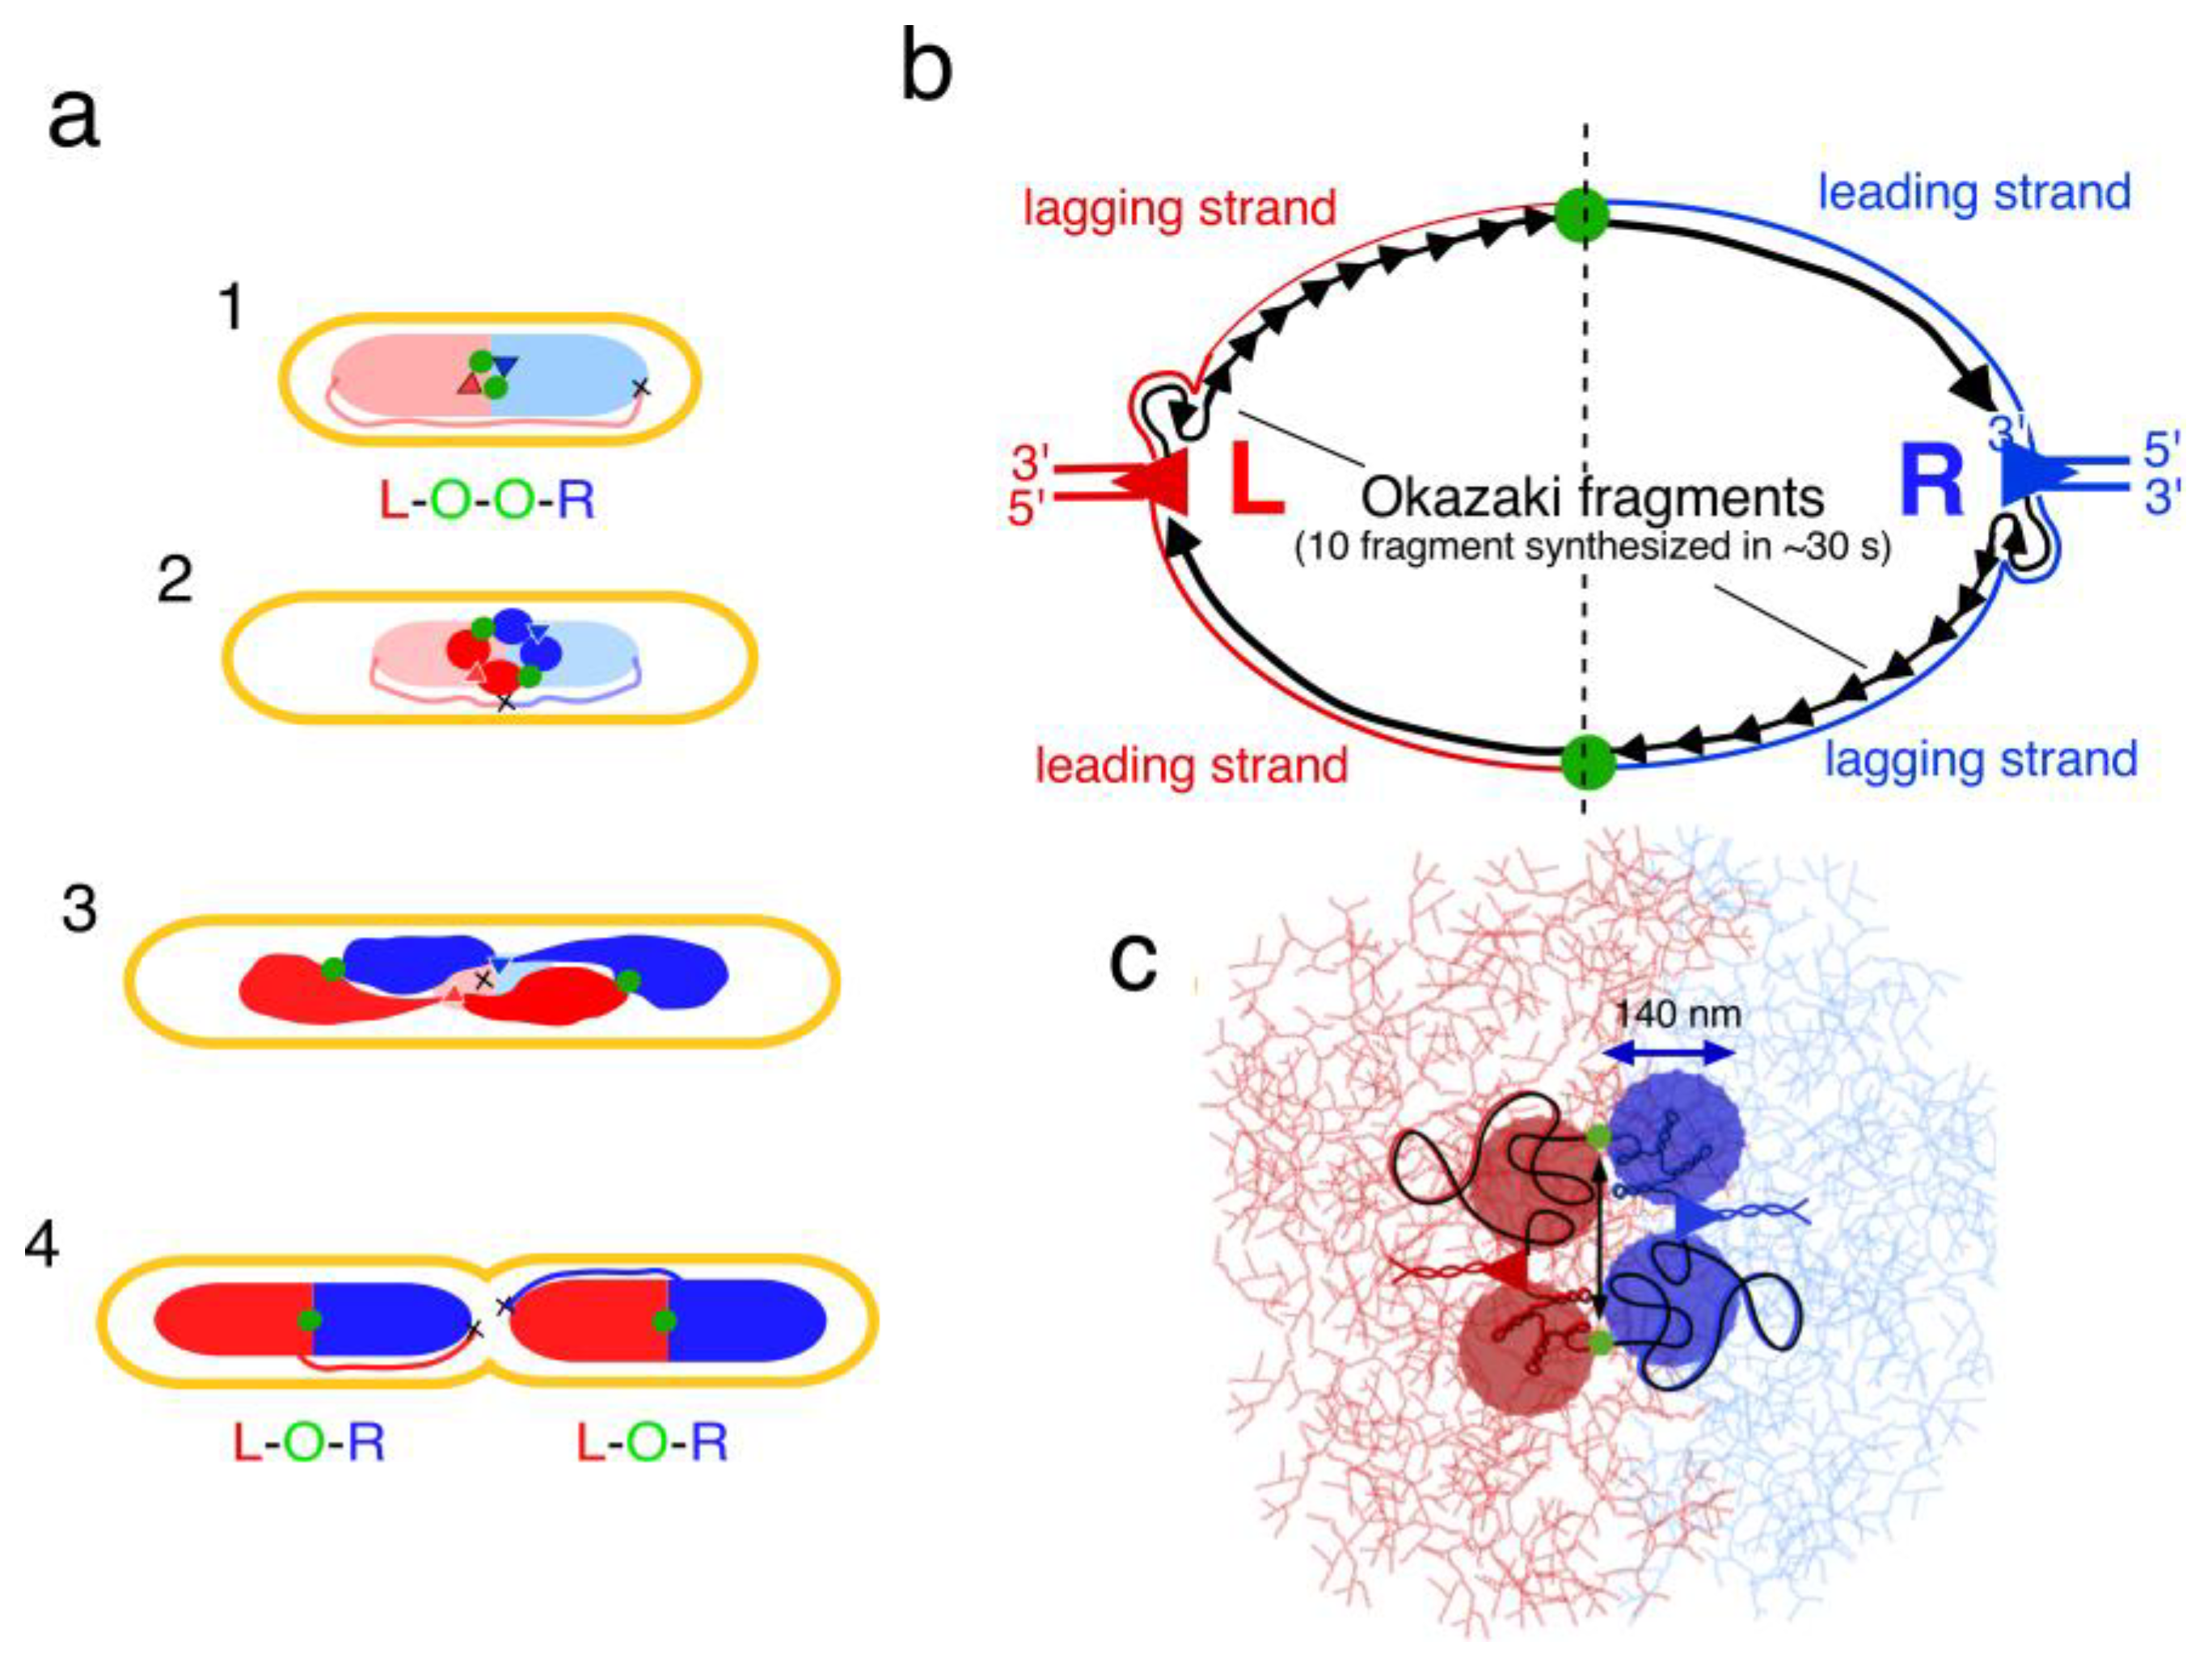
However, how do daughter strands, newly synthesized in such a seemingly homogeneous network (see Figure 5 in [49]), separate and remain unmixed? Although E. coli lacks the ParABS system, measurements of fluorescently tagged gene loci showed [50,51] that the two newly synthesized chromosome arms end up as individual domains in different halves of the two daughter nucleoids (Figure 4a, panel 4). This arrangement could be explained by assuming that already at initiation of DNA replication, each of the two replisomes in the replication bubble synthesizes daughter strands that do not mix because of their physical differences (Figure 4b,c). These differences could arise because the leading strands become supercoiled, while in the lagging strands the Okazaki fragments have to first be ligated (Figure 4b). It is proposed that the four nascent strands exclude each other and fold into four individual blobs, screened-off from each other. Their intermingling would require extra excluded-volume interactions and thus, extra free energy (loss of entropy); as a result, the four nascent strands will remain separated in a minimum energy situation. During continued de novo DNA synthesis, the blobs may fold into four enlarging and separate domains stabilized by newly recruited nucleoid-associated proteins (NAPs; see review [52]) required for gene expression (Figure 4c).
By comparing the time of initiation and the time of duplication of fluorescent oriC-GFP spots in E. coli, it became evident that newly synthesized origins separate soon after their duplication [48], without a significant period of “cohesion”. It should be noted, however, that in several laboratories, data were obtained that were interpreted to indicate a period of cohesion [56,57,58]. An early separation, not necessarily incompatible with a transient cohesion period, is to be expected if the replicated origin-DNA in the replication bubble is more mobile than the two replisomes. This could be the case if the replisomes remain tethered to the compact mass of unreplicated parental DNA which they are reeling in. Tethering of the replisomes will force the duplicated origins to move apart (double arrow in Figure 4c). The expanding domains, enlarging through de novo DNA synthesis, will rearrange themselves in the long axis of the rod-shaped cell towards the two halves of the daughter nucleoids in a segregation process that requires no other driving force than continued replication (Figure 4a, panel 3). Similar ideas were expressed by Suckjoon Jun [45,59,60]. The hypothesis that segregation is merely driven by the process of de novo DNA synthesis and accumulation was previously proposed by Alan Grossman [61].
6. Conclusions
Studies of bacterial DNA organization and segregation exhibit two different views: either resolution and movement of replicated daughter strands is performed by a dedicated, active process based on DNA loop extrusions through structural maintenance of chromosome (SMC) complexes [62], or by the passive process of de novo DNA synthesis, as described here. If, in the replication bubble (Figure 4b), initial intermingling of the newly synthesized DNA strands would occur, it is to be expected that the entanglements could only be resolved with an elaborate mechanism of topoisomerases and SMC proteins [62]. However, the different physical properties of the nascent leading and lagging daughter strands (Figure 4b), together with different gene expression activities between the two replichores, could prevent the mixing of the four daughter strands right from the beginning. In that case, the secret of segregation lies in the build-up of the replication bubble: if no initial mixing occurs due to their different physical properties, they will become confined in four individual blobs (Figure 4c) that expand into individual domains (Figure 4a). A similar build-up of replication bubbles and early separation of strands could occur in eukaryotic chromosomes [63].
When a more detailed quantification of the number of proteins involved in the replication bubble will become available, calculations of the free energy state of the proposed four domains, as performed by Odijk for the whole nucleoid (compare Figure 3), could become possible. Such calculations might support the above proposal of passive DNA strand exclusion and formation of the four domains (Figure 4c) that gradually replace the parental nucleoid.
So far, microscopic observations have not given any indication for the existence of these domains. Further developments in spatial light interference microscopy [64], or digital holographic microscopy combined with optical diffraction tomography [65] and improved labeling techniques for nascent DNA strands [66] will be necessary to evaluate the above hypothesis of the four blobs initially created in the early replication bubble and developing into the four domains that end up in different halves of the two daughter nucleoids (Figure 4a).
Funding
This research received no external funding.
Institutional Review Board Statement
Not applicable.
Informed Consent Statement
Not applicable.
Data Availability Statement
Not applicable.
Acknowledgments
Nanne Nanninga, Arieh Zaritsky, Theo Odijk, Norman Grover, Vic Norris, Charles Helmstetter, Jim Walker and Suckjoon Jun are gratefully acknowledged for their encouragements and cooperations throughout the years. In addition, I thank Norbert Vischer, Peter Huls and Sebastian Robalino for discussions and help in preparing this manuscript. Leendert Hamoen is thanked for his hospitality in the laboratory of Bacterial Cell Biology of the University of Amsterdam.
Conflicts of Interest
The author declares no conflict of interest.
References
- Ryter, A.; Kellenberger, E.; Birch-Andersen, A.; Maaløe, O. Etude au microscope électronique de plasmas contenantde l’acide déoxyribonucléique. I. Les nucléoides des bactéries en croissance active. Z. Naturf. 1958, 13, 597–605. [Google Scholar] [CrossRef]
- Jacob, F.; Brenner, S.; Cuzin, F. On the regulation of DNA replication in bacteria. Cold Spring Harb. Symp. Quant. Biol. 1963, 28, 329–348. [Google Scholar] [CrossRef]
- van Iterson, W. Symposium on the fine structure of bacteria and their parts. II. Bacterial cytoplasm. Bacteriol. Rev. 1965, 29, 290–325. [Google Scholar] [CrossRef] [PubMed]
- Woldringh, C.L.; Nanninga, N. Structure of nucleoid and cytoplasm in the intact cell. In Molecular Cytology of Escherichia coli; Nanninga, N., Ed.; Academic Press: New York, NY, USA, 1985; pp. 161–197. [Google Scholar]
- Brakenhoff, G.J.; Blom, P.; Barends, P.J. Confocal scanning light microscopy with high aperture lenses. J. Microsc. 1979, 117, 219. [Google Scholar] [CrossRef]
- Valkenburg, J.A.C.; Woldringh, C.L.; Brakenhoff, G.J.; van der Voort, H.T.M.; Nanninga, N. Confocal scanning light microscopy of the Escherichia coli nucleoid: Comparison with phase-contrast and electron microscope images. J. Bacteriol. 1985, 161, 478–483. [Google Scholar] [CrossRef] [Green Version]
- Nanninga, N. Het Vertekende Beeld; Amsterdam University Press: Amsterdam, The Netherlands, 2007; pp. 123–132. [Google Scholar]
- Maaløe, O.; Kjeldgaard, N.O. The Control of Macromolecular Synthesis; W.A. Benjamin Inc.: New York, NY, USA, 1966. [Google Scholar]
- Helmstetter, H.E.; Cooper, S.; Pierucci, O.; Revelas, E. On the bacterial life sequence. Cold Spring Harb. Symp. Quant. Biol. 1968, 33, 809–822. [Google Scholar] [CrossRef] [PubMed]
- Woldringh, C.L. Morphological analysis of nuclear separation and cell division during the life cycle of Escherichia coli. J. Bacteriol. 1976, 125, 248–257. [Google Scholar] [CrossRef] [PubMed] [Green Version]
- Wijsman, H.J.W. A genetic map of several mutations affecting the mucopeptide layer of Escherichia coli. Genet. Res. 1972, 20, 65–74. [Google Scholar] [CrossRef]
- Kellenberger, E.; Arber, W. Electron microscopical studies of phage multiplication: I. A method for quantitative analysis of particle suspensions. Virology 1957, 3, 245–255. [Google Scholar] [CrossRef]
- Woldringh, C.L.; de Jong, M.A.; van den Berg, W.; Koppes, L. Morphological analysis of the division cycle of two Escherichia coli substrains during slow growth. J. Bacteriol. 1977, 131, 270–279. [Google Scholar] [CrossRef] [Green Version]
- Zaritsky, A.; Pritchard, R.H. Changes in cell size and shape associated with changes in the replication time of the chromosome of Escherichia coli. J. Bacteriol. 1973, 114, 824–837. [Google Scholar] [CrossRef] [Green Version]
- Zaritsky, A. On dimensional determination of rod-shaped bacteria. J. Theor. Biol. 1975, 54, 243–248. [Google Scholar] [CrossRef] [PubMed]
- Zaritsky, A.; Woldringh, C.L. Chromosome replication, cell growth, division and shape: A personal perspective. Front. Microbiol. 2015, 6, 756. [Google Scholar] [CrossRef] [Green Version]
- Zaritsky, A.; Woldringh, C.L.; Einav, M.; Alexeeva, S. Use of thymine limitation and thymine starvation to study bacterial physiology and cytology. J. Bacteriol. 2006, 188, 1667–1679. [Google Scholar] [CrossRef] [PubMed] [Green Version]
- Voorn, W.J.; Koppes, L.J.H.; Grover, N.B. Mathematics of cell division in Escherichia coli: Comparison between sloppy-size and incremental-size kinetics. Curr. Top. Mol. Gen. 1993, 1, 187–194. [Google Scholar]
- Koppes, L.J.H.; Woldringh, C.L.; Nanninga, N. Size variations and correlation of different cell cycle events in slow-growing Escherichia coli. J. Bacteriol. 1978, 134, 423–433. [Google Scholar] [CrossRef] [Green Version]
- Koppes, L.J.H.; Nanninga, N. Positive correlation between size at initiation of chromosome replication in Escherichia coli and and size at initiation of cell constriction. J. Bacteriol. 1980, 143, 89–99. [Google Scholar] [CrossRef] [PubMed] [Green Version]
- Amir, A. Cell size regulation in bacteria. Phys. Rev. Lett. 2014, 112, 208102. [Google Scholar] [CrossRef] [Green Version]
- Jun, S.; Taheri-Araghi, S. Cell-size maintenance: Universal strategy revealed. Trends Microbiol. 2014, 23, 4–6. [Google Scholar] [CrossRef] [Green Version]
- Taheri-Araghi, S.; Bradde, S.; Sauls, J.T.; Hill, N.S.; Levin, P.A.; Paulsson, J.; Vergassola, M.; Jun, S. Cell-size control and homeostasis. Curr. Biol. 2015, 25, 385–391. [Google Scholar]
- Huls, P.G.; Vischer, N.O.E.; Woldringh, C.L. Different amounts of DNA in newborn cells of Escherichia coli preclude a role for the chromosome in size control according to the “adder” model. Front. Microbiol. 2018, 9, 664. [Google Scholar] [CrossRef] [PubMed]
- Hansen, F.G.; Atlung, T. The DnaA tale. Front. Microbiol. 2018, 9, 319. [Google Scholar] [CrossRef] [PubMed] [Green Version]
- Tiruvadi-Krishnan, S.; Männik, J.; Kar, P.; Lin, J.; Amir, A.; Männik, J. Coupling between DNA replication, segregation, and the onset of constriction in Escherichia coli. Cell Rep. 2022, 38, 110539. [Google Scholar] [CrossRef]
- Vischer, N.O.E.; Huls, P.G.; Woldringh, C.L. Object-image: An interactive image analysis program using structured point collection. Binary 1994, 6, 160–166. [Google Scholar]
- Zaritsky, A.; Wang, P.; Vischer, N.O.E. Instructive simulation of the bacterial division cycle. Microbiology 2011, 157, 1876–1885. [Google Scholar] [CrossRef] [PubMed] [Green Version]
- Helmstetter, C.E.; Cooper, S. DNA synthesis during the division cycle of rapidly growing Escherichia coli B/R. J. Mol. Biol. 1968, 31, 507–518. [Google Scholar]
- Mulder, E.; Woldringh, C.L. Actively replicating nucleoids influence the positioning of division sites in DNA-less cell forming filaments of Escherichia coli. J. Bacteriol. 1989, 171, 4303–4314. [Google Scholar] [CrossRef] [PubMed] [Green Version]
- Woldringh, C.L.; Mulder, E.; Valkenburg, J.A.C.; Wientjes, F.B.; Zaritsky, A.; Nanninga, N. Role of nucleoid in toporegulation of division. Res. Microbiol. 1990, 141, 39–49. [Google Scholar] [CrossRef] [PubMed]
- Norris, V.; Madsen, M.S. Autocatalytic gene expression occurs via transertion and membrane domain formation and underlies differentiation in bacteria: A model. J. Mol. Biol. 1995, 253, 739–748. [Google Scholar] [CrossRef]
- Woldringh, C.L.; Zaritsky, A.; Grover, N.B. Nucleoid partitioning and the division plane in Escherichia coli. J. Bacteriol. 1994, 176, 6030–6038. [Google Scholar] [CrossRef] [Green Version]
- van Helvoort, J.M.L.M.; Kool, J.; Woldringh, C.L. Chloramphenicol causes fusion of separated nucleoids in Escherichia coli K-12 cells and filaments. J. Bacteriol. 1996, 178, 4289–4293. [Google Scholar] [CrossRef] [PubMed] [Green Version]
- van Helvoort, J.M.L.M.; Huls, P.G.; Vischer, N.O.E.; Woldringh, C.L. Fused nucleoids resegregate faster than cell elongation in Escherichia coli pbpB(Ts) filaments after release from chloramphenicol inhibition. Microbiology 1998, 144, 1309–1317. [Google Scholar] [CrossRef] [PubMed] [Green Version]
- Woldringh, C.L.; Hansen, F.G.; Vischer, N.O.E.; Atlung, T. Segregation of chromosome arms in growing and non-growing cells. Front. Microbiol. 2015, 6, 448. [Google Scholar] [CrossRef]
- Woldringh, C.L. The role of co-transcriptional translation and protein translocation (transertion) in bacterial chromosome segregation. Mol. Microbiol. 2002, 45, 17–29. [Google Scholar] [CrossRef] [PubMed]
- Valkenburg, J.A.C.; Woldringh, C.L. Phase separation between nucleoid and cytoplasm in Escherichia coli as defined by immersive refractometry. J. Bacteriol. 1984, 160, 1151–1157. [Google Scholar] [CrossRef] [Green Version]
- Bremer, H.; Dennis, P.D. Modulation of chemical composition and other parameters of the cell at different exponential growth rates. In EcoSal Plus; Slauch, J.M., Ed.; ASM Press: Washington, DC, USA, 2008. [Google Scholar] [CrossRef]
- Odijk, T. Osmotic compaction of supercoiled DNA into a bacterial nucleoid. Biophys. Chem. 1998, 73, 23–30. [Google Scholar] [CrossRef]
- Woldringh, C.L.; Odijk, T. Structure of DNA within the bacterial cell: Physics and physiology. In Organization of the Prokaryotic Genome; Charlebois, R.L., Ed.; American Society for Microbiology: Washington, DC, USA, 1999; Chapter 10; pp. 171–187. [Google Scholar]
- Mason, D.J.; Powelson, D.M. Nuclear division as observed in live bacteria by a new technique. J. Bacteriol. 1956, 71, 474–479. [Google Scholar] [CrossRef] [Green Version]
- Meijer, M.; de Jong, M.A.; Woldringh, C.L.; Nanninga, N. Factors affecting the release of folded chromosomes from Escherichia coli. Eur. J. Biochem. 1976, 63, 469–475. [Google Scholar]
- Sloof, P.; Maagdelijn, A.; Boswinkel, E. Folding of prokaryotic DNA: Isolation and characterization of nucleoids from Bacillus licheniformis. J. Mol. Biol. 1983, 163, 277–297. [Google Scholar] [CrossRef]
- Pelletier, J.; Halvorsen, K.; Ha, B.-Y.; Paparcone, R.; Sandler, S.J.; Woldringh, C.L.; Wong, W.P.; Jun, S. Physical manipulation of the Escherichia coli chromosome reveals its soft nature. Proc. Natl. Acad. Sci. USA 2012, 109, E2649–E2656. [Google Scholar] [CrossRef] [Green Version]
- Cunha, S.; Woldringh, C.L.; Odijk, T. Polymer-mediated compaction and internal dynamics of isolated Escherichia coli nucleoids. J. Struct. Biol. 2001, 136, 53–66. [Google Scholar] [CrossRef]
- Cunha, S.; Woldringh, C.L.; Odijk, T. Restricted diffusion of DNA segments within the isolated Escherichia coli nucleoid. J. Struct. Biol. 2005, 150, 226–232. [Google Scholar] [CrossRef] [PubMed]
- Elmore, S.; Müller, M.; Vischer, N.O.E.; Odijk, T.; Woldringh, C.L. Single-particle tracking of oriC-GFP fluorescent spots during chromosome segregation in Escherichia coli. J. Struct. Biol. 2005, 151, 275–287. [Google Scholar] [CrossRef] [PubMed]
- Wegner, A.S.; Alexeeva, S.; Odijk, T.; Woldringh, C.L. Characterization of Escherichia coli nucleoids released by osmotic shock. J. Struct. Biol. 2012, 178, 260–269. [Google Scholar] [CrossRef]
- Nielsen, H.J.; Ottesen, J.R.; Youngren, B.; Austin, S.J.; Hansen, F.G. The Escherichia coli chromosome is organized with the left and right chromosome arms in separate cell halves. Mol. Microbiol. 2006, 62, 331–338. [Google Scholar] [CrossRef]
- Wang, X.; Liu, X.; Possoz, C.; Sherratt, D.J. The two Escherichia coli chromosome arms locate to separate cell halves. Gen. Dev. 2006, 20, 1727–1731. [Google Scholar] [CrossRef] [Green Version]
- Norris, V.; Kayser, C.; Muskhelishvili, G.; Konto-Ghiorghi, Y. The roles of nucleoid-associated proteins and topoisomerases in chromosome structure, strand segregation, and the generation of phenotypic heterogeneity in bacteria. FEMS Microbiol. Rev. 2022, fuac049. [Google Scholar] [CrossRef]
- Reyes-Lamothe, R.; Wang, X.; Sherratt, D. Escherichia coli and its chromosome. Trends Microbiol. 2008, 16, 238–245. [Google Scholar] [CrossRef]
- Wang, X.; Rudner, D.Z. Spatial organization of bacterial chromosomes. Curr. Opin. Microbiol. 2014, 22, 66–72. [Google Scholar] [CrossRef] [Green Version]
- Leonard, A.C.; Grimwade, J.E. The orisome: Structure and function. Front. Microbiol. 2015, 6, 545. [Google Scholar] [CrossRef] [PubMed] [Green Version]
- Bates, D.; Kleckner, N. Chromosome and replisome dynamics in E. coli: Loss of sister cohesion triggers global chromosome movement and mediates chromosome segregation. Cell 2005, 121, 899–911. [Google Scholar] [CrossRef] [PubMed] [Green Version]
- Joshi, M.C.; Magnan, D.; Montminy, T.P.; Lies, M.; Stepankiw, N.; Bates, D. Regulation of sister chromosome cohesion by the replication fork tracking protein SeqA. PLoS Genet. 2013, 9, e1003673. [Google Scholar] [CrossRef] [PubMed] [Green Version]
- Wang, X.; Reyes-Lamothe, R.; Sherratt, D.J. Modulation of Escherichia coli sister chromosome cohesion by topoisomerase IV. Genes Dev. 2008, 22, 2426–2433. [Google Scholar] [CrossRef] [Green Version]
- Jun, S.; Mulder, B. Entropy-driven spatial organization of highly confined polymers: Lessons for the bacterial chromosome. Proc. Natl. Acad. Sci. USA 2006, 103, 12388–12393. [Google Scholar] [CrossRef] [PubMed] [Green Version]
- Jun, S. Chromosome, cell cycle and entropy. Biophys. J. 2015, 108, 785–786. [Google Scholar] [CrossRef] [Green Version]
- Lemon, K.P.; Grossman, A.D. The extrusion-capture model for chromosome partitioning in bacteria. Genes Develop. 2001, 15, 2031–2041. [Google Scholar] [CrossRef] [Green Version]
- Gogou, C.H.; Japaridze, A.; Dekker, C. Mechanisms for chromosome segregation in bacteris. Front. Microbiol. 2021, 12, 685687. [Google Scholar] [CrossRef]
- Hirano, T. Condensin-based chromosome organization from bacteria to vertebrates. Cell 2016, 164, 847–857. [Google Scholar] [CrossRef] [Green Version]
- Mir, M.; Babacan, S.D.; Bednarz, M.; Do, M.N.; Golding, I.; Popescu, G. Visualizing Escherichia coli Sub-Cellular Structure Using Sparse Deconvolution Spatial Light Interference Tomography. PLoS ONE 2012, 7, e39816. [Google Scholar] [CrossRef] [Green Version]
- Oh, J.; Sung Ryu, J.; Lee, M.; Jung, J.; Han, S.Y.; Jung Chung, H.; Park, Y. Three-dimsional label-free observation of individual bacteria upon antibiotic treatment using optical diffraction tomography. Biomed. Opt. Express 2020, 11, 1257–1267. [Google Scholar] [CrossRef]
- Spahn, C.H.; Glaesmann, M.; Grimm, J.B.; Ayala, A.X.; Lavis, L.D.; Heilemann, M. A toolbox for multiplexed super-resolution imaging of the E. coli nucleoid and membrane using novel PAINT labels. Sci. Rep. 2018, 8, 14768. [Google Scholar] [CrossRef] [PubMed] [Green Version]
Figure 1.
(a,b) Electron micrographs of T2r-bacteriophages, taken by N. Nanninga, 28 March 1966. The preparations were negatively stained with phosphotungstic acid and photographed at an instrumental magnification of 40,000×. (c) Electron micrograph of a thin section of E. coli K-12, fixed with osmium tetroxide according to the Ryter–Kellenberger conditions [1]. White arrow points to a presumed DNA-membrane connection.

Figure 3.
Description of DNA–DNA and DNA–protein interactions that contribute to a phase separation between nucleoid and cytoplasm. (a) When the supercoiled DNA is introduced into an empty cell, free energy is stored because the expansion of the network due to the colliding supercoil segments (indicated by double arrows) has to be overcome. (b) When, in addition, many proteins are introduced into the cell, a free energy increase occurs that is associated with the cross-interactions between proteins and the DNA helix, both exhibiting an electrostatic depletion radius, indicated by the green zone around the DNA chains. This cross-interaction energy overwhelms the self-interaction energy in (a), leading to an unstable situation. (c) To minimize the free energy of the total system, a phase separation is established in which the DNA is compacted in a smaller volume with decreased protein-DNA cross-interactions. The latter is obtained because overlapping depletion zones (green areas) between the DNA strands in the compacted nucleoid, squeeze-out (deplete) proteins, resulting in a lower protein concentration and in ~30% reduction in nucleoid density as shown in phase-contrast images [38,42].

Figure 4.
Segregation of chromosome arms in E. coli. (a) In newborn cells, the two replichores (red and blue) occupy separate regions within the nucleoid as documented in [50,51]. Colored triangles are the replisomes duplicating the left (L; red) and right (R; blue) chromosome arms. The duplicated origins (green circles) lie in between, giving the pattern L-O-O-R (panel 1). Note the replacement of the unreplicated, parental nucleoids (light colors) by the newly synthesized DNA (dark colors). The two pairs of replichores that are synthesized in the replication bubble are assumed not to become mixed or entangled, but to form four individual domains (dark-colored circles in panel 2; see text) in a transversal arrangement [53,54]. De novo DNA synthesis expands and rearranges the domains (panel 3); they end up as four separate domains in each half of the two daughter nucleoids (panel 4). (b) Schematic representation of the replication bubble or orisome [55], ~30 s after initiation, when 10 Okazaki fragments have been synthesized. Physical differences between leading and lagging strands are proposed to prevent the mixing of the nascent strands (see text). (c) Hypothetical representation of the same replication bubble as in (b), consisting of four enlarging blobs (filled circles) that do not mix. The length of DNA (~10 µm) synthesized in 30 s (see (b)) is drawn as a spherical blob with a volume of 0.0014 µm3 (cf. volume non-replicating nucleoid of 0.24 µm3; calculation to be published elsewhere). Due to tethering of the replisomes to parental DNA, the origins between the nascent domains are pushed apart (indicated by double arrow). During continued DNA synthesis the blobs fold into enlarging domains (see (a), panel 2 and 3).

Disclaimer/Publisher’s Note: The statements, opinions and data contained in all publications are solely those of the individual author(s) and contributor(s) and not of MDPI and/or the editor(s). MDPI and/or the editor(s) disclaim responsibility for any injury to people or property resulting from any ideas, methods, instructions or products referred to in the content. |
© 2023 by the author. Licensee MDPI, Basel, Switzerland. This article is an open access article distributed under the terms and conditions of the Creative Commons Attribution (CC BY) license (https://creativecommons.org/licenses/by/4.0/).
Share and Cite
MDPI and ACS Style
Woldringh, C.L. The Bacterial Nucleoid: From Electron Microscopy to Polymer Physics—A Personal Recollection. Life 2023, 13, 895. https://doi.org/10.3390/life13040895
AMA Style
Woldringh CL. The Bacterial Nucleoid: From Electron Microscopy to Polymer Physics—A Personal Recollection. Life. 2023; 13(4):895. https://doi.org/10.3390/life13040895
Chicago/Turabian StyleWoldringh, Conrad L. 2023. "The Bacterial Nucleoid: From Electron Microscopy to Polymer Physics—A Personal Recollection" Life 13, no. 4: 895. https://doi.org/10.3390/life13040895
Note that from the first issue of 2016, this journal uses article numbers instead of page numbers. See further details here.