
Assessment of the Association between Entropy in PET/CT and Response to Anti-PD-1/PD-L1 Monotherapy in Stage III or IV NSCLC
 , ,
, ,
Abstract
:1. Introduction
2. Materials and Methods
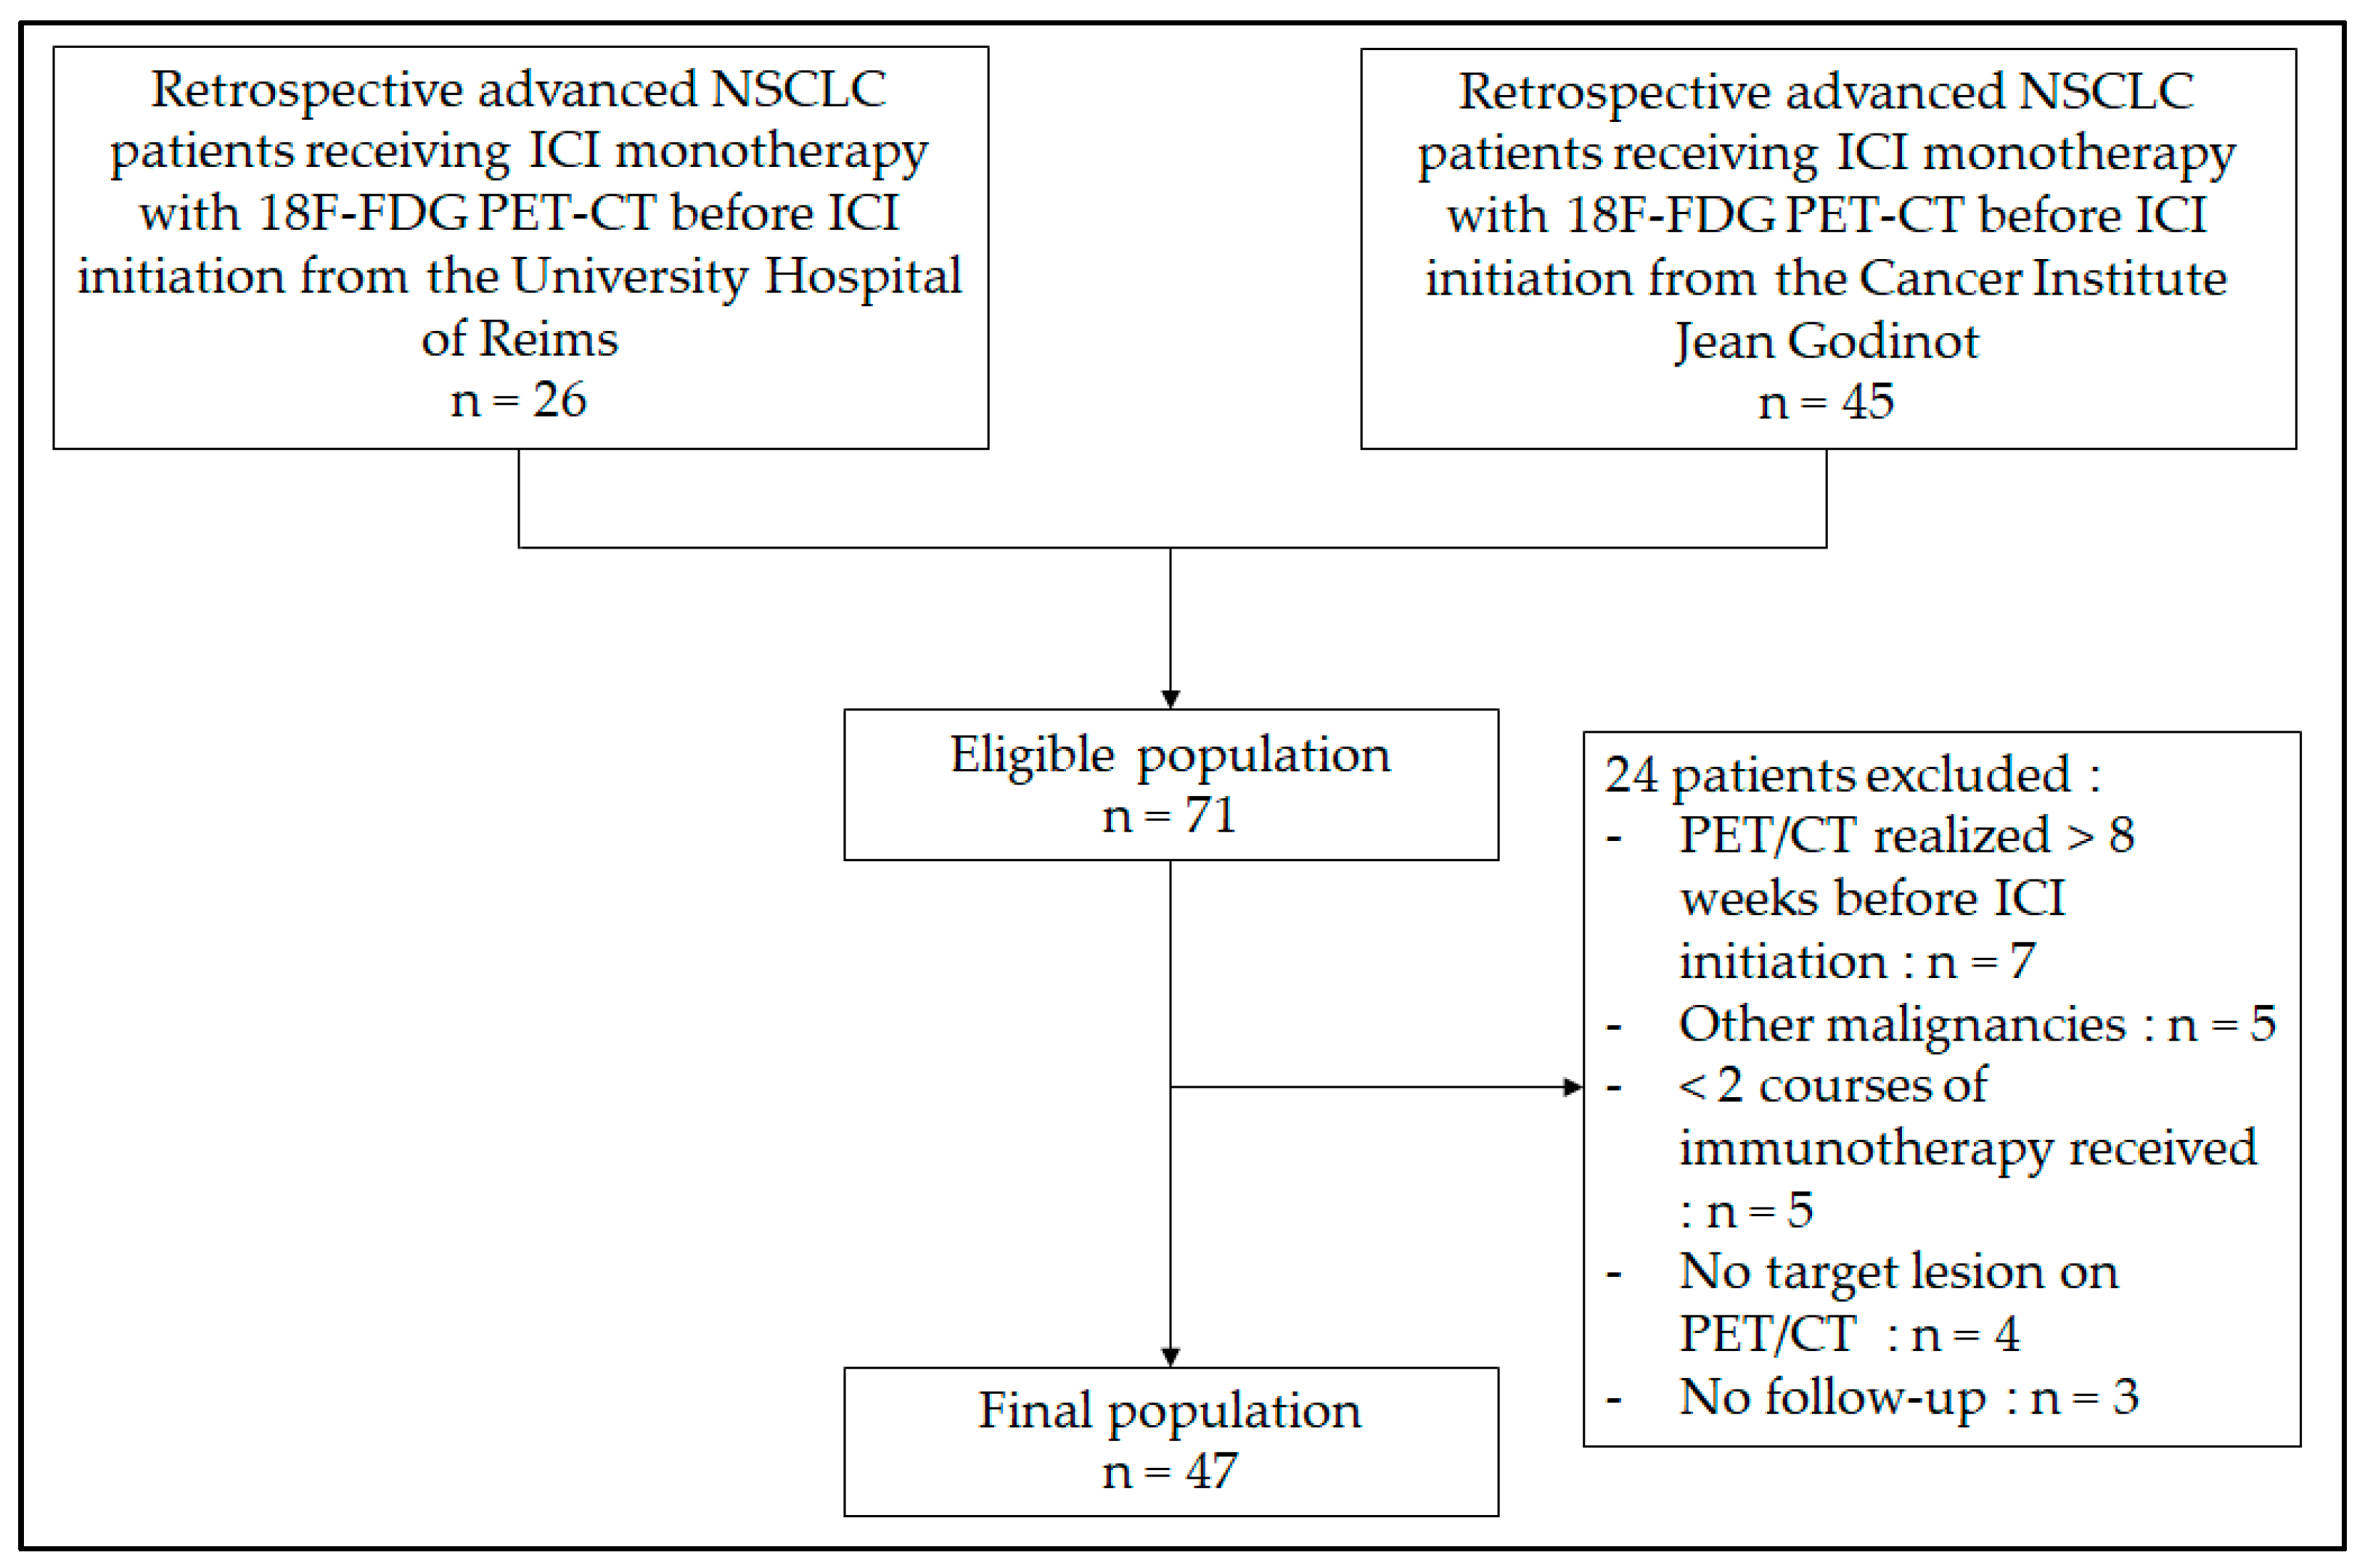
2.1. Population
2.2. Study Protocol
2.3. Image Acquisition and Analysis
2.4. Radiomic Feature Extraction
2.5. Statistical Analyses
3. Results
3.1. Population Characteristics
3.2. PET/CT, Follow-Up, and Response to Immunotherapy
3.3. Radiomics Analysis
4. Discussion
5. Conclusions
Supplementary Materials
Author Contributions
Funding
Institutional Review Board Statement
Informed Consent Statement
Data Availability Statement
Conflicts of Interest
References
- Siegel, R.L.; Miller, K.D.; Fuchs, H.E.; Jemal, A. Cancer statistics, 2022. CA Cancer J. Clin. 2022, 72, 7–33. [Google Scholar] [CrossRef] [PubMed]
- Howlader, N.; Forjaz, G.; Mooradian, M.J.; Meza, R.; Kong, C.Y.; Cronin, K.A.; Mariotto, A.B.; Lowy, D.R.; Feuer, E.J. The Effect of Advances in Lung-Cancer Treatment on Population Mortality. N. Engl. J. Med. 2020, 383, 640–649. [Google Scholar] [CrossRef] [PubMed]
- Nardone, V.; Tini, P.; Pastina, P.; Botta, C.; Reginelli, A.; Carbone, S.F.; Giannicola, R.; Calabrese, G.; Tebala, C.; Guida, C.; et al. Radiomics predicts survival of patients with advanced non-small cell lung cancer undergoing PD-1 blockade using Nivolumab. Oncol. Lett. 2019, 19, 1559–1566. [Google Scholar] [CrossRef]
- Sacher, A.G.; Gandhi, L. Biomarkers for the Clinical Use of PD-1/PD-L1 Inhibitors in Non–Small-Cell Lung Cancer: A Review. JAMA Oncol. 2016, 2, 1217. [Google Scholar] [CrossRef]
- Scrivener, M.; de Jong, E.E.C.; van Timmeren, J.E.; Pieters, T.; Ghaye, B.; Geets, X. Radiomics applied to lung cancer: A review. Transl. Cancer Res. 2016, 5, 398–409. [Google Scholar] [CrossRef]
- Gillies, R.J.; Kinahan, P.E.; Hricak, H. Radiomics: Images Are More than Pictures, They Are Data. Radiology 2016, 278, 563–577. [Google Scholar] [CrossRef] [PubMed]
- Coroller, T.P.; Grossmann, P.; Hou, Y.; Velazquez, E.R.; Leijenaar, R.T.; Hermann, G.; Lambin, P.; Haibe-Kains, B.; Mak, R.H.; Aerts, H.J. CT-based radiomic signature predicts distant metastasis in lung adenocarcinoma. Radiother. Oncol. 2015, 114, 345–350. [Google Scholar] [CrossRef]
- Vicini, S.; Bortolotto, C.; Rengo, M.; Ballerini, D.; Bellini, D.; Carbone, I.; Preda, L.; Laghi, A.; Coppola, F.; Faggioni, L. A narrative review on current imaging applications of artificial intelligence and radiomics in oncology: Focus on the three most common cancers. Radiol. Med. 2022, 127, 819–836. [Google Scholar] [CrossRef]
- Aerts, H.J.; Velazquez, E.R.; Leijenaar, R.T.; Parmar, C.; Grossmann, P.; Carvalho, S.; Bussink, J.; Monshouwer, R.; Haibe-Kains, B.; Rietveld, D.; et al. Decoding tumour phenotype by noninvasive imaging using a quantitative radiomics approach. Nat. Commun. 2014, 5, 4006. [Google Scholar] [CrossRef]
- Lubner, M.G.; Smith, A.D.; Sandrasegaran, K.; Sahani, D.V.; Pickhardt, P.J. CT Texture Analysis: Definitions, Applications, Biologic Correlates, and Challenges. RadioGraphics 2017, 37, 1483–1503. [Google Scholar] [CrossRef]
- Coroller, T.P.; Agrawal, V.; Narayan, V.; Hou, Y.; Grossmann, P.; Lee, S.W.; Mak, R.H.; Aerts, H.J. Radiomic phenotype features predict pathological response in non-small cell lung cancer. Radiother. Oncol. 2016, 119, 480–486. [Google Scholar] [CrossRef]
- Sacconi, B.; Anzidei, M.; Leonardi, A.; Boni, F.; Saba, L.; Scipione, R.; Anile, M.; Rengo, M.; Longo, F.; Bezzi, M.; et al. Analysis of CT features and quantitative texture analysis in patients with lung adenocarcinoma: A correlation with EGFR mutations and survival rates. Clin. Radiol. 2017, 72, 443–450. [Google Scholar] [CrossRef] [PubMed]
- El Naqa, I.; Grigsby, P.W.; Apte, A.; Kidd, E.; Donnelly, E.; Khullar, D.; Chaudhari, S.; Yang, D.; Schmitt, M.; Laforest, R.; et al. Exploring feature-based approaches in PET images for predicting cancer treatment outcomes. Pattern Recognit. 2009, 42, 1162–1171. [Google Scholar] [CrossRef] [PubMed]
- Van Helden, E.J.; Vacher, Y.J.L.; Van Wieringen, W.N.; Van Velden, F.H.P.; Verheul, H.M.W.; Hoekstra, O.S.; Boellaard, R.; Menke-van der Houven van Oordt, C.W. Radiomics analysis of pre-treatment [18F]FDG PET/CT for patients with metastatic colorectal cancer undergoing palliative systemic treatment. Eur. J. Nucl. Med. Mol. Imaging 2018, 45, 2307–2317. [Google Scholar] [CrossRef] [PubMed]
- Tixier, F.; Le Rest, C.C.; Hatt, M.; Albarghach, N.; Pradier, O.; Metges, J.P.; Corcos, L.; Visvikis, D. Intratumor Heterogeneity Characterized by Textural Features on Baseline 18 F-FDG PET Images Predicts Response to Concomitant Radiochemotherapy in Esophageal Cancer. J. Nucl. Med. 2011, 52, 369–378. [Google Scholar] [CrossRef]
- Mu, W.; Tunali, I.; Gray, J.E.; Qi, J.; Schabath, M.B.; Gillies, R.J. Radiomics of 18F-FDG PET/CT images predicts clinical benefit of advanced NSCLC patients to checkpoint blockade immunotherapy. Eur. J. Nucl. Med. Mol. Imaging 2020, 47, 1168–1182. [Google Scholar] [CrossRef]
- Desseroit, M.C.; Tixier, F.; Weber, W.A.; Siegel, B.A.; Le Rest, C.C.; Visvikis, D.; Hatt, M. Reliability of PET/CT Shape and Heterogeneity Features in Functional and Morphologic Components of Non–Small Cell Lung Cancer Tumors: A Repeatability Analysis in a Prospective Multicenter Cohort. J. Nucl. Med. 2017, 58, 406–411. [Google Scholar] [CrossRef]
- Valentinuzzi, D.; Vrankar, M.; Boc, N.; Ahac, V.; Zupančič, Ž.; Unk, M.; Škalič, K.; Žagar, I.; Studen, A.; Simončič, U.; et al. [18F]FDG PET immunotherapy radiomics signature (iRADIOMICS) predicts response of non-small-cell lung cancer patients treated with pembrolizumab. Radiol. Oncol. 2020, 54, 285–294. [Google Scholar] [CrossRef]
- Moubtakir, A.; Chrusciel, J.; Lalire, P.; El Farsaoui, K.; Legendre, A.; Debreuve, A.; Dewolf, M.; Huglo, D.; Petyt, G.; Morland, D.; et al. Analyse texturale en TEP au FDG des cancers pulmonaires non à petites cellules de stade localement avancé: Valeur pronostique de l’entropie. Médecine Nucl. 2020, 44, 18–25. [Google Scholar] [CrossRef]
- Eisenhauer, E.A.; Therasse, P.; Bogaerts, J.; Schwartz, L.H.; Sargent, D.; Ford, R.; Dancey, J.; Arbuck, S.; Gwyther, S.; Mooney, M.; et al. New response evaluation criteria in solid tumours: Revised RECIST guideline (version 1.1). Eur. J. Cancer 2009, 45, 228–247. [Google Scholar] [CrossRef]
- Boellaard, R.; Delgado-Bolton, R.; Oyen, W.J.; Giammarile, F.; Tatsch, K.; Eschner, W.; Verzijlbergen, F.J.; Barrington, S.F.; Pike, L.C.; Weber, W.A.; et al. FDG PET/CT: EANM procedure guidelines for tumour imaging: Version 2.0. Eur. J. Nucl. Med. Mol. Imaging 2015, 42, 328–354. [Google Scholar] [CrossRef] [PubMed]
- Takada, K.; Toyokawa, G.; Yoneshima, Y.; Tanaka, K.; Okamoto, I.; Shimokawa, M.; Wakasu, S.; Haro, A.; Osoegawa, A.; Tagawa, T.; et al. 18F-FDG uptake in PET/CT is a potential predictive biomarker of response to anti-PD-1 antibody therapy in non-small cell lung cancer. Sci. Rep. 2019, 9, 13362. [Google Scholar] [CrossRef] [PubMed]
- Evangelista, L.; Cuppari, L.; Menis, J.; Bonanno, L.; Reccia, P.; Frega, S.; Pasello, G. 18F-FDG PET/CT in non-small-cell lung cancer patients: A potential predictive biomarker of response to immunotherapy. Nucl. Med. Commun. 2019, 40, 802–807. [Google Scholar] [CrossRef] [PubMed]
- Polverari, G.; Ceci, F.; Bertaglia, V.; Reale, M.L.; Rampado, O.; Gallio, E.; Passera, R.; Liberini, V.; Scapoli, P.; Arena, V.; et al. 18F-FDG Pet Parameters and Radiomics Features Analysis in Advanced Nsclc Treated with Immunotherapy as Predictors of Therapy Response and Survival. Cancers 2020, 12, 1163. [Google Scholar] [CrossRef]
- Chardin, D.; Paquet, M.; Schiappa, R.; Darcourt, J.; Bailleux, C.; Poudenx, M.; Sciazza, A.; Ilie, M.; Benzaquen, J.; Martin, N.; et al. Baseline metabolic tumor volume as a strong predictive and prognostic biomarker in patients with non-small cell lung cancer treated with PD1 inhibitors: A prospective study. J. Immunother. Cancer 2020, 8, e000645. [Google Scholar] [CrossRef] [PubMed]
- Seban, R.D.; Mezquita, L.; Berenbaum, A.; Dercle, L.; Botticella, A.; Le Pechoux, C.; Caramella, C.; Deutsch, E.; Grimaldi, S.; Adam, J.; et al. Baseline metabolic tumor burden on FDG PET/CT scans predicts outcome in advanced NSCLC patients treated with immune checkpoint inhibitors. Eur. J. Nucl. Med. Mol. Imaging 2020, 47, 1147–1157. [Google Scholar] [CrossRef] [PubMed]
- Monaco, L.; Gemelli, M.; Gotuzzo, I.; Bauckneht, M.; Crivellaro, C.; Genova, C.; Cortinovis, D.; Zullo, L.; Ammoni, L.C.; Bernasconi, D.P.; et al. Metabolic Parameters as Biomarkers of Response to Immunotherapy and Prognosis in Non-Small Cell Lung Cancer (NSCLC): A Real World Experience. Cancers 2021, 13, 1634. [Google Scholar] [CrossRef]
- Han, S.; Woo, S.; Suh, C.H.; Kim, Y.J.; Oh, J.S.; Lee, J.J. A systematic review of the prognostic value of texture analysis in 18F-FDG PET in lung cancer. Ann. Nucl. Med. 2018, 32, 602–610. [Google Scholar] [CrossRef] [PubMed]
- Huang, A.C.; Postow, M.A.; Orlowski, R.J.; Mick, R.; Bengsch, B.; Manne, S.; Xu, W.; Harmon, S.; Giles, J.R.; Wenz, B.; et al. T-cell invigoration to tumour burden ratio associated with anti-PD-1 response. Nature 2017, 545, 60–65. [Google Scholar] [CrossRef]
- Grootjans, W.; Tixier, F.; van der Vos, C.S.; Vriens, D.; Le Rest, C.C.; Bussink, J.; Oyen, W.J.; de Geus-Oei, L.F.; Visvikis, D.; Visser, E.P. The Impact of Optimal Respiratory Gating and Image Noise on Evaluation of Intratumor Heterogeneity on 18 F-FDG PET Imaging of Lung Cancer. J. Nucl. Med. 2016, 57, 1692–1698. [Google Scholar] [CrossRef]
- Orlhac, F.; Soussan, M.; Chouahnia, K.; Martinod, E.; Buvat, I. 18F-FDG PET-Derived Textural Indices Reflect Tissue-Specific Uptake Pattern in Non-Small Cell Lung Cancer. PLoS ONE 2015, 10, e0145063. [Google Scholar] [CrossRef] [PubMed]
- Mulkey, F.; Theoret, M.R.; Keegan, P.; Pazdur, R.; Sridhara, R. Comparison of iRECIST versus RECIST V.1.1 in patients treated with an anti-PD-1 or PD-L1 antibody: Pooled FDA analysis. J. Immunother. Cancer 2020, 8, e000146. [Google Scholar] [CrossRef] [PubMed]


| Characteristics | Value |
|---|---|
| Age | |
| Median (range)-year | 64 (32–84) |
| Distribution-n (%) | |
| <65 year | 25 (53.2) |
| ≥65 year | 22 (46.8) |
| Sex-n (%) | |
| Male | 33 (70.2) |
| Female | 14 (29.8) |
| ECOG 1 performance status score-n (%) | |
| 0 | 16 (34.0) |
| 1 | 21 (44.7) |
| 2 | 9 (19.2) |
| 3 | 1 (2.1) |
| Histologic type of tumor-n (%) | |
| Adenocarcinoma | 30 (63.8) |
| Squamous cell carcinoma | 15 (31.9) |
| Other (poorly differentiated, not otherwise specified) | 2 (4.3) |
| Smoking status-n (%) | |
| Never smoked | 6 (12.8) |
| Current or former smoker | 40 (85.1) |
| Unknown | 1 (2.1) |
| PD-L1 expression level-n (%) | |
| <1% | 11 (23.4) |
| 1–49% | 7 (14.9) |
| ≥50% | 15 (31.9) |
| Unknown | 14 (29.8) |
| Immunotherapy-n (%) | |
| Atezolizumab | 2 (4.3) |
| Nivolumab | 25 (53.2) |
| Pembrolizumab | 20 (42.5) |
| Lines of previous systemic therapy-n (%) | |
| 0 | 15 (31.9) |
| 1 | 19 (40.4) |
| ≥ 2 | 13 (27.7) |
| PET Parameters | Minimum | Median | Maximum |
|---|---|---|---|
| SUVmax (g/mL) | 2.07 | 10.92 | 37.03 |
| SUVmean (g/mL) | 0.64 | 2.77 | 5.97 |
| TLG (g) | 4.12 | 142.36 | 4053.43 |
| MTV (mL) | 2.14 | 54.07 | 1696.19 |
| GLCM-entropy | 2.30 | 5.78 | 7.81 |
| GLRLM-SRE | 0.53 | 0.81 | 0.92 |
| PET Parameters | Status | Median | p Value |
|---|---|---|---|
| SUVmax (g/mL) | PD | 8.02 | 0.103 |
| Non-PD | 13.04 | ||
| SUVmean (g/mL) | PD | 2.54 | 0.519 |
| Non-PD | 2.89 | ||
| TLG (g) | PD | 192.54 | 0.428 |
| Non-PD | 105.28 | ||
| MTV (mL) | PD | 57.63 | 0.346 |
| Non-PD | 30.87 | ||
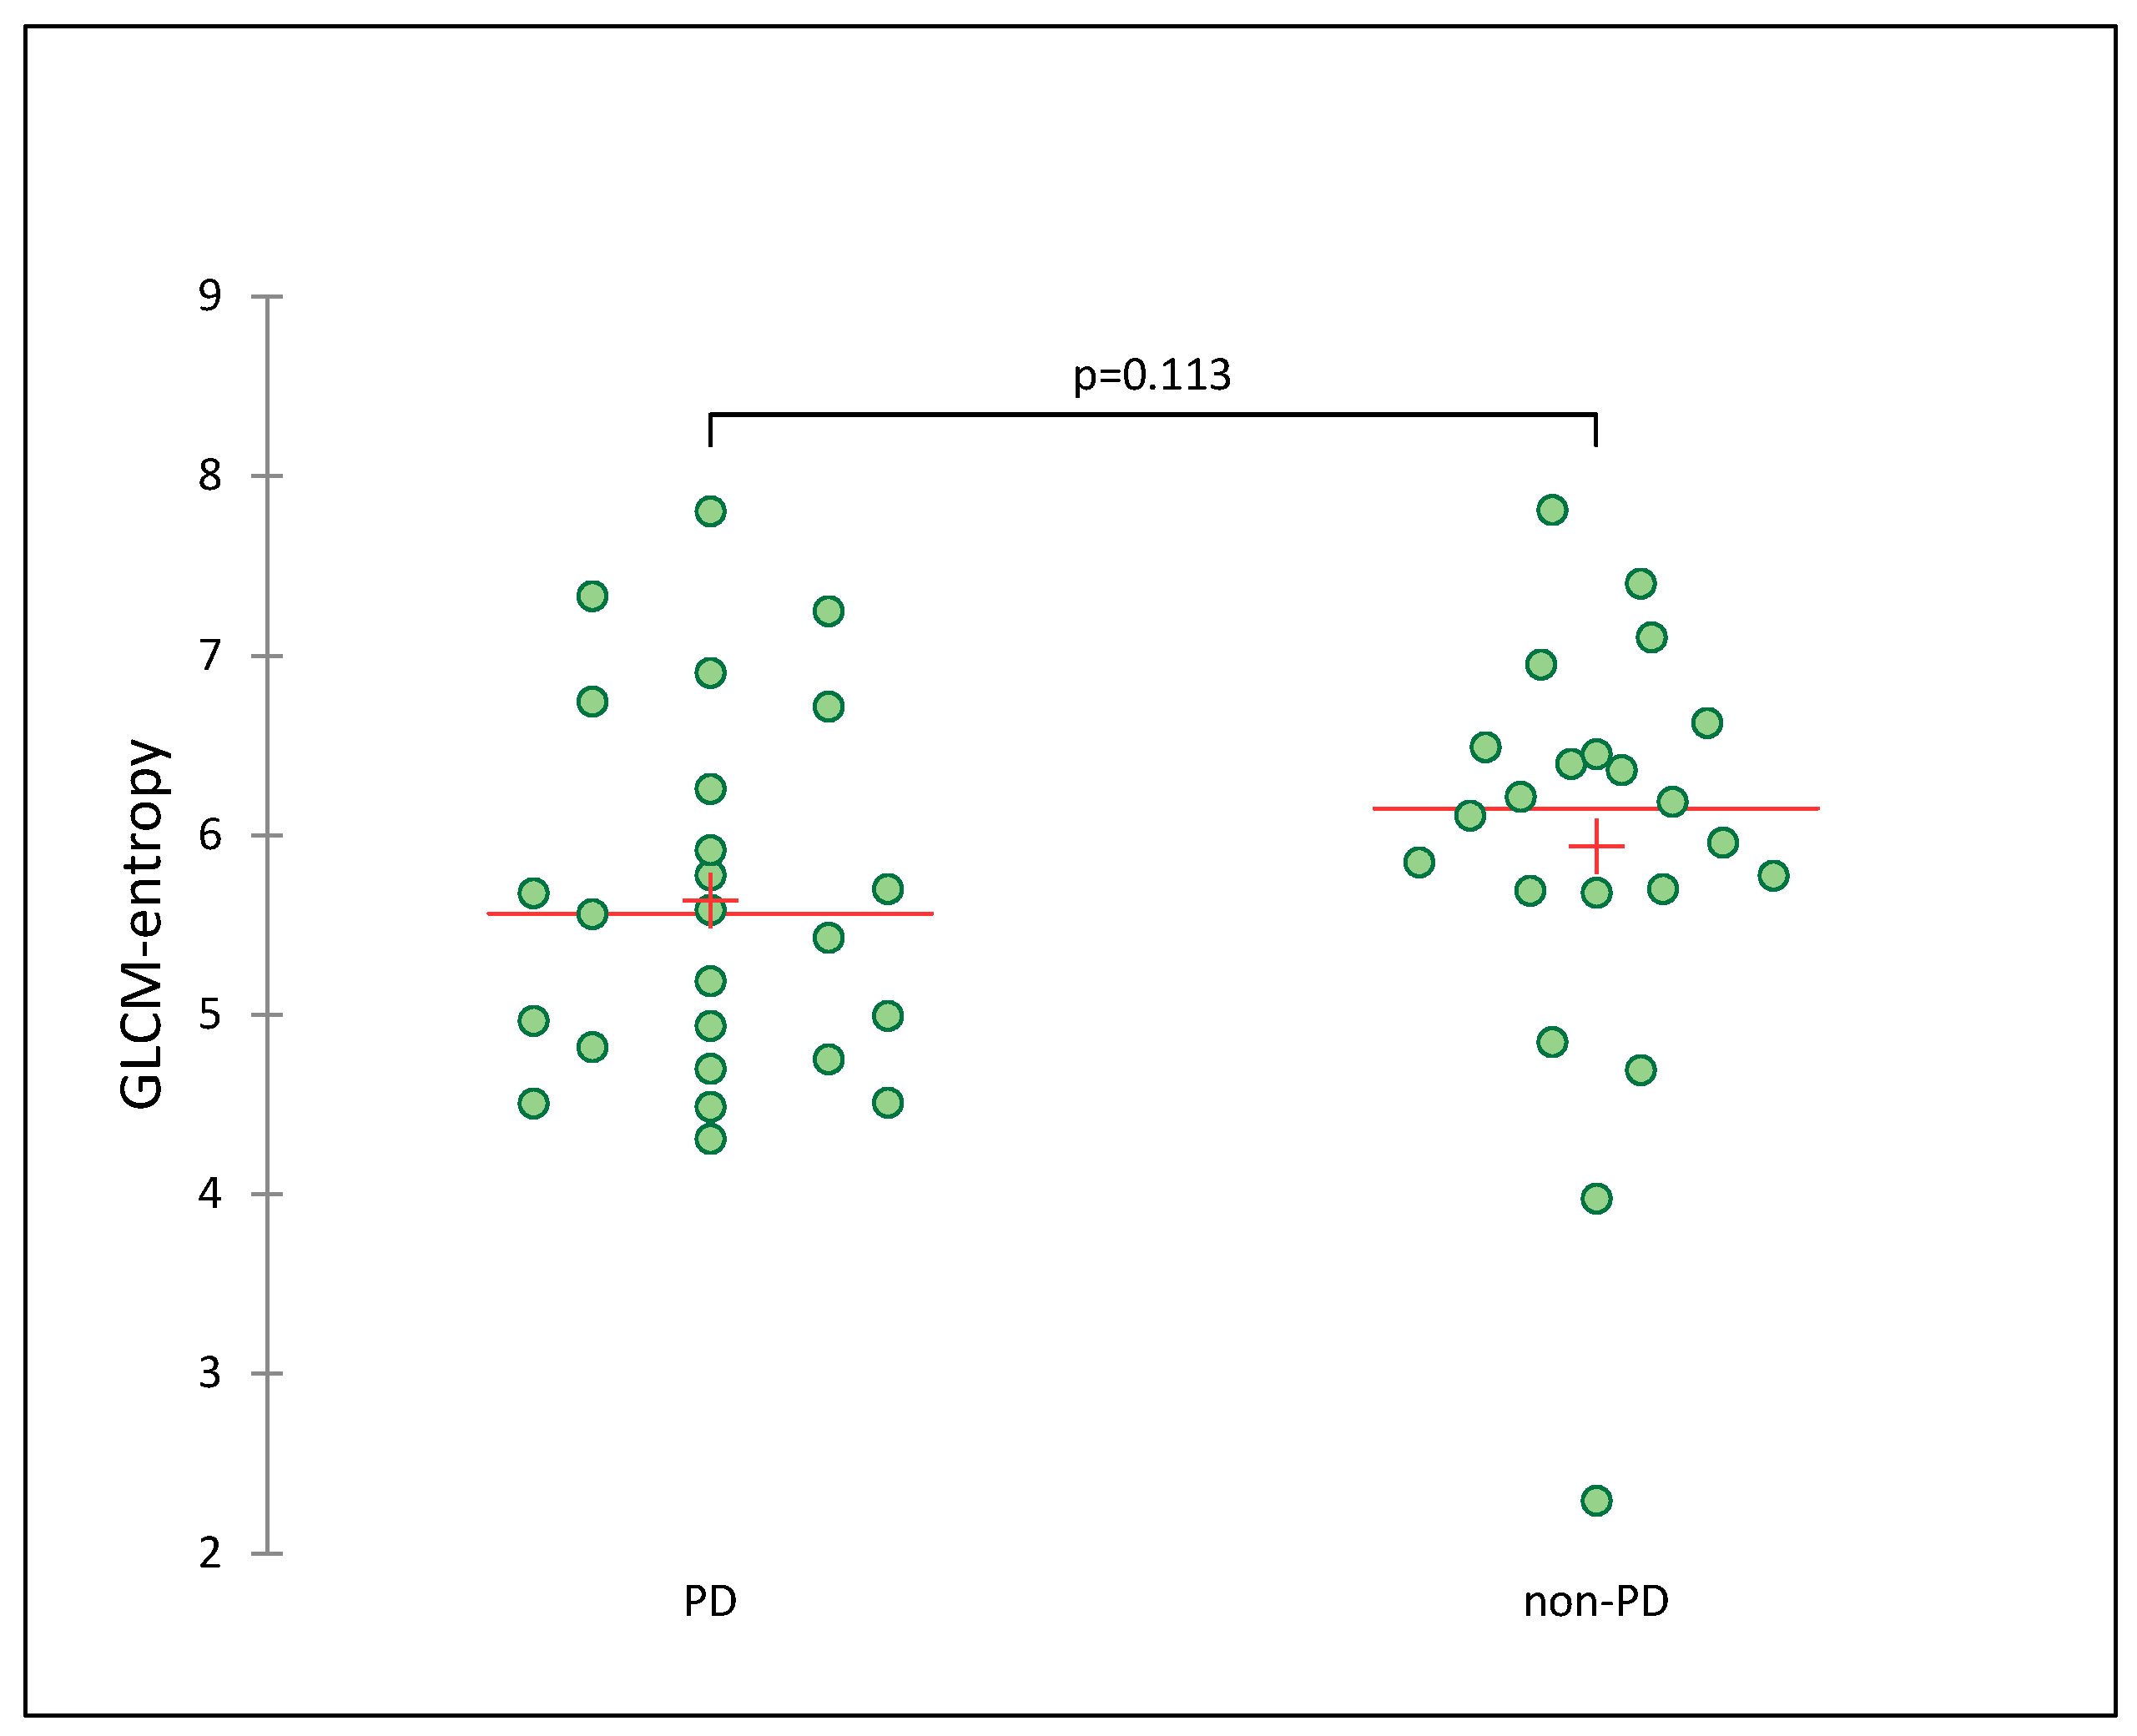
| GLCM-entropy | PD | 5.56 | 0.113 |
| Non-PD | 6.15 | ||
| GLRLM-SRE | PD | 0.80 | 0.727 |
| Non-PD | 0.81 |
| Characteristics | Value | p-Value | |
|---|---|---|---|
| GLCM-Entropy | |||
| <median (n = 24) | ≥median (n = 23) | ||
| Age | |||
| Median (range)-year | 64 (44–84) | 64 (32–82) | 0.975 |
| Sex-n (%) | |||
| Male | 17 (70.8) | 16 (69.6) | 0.924 |
| Female | 7 (29.2) | 7 (30.4) | |
| ECOG 1 performance status score-n (%) | |||
| 0 | 8 (33.3) | 8 (34.8) | 0.677 |
| 1 | 10 (41.7) | 11 47.8) | |
| 2 | 5 (20.8) | 4 17.4) | |
| 3 | 1 (4.2) | 0 (0) | |
| Histologic type of tumor-n (%) | |||
| Adenocarcinoma | 17 (70.8) | 13 (63.8) | 0.572 |
| Squamous cell carcinoma | 6 (25.0) | 9 (31.9) | |
| Other (poorly differentiated, not otherwise specified) | 1 (4.2) | 1 (4.3) | |
| Smoking status-n (%) | |||
| Never smoked | 2 (8.3) | 4 (17.4)) | 0.472 |
| Current or former smoker | 22 (91.7) | 18 (78.3) | |
| Unknown | 0 (0) | 1 (4.3) | |
| PD-L1 expression level-n (%) | |||
| <1% | 6 (25.0) | 5 (21.7) | 0.572 |
| 1–49% | 5 (20.8) | 2 (8.7) | |
| ≥50% | 6 (25.0) | 9 (39.1) | |
| Unknown | 7 (29.2) | 7 (30.4) | |
| Immunotherapy-n (%) | |||
| Atezolizumab | 1 (4.2) | 1 (4.3) | 0.763 |
| Nivolumab | 14 (58.3) | 11 (47.8) | |
| Pembrolizumab | 9 (37.5) | 11 (47.8) | |
| Lines of previous systemic therapy-n (%) | |||
| 0 | 7 (29.2) | 8 (34.8) | 0.114 |
| 1 | 13 (54.2) | 6 (26.1) | |
| ≥2 | 4 (16.7) | 9 (39.1) | |
| Factor | HR (95% CI) | p-Value |
|---|---|---|
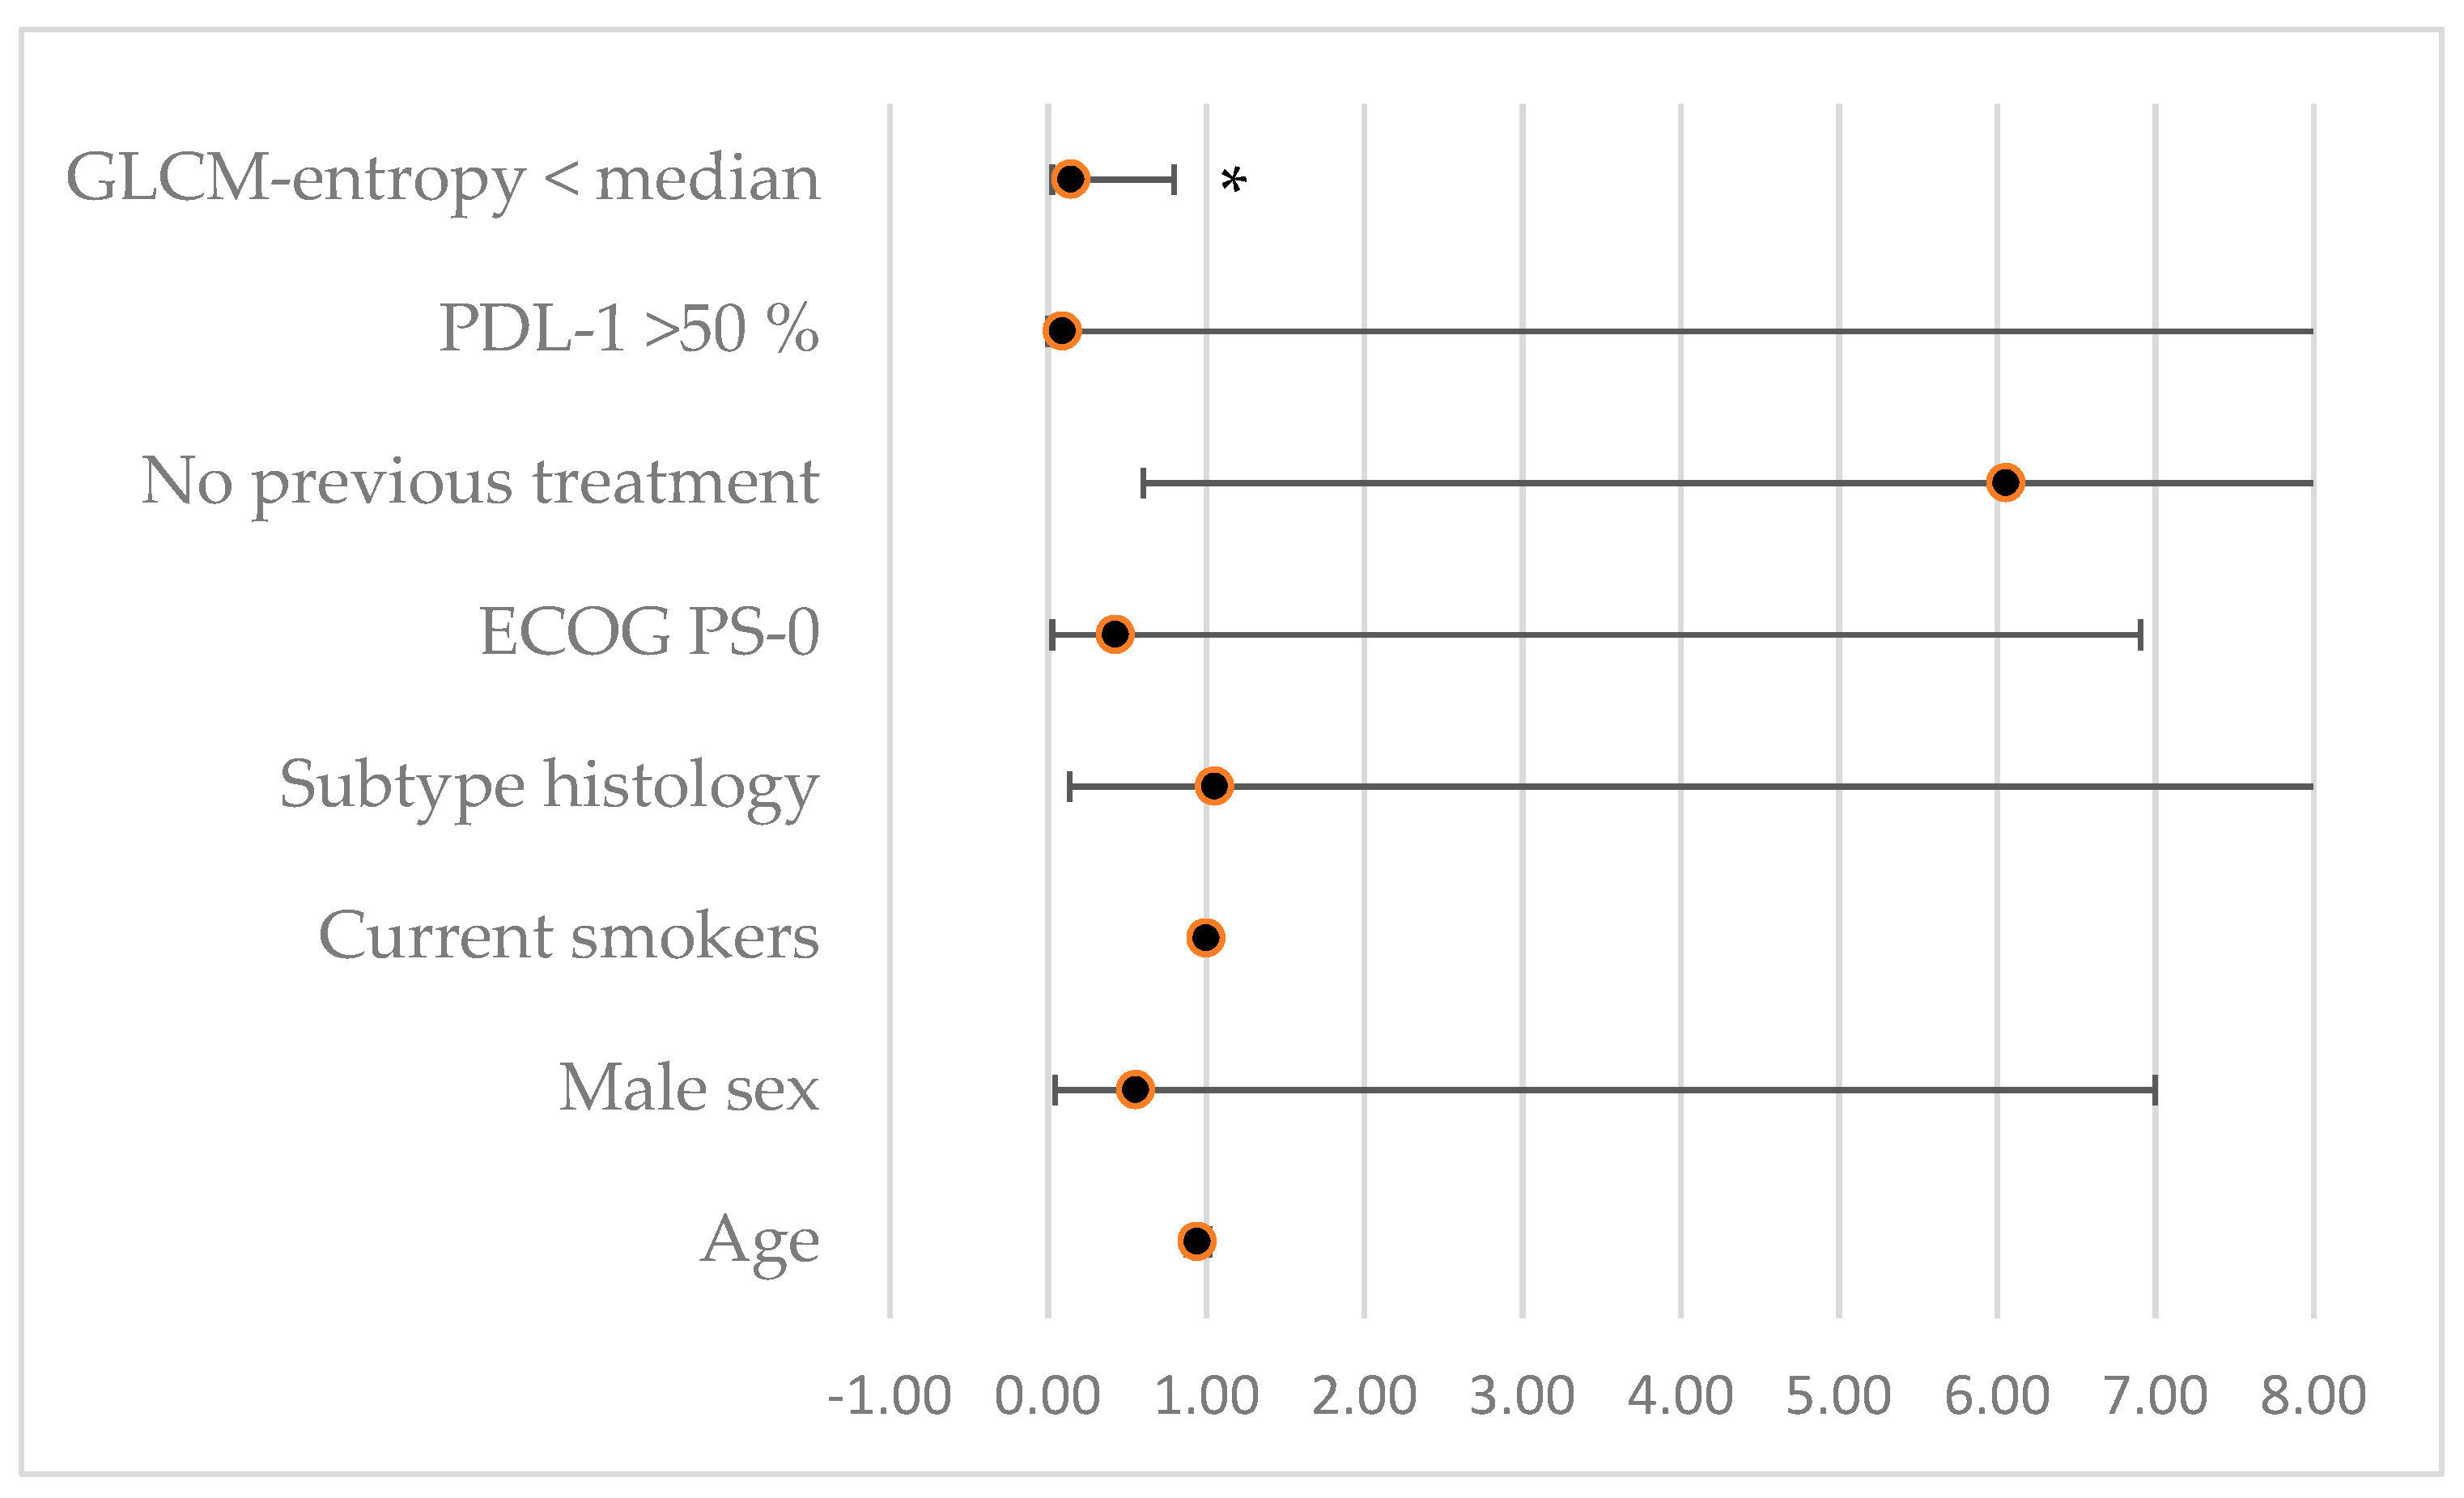
| Age | 0.94 [0.87–1.02] | 0.15 |
| Male sex | 0.55 [0.04–6.99] | 0.65 |
| Current smokers | 1 [1–1] | 1 |
| Sub-type histology | 1.05 [0.13–8.25] | 0.96 |
| ECOG PS-0 | 0.42 [0.02–6.9] | 0.548 |
| No previous treatment | 6.05 [0.6–61.07] | 0.13 |
| PDL-1 > 50% | 0.09 [0–11.31] | 0.33 |
| GLCM-entropy < median | 0.14 [0.02–0.79] | 0.03 |
Disclaimer/Publisher’s Note: The statements, opinions and data contained in all publications are solely those of the individual author(s) and contributor(s) and not of MDPI and/or the editor(s). MDPI and/or the editor(s) disclaim responsibility for any injury to people or property resulting from any ideas, methods, instructions or products referred to in the content. |
© 2023 by the authors. Licensee MDPI, Basel, Switzerland. This article is an open access article distributed under the terms and conditions of the Creative Commons Attribution (CC BY) license (https://creativecommons.org/licenses/by/4.0/).
Share and Cite
Malet, J.; Ancel, J.; Moubtakir, A.; Papathanassiou, D.; Deslée, G.; Dewolf, M. Assessment of the Association between Entropy in PET/CT and Response to Anti-PD-1/PD-L1 Monotherapy in Stage III or IV NSCLC. Life 2023, 13, 1051. https://doi.org/10.3390/life13041051
Malet J, Ancel J, Moubtakir A, Papathanassiou D, Deslée G, Dewolf M. Assessment of the Association between Entropy in PET/CT and Response to Anti-PD-1/PD-L1 Monotherapy in Stage III or IV NSCLC. Life. 2023; 13(4):1051. https://doi.org/10.3390/life13041051
Chicago/Turabian StyleMalet, Julie, Julien Ancel, Abdenasser Moubtakir, Dimitri Papathanassiou, Gaëtan Deslée, and Maxime Dewolf. 2023. "Assessment of the Association between Entropy in PET/CT and Response to Anti-PD-1/PD-L1 Monotherapy in Stage III or IV NSCLC" Life 13, no. 4: 1051. https://doi.org/10.3390/life13041051