
Morphology of Penicillium rubens Biofilms Formed in Space

 , and
, and
Abstract
:1. Introduction
2. Materials and Methods
2.1. Test Matrix: Fungal Strain, Materials, and Experimental Organization
- Aluminum Alloy (Al6061), as it is used in spacecraft structures, thermal control, structures for electronic devices and panels, etc.;
- Stainless Steel 316 (SS316), as it is used in spacecraft environmental control and life support system (ECLSS) tanks and tubing (including for potable water), and Extravehicular Mobility Unit (EMU) elements, and on Earth in surgical equipment and implants;
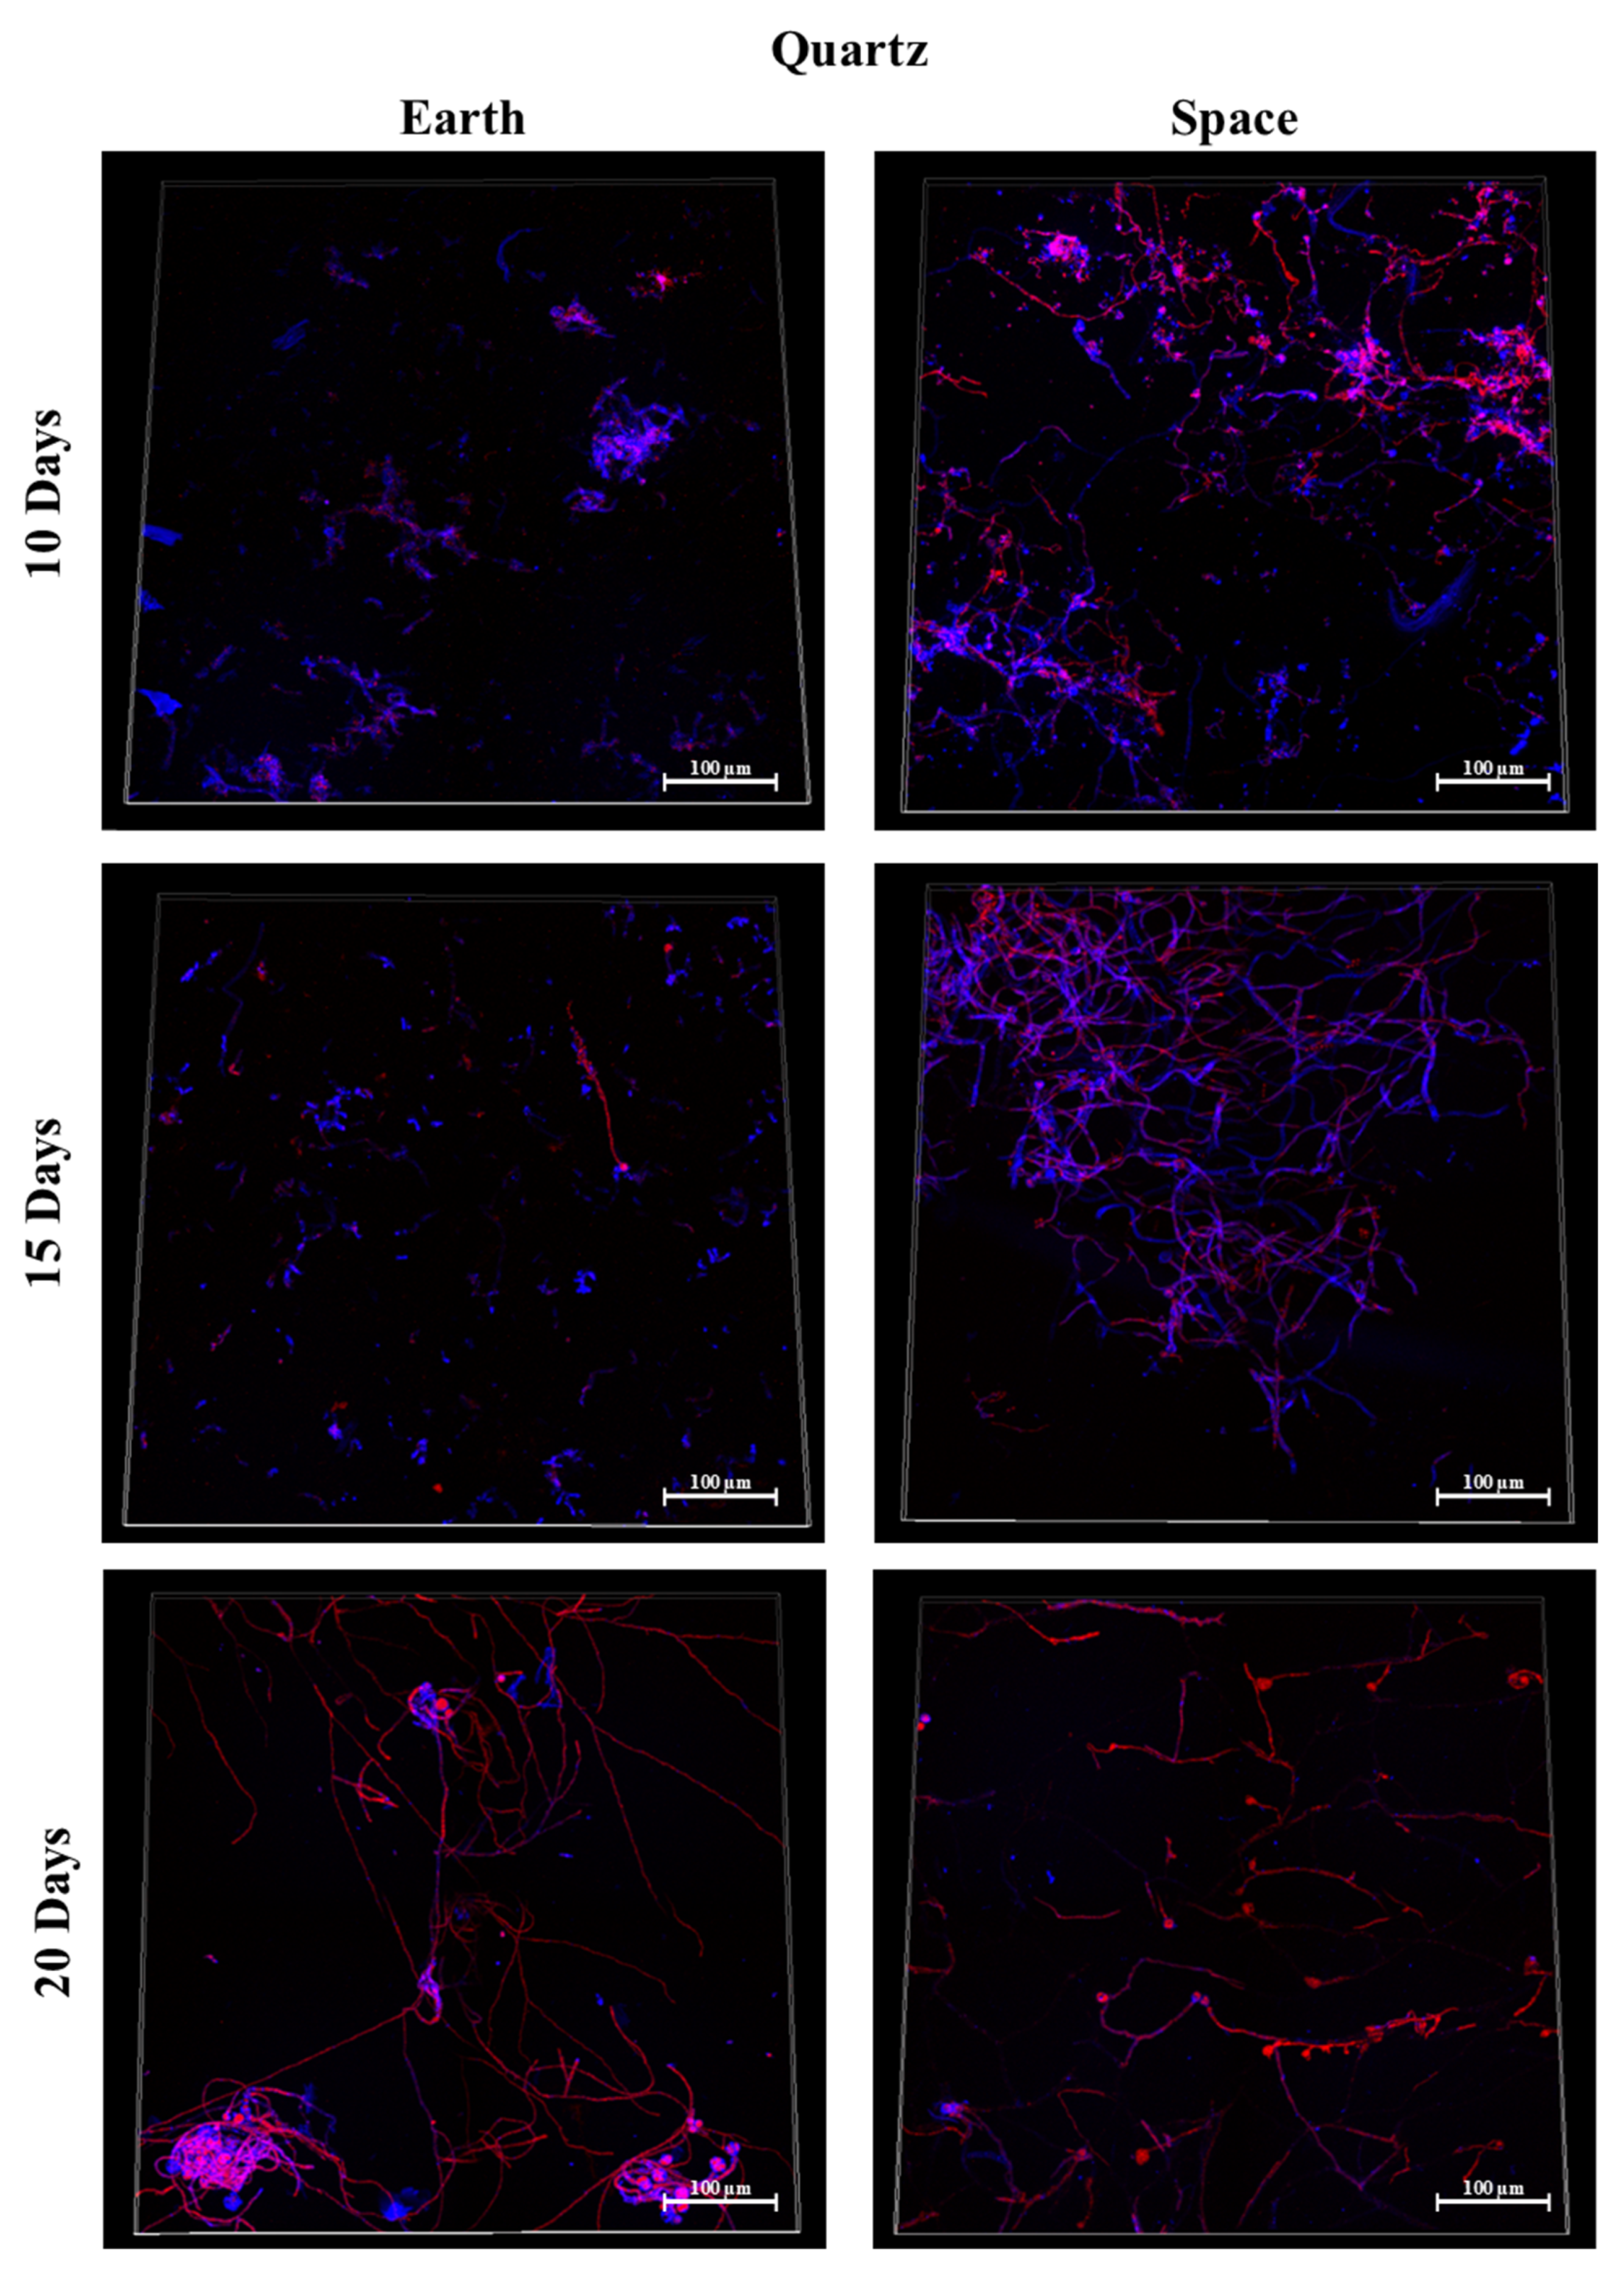
- Quartz, as it is used in spacecraft windows (at least one of them in the Mir space station damaged by P. rubens);
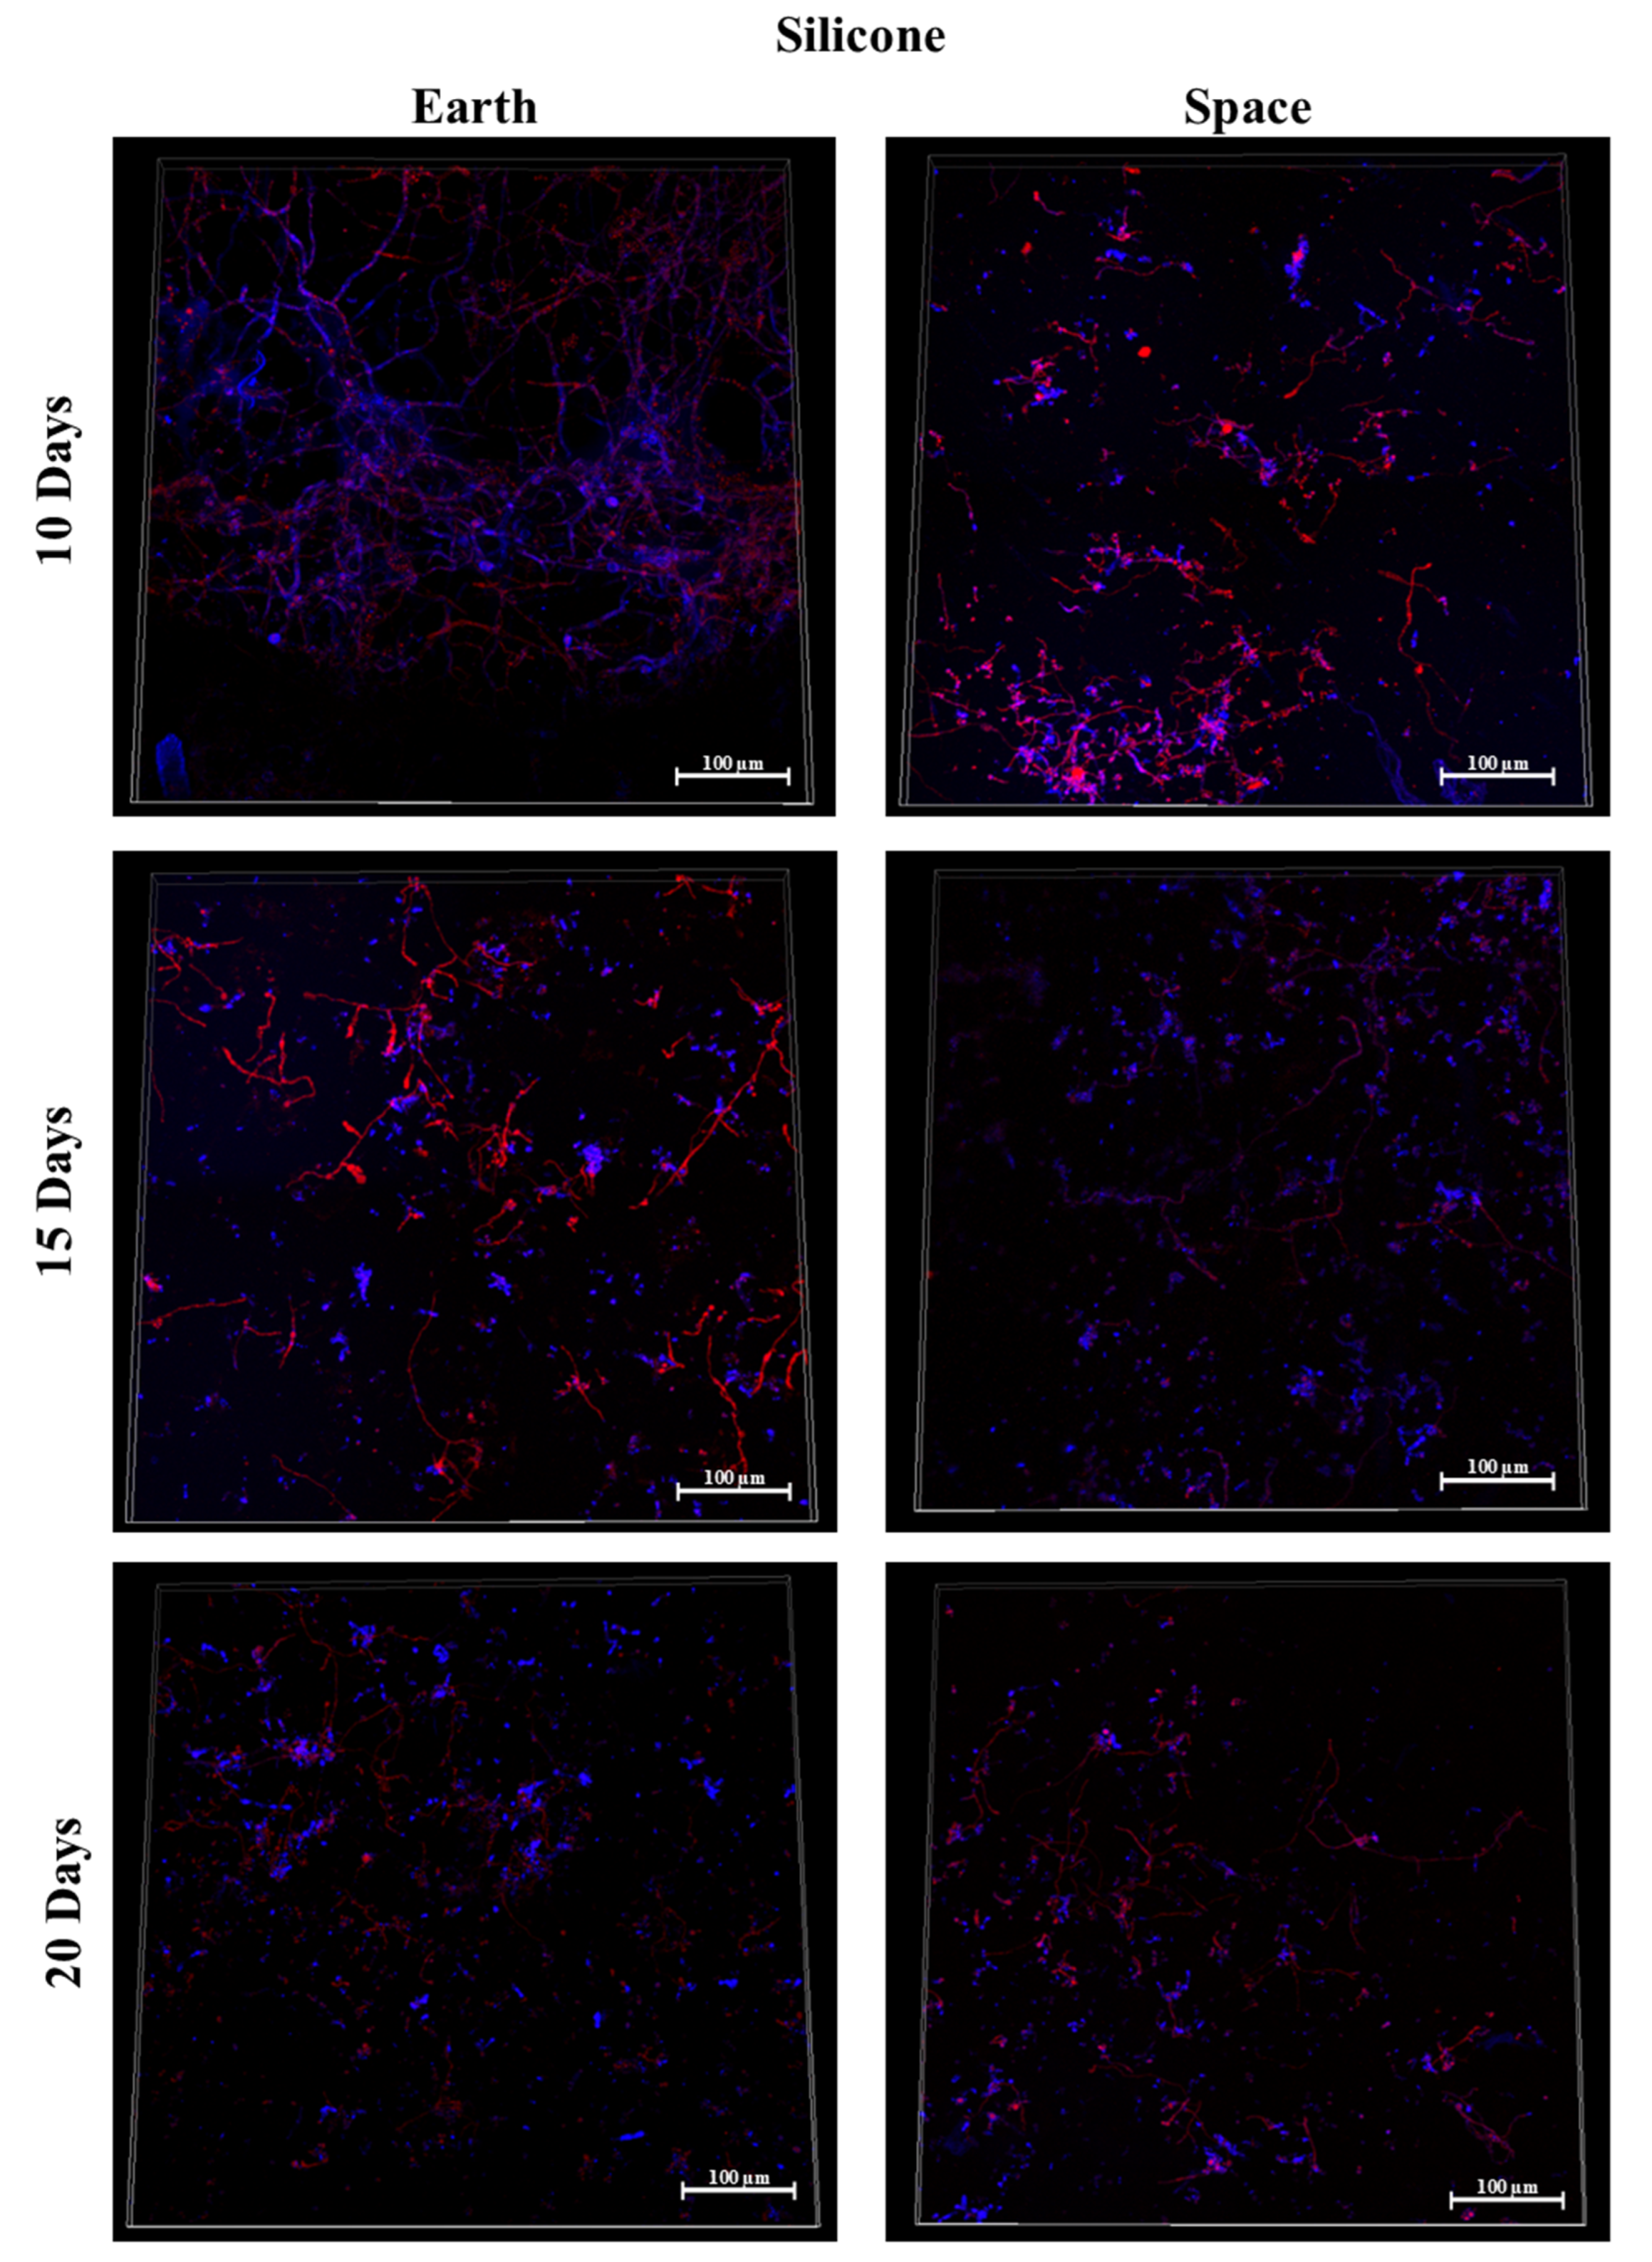
- Silicone, as it used in space in O-rings and on Earth in urological catheters, surgical incision drains, and respiratory devices;
- Titanium alloy (Ti-6Al-4V), as it is used in spacecraft structures, antennae, pressure vessels, brackets, fittings, etc., and on Earth in implants;
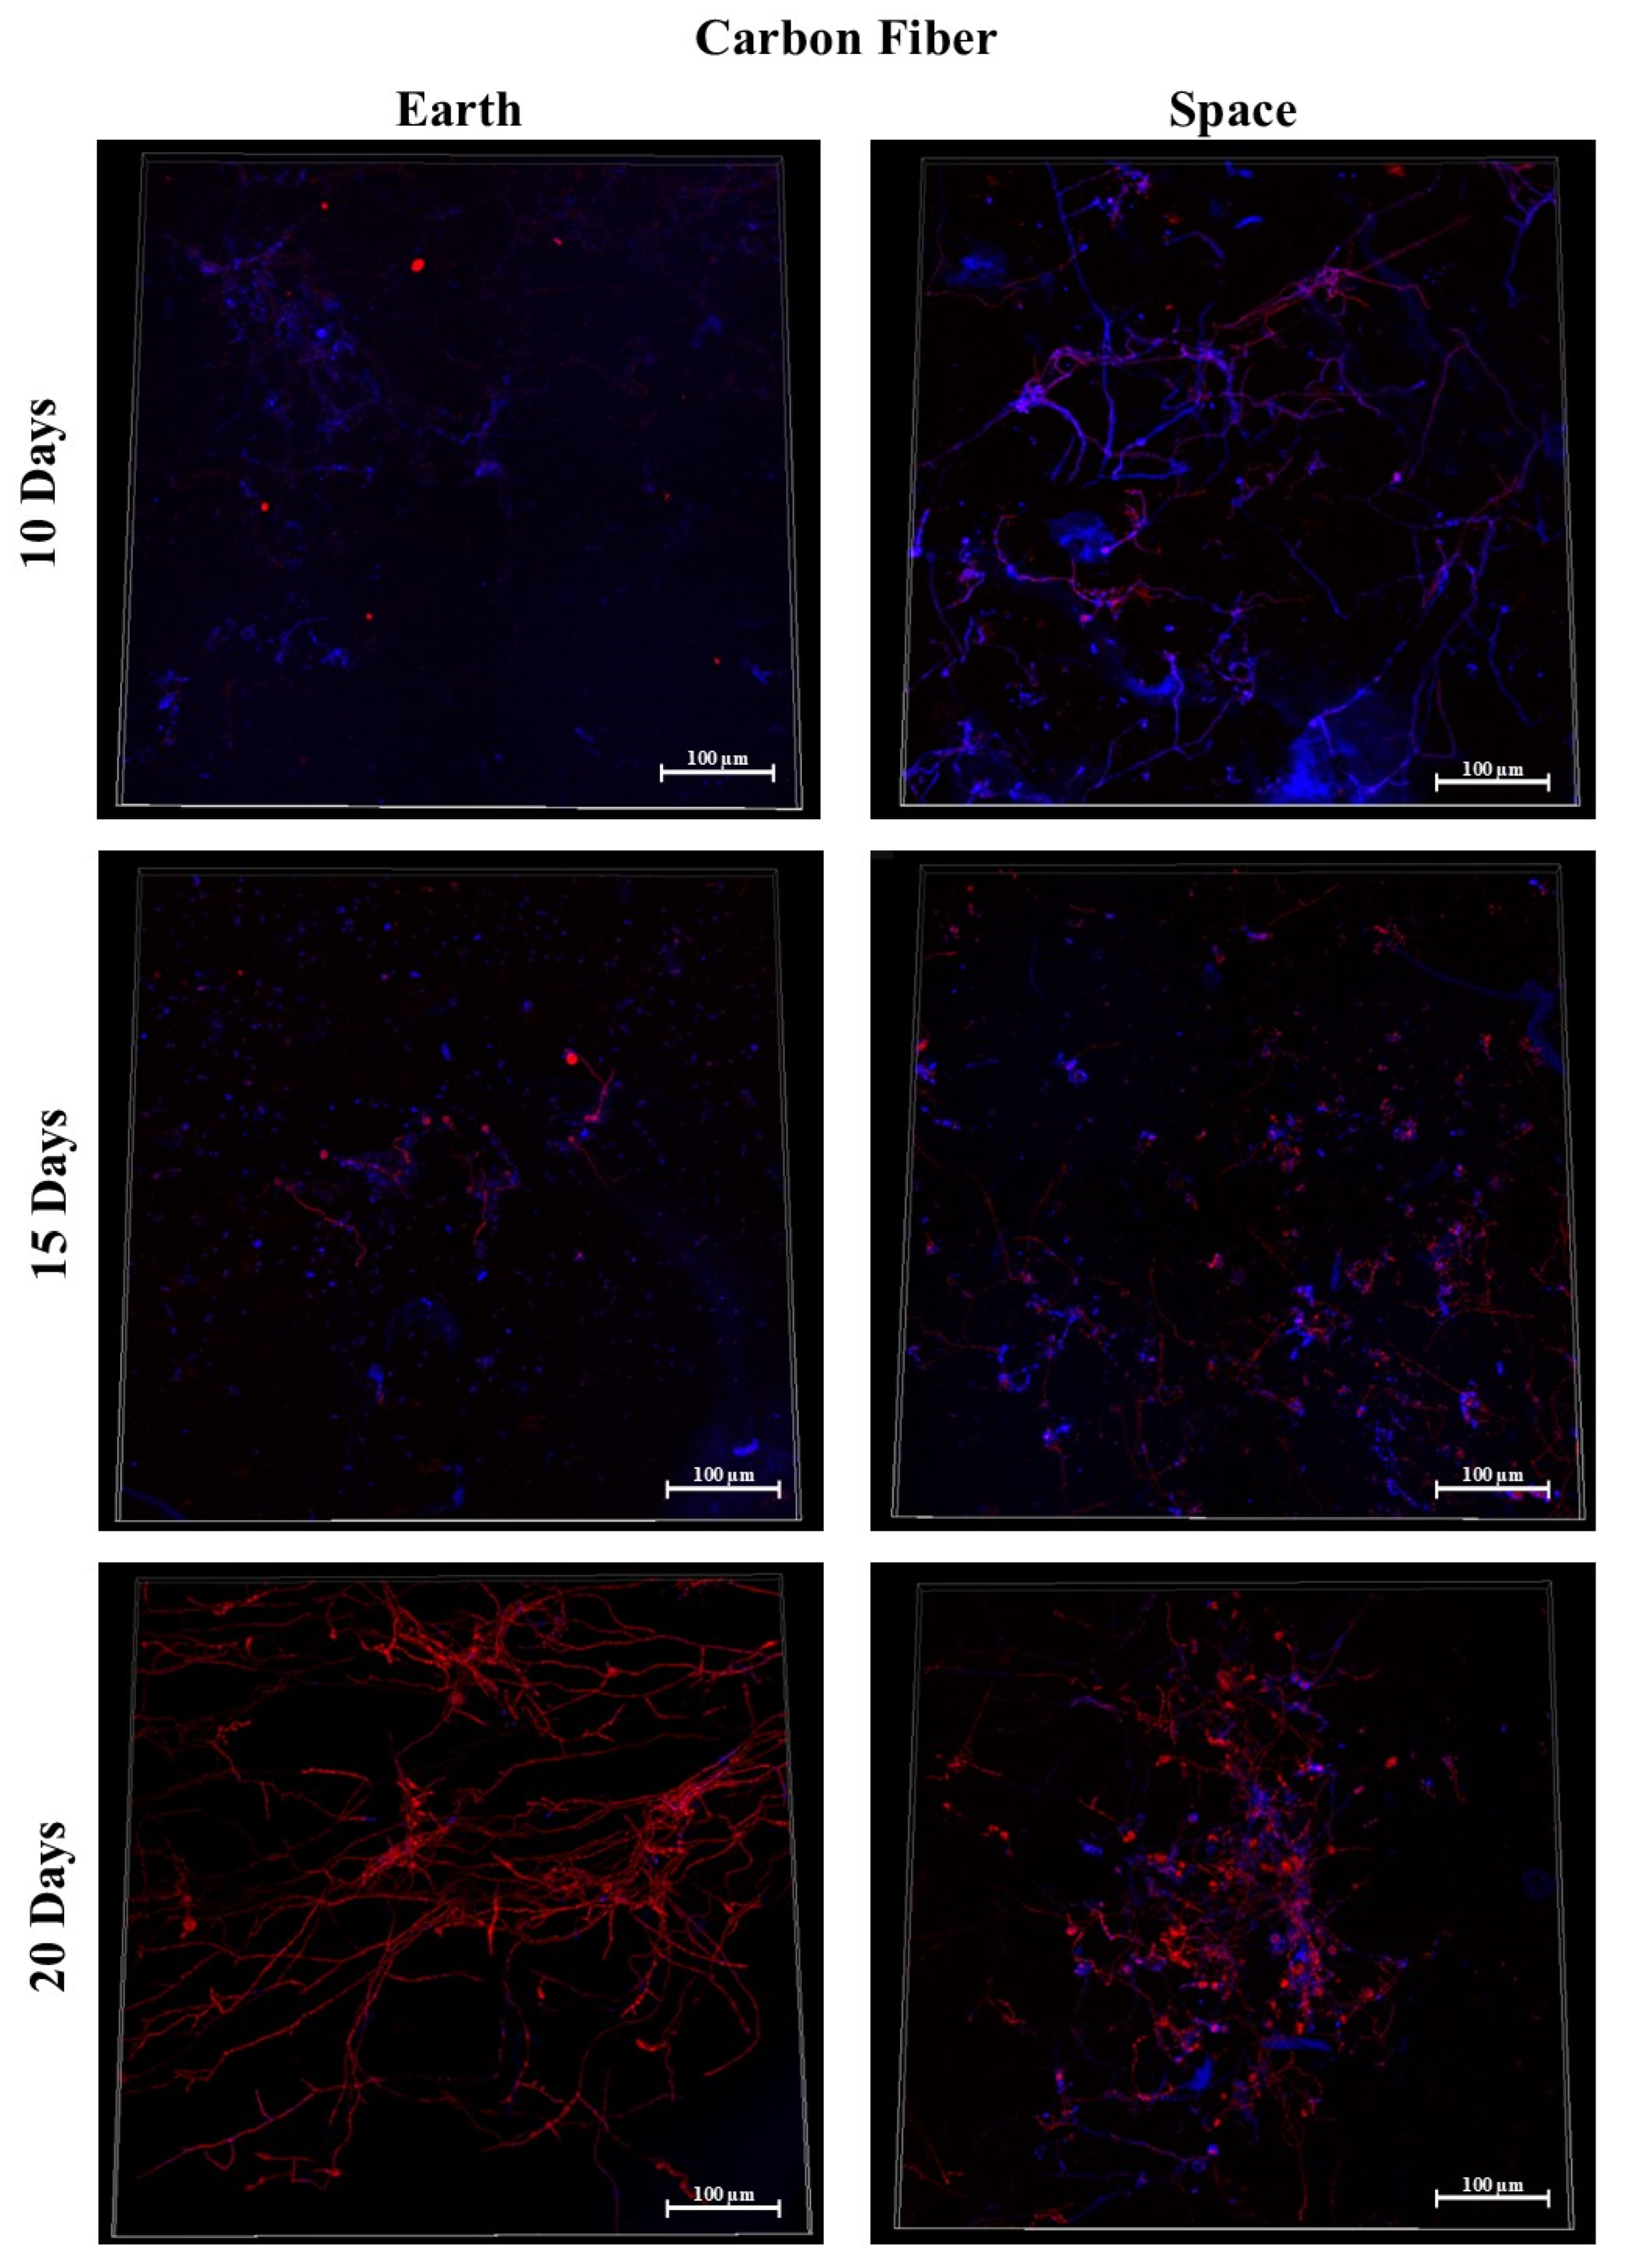
- Carbon fiber, as it is used in spacecraft aeroshells and other applications;
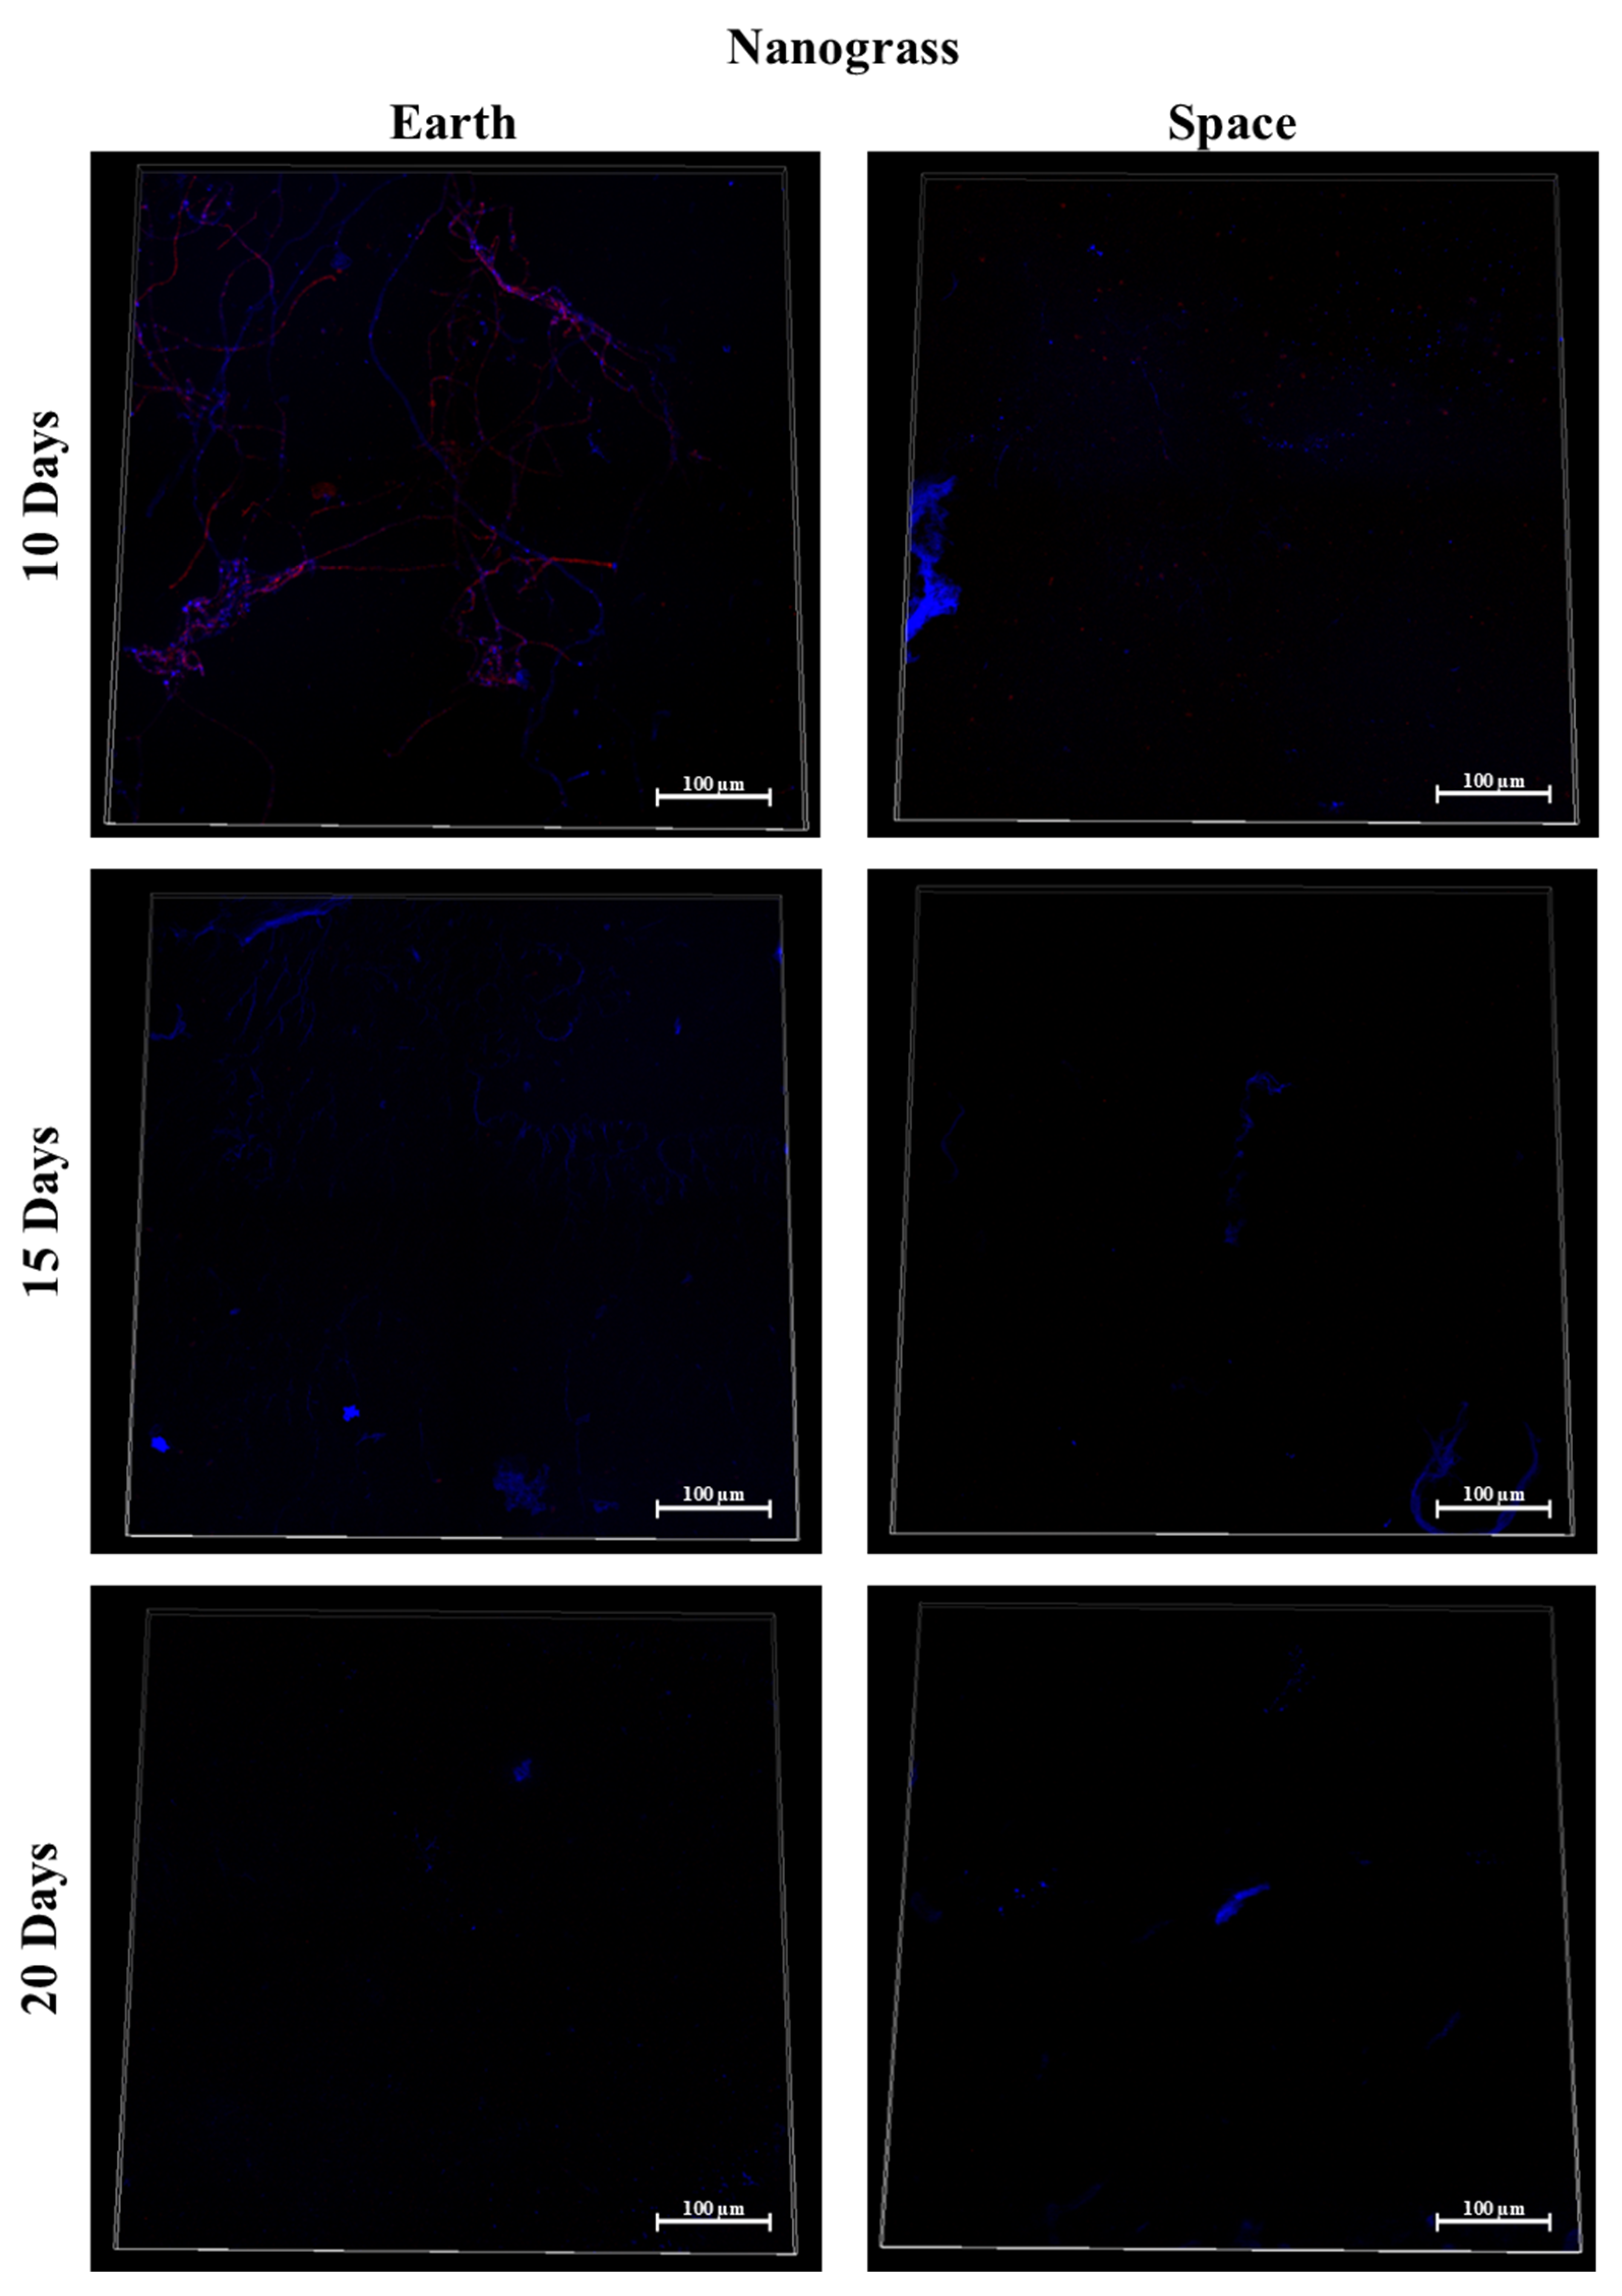
- MIT Nanograss, chosen to be interrogated as a potential solution to fungal biofilm formation in space. This was developed by the Massachusetts Institute of Technology (MIT) and is the substrate (nanoetched silicon wafer) described in the making of a lubricant-impregnated surface (LIS) without the lubricant oil and treated to increase hydrophobicity [32].
2.2. Pre-Launch Preparation
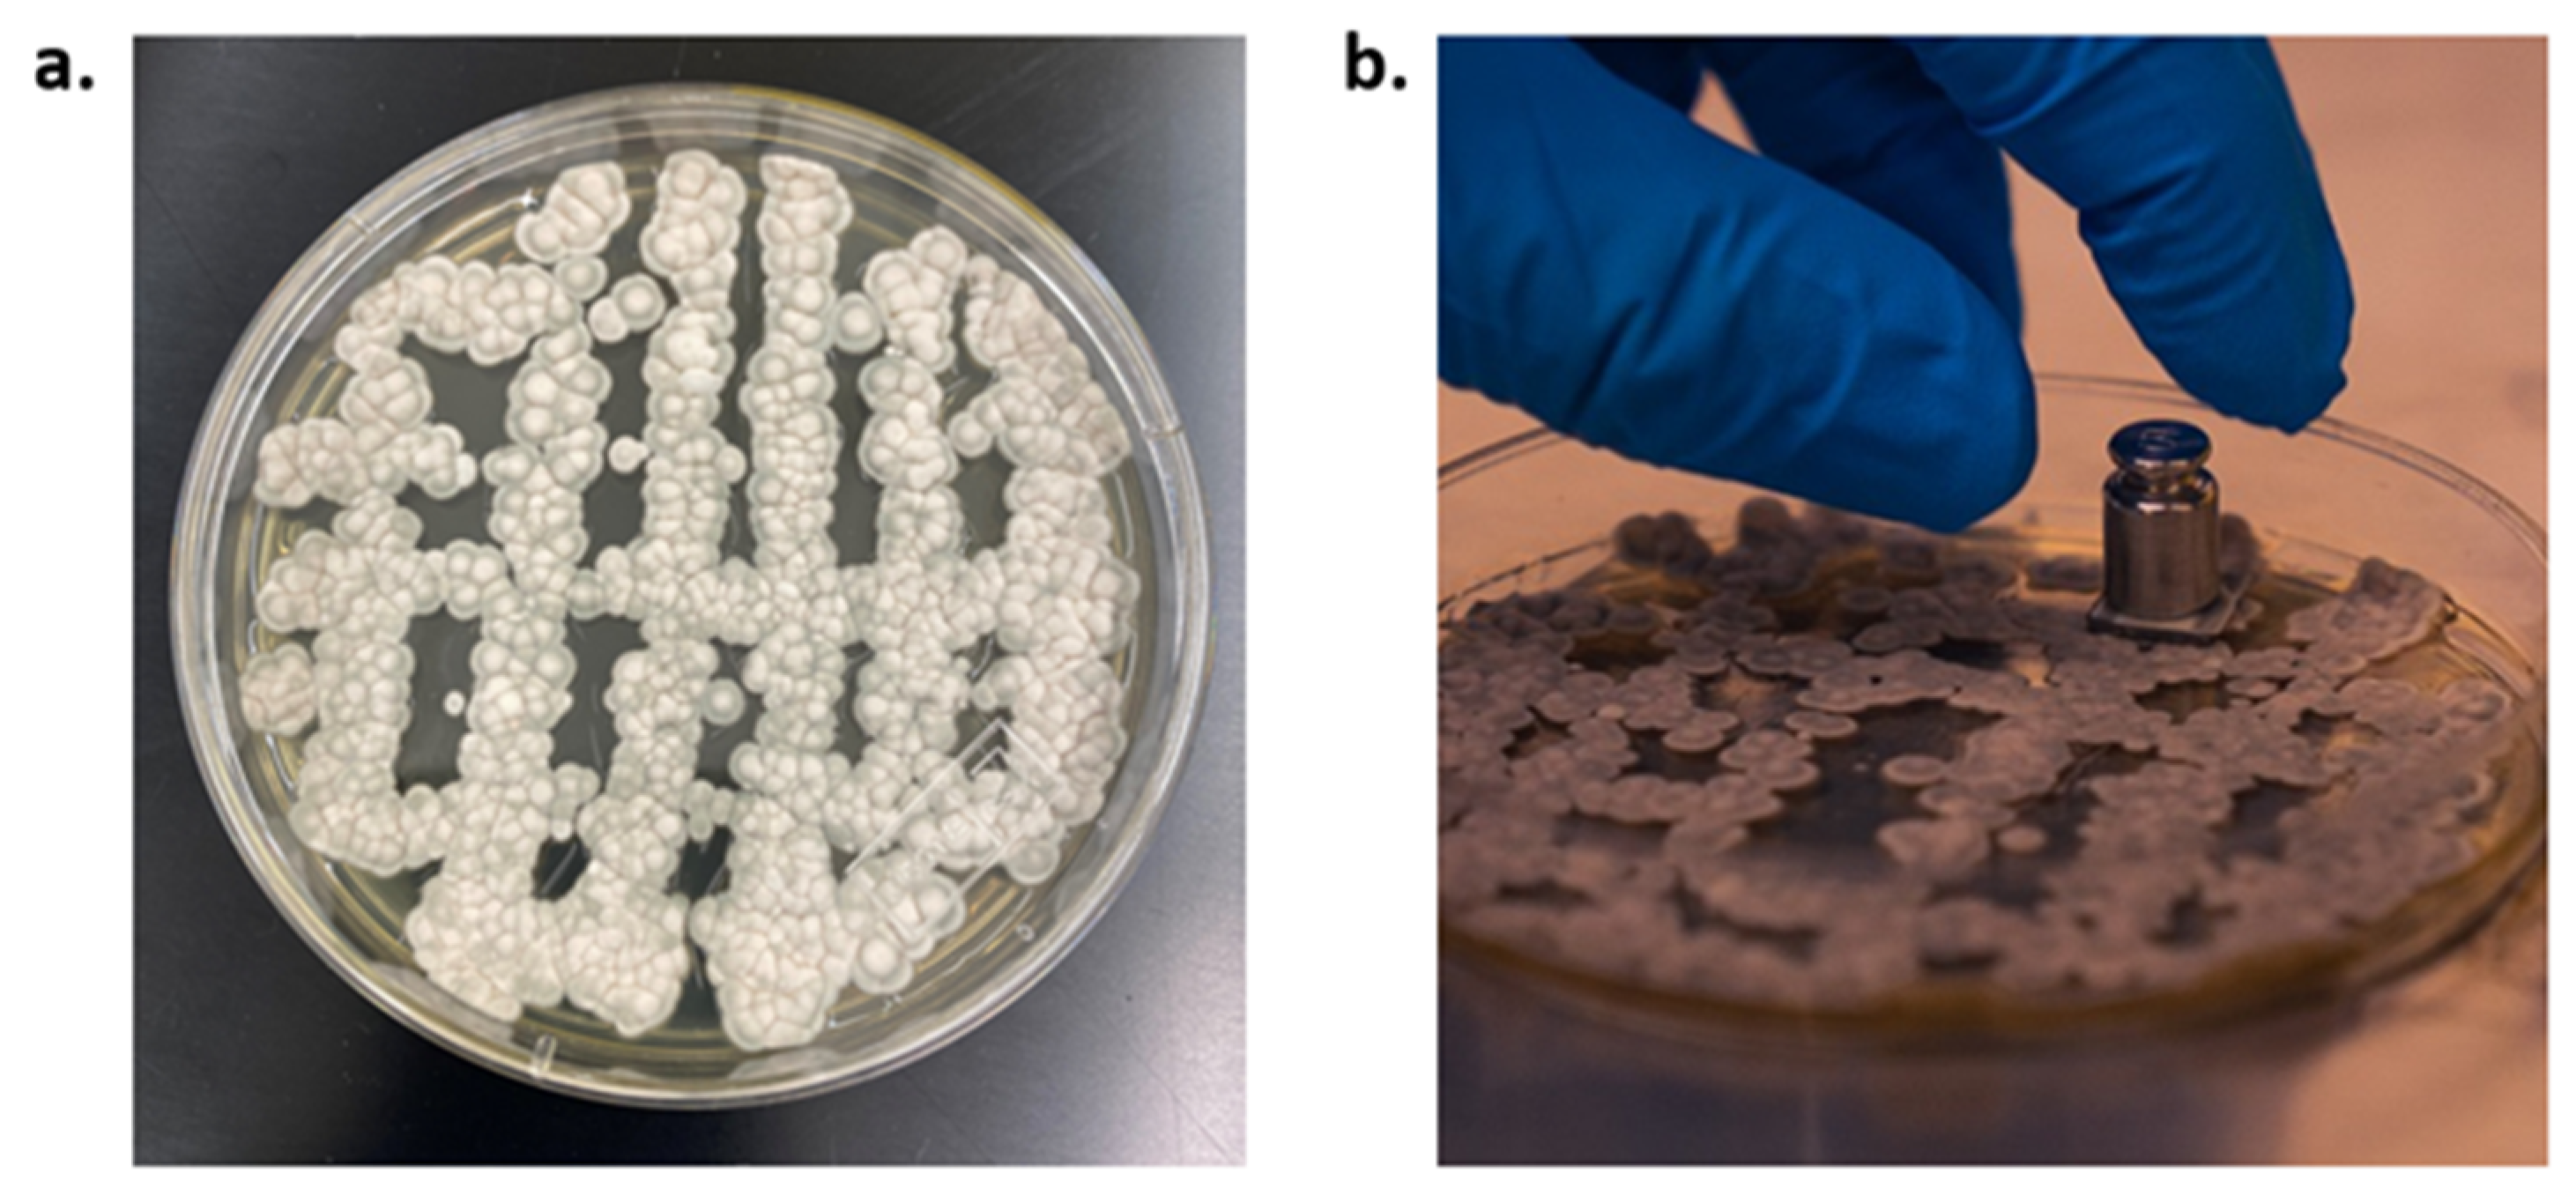
2.2.1. Fungal Strain
2.2.2. Preparation of Syringes
2.2.3. Preparation of Risers
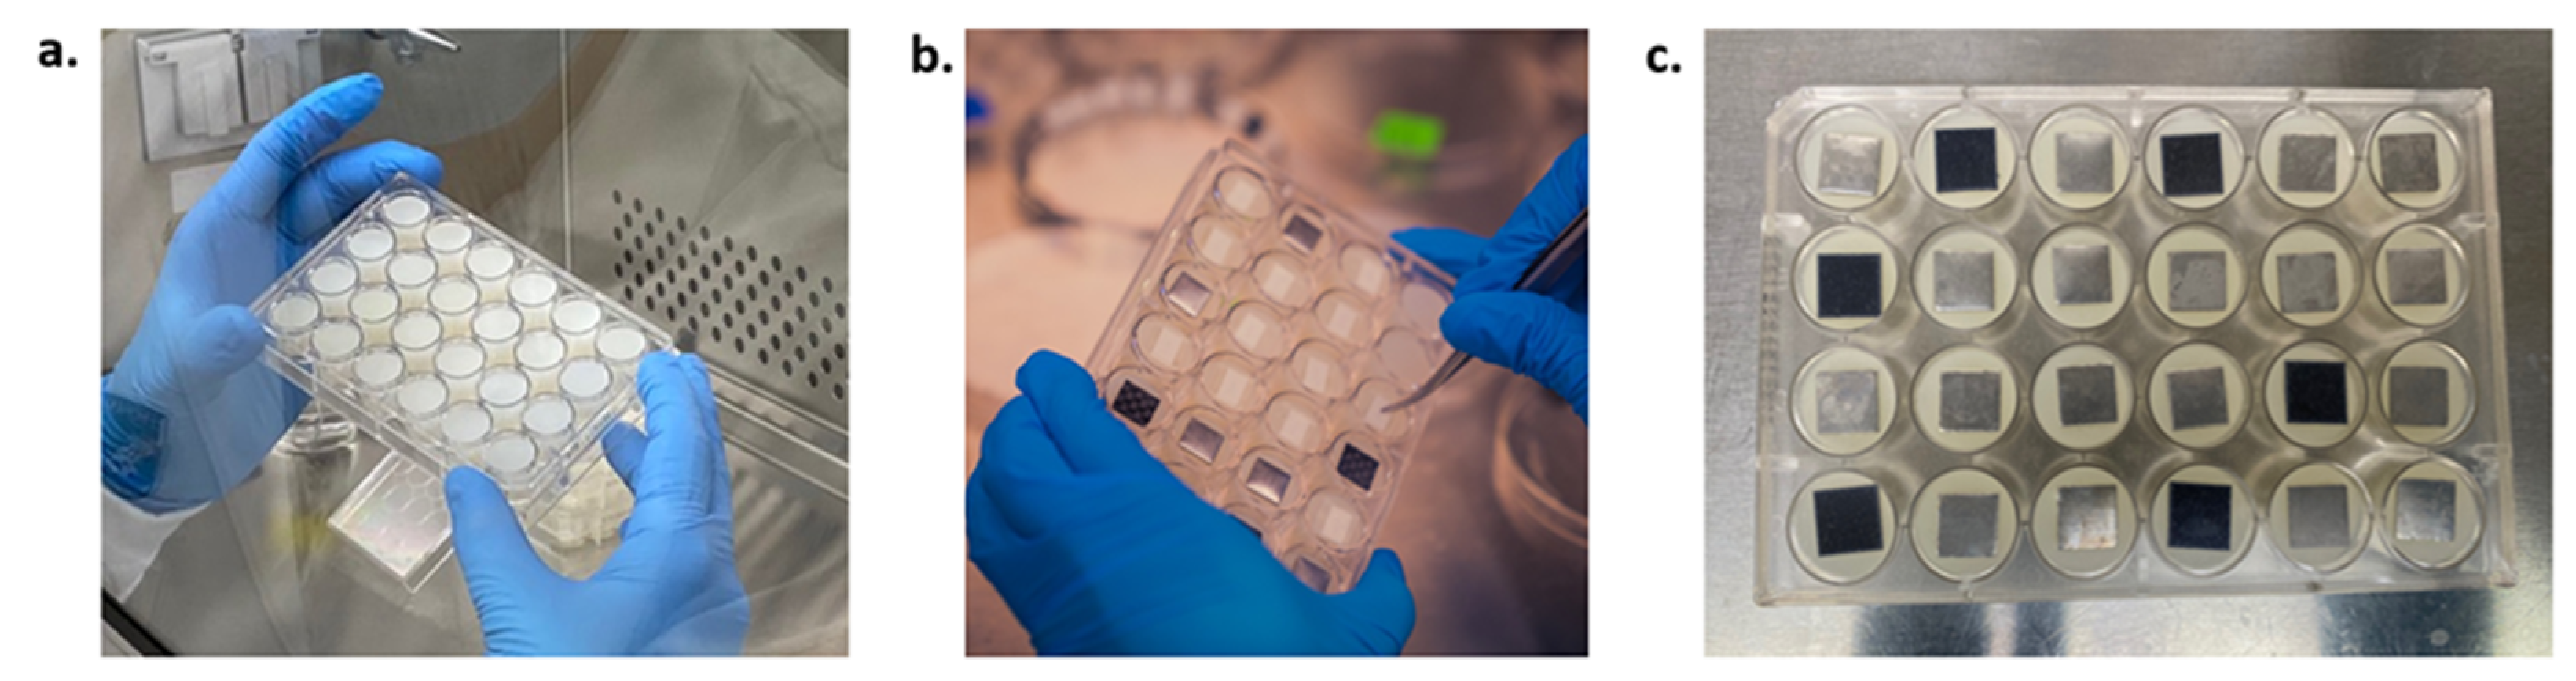
2.2.4. Preparation of Material Coupons
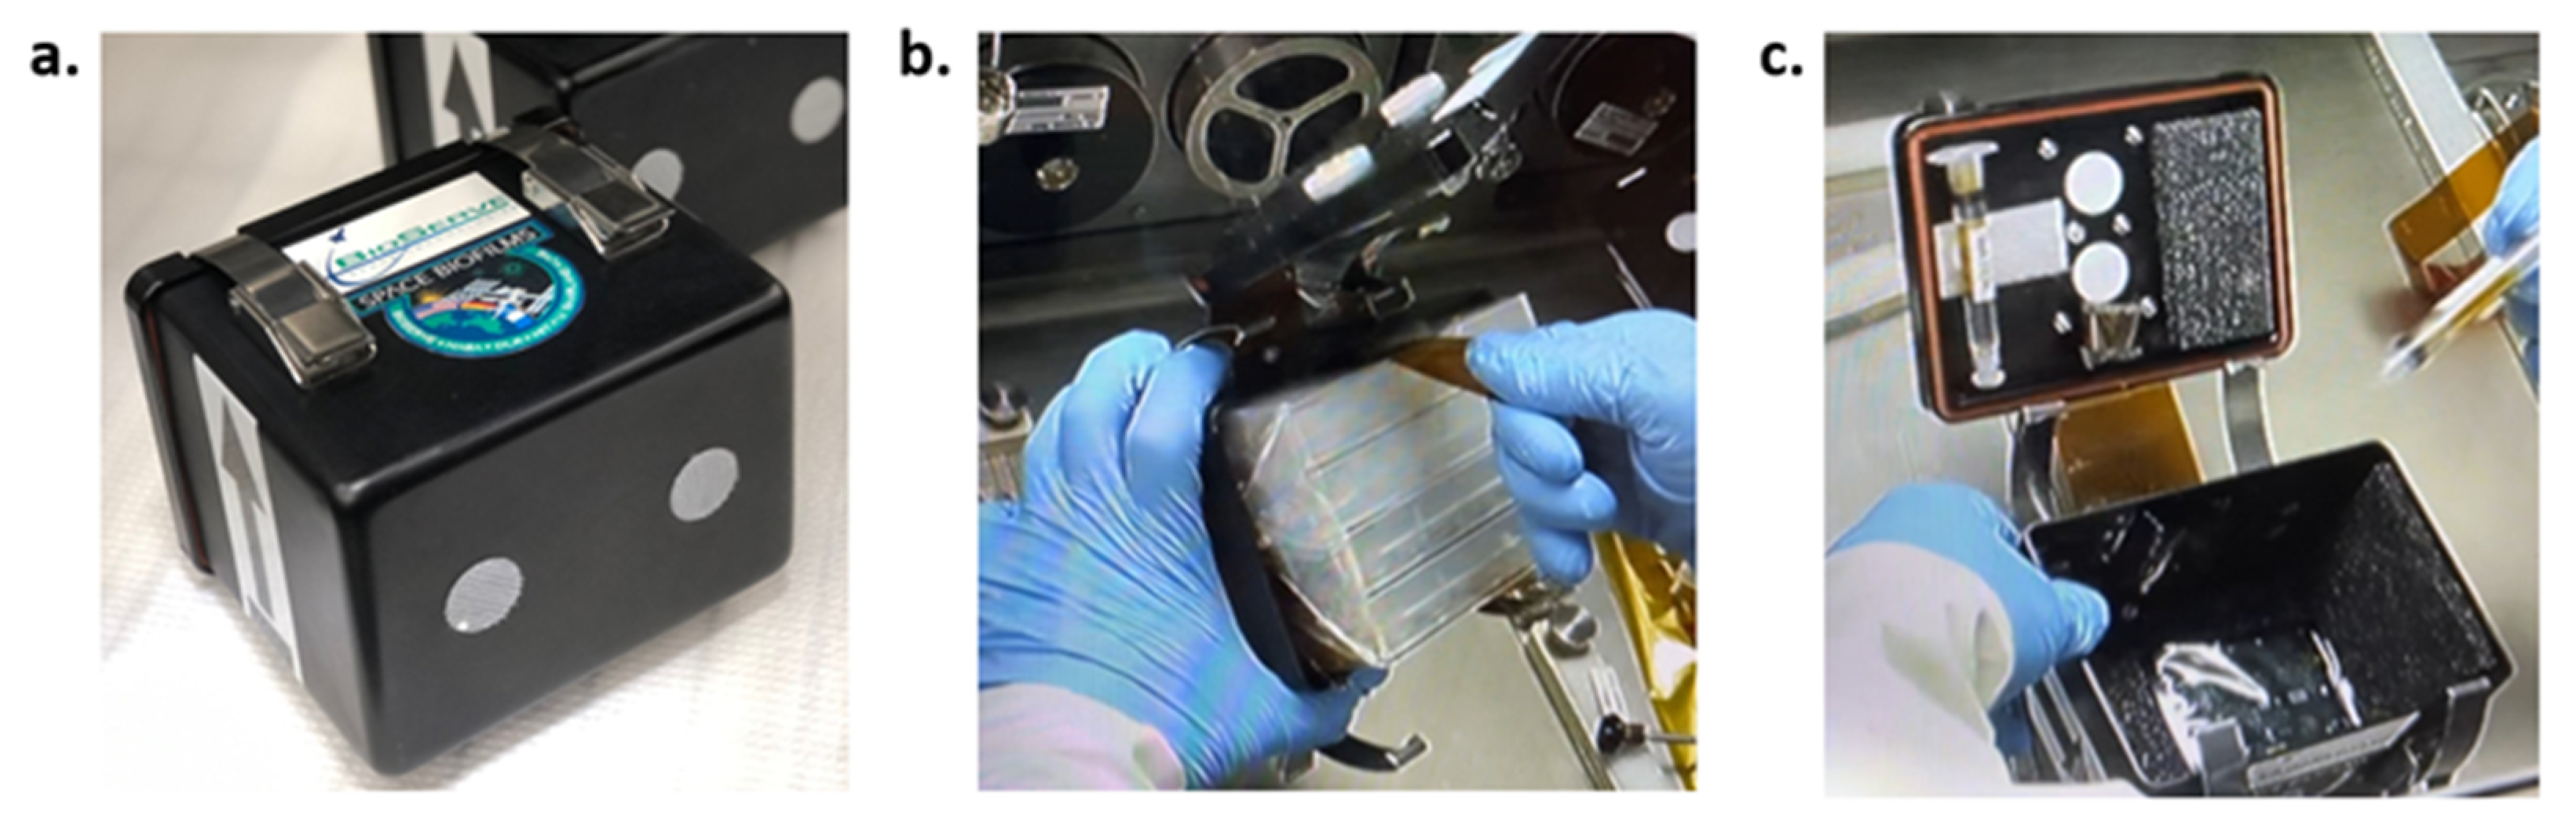
2.2.5. Inoculation of Spores and Sample Assembly into Hardware
2.2.6. Sample Set t0
2.3. Experiment Performance—On ISS and on Earth
2.4. Post-Flight Biofilm Morphology Data Acquisition
2.5. Image Acquisition
2.6. Qualitative Analysis
2.7. Conversion from .nd2 Files to .tiff Files and Slicing of Images
2.8. Quantitative Analysis and Quality Control
2.9. Statistical Analysis
3. Results
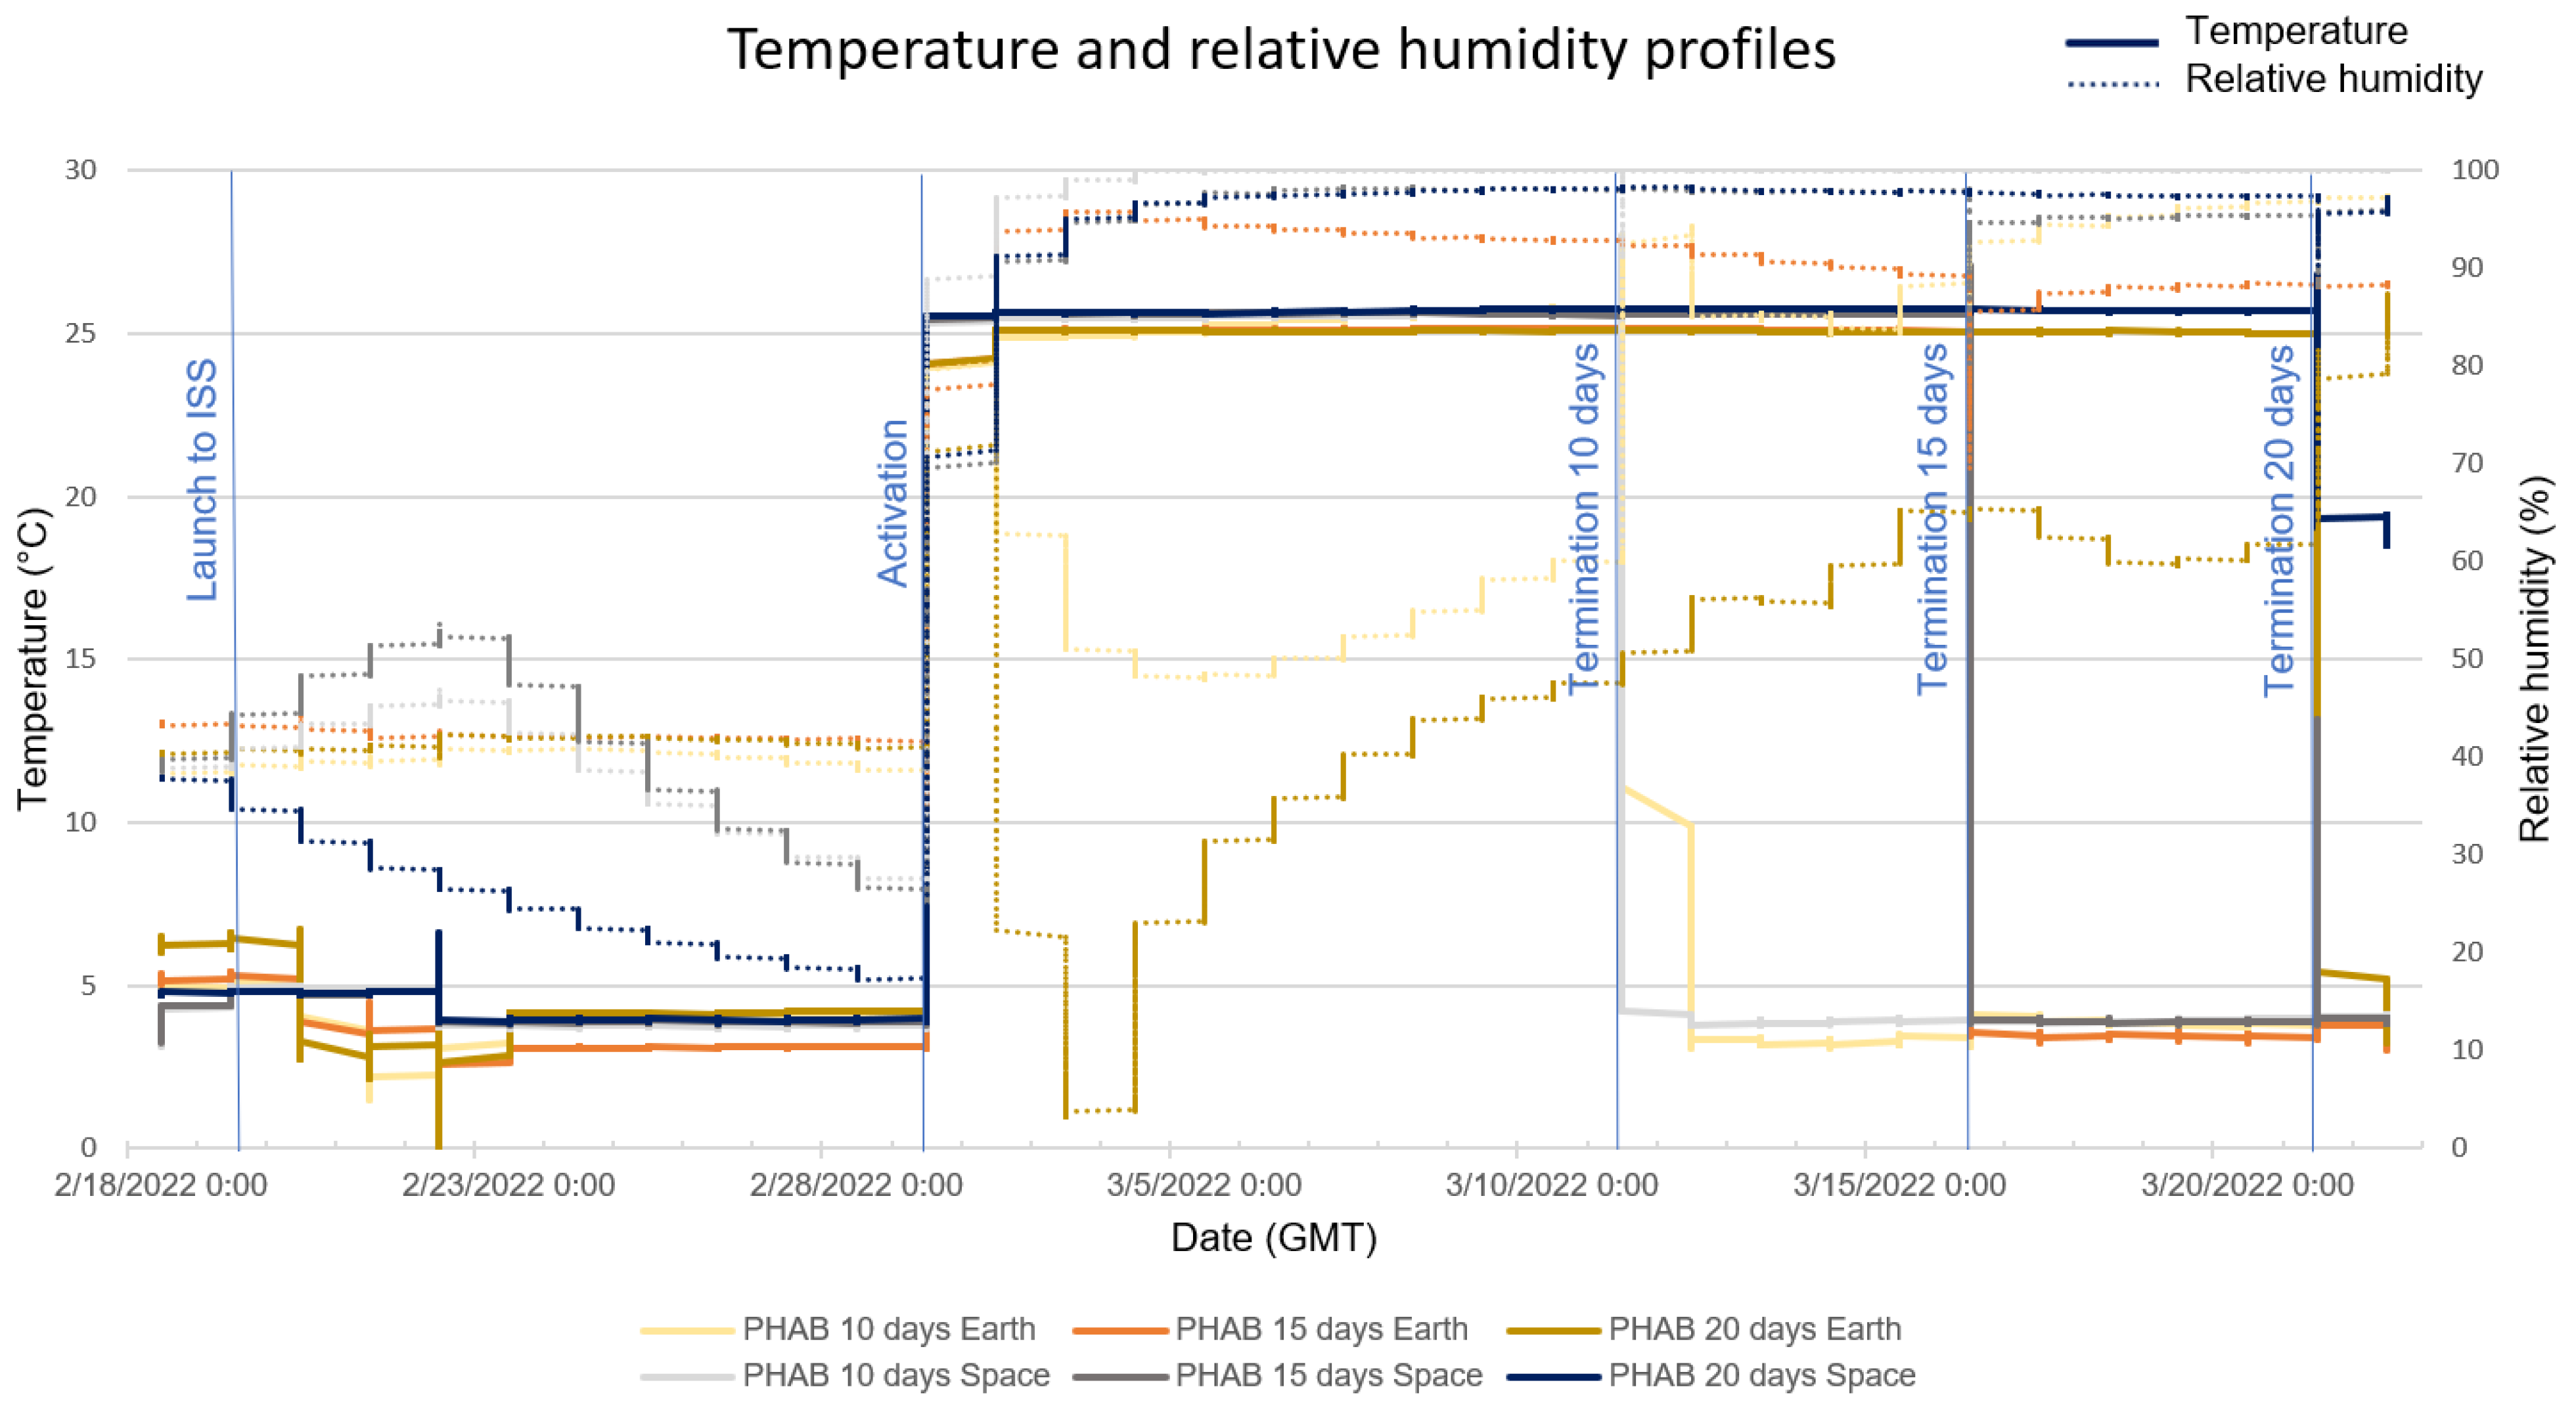
3.1. RH and Temperature Profiles
3.2. t0 Samples
3.3. Carbon Fiber
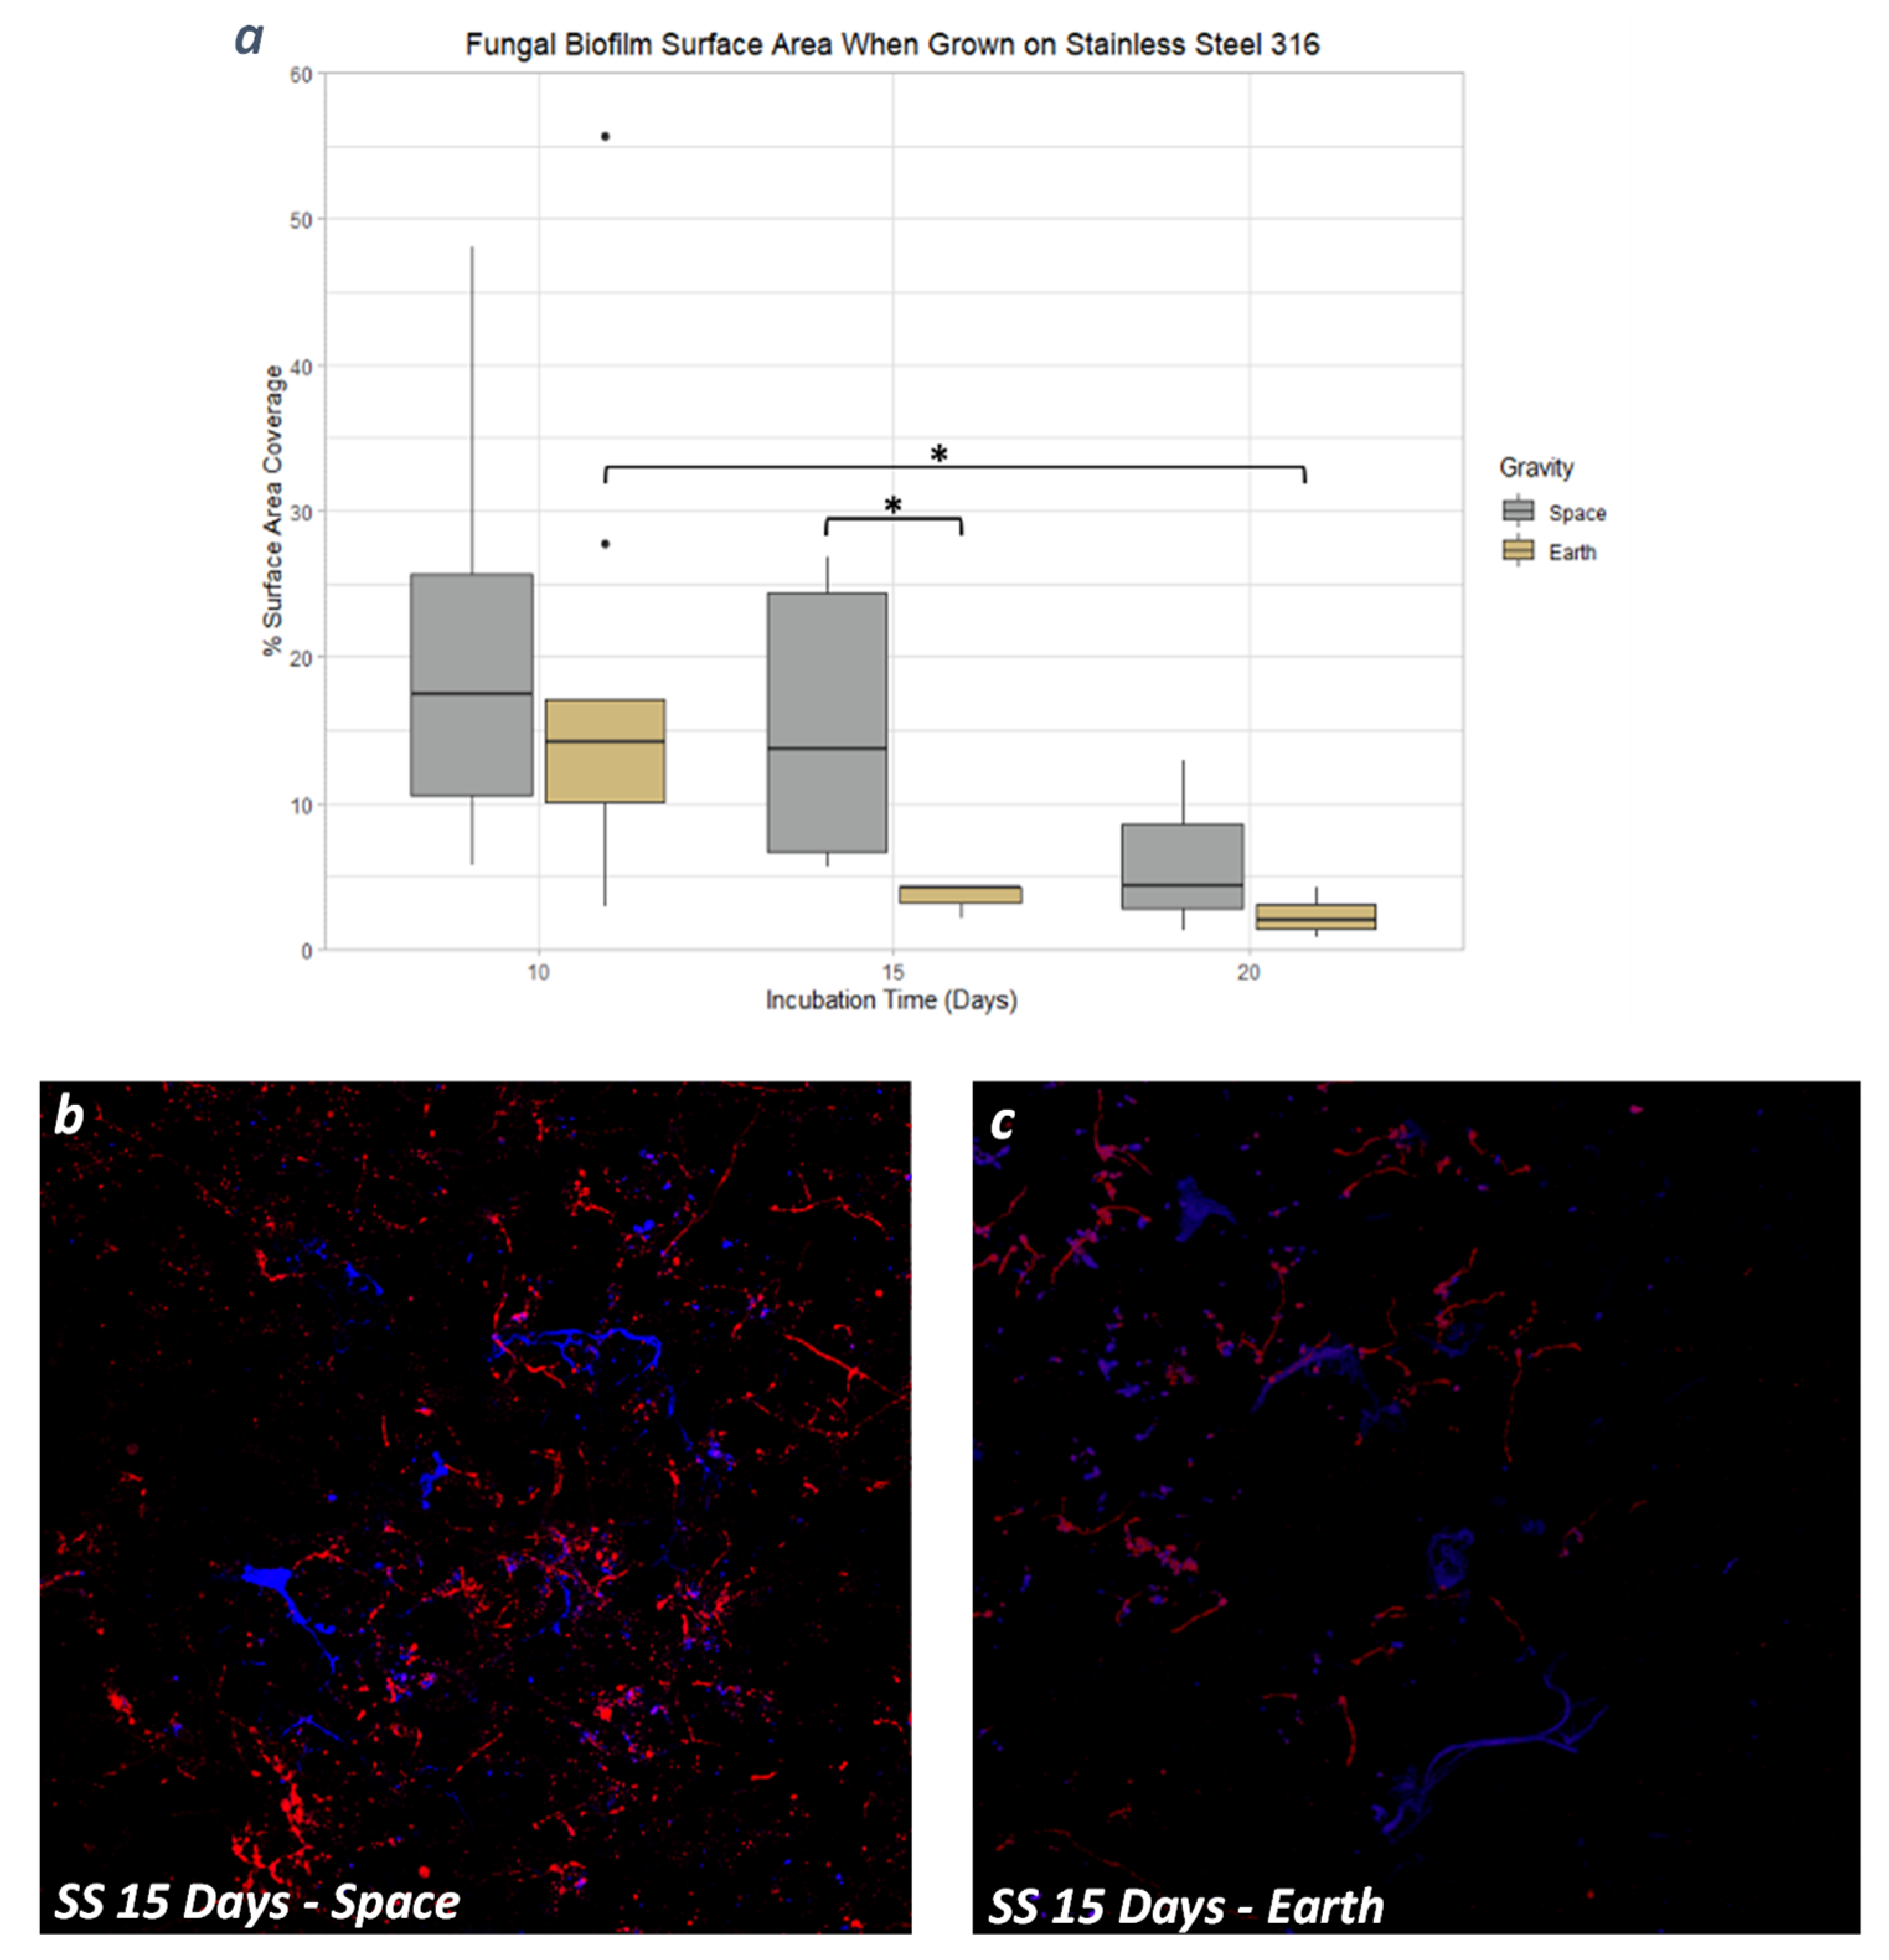
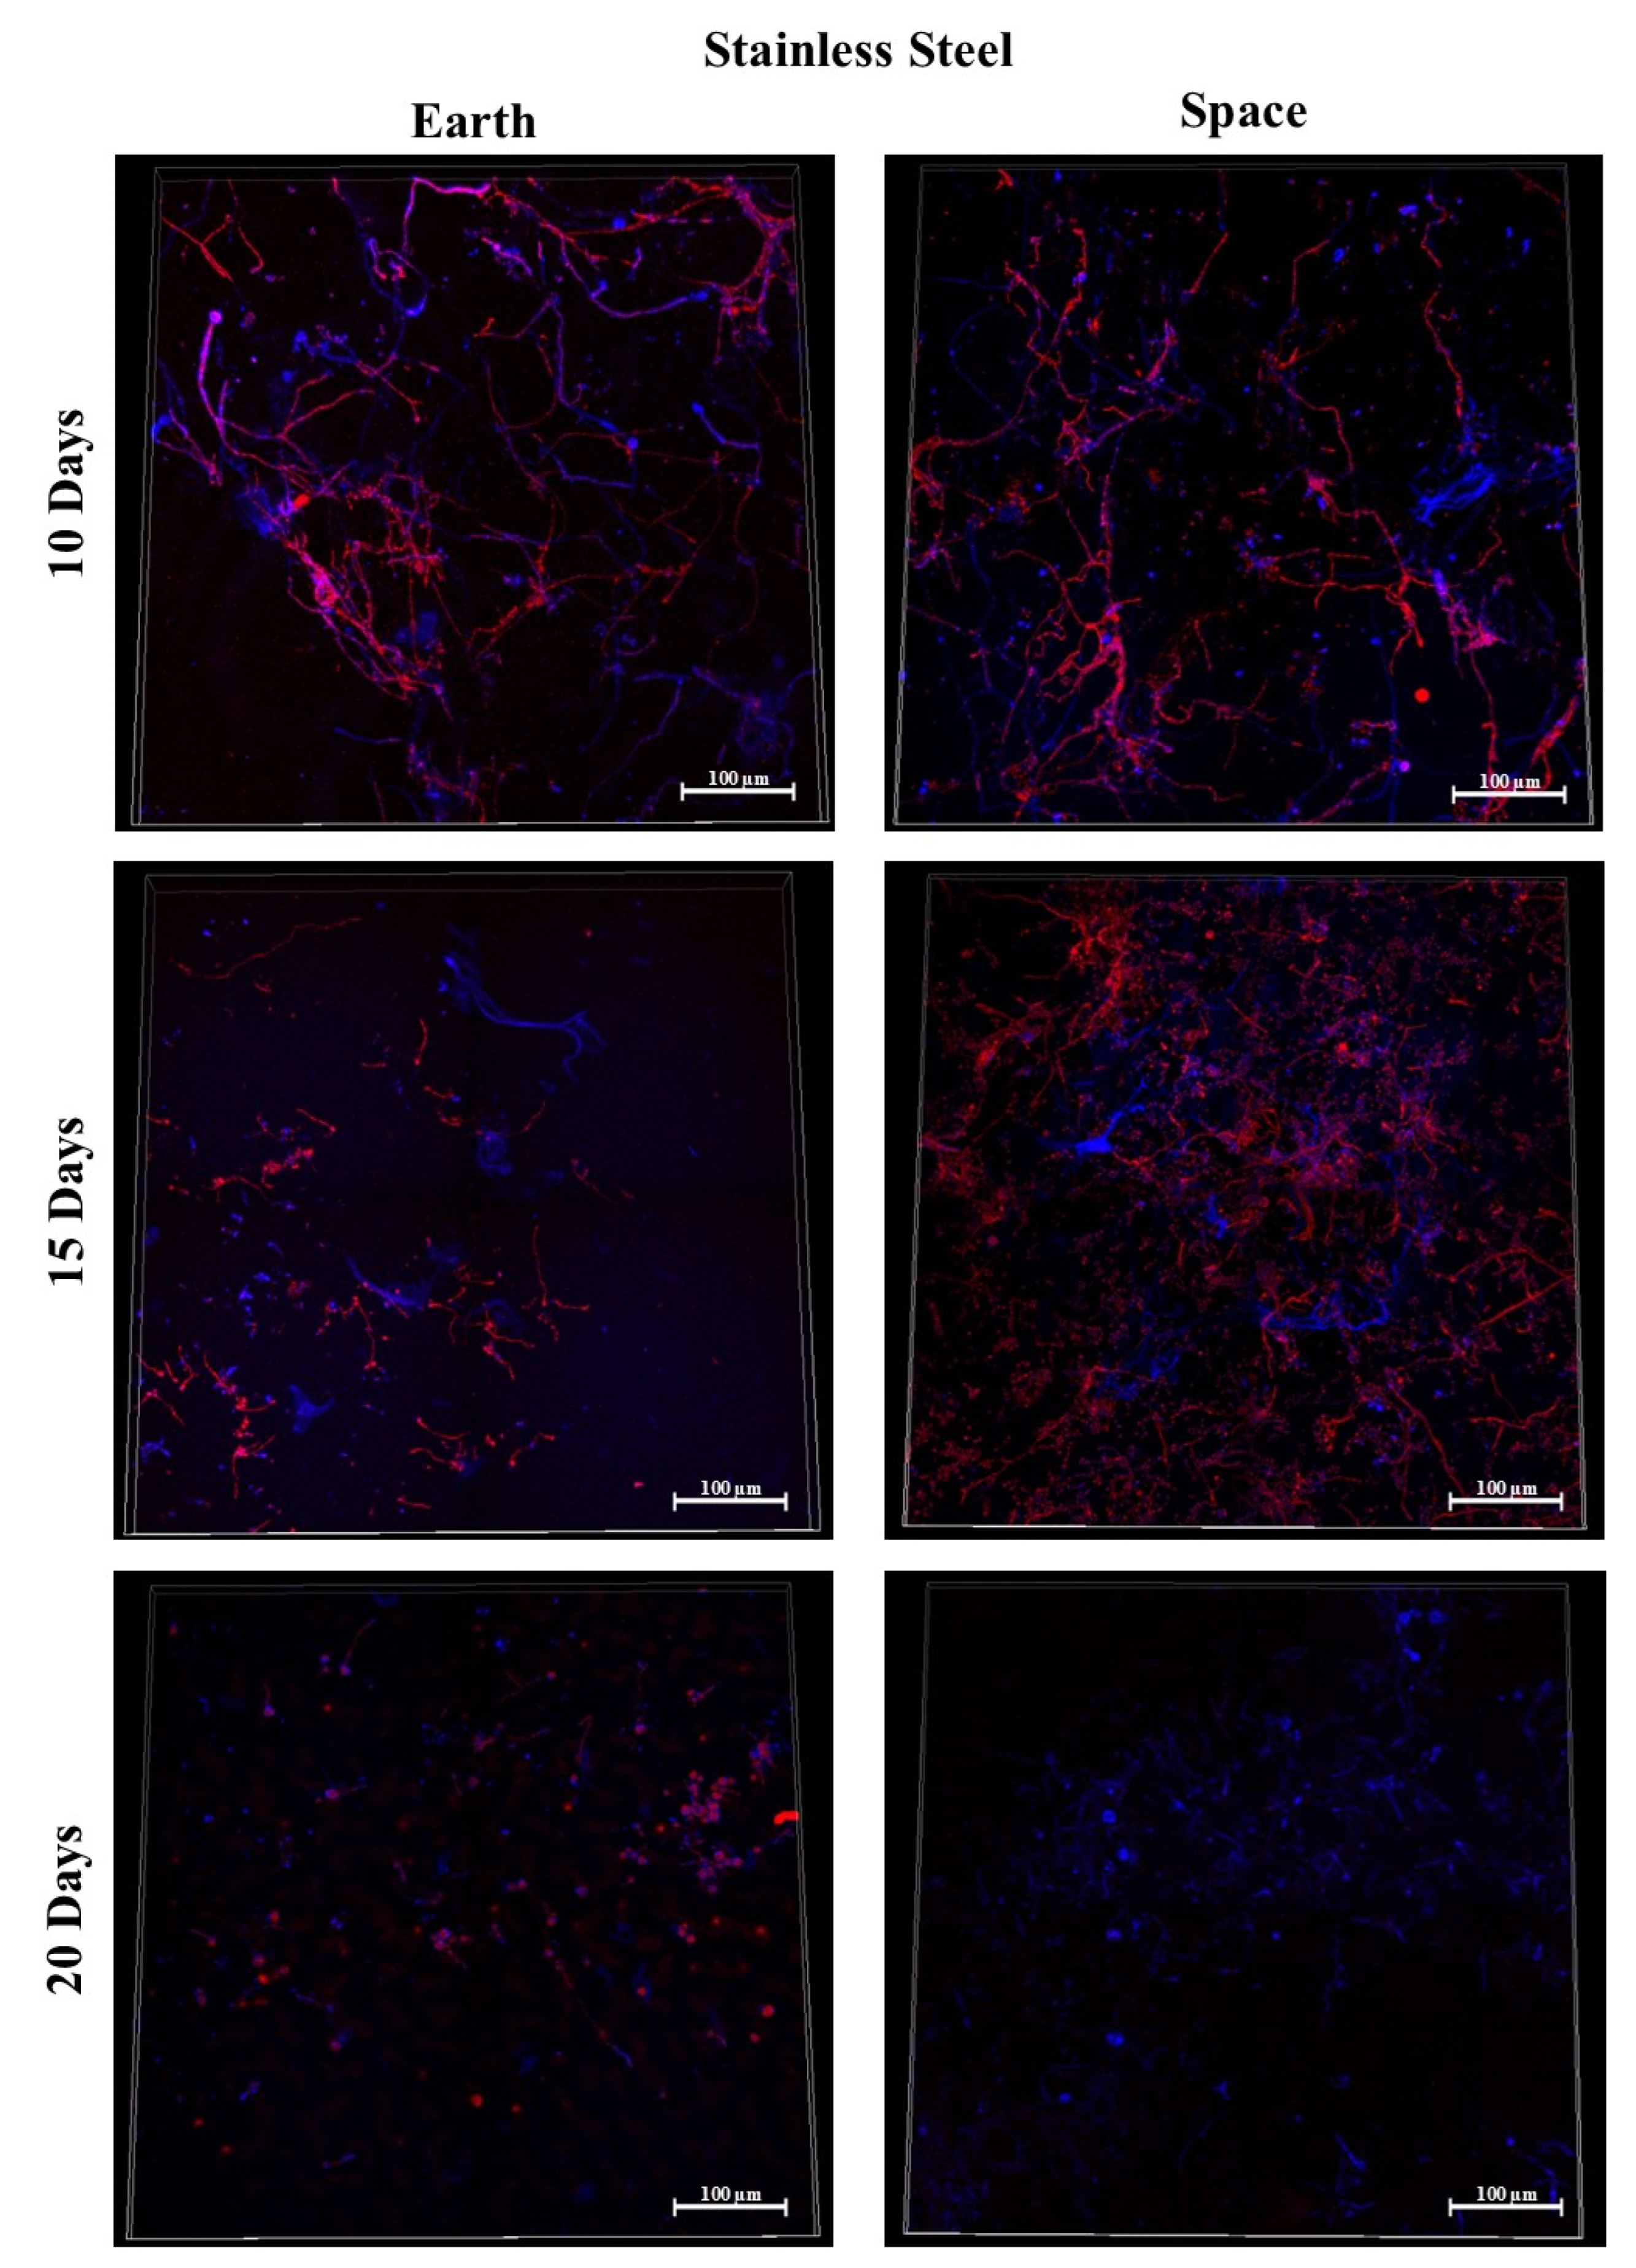
3.4. Stainless Steel 316
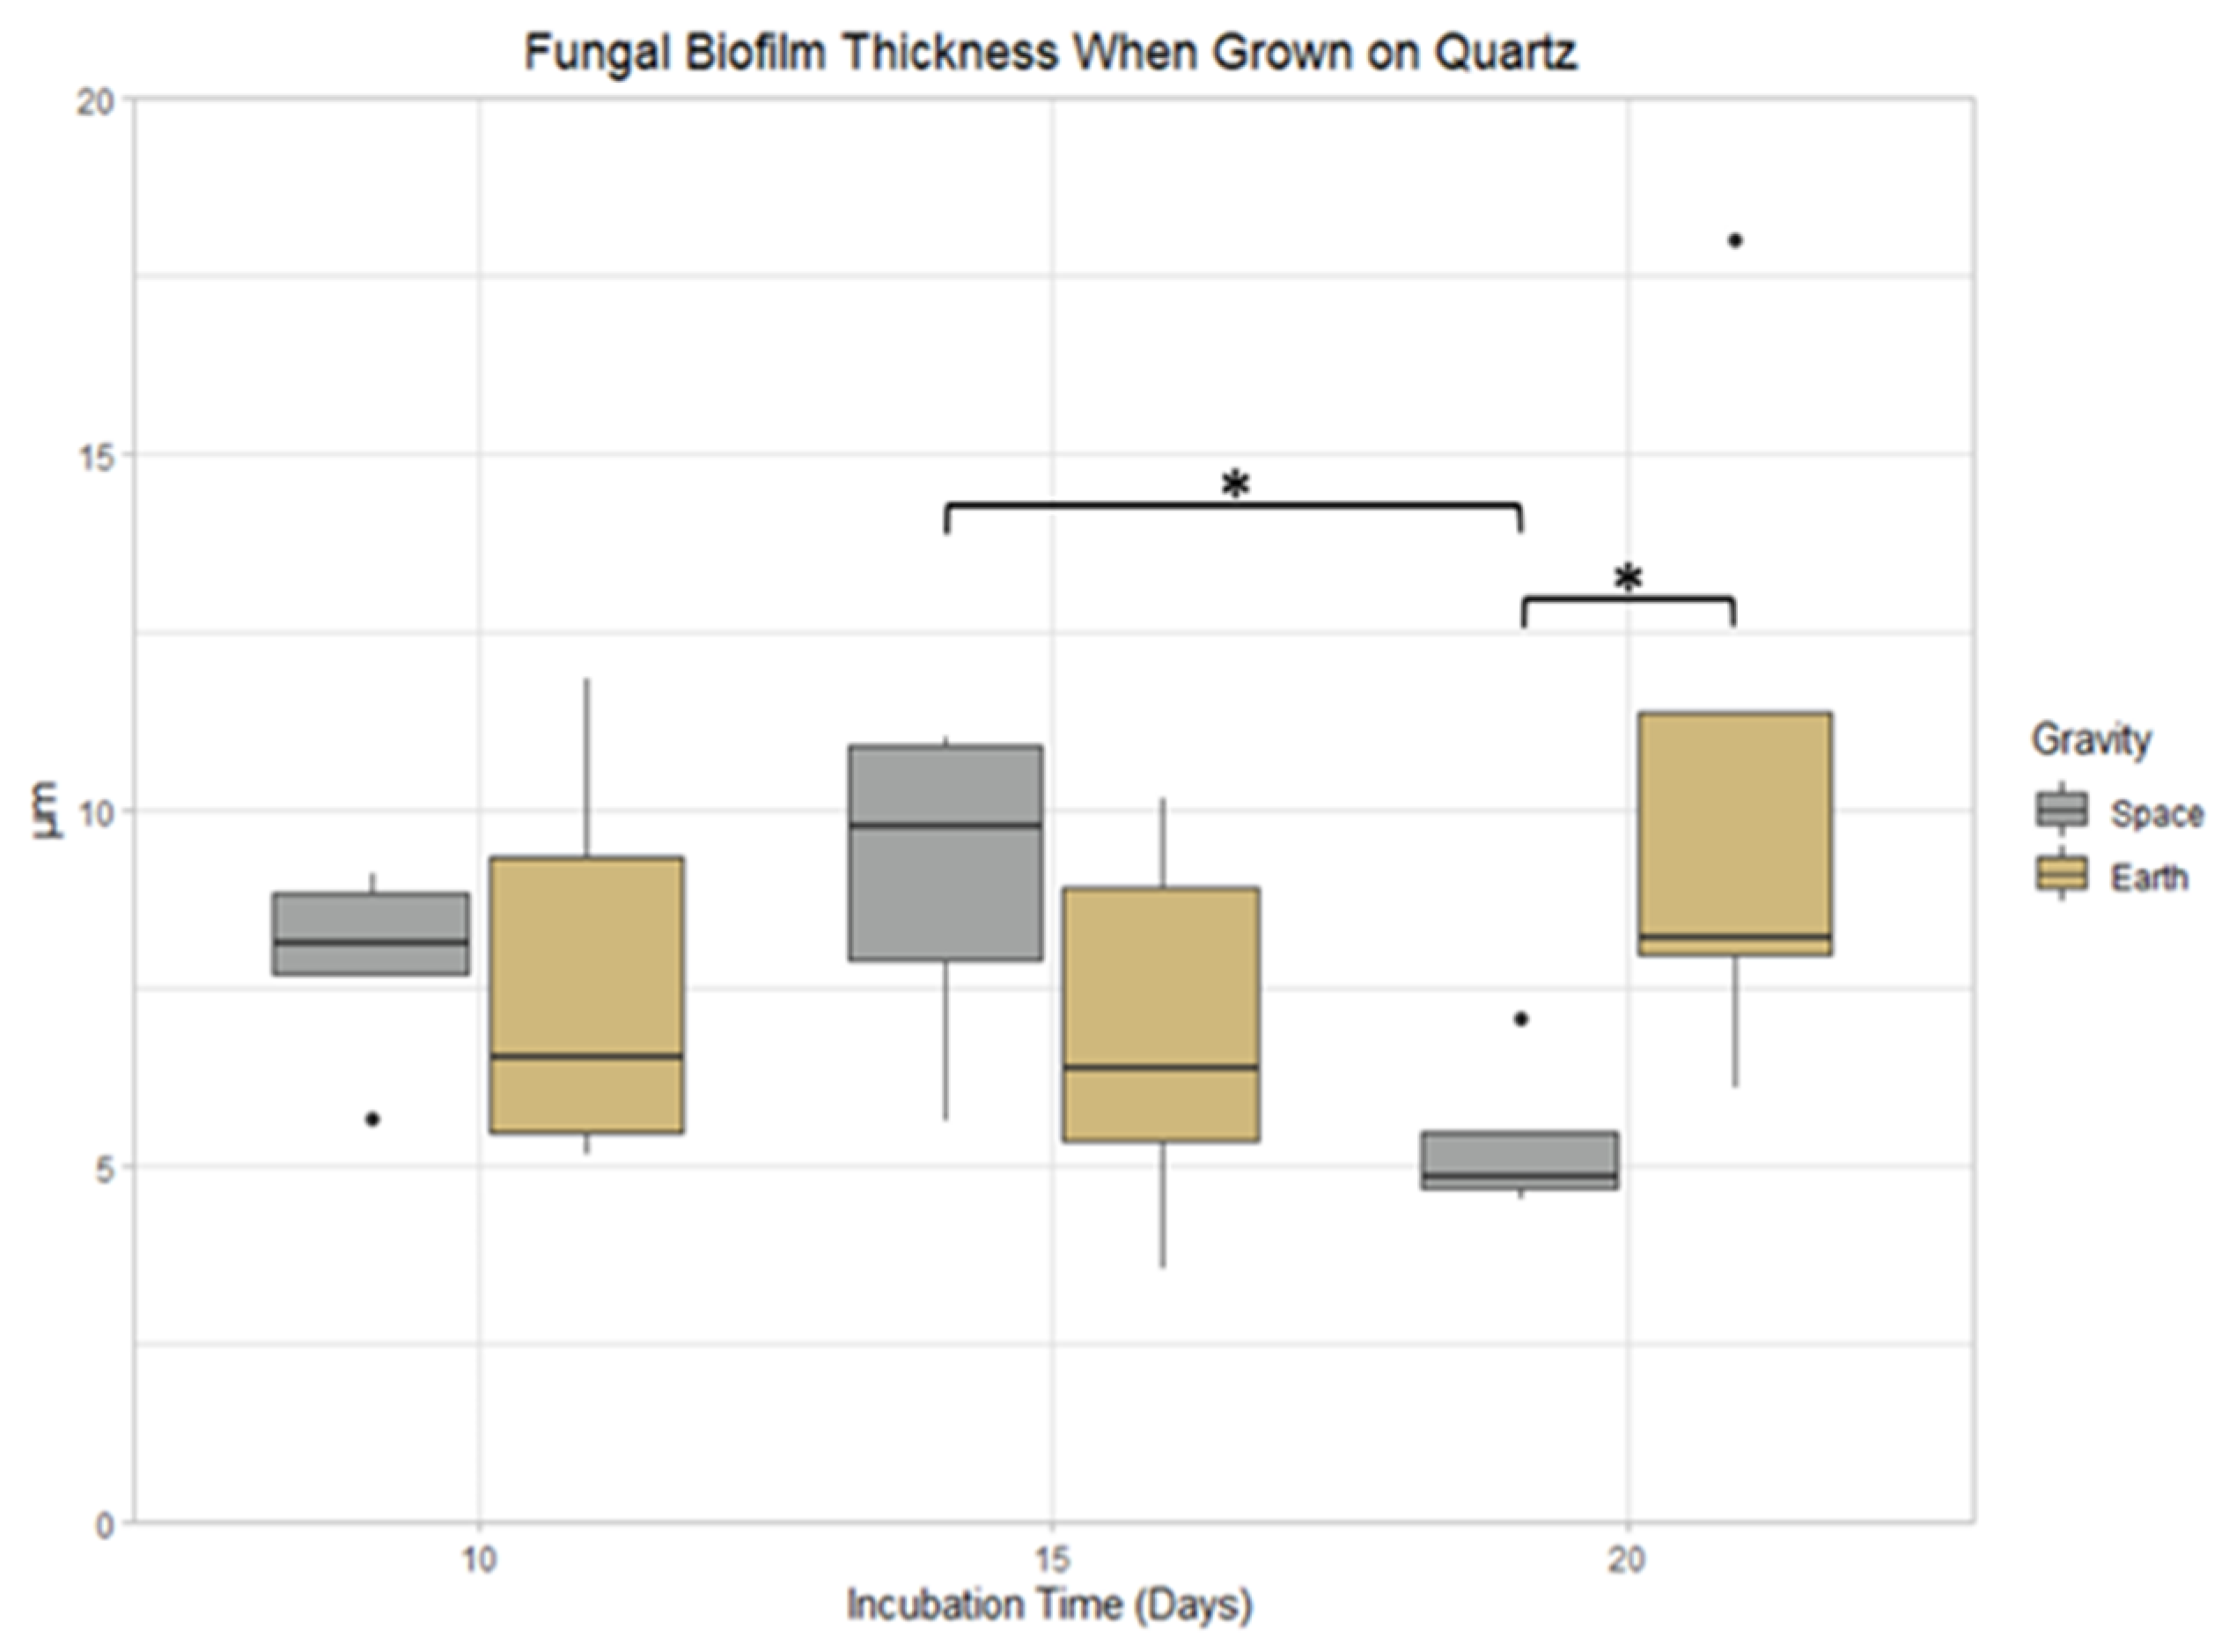
3.5. Quartz
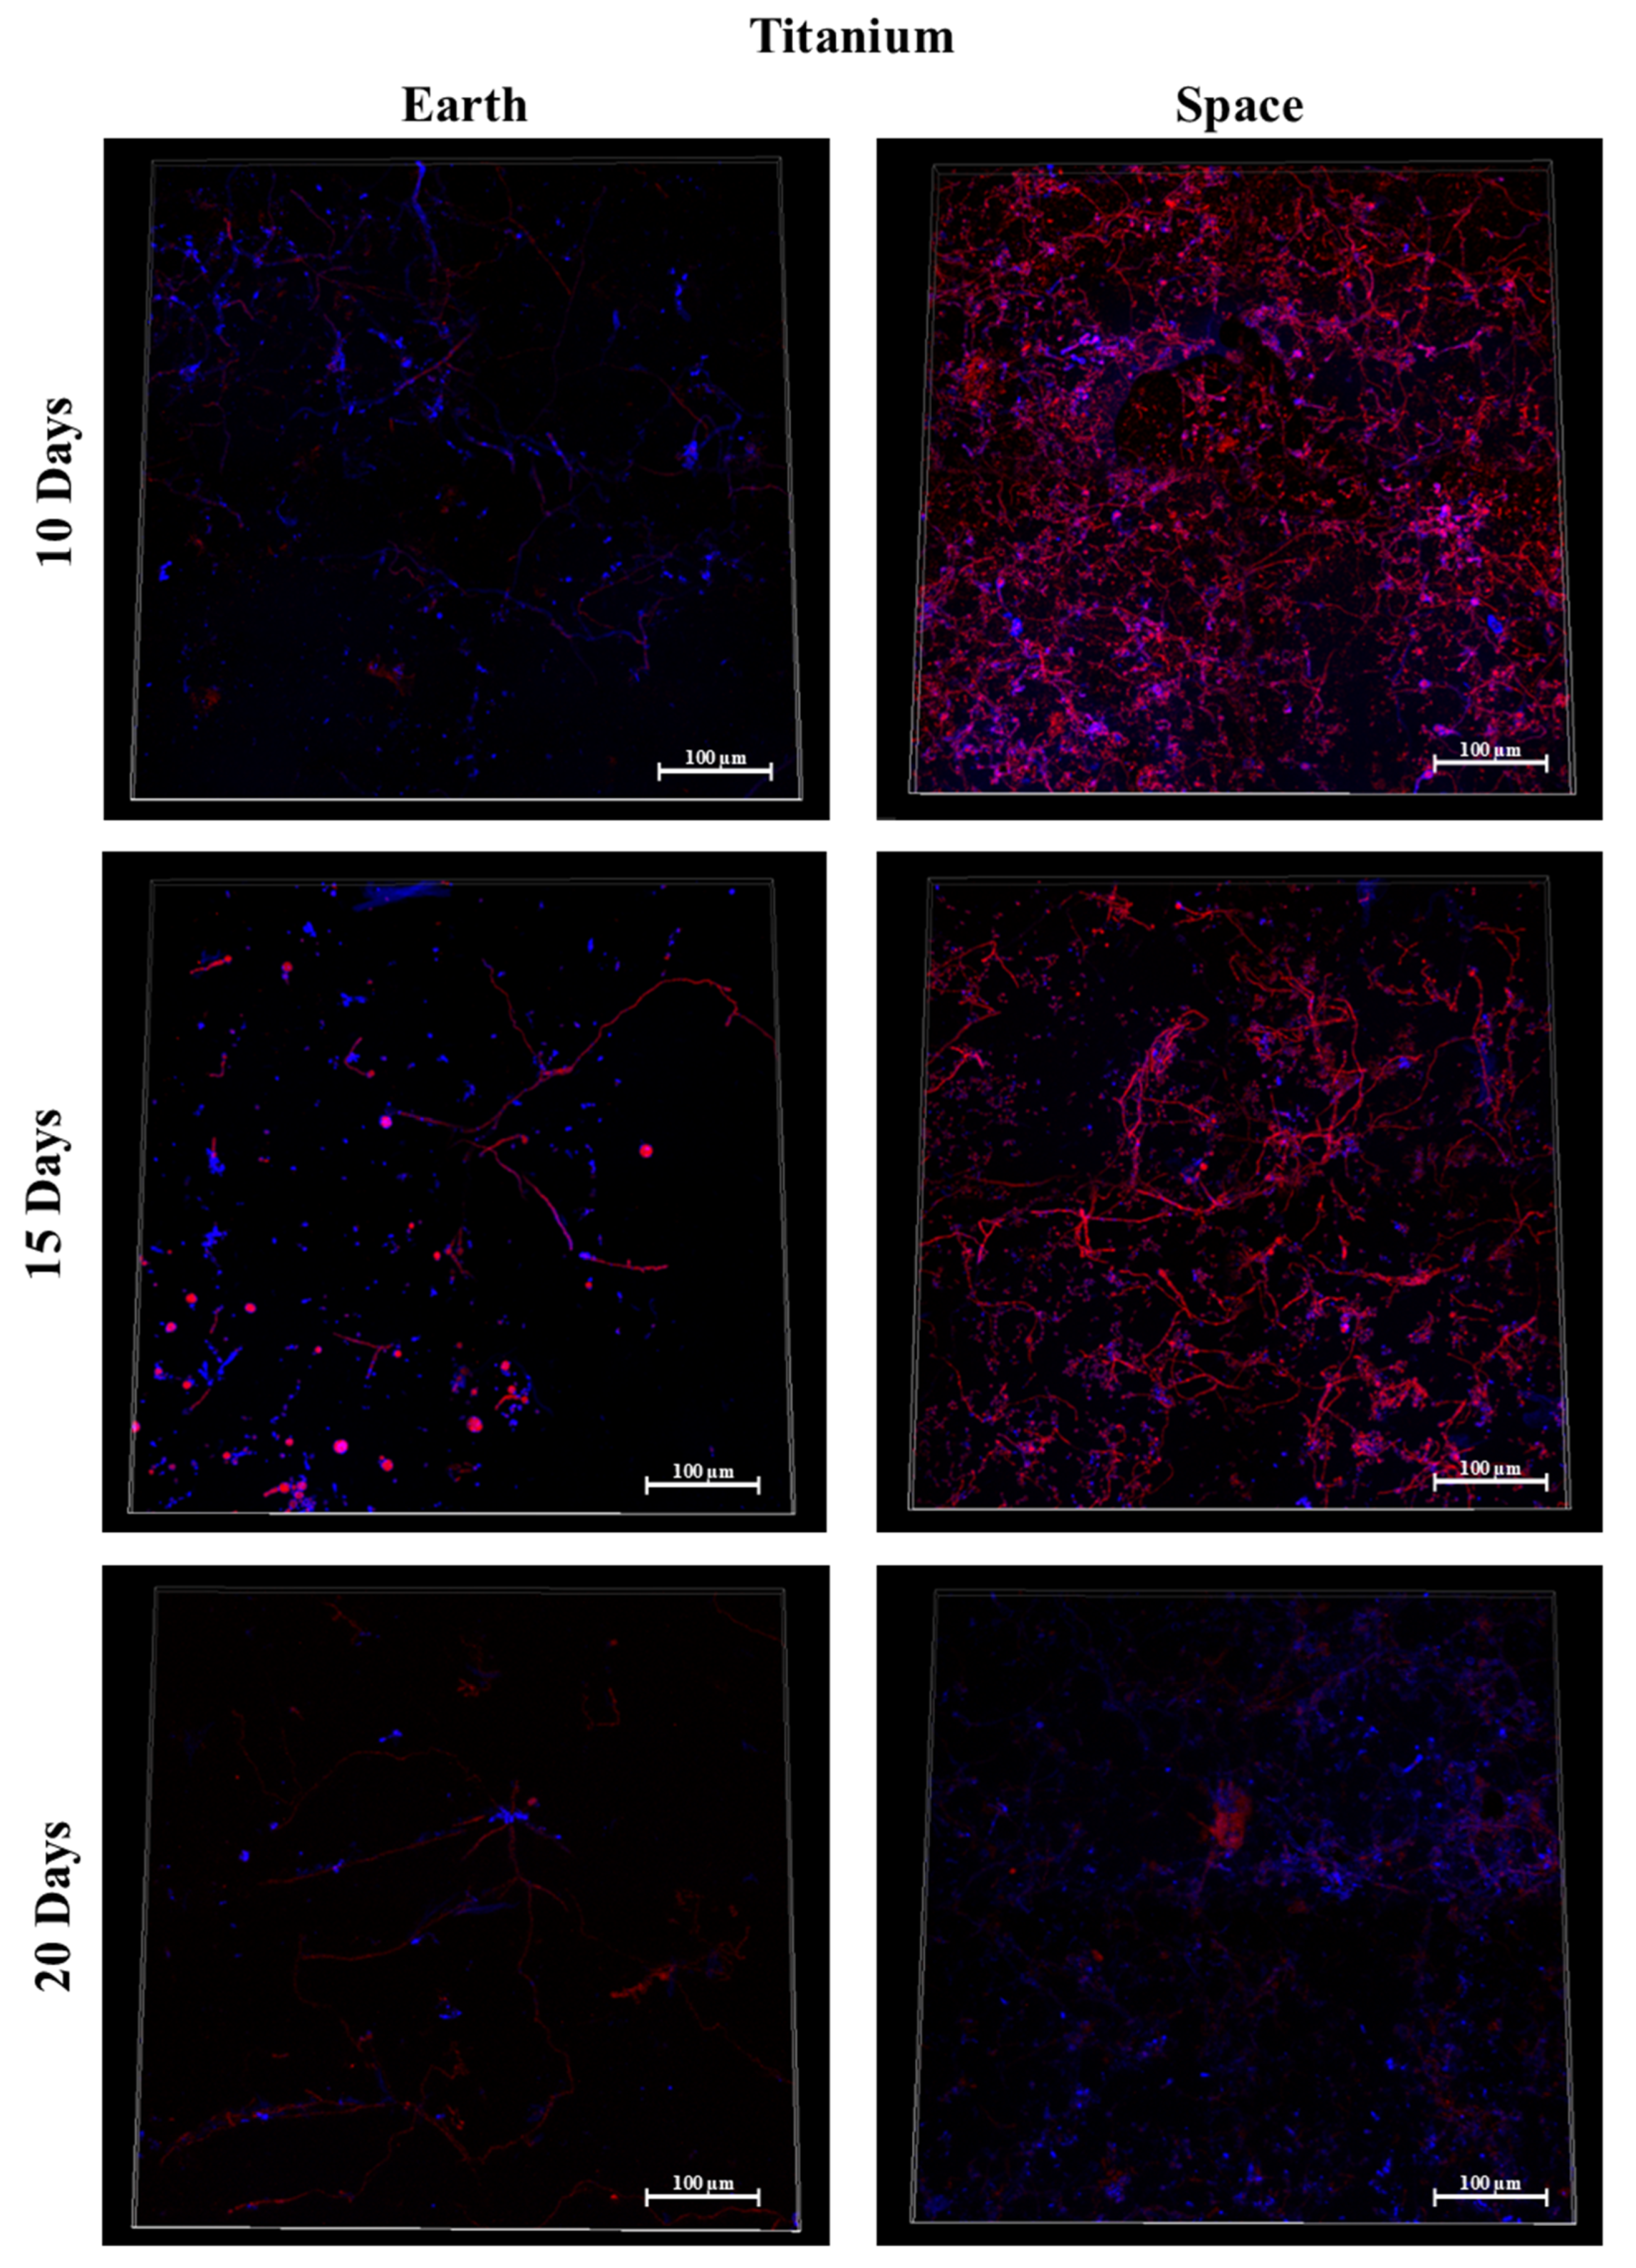
3.6. Titanium Alloy
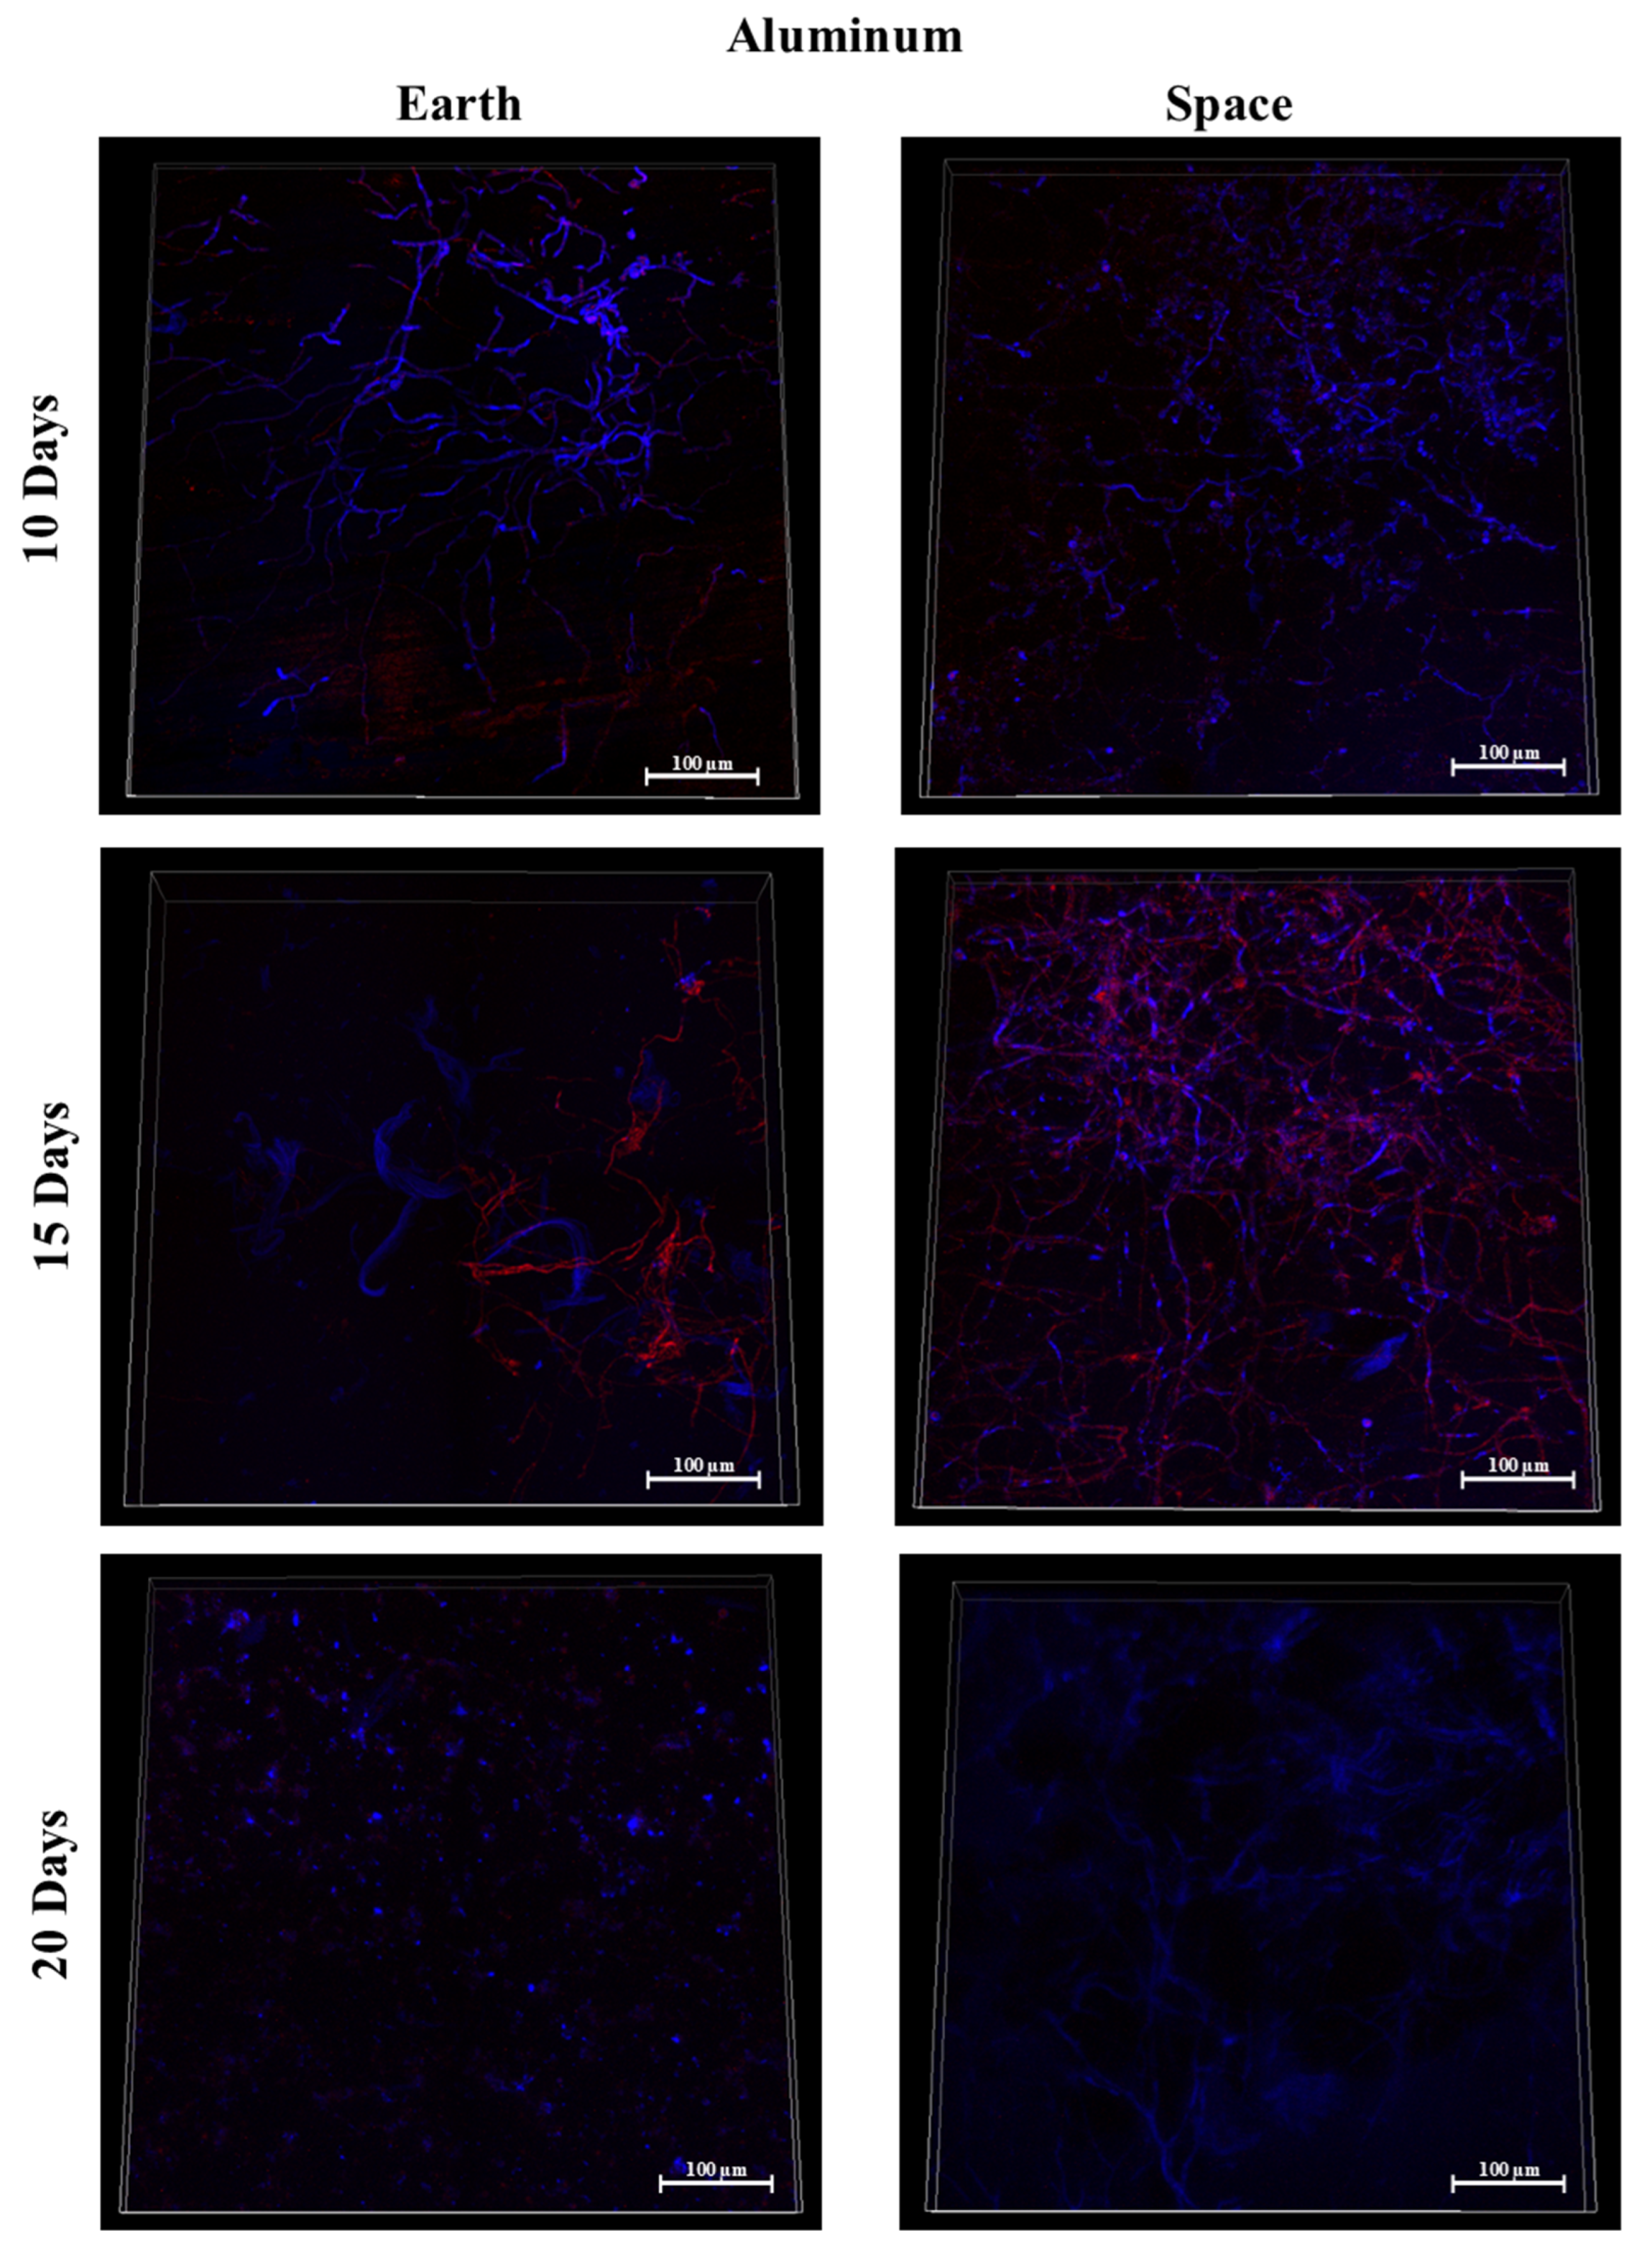
3.7. Silicone, MIT Nanograss, and Aluminum Alloy
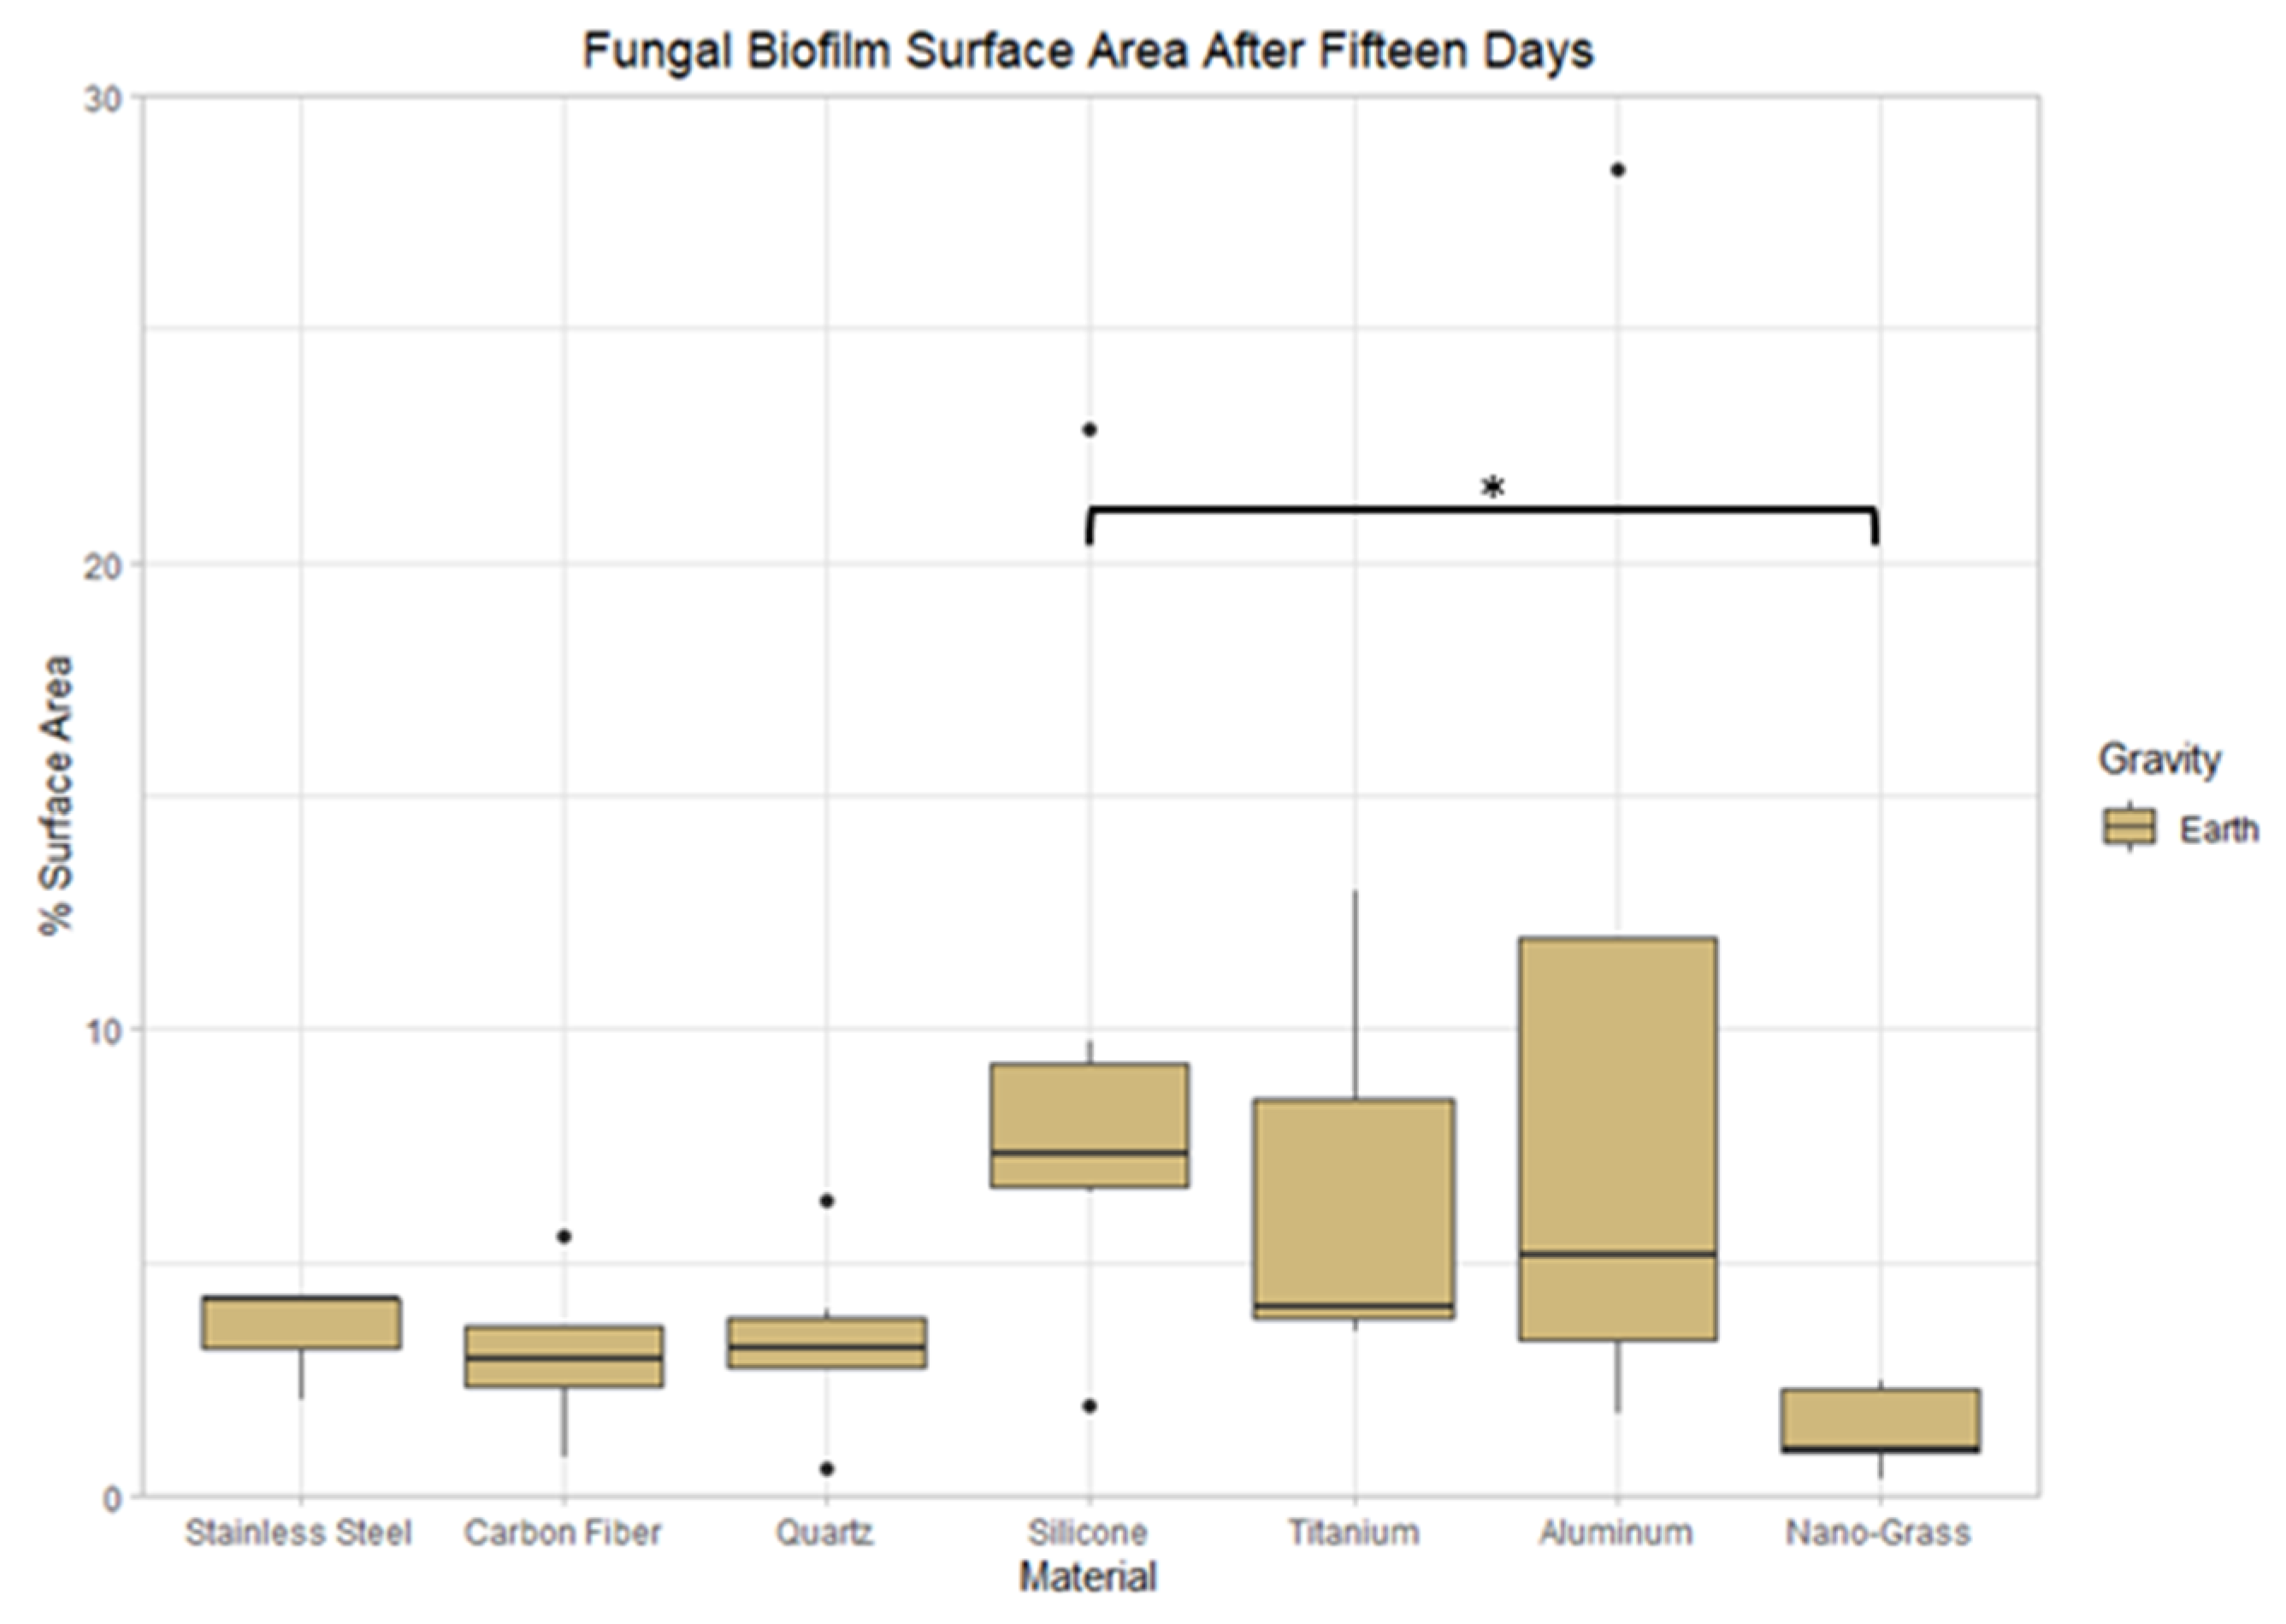
3.8. Effect of Surface Material on Earth
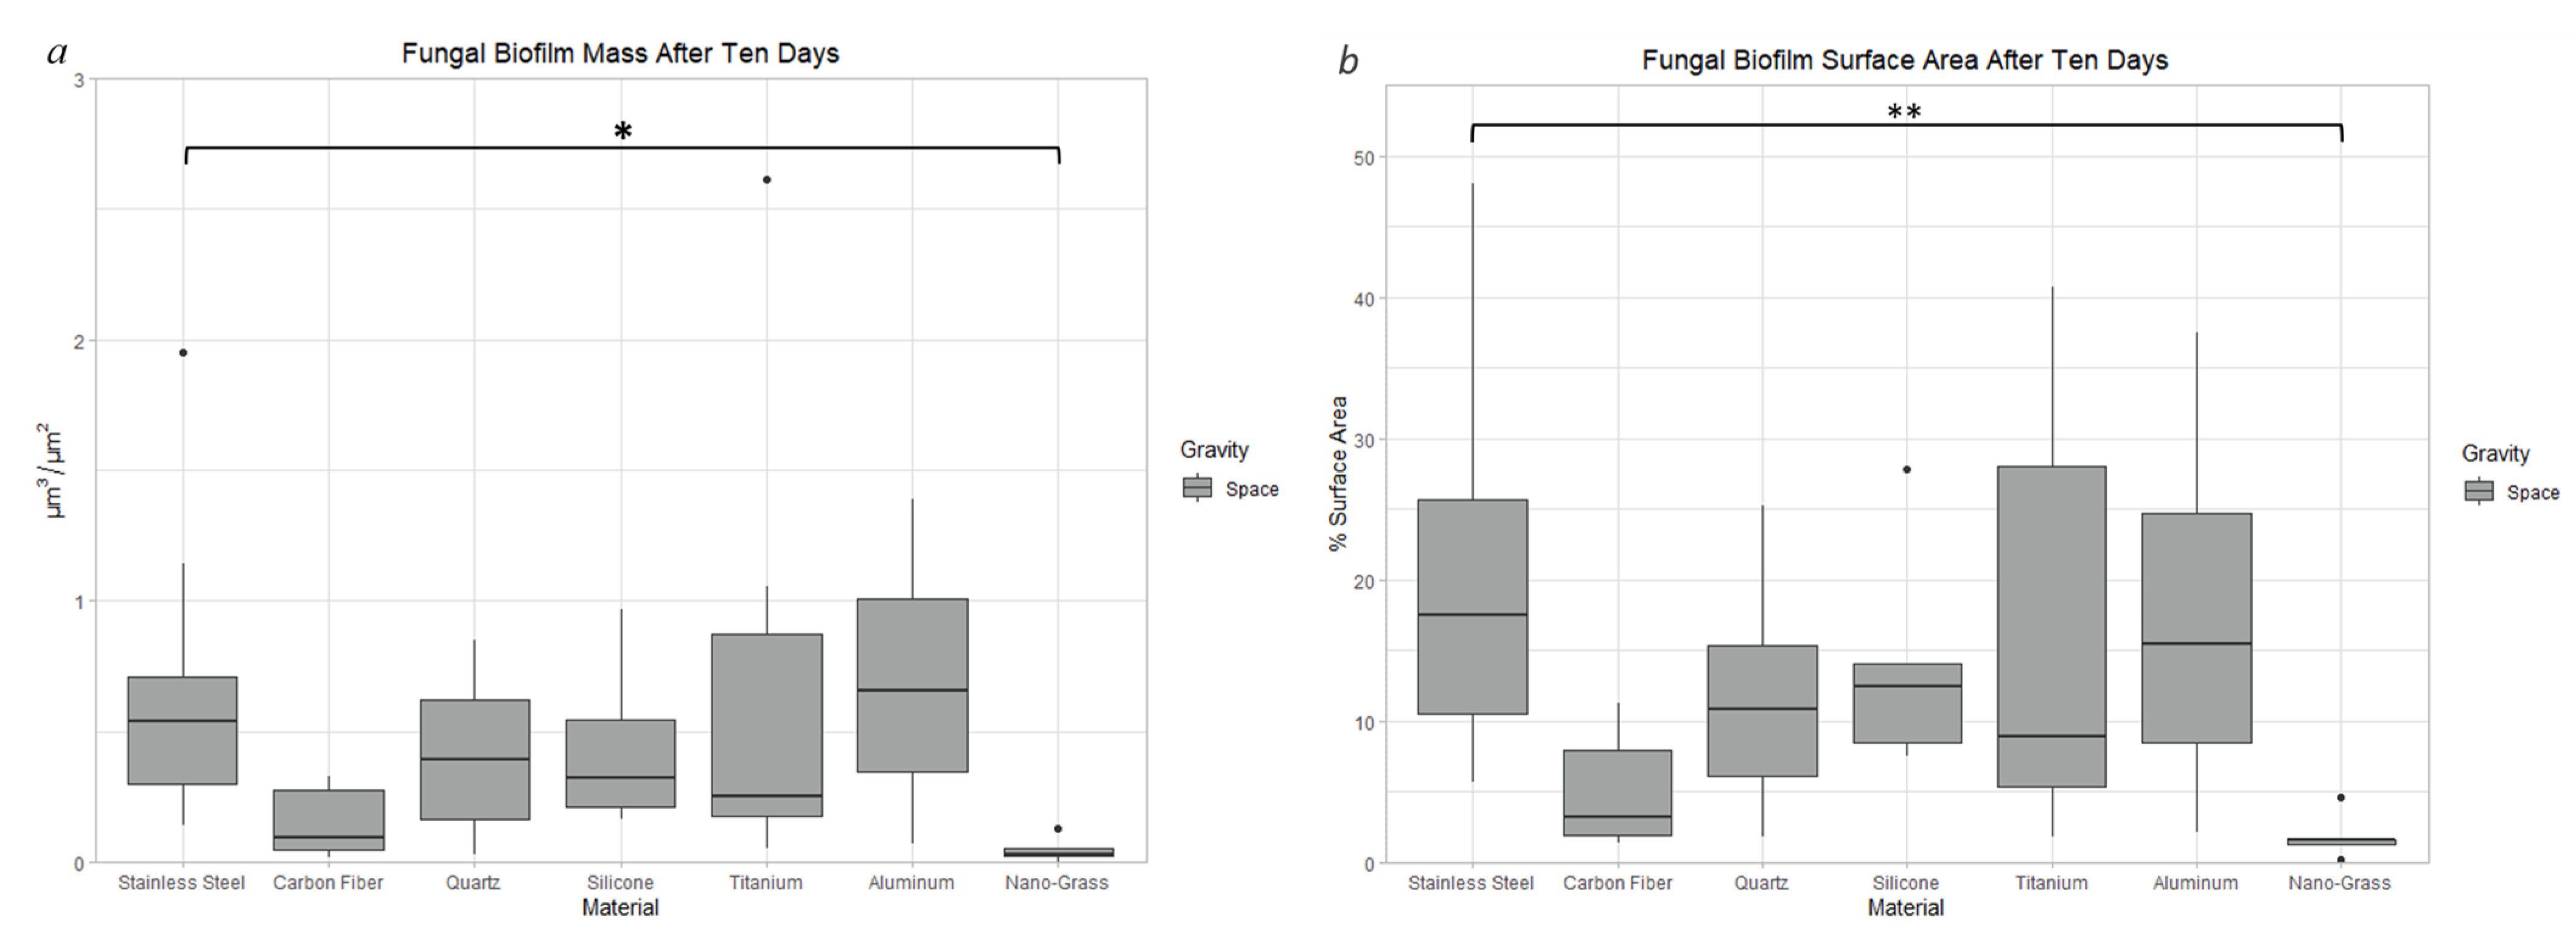
3.9. Effect of Surface Material in Space
3.9.1. Space Samples after 10 Days
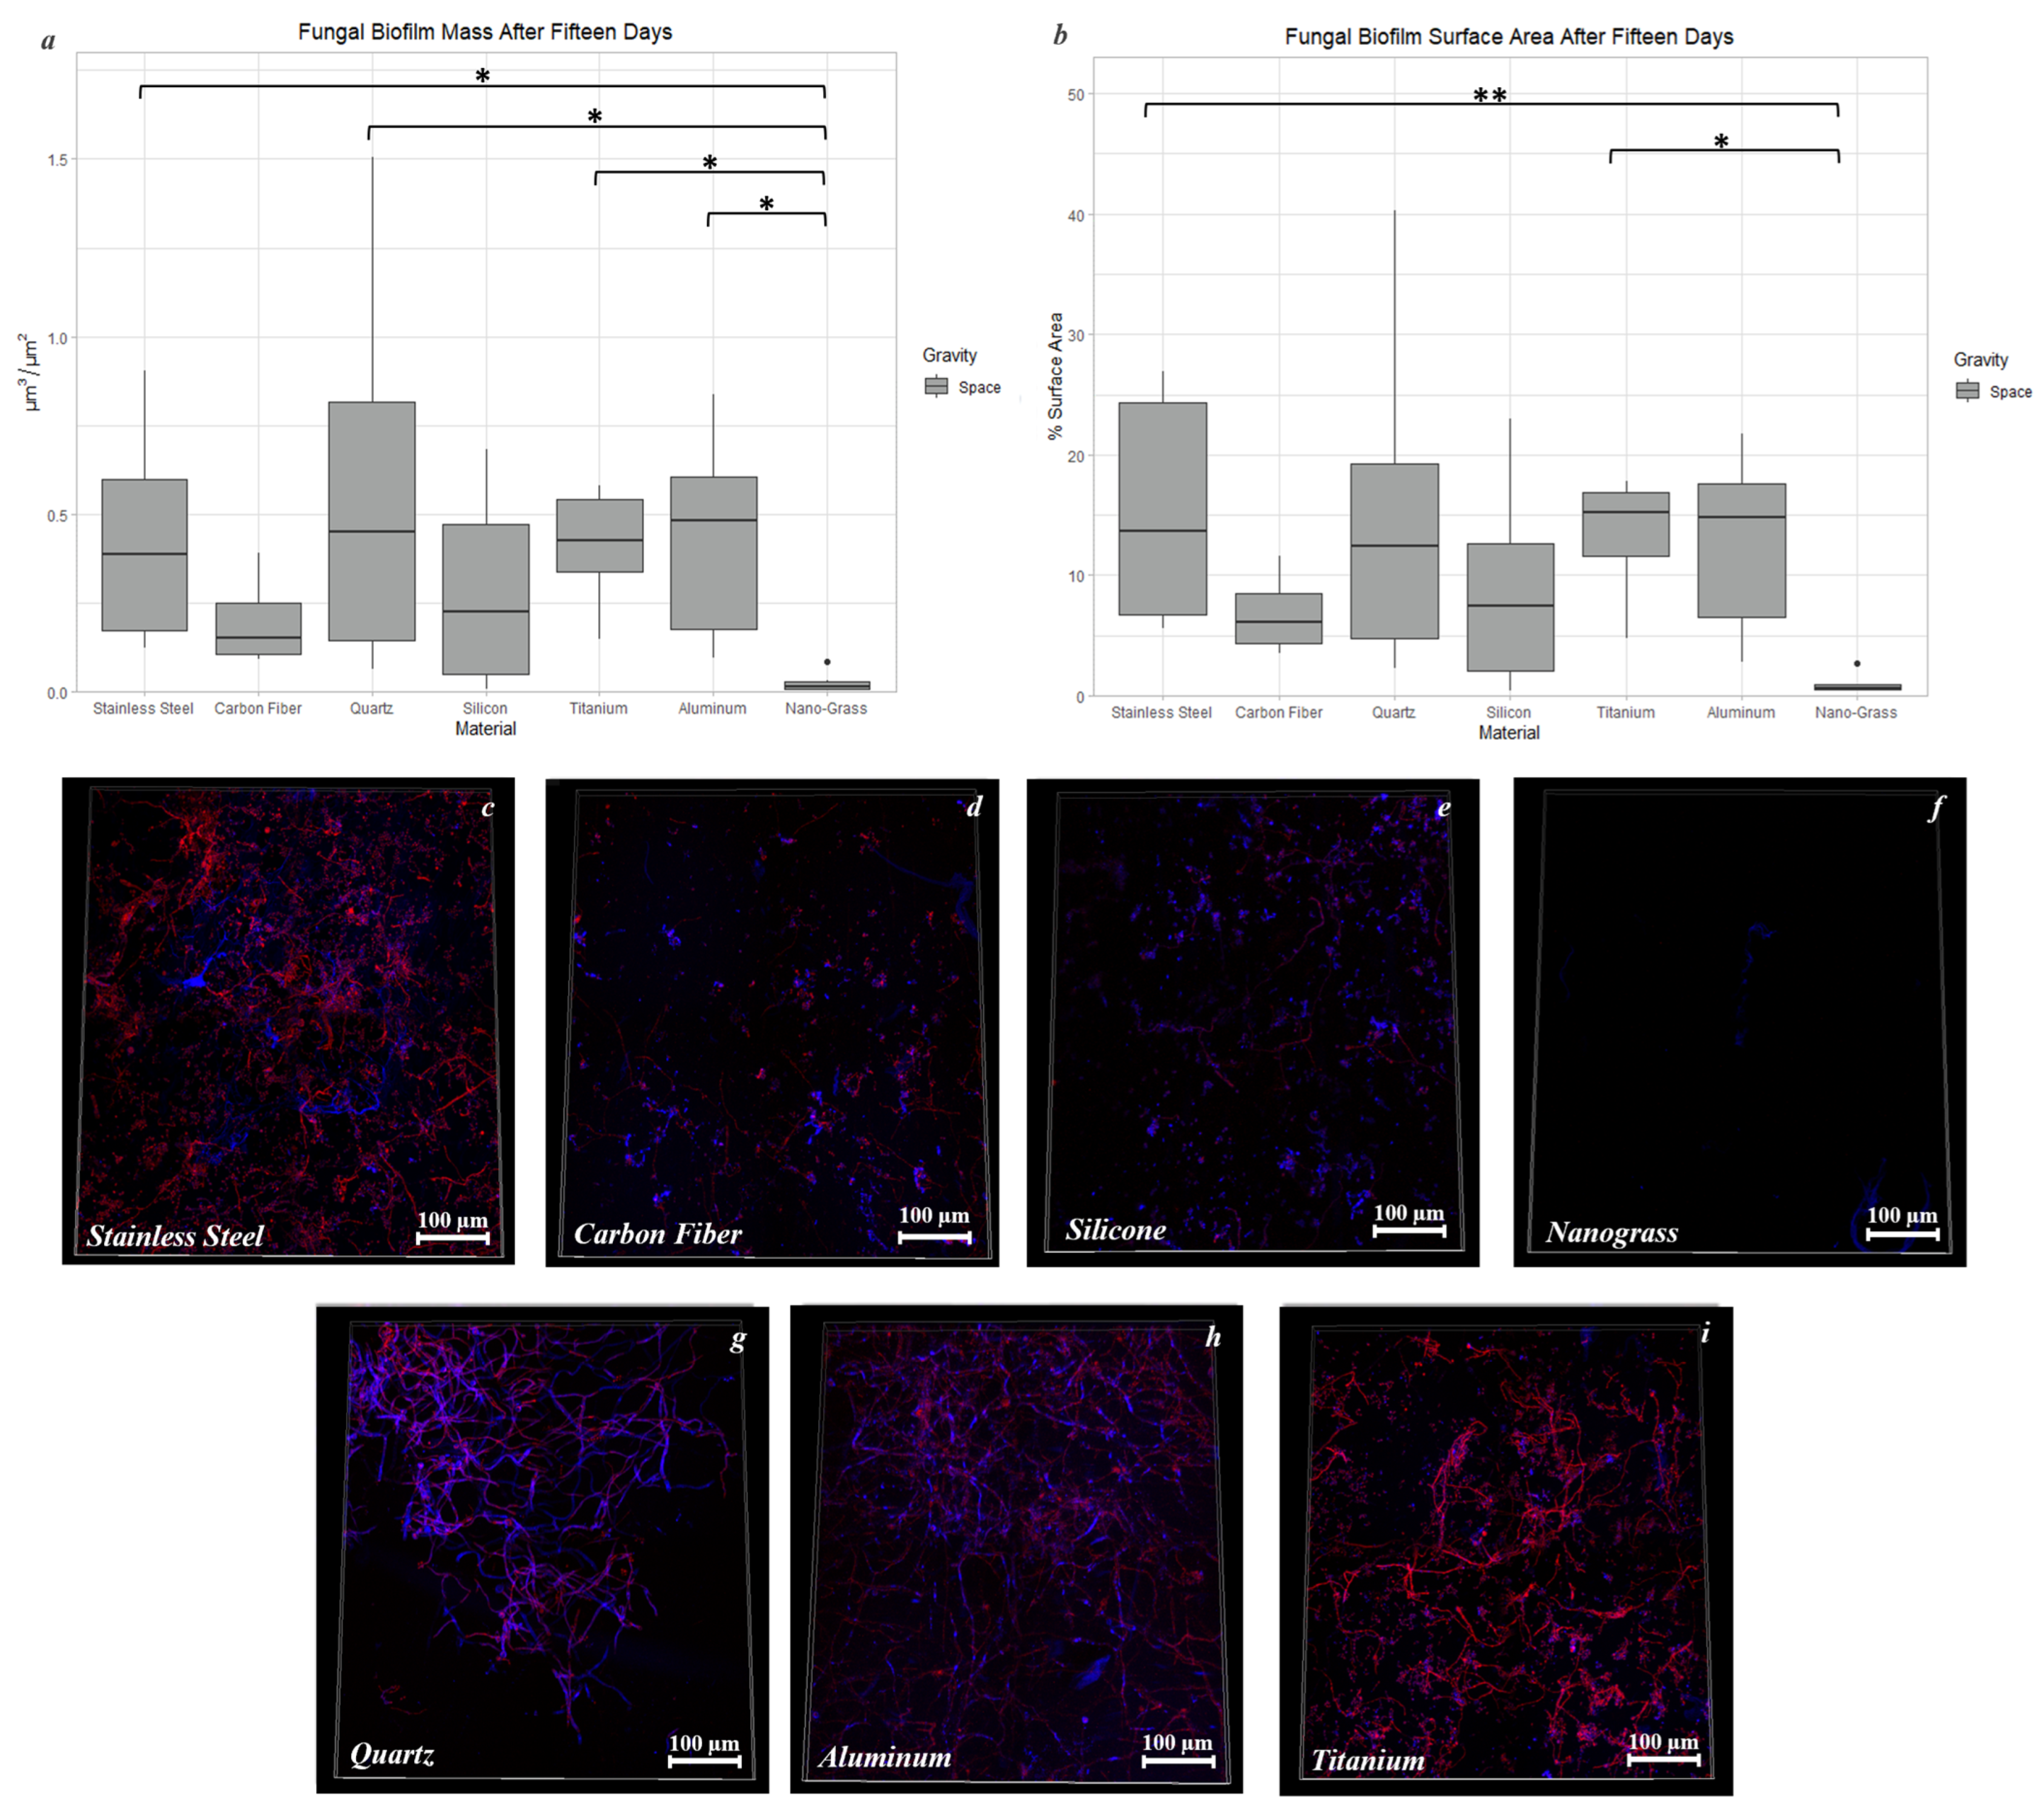
3.9.2. Space Samples after 15 Days
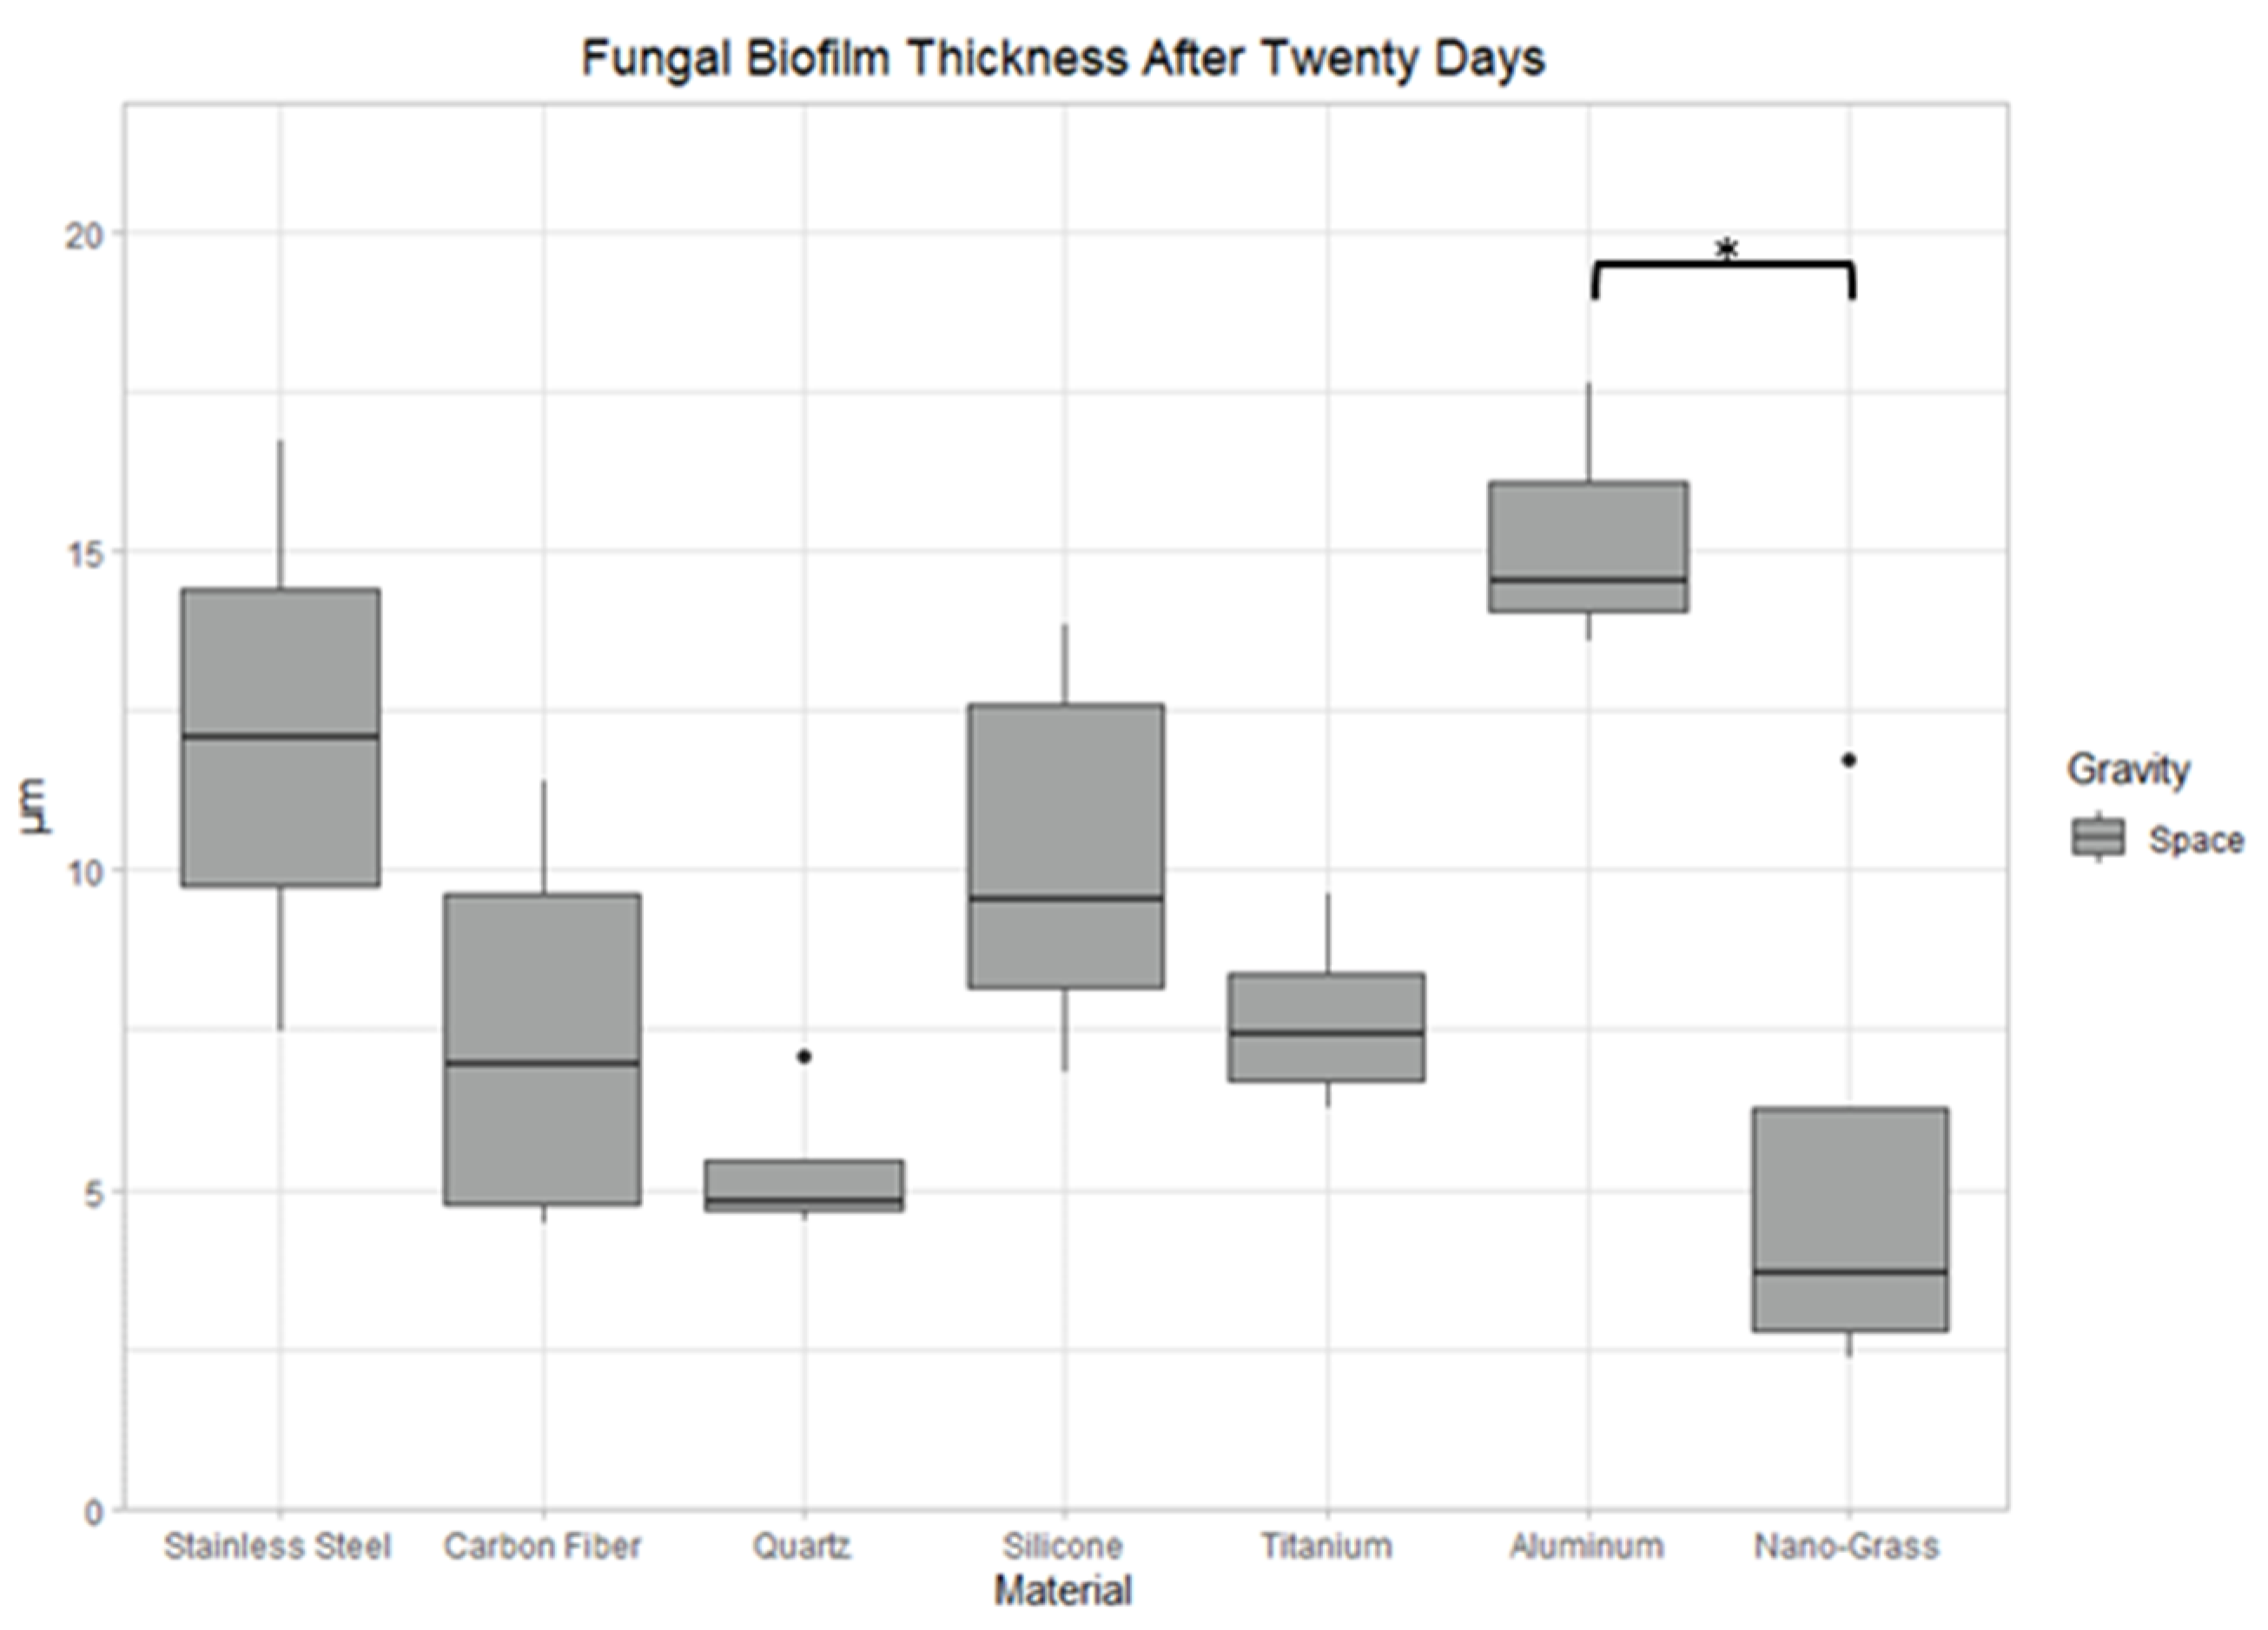
3.9.3. Space Samples after 20 Days
4. Discussion
4.1. The Effect of Microgravity on Biofilm Growth
4.2. The Effect of Material Surface on Biofilm Growth
4.3. The Effect of Incubation Time on Biofilm Growth
Author Contributions
Funding
Informed Consent Statement
Data Availability Statement
Acknowledgments
Conflicts of Interest
Appendix A

Appendix B


References
- Fanning, S.; Mitchell, A.P. Fungal Biofilms. PLoS Pathog. 2012, 8, e1002585. [Google Scholar] [CrossRef] [PubMed] [Green Version]
- Penesyan, A.; Paulsen, I.T.; Kjelleberg, S.; Gillings, M.R. Three faces of biofilms: A microbial lifestyle, a nascent multicellular organism, and an incubator for diversity. NPJ Biofilms Microbiomes 2021, 7, 1–9. [Google Scholar] [CrossRef] [PubMed]
- Ramage, G.; Mowat, E.; Jones, B.; Williams, C.; Lopez-Ribot, J. Our Current Understanding of Fungal Biofilms. Crit. Rev. Microbiol. 2009, 35, 340–355. [Google Scholar] [CrossRef] [PubMed]
- Ramage, G.; Rajendran, R.; Sherry, L.; Williams, C. Fungal Biofilm Resistance. Int. J. Microbiol. 2012, 2012, 528521. [Google Scholar] [CrossRef]
- Blankenship, J.; Mitchell, A.P. How to build a biofilm: A fungal perspective. Curr. Opin. Microbiol. 2006, 9, 588–594. [Google Scholar] [CrossRef]
- Luo, G.; Samaranayake, L.P. Candida glabrata, an emerging fungal pathogen, exhibits superior relative cell surface hydrophobicity and adhesion to denture acrylic surfaces compared with Candida albicans. APMIS 2002, 110, 601–610. [Google Scholar] [CrossRef]
- Silva, S.; Negri, M.; Henriques, M.; Oliveira, R.; Williams, D.W.; Azeredo, J. Adherence and biofilm formation of non-Candida albicans Candida species. Trends Microbiol. 2011, 19, 241–247. [Google Scholar] [CrossRef] [Green Version]
- Klintworth, R.; Reher, H.; Viktorov, A.; Bohle, D. Biological induced corrosion of materials II: New test methods and experiences from mir station. Acta Astronaut. 1999, 44, 569–578. [Google Scholar] [CrossRef]
- Zea, L.; Nisar, Z.; Rubin, P.; Cortesão, M.; Luo, J.; McBride, S.A.; Moeller, R.; Klaus, D.; Müller, D.; Varanasi, K.K.; et al. Design of a spaceflight biofilm experiment. Acta Astronaut. 2018, 148, 294–300. [Google Scholar] [CrossRef]
- Pierson, D.L. Microbial Contamination in the Spacecraft. 1 January 2001. Available online: https://ntrs.nasa.gov/citations/20100036603 (accessed on 20 March 2023).
- Novikova, N.D. Review of the Knowledge of Microbial Contamination of the Russian Manned Spacecraft. Microb. Ecol. 2004, 47, 127–132. [Google Scholar] [CrossRef]
- Costa-Orlandi, C.B.; Sardi, J.C.O.; Pitangui, N.S.; De Oliveira, H.C.; Scorzoni, L.; Galeane, M.C.; Medina-Alarcón, K.P.; Melo, W.C.M.A.; Marcelino, M.Y.; Braz, J.D.; et al. Fungal Biofilms and Polymicrobial Diseases. J. Fungi 2017, 3, 22. [Google Scholar] [CrossRef] [PubMed] [Green Version]
- Brown, G.D.; Denning, D.W.; Gow, N.A.R.; Levitz, S.M.; Netea, M.G.; White, T.C. Hidden Killers: Human Fungal Infections. Sci. Transl. Med. 2012, 4, 165rv13. [Google Scholar] [CrossRef] [PubMed] [Green Version]
- Guevara-Suarez, M.; Sutton, D.A.; Cano-Lira, J.F.; Garcia, D.; Martin-Vicente, A.; Wiederhold, N.; Guarro, J.; Gené, J. Identification and Antifungal Susceptibility of Penicillium-Like Fungi from Clinical Samples in the United States. J. Clin. Microbiol. 2016, 54, 2155–2161. [Google Scholar] [CrossRef] [PubMed] [Green Version]
- Borchers, A.T.; Keen, C.L.; Gershwin, M. Microgravity and immune responsiveness: Implications for space travel. Nutrition 2002, 18, 889–898. [Google Scholar] [CrossRef] [PubMed]
- CDC. Reduce Your Exposure to Mold in Your Home | Mold | CDC. 17 November 2022. Available online: https://www.cdc.gov/mold/reduce-your-exposure-to-mold.html (accessed on 17 January 2023).
- CDC. Invasive Mold Infections in Immunocompromised People | Mold | CDC. 19 September 2022. Available online: https://www.cdc.gov/mold/invasive-mold-infections.htm (accessed on 18 January 2023).
- Hoffman, M.; Bash, E.; Berger, S.A.; Burke, M.; Yust, I. Fatal necrotizing esophagitis due toPenicillium chrysogenum in a patient with acquired immunodeficiency syndrome. Eur. J. Clin. Microbiol. Infect. Dis. 1992, 11, 1158–1160. [Google Scholar] [CrossRef]
- Eschete, M.L.; King, J.W.; West, B.C.; Oberle, A. Penicillium chrysogenum endophthalmitis: First reported case. A New Invasive Pathogen. Mycopathologia 1981, 74, 125–127. [Google Scholar] [CrossRef] [PubMed]
- Geltner, C.; Lass-Flörl, C.; Bonatti, H.; Müller, L.; Stelzmüller, I. Invasive Pulmonary Mycosis Due to Penicillium chrysogenum. Transplantation 2013, 95, e21–e23. [Google Scholar] [CrossRef]
- Zea, L.; McLean, R.J.; Rook, T.A.; Angle, G.; Carter, D.L.; Delegard, A.; Denvir, A.; Gerlach, R.; Gorti, S.; McIlwaine, D.; et al. Potential biofilm control strategies for extended spaceflight missions. Biofilm 2020, 2, 100026. [Google Scholar] [CrossRef]
- Horneck, G.; Klaus, D.M.; Mancinelli, R.L. Space Microbiology. Microbiol. Mol. Biol. Rev. 2010, 74, 121–156. [Google Scholar] [CrossRef] [Green Version]
- Zea, L.; Prasad, N.; Levy, S.E.; Stodieck, L.; Jones, A.; Shrestha, S.; Klaus, D. A Molecular Genetic Basis Explaining Altered Bacterial Behavior in Space. PLoS ONE 2016, 11, e0164359. [Google Scholar] [CrossRef] [Green Version]
- Zea, L.; Larsen, M.; Estante, F.; Qvortrup, K.; Moeller, R.; de Oliveira, S.D.; Stodieck, L.; Klaus, D. Phenotypic Changes Exhibited by E. coli Cultured in Space. Front. Microbiol. 2017, 8, 1598. [Google Scholar] [CrossRef] [PubMed] [Green Version]
- Aunins, T.R.; Erickson, K.E.; Prasad, N.; Levy, S.E.; Jones, A.; Shrestha, S.; Mastracchio, R.; Stodieck, L.; Klaus, D.; Zea, L.; et al. Spaceflight Modifies Escherichia coli Gene Expression in Response to Antibiotic Exposure and Reveals Role of Oxidative Stress Response. Front. Microbiol. 2018, 9, 310. [Google Scholar] [CrossRef] [PubMed] [Green Version]
- Cottin, H.; Rettberg, P. EXPOSE-R2 on the International Space Station (2014–2016): Results from the PSS and BOSS Astrobiology Experiments. Astrobiology 2019, 19, 975–978. [Google Scholar] [CrossRef] [PubMed]
- Zhao, X.; Yu, Y.; Zhang, X.; Huang, B.; Bai, P.; Xu, C.; Li, D.; Zhang, B.; Liu, C. Decreased biofilm formation ability of Acinetobacter baumannii after spaceflight on China’s Shenzhou 11 spacecraft. Microbiol. Open 2019, 8, e00763. [Google Scholar] [CrossRef] [PubMed] [Green Version]
- Loudon, C.-M.; Nicholson, N.; Finster, K.; Leys, N.; Byloos, B.; Van Houdt, R.; Rettberg, P.; Moeller, R.; Fuchs, F.M.; Demets, R.; et al. BioRock: New experiments and hardware to investigate microbe–mineral interactions in space. Int. J. Astrobiol. 2017, 17, 303–313. [Google Scholar] [CrossRef] [Green Version]
- Flores, P.; Schauer, R.; McBride, S.A.; Luo, J.; Hoehn, C.; Doraisingam, S.; Widhalm, D.; Chadha, J.; Selman, L.; Mueller, D.W.; et al. Preparation for and performance of a Pseudomonas aeruginosa biofilm experiment on board the International Space Station. Acta Astronaut. 2022, 199, 386–400. [Google Scholar] [CrossRef]
- Flores, P.; Luo, J.; Mueller, D.; Muecklich, F.; Zea, L. Space Biofilms—An Overview of the Morphology of Pseudomonas aeruginosa Biofilms Grown on Silicone and Cellulose Membranes on board the International Space Station. Acta Astronautica 2022, 199, 386–400. [Google Scholar] [CrossRef]
- Flores, P.; McBride, S.; Varanasi, K.; Galazka, J.; Zea, L. Biofilms formation of Pseudomonas aeruginosa in spaceflight is minimized on Lubricant Impregnated Surface. Res. Sq. 2022. [Google Scholar] [CrossRef]
- Smith, J.D.; Dhiman, R.; Anand, S.; Reza-Garduno, E.; Cohen, R.E.; McKinley, G.H.; Varanasi, K.K. Droplet mobility on lubricant-impregnated surfaces. Soft Matter 2013, 9, 1772–1780. [Google Scholar] [CrossRef] [Green Version]
- Bekker, M.M. Growth of Penicillium rubens after Desiccation. Ph.D. Thesis, Eindhoven University of Technology, Eindhoven, The Netherlands, 2014. [Google Scholar] [CrossRef]
- Schneider, C.A.; Rasband, W.S.; Eliceiri, K.W. NIH Image to ImageJ: 25 Years of image analysis. Nat. Methods 2012, 9, 671–675. [Google Scholar] [CrossRef]
- Rasband, W. Slice Remover. 2009. [ImageJ]. Available online: https://imagej.nih.gov/ij/plugins/slice-remover.html (accessed on 1 June 2022).
- Heydorn, A.; Ersbøll, B.K.; Vorregaard, M. Comstat2. 1 July 2015. Available online: www.comstat.dk (accessed on 1 June 2022).
- Heydorn, A.; Nielsen, A.T.; Hentzer, M.; Sternberg, C.; Givskov, M.; Ersbøll, B.K.; Molin, S. Quantification of biofilm structures by the novel computer program comstat. Microbiology 2000, 146 Pt 10, 2395–2407. [Google Scholar] [CrossRef] [PubMed] [Green Version]
- Vorregaard, M. Comstat2—A Modern 3D Image Analysis Environment for Biofilms. Ph.D. Thesis, Technical University of Denmark, Lyngby, Denmark, 2008. [Google Scholar]
- Singh, P.; Chauhan, M. Influence of Environmental Factors on The Growth of Building Deteriorating Fungi: Aspergillus Flavus and Penicillium Chrysogenum. Int. J. Pharm. Sci. Res. 2012, 4, 425–429. [Google Scholar]
- Ruijten, P.; Huinink, H.P.; Adan, O.C.G. Hyphal growth of Penicillium rubens in changing relative humidity. Appl. Microbiol. Biotechnol. 2021, 105, 5159–5171. [Google Scholar] [CrossRef]
- Segers, F.J.J.; van Laarhoven, K.A.; Huinink, H.P.; Adan, O.C.G.; Wösten, H.A.B.; Dijksterhuis, J. The Indoor Fungus Cladosporium halotolerans Survives Humidity Dynamics Markedly Better than Aspergillus niger and Penicillium rubens despite Less Growth at Lowered Steady-State Water Activity. Appl. Environ. Microbiol. 2016, 82, 5089–5098. [Google Scholar] [CrossRef] [PubMed] [Green Version]
- Ponizovskaya, V.B.; Antropova, A.B.; Mokeeva, V.L.; Bilanenko, E.N.; Chekunova, L.N. Effect of water activity and relative air humidity on the growth of Penicillium chrysogenum thom, Aspergillus repens (Corda) Sacc., and Trichoderma viride Pers. isolated from living spaces. Microbiology 2011, 80, 378–385. [Google Scholar] [CrossRef]
- Nguyen, T.A.; Greig, J.; Khan, A.; Goh, C.; Jedd, G. Evolutionary novelty in gravity sensing through horizontal gene transfer and high-order protein assembly. PLoS Biol. 2018, 16, e2004920. [Google Scholar] [CrossRef]
- Fernandes, S.; Simões, L.C.; Lima, N.; Simões, M. Adhesion of filamentous fungi isolated from drinking water under different process conditions. Water Res. 2019, 164, 114951. [Google Scholar] [CrossRef] [Green Version]
- Gomoiu, I.; Chatzitheodoridis, E.; Vadrucci, S.; Walther, I.; Cojoc, R. Fungal Spores Viability on the International Space Station. Orig. Life Evol. Biospheres. 2016, 46, 403–418. [Google Scholar] [CrossRef]
- Latgé, J.-P. (Ed.) The Fungal Cell Wall: An Armour and a Weapon for Human Fungal Pathogens; Springer International Publishing: Cham, Switzerland, 2020; Volume 425. [Google Scholar] [CrossRef]
- Tanaka, T.; Terauchi, Y.; Yoshimi, A.; Abe, K. Aspergillus Hydrophobins: Physicochemical Properties, Biochemical Properties, and Functions in Solid Polymer Degradation. Microorganisms 2022, 10, 1498. [Google Scholar] [CrossRef]
- Sardi, J.D.C.O.; Pitangui, N.D.S.; Rodríguez-Arellanes, G.; Taylor, M.L.; Fusco-Almeida, A.M.; Mendes-Giannini, M.J.S. Highlights in pathogenic fungal biofilms. Rev. Iberoam. Micol. 2014, 31, 22–29. [Google Scholar] [CrossRef]
- Harriott, M.M. Biofilms and Antibiotics. In Reference Module in Biomedical Sciences; Elsevier: Amsterdam, The Netherlands, 2019. [Google Scholar] [CrossRef]
- Richards, D.; Davies, J.K.; Figdor, D. Starvation survival and recovery in serum of Candida albicans compared with Enterococcus faecalis. Oral Surg. Oral Med. Oral Pathol. Oral Radiol. Endodontol. 2010, 110, 125–130. [Google Scholar] [CrossRef] [PubMed]
- Verstrepen, K.J.; Klis, F.M. Flocculation, adhesion and biofilm formation in yeasts. Mol. Microbiol. 2006, 60, 5–15. [Google Scholar] [CrossRef] [PubMed]


| Material Coupon | BioServe Part No. | Amount | Cleaning Method |
|---|---|---|---|
| Aluminum Alloy Al6061 | 4999 MPPR-311-4 | 84 | Ultrasonic |
| Stainless Steel 316 | 5183 MPPR-311-6 | 120 | Ultrasonic |
| Quartz | 6090 MPPR-311-8 | 84 | Ultrasonic |
| Silicone | 6092 MPPR-311-2 | 84 | Bag washed |
| Titanium Alloy Ti-6Al-4V | 4999 MPPR-311-3 | 84 | Ultrasonic |
| MIT Nanograss | 2022 | 78 | Not washed, prepared in sterile conditions |
| Carbon Fiber | 5012 MPPR-311-7 | 84 | Ultrasonic |
| Material | Biomass (µm3/µm2) |
|---|---|
| Stainless Steel 316 | 0.0267 (0.0142) |
| Carbon Fiber | 0.0205 (0.0155) |
| Silicone | 0.0773 (0.0375) |
| Quartz | 0.0133 (0.0074) |
| Titanium Alloy | 0.0112 (0.0449) |
| Aluminum Alloy | 0.0052 (0.0061) |
| Nanograss | 0.0096 (0.0162) |
Disclaimer/Publisher’s Note: The statements, opinions and data contained in all publications are solely those of the individual author(s) and contributor(s) and not of MDPI and/or the editor(s). MDPI and/or the editor(s) disclaim responsibility for any injury to people or property resulting from any ideas, methods, instructions or products referred to in the content. |
© 2023 by the authors. Licensee MDPI, Basel, Switzerland. This article is an open access article distributed under the terms and conditions of the Creative Commons Attribution (CC BY) license (https://creativecommons.org/licenses/by/4.0/).
Share and Cite
Hupka, M.; Kedia, R.; Schauer, R.; Shepard, B.; Granados-Presa, M.; Vande Hei, M.; Flores, P.; Zea, L. Morphology of Penicillium rubens Biofilms Formed in Space. Life 2023, 13, 1001. https://doi.org/10.3390/life13041001
Hupka M, Kedia R, Schauer R, Shepard B, Granados-Presa M, Vande Hei M, Flores P, Zea L. Morphology of Penicillium rubens Biofilms Formed in Space. Life. 2023; 13(4):1001. https://doi.org/10.3390/life13041001
Chicago/Turabian StyleHupka, Megan, Raj Kedia, Rylee Schauer, Brooke Shepard, María Granados-Presa, Mark Vande Hei, Pamela Flores, and Luis Zea. 2023. "Morphology of Penicillium rubens Biofilms Formed in Space" Life 13, no. 4: 1001. https://doi.org/10.3390/life13041001