
Understanding the Diurnal Oscillation of the Gut Microbiota Using Microbial Culture
 ,
,  and
and 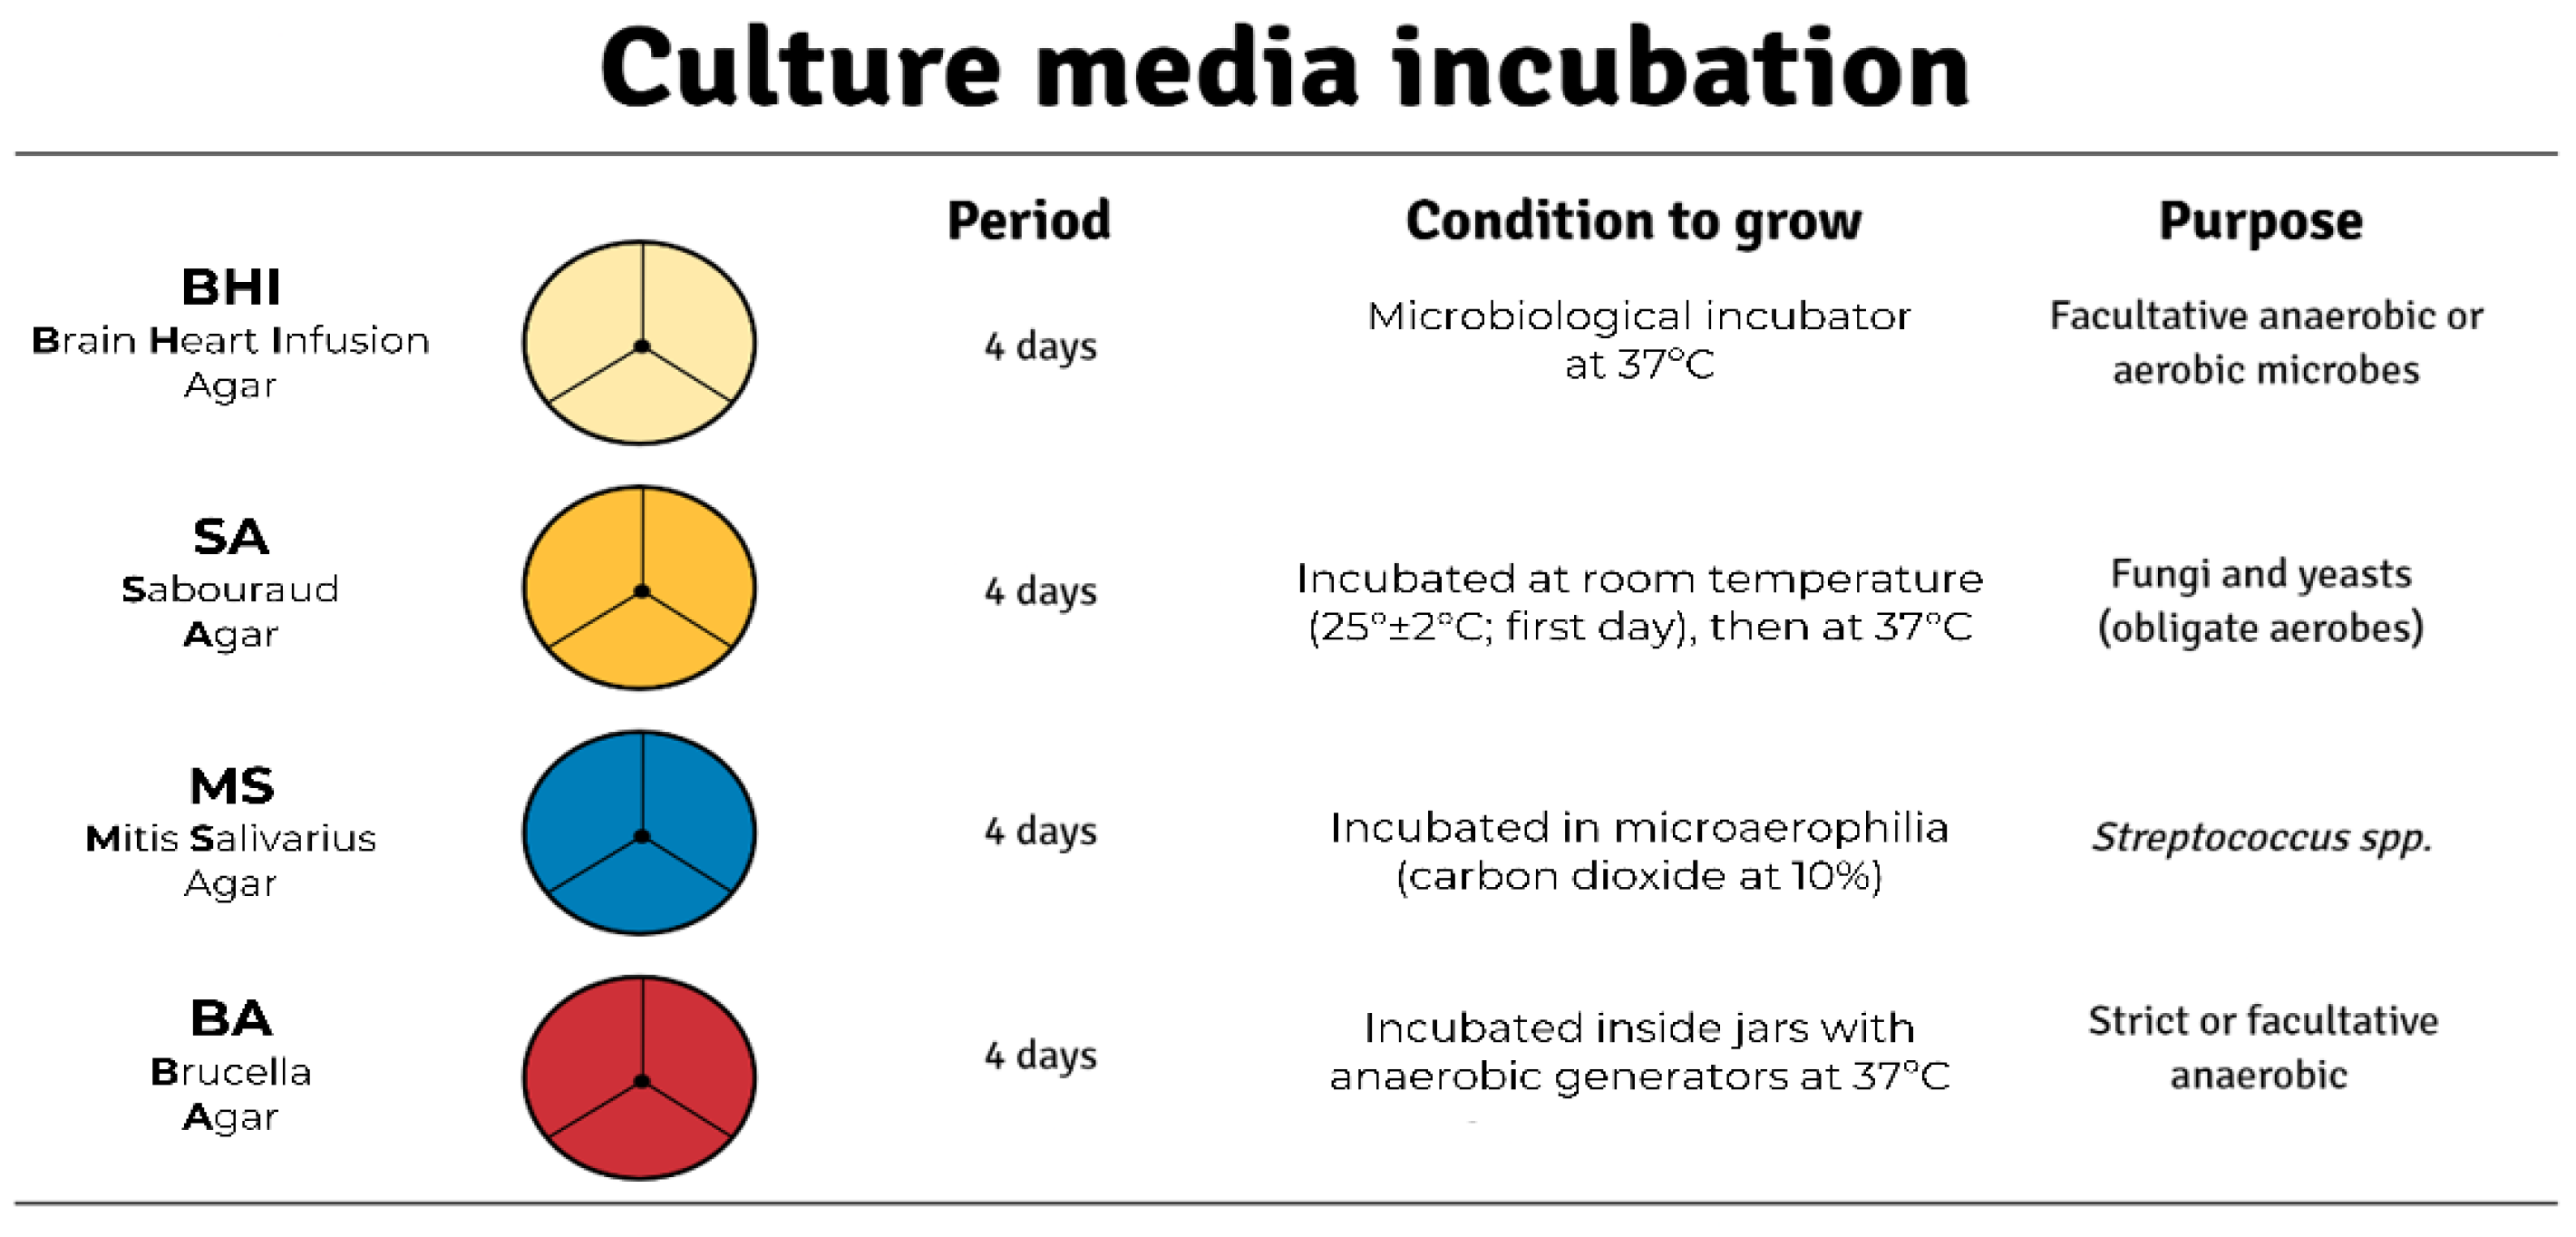
Abstract
:1. Introduction
2. Material and Methods
2.1. Animals
2.2. Experimental Protocol
2.3. Serial Dilutions and Culture Media
2.4. Time Measurements
2.5. Statistical Analysis
3. Results
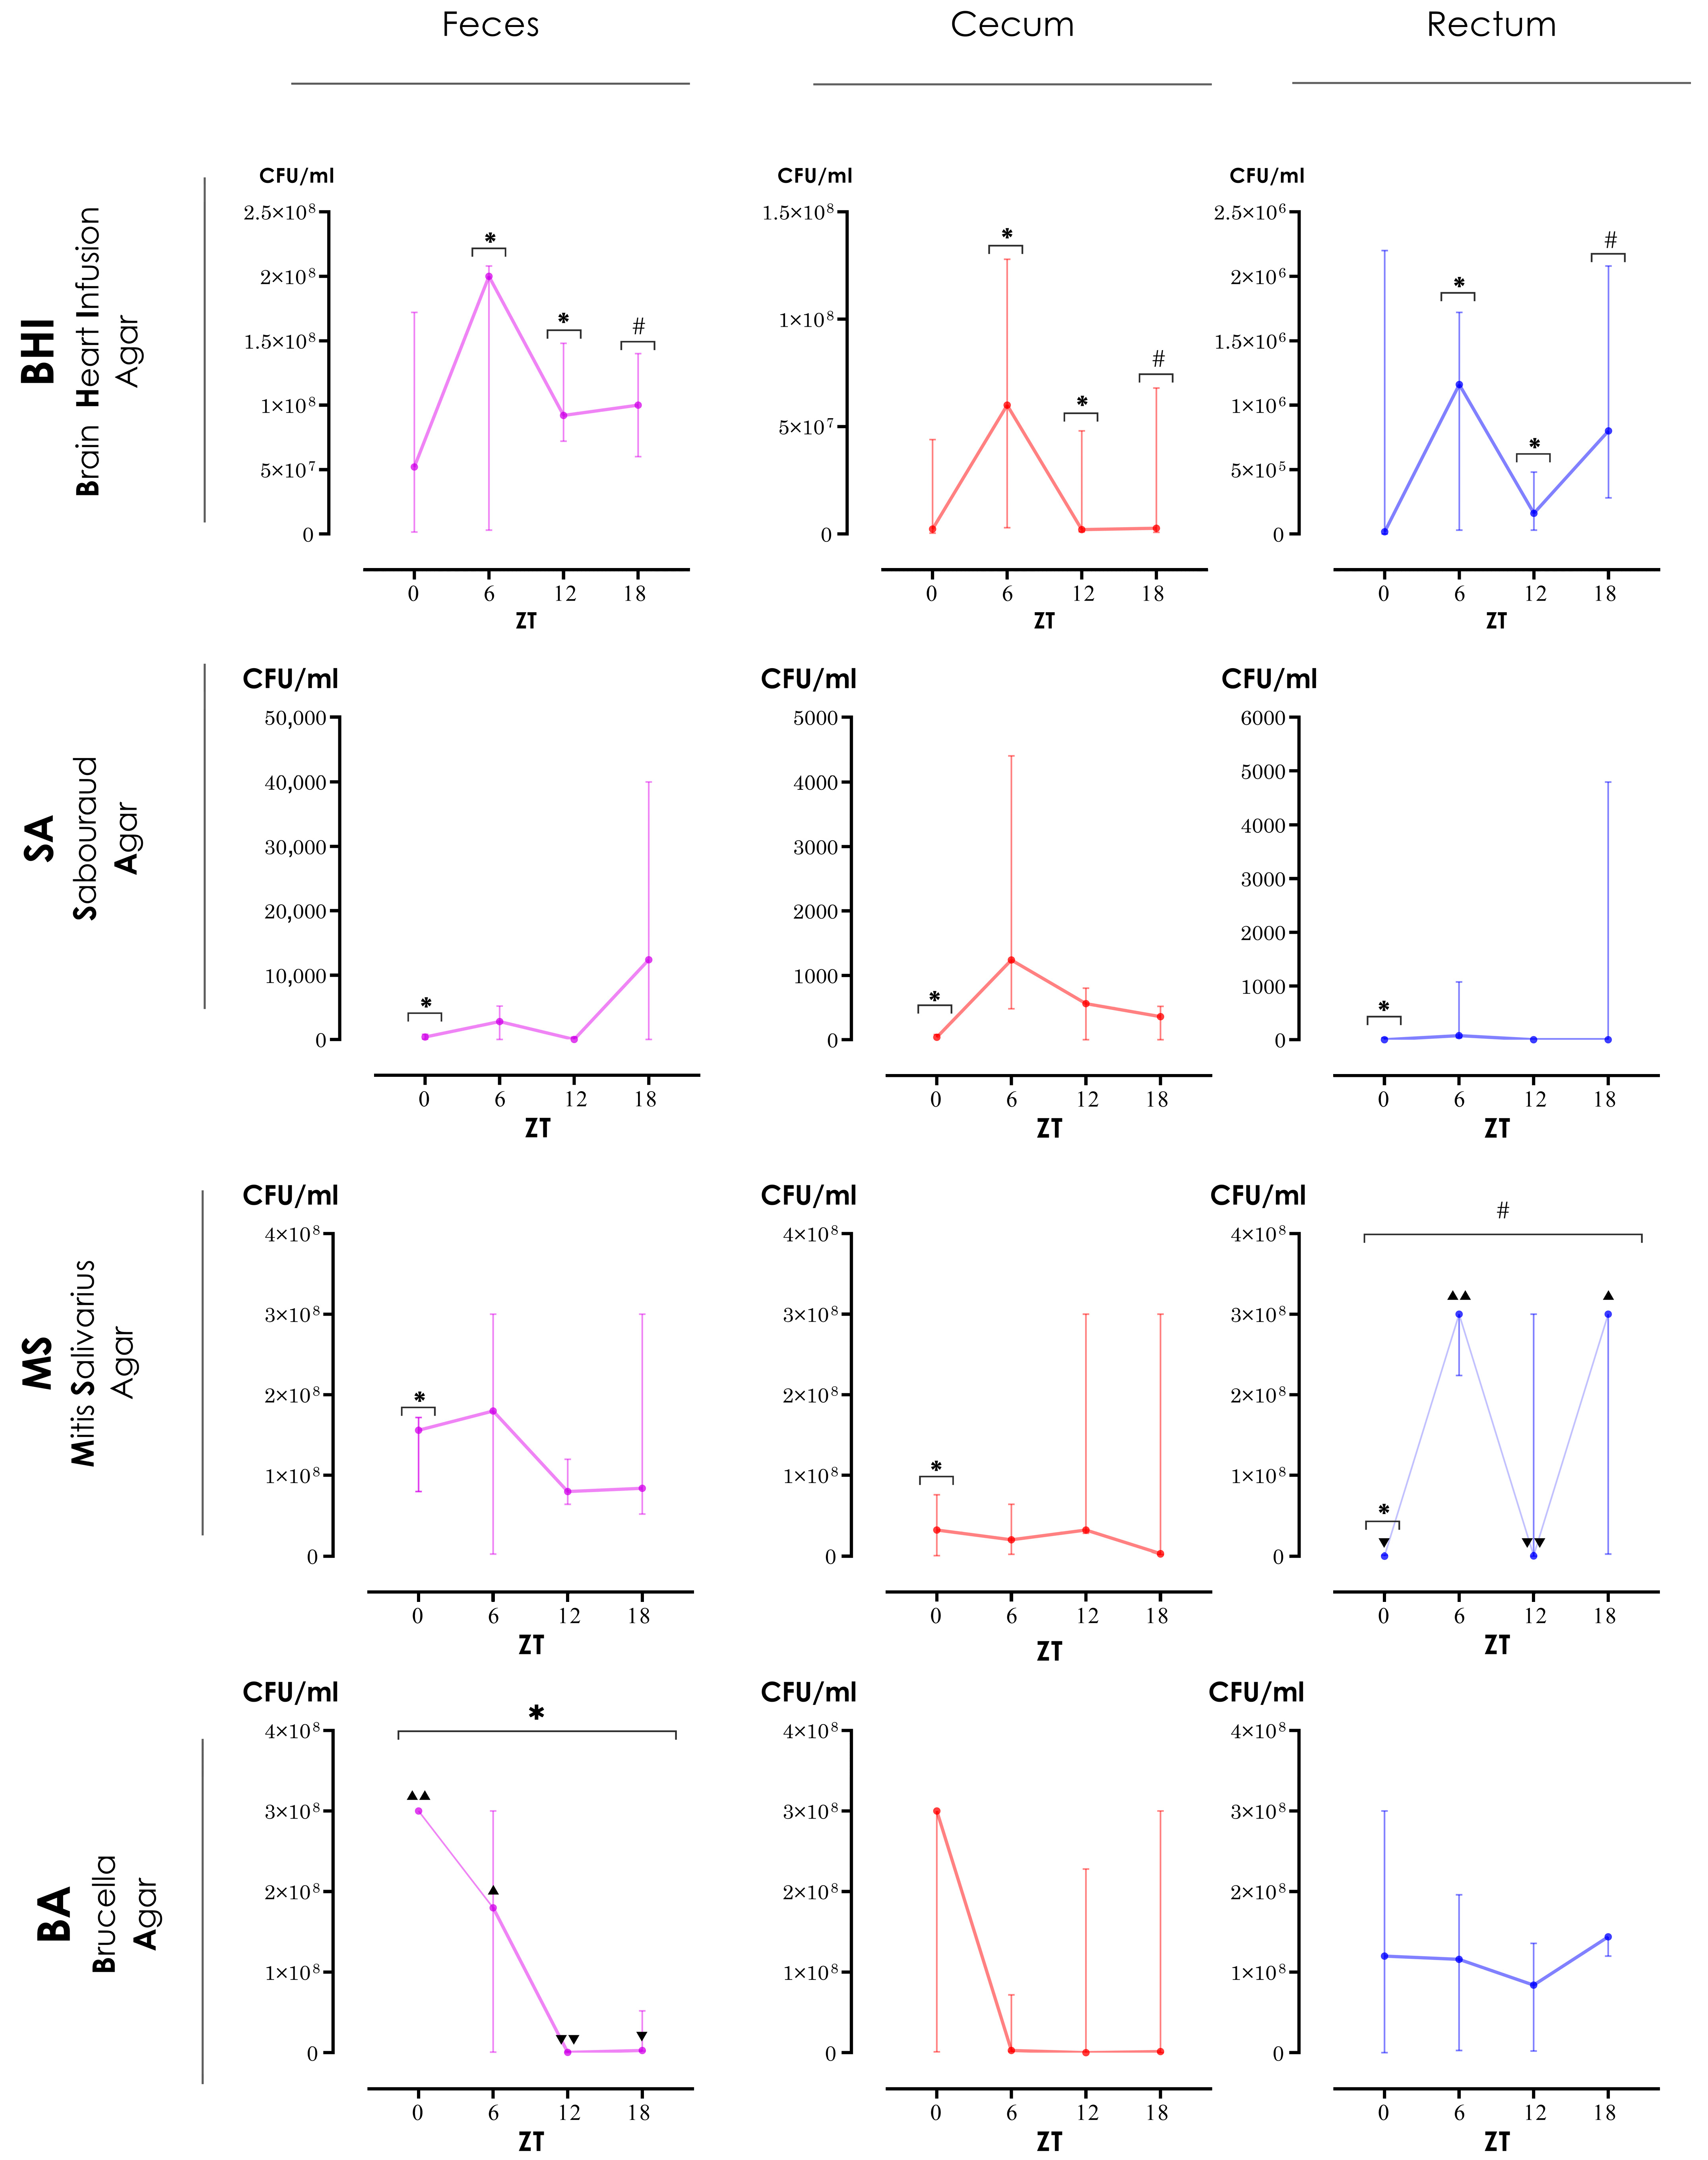
3.1. Differences between ZTs
3.2. Biogeographic Differences
4. Discussion
Supplementary Materials
Author Contributions
Funding
Institutional Review Board Statement
Informed Consent Statement
Data Availability Statement
Acknowledgments
Conflicts of Interest
References
- Aschoff, J. Exogenous and Endogenous Components in Circadian Rhythms. Cold Spring Harb. Symp. Quant. Biol. 1960, 25, 11–28. [Google Scholar] [CrossRef] [PubMed]
- Foster, R.G.; Kreitzman, L. The Rhythms of Life: What Your Body Clock Means to You! Exp. Physiol. 2014, 99, 599–606. [Google Scholar] [CrossRef] [PubMed]
- Partch, C.L.; Green, C.B.; Takahashi, J.S. Molecular architecture of the mammalian circadian clock. Trends Cell Biol. 2013, 24, 90–99. [Google Scholar] [CrossRef] [Green Version]
- Moore, R.Y.; Lenn, N.J. A retinohypothalamic projection in the rat. J. Comp. Neurol. 1972, 146, 1–14. [Google Scholar] [CrossRef] [PubMed]
- Welsh, D.K.; Takahashi, J.S.; Kay, S.A. Suprachiasmatic Nucleus: Cell Autonomy and Network Properties. Annu. Rev. Physiol. 2010, 72, 551–577. [Google Scholar] [CrossRef] [PubMed] [Green Version]
- Aschoff, J. Circadian Rhythms in Man. Science 1965, 148, 1427–1432. [Google Scholar] [CrossRef] [Green Version]
- Silver, R.; LeSauter, J.; Tresco, P.A.; Lehman, M.N. A diffusible coupling signal from the transplanted suprachiasmatic nucleus controlling circadian locomotor rhythms. Nature 1996, 382, 810–813. [Google Scholar] [CrossRef] [PubMed]
- Rüger, M.; Scheer, F. Effects of circadian disruption on the cardiometabolic system. Rev. Endocr. Metab. Disord. 2009, 10, 245–260. [Google Scholar] [CrossRef] [Green Version]
- Voigt, R.M.; Forsyth, C.B.; Green, S.; Mutlu, E.; Engen, P.; Vitaterna, M.H.; Turek, F.W.; Keshavarzian, A. Circadian Disorganization Alters Intestinal Microbiota. PLoS ONE 2014, 9, e97500. [Google Scholar] [CrossRef]
- Voigt, R.M.; Summa, K.C.; Forsyth, C.B.; Green, S.J.; Engen, P.; Naqib, A.; Vitaterna, M.H.; Turek, F.W.; Keshavarzian, A. The Circadian Clock Mutation Promotes Intestinal Dysbiosis. Alcohol. Clin. Exp. Res. 2016, 40, 335–347. [Google Scholar] [CrossRef] [Green Version]
- Qian, J.; Scheer, F.A. Circadian System and Glucose Metabolism: Implications for Physiology and Disease. Trends Endocrinol. Metab. 2016, 27, 282–293. [Google Scholar] [CrossRef] [Green Version]
- Thaiss, C.A.; Zeevi, D.; Levy, M.; Zilberman-Schapira, G.; Suez, J.; Tengeler, A.C.; Abramson, L.; Katz, M.N.; Korem, T.; Zmora, N.; et al. Transkingdom Control of Microbiota Diurnal Oscillations Promotes Metabolic Homeostasis. Cell 2014, 159, 514–529. [Google Scholar] [CrossRef] [PubMed] [Green Version]
- Thaiss, C.A.; Levy, M.; Korem, T.; Dohnalová, L.; Shapiro, H.; Jaitin, D.A.; David, E.; Winter, D.R.; Gury-BenAri, M.; Tatirovsky, E.; et al. Microbiota Diurnal Rhythmicity Programs Host Transcriptome Oscillations. Cell 2016, 167, 1495–1510.e12. [Google Scholar] [CrossRef] [PubMed] [Green Version]
- Wu, G.; Tang, W.; He, Y.; Hu, J.; Gong, S.; He, Z.; Wei, G.; Lv, L.; Jiang, Y.; Zhou, H.; et al. Light exposure influences the diurnal oscillation of gut microbiota in mice. Biochem. Biophys. Res. Commun. 2018, 501, 16–23. [Google Scholar] [CrossRef]
- Kaczmarek, J.L.; Musaad, S.M.; Holscher, H.D. Time of day and eating behaviors are associated with the composition and function of the human gastrointestinal microbiota. Am. J. Clin. Nutr. 2017, 106, 1220–1231. [Google Scholar] [CrossRef] [Green Version]
- Ferraz-Bannitz, R.; Beraldo, R.; Coelho, P.; Moreira, A.; Castro, M.; Foss-Freitas, M. Circadian Misalignment Induced by Chronic Night Shift Work Promotes Endoplasmic Reticulum Stress Activation Impacting Directly on Human Metabolism. Biology 2021, 10, 197. [Google Scholar] [CrossRef]
- Reitmeier, S.; Kiessling, S.; Clavel, T.; List, M.; Almeida, E.L.; Ghosh, T.S.; Neuhaus, K.; Grallert, H.; Linseisen, J.; Skurk, T.; et al. Arrhythmic Gut Microbiome Signatures Predict Risk of Type 2 Diabetes. Cell Host Microbe 2020, 28, 258–272.e6. [Google Scholar] [CrossRef] [PubMed]
- Pedersen, H.K.; Gudmundsdottir, V.; Nielsen, H.B.; Hyotylainen, T.; Nielsen, T.; Jensen, B.A.H.; Forslund, K.; Hildebrand, F.; Prifti, E.; Falony, G.; et al. Human gut microbes impact host serum metabolome and insulin sensitivity. Nature 2016, 535, 376–381. [Google Scholar] [CrossRef] [PubMed]
- Donaldson, G.P.; Lee, S.M.; Mazmanian, S.K. Gut biogeography of the bacterial microbiota. Nat. Rev. Microbiol. 2016, 14, 20–32. [Google Scholar] [CrossRef] [PubMed] [Green Version]
- Li, D.; Chen, H.; Mao, B.; Yang, Q.; Zhao, J.; Gu, Z.; Zhang, H.; Chen, Y.Q.; Chen, W. Microbial Biogeography and Core Microbiota of the Rat Digestive Tract. Sci. Rep. 2017, 7, 45840. [Google Scholar] [CrossRef] [Green Version]
- Martel, J.; Chang, S.-H.; Ko, Y.-F.; Hwang, T.-L.; Young, J.D.; Ojcius, D.M. Gut barrier disruption and chronic disease. Trends Endocrinol. Metab. 2022, 33, 247–265. [Google Scholar] [CrossRef] [PubMed]
- Cheng, W.-Y.; Ho, Y.-S.; Chang, R.C.-C. Linking circadian rhythms to microbiome-gut-brain axis in aging-associated neurodegenerative diseases. Ageing Res. Rev. 2022, 78, 101620. [Google Scholar] [CrossRef] [PubMed]
- Swanson, G.R.; Burgess, H.J. Sleep and Circadian Hygiene and Inflammatory Bowel Disease. Gastroenterol. Clin. N. Am. 2017, 46, 881–893. [Google Scholar] [CrossRef] [PubMed]
- Heddes, M.; Altaha, B.; Niu, Y.; Reitmeier, S.; Kleigrewe, K.; Haller, D.; Kiessling, S. The intestinal clock drives the microbiome to maintain gastrointestinal homeostasis. Nat. Commun. 2022, 13, 6068. [Google Scholar] [CrossRef]
- Bashiardes, S.; Zilberman-Schapira, G.; Elinav, E. Use of Metatranscriptomics in Microbiome Research. Bioinform. Biol. Insights 2016, 10, 19–25. [Google Scholar] [CrossRef] [Green Version]
- Cao, Y.; Fanning, S.; Proos, S.; Jordan, K.; Srikumar, S. A Review on the Applications of Next Generation Sequencing Technologies as Applied to Food-Related Microbiome Studies. Front. Microbiol. 2017, 8, 1829. [Google Scholar] [CrossRef] [Green Version]
- Lagier, J.-C.; Hugon, P.; Khelaifia, S.; Fournier, P.-E.; La Scola, B.; Raoult, D. The Rebirth of Culture in Microbiology through the Example of Culturomics to Study Human Gut Microbiota. Clin. Microbiol. Rev. 2015, 28, 237–264. [Google Scholar] [CrossRef] [Green Version]
- Austin, B. The value of cultures to modern microbiology. Antonie Van Leeuwenhoek 2017, 110, 1247–1256. [Google Scholar] [CrossRef]
- Lagier, J.-C.; Dubourg, G.; Million, M.; Cadoret, F.; Bilen, M.; Fenollar, F.; Levasseur, A.; Rolain, J.-M.; Fournier, P.-E.; Raoult, D. Culturing the human microbiota and culturomics. Nat. Rev. Microbiol. 2018, 16, 540–550. [Google Scholar] [CrossRef] [PubMed] [Green Version]
- Siqueira, J.F.; Rôças, I.N. Exploiting Molecular Methods to Explore Endodontic Infections: Part 1--Current Molecular Technologies for Microbiological Diagnosis. J. Endod. 2005, 31, 411–423. [Google Scholar] [CrossRef] [Green Version]
- Kilkenny, C.; Browne, W.J.; Cuthill, I.C.; Emerson, M.; Altman, D.G. Improving Bioscience Research Reporting: The ARRIVE Guidelines for Reporting Animal Research. Veter-Clin. Pathol. 2012, 41, 27–31. [Google Scholar] [CrossRef] [Green Version]
- National Research Council. Guide for the Care and Use of Laboratory Animals; National Academies Press: Washington, DC, USA, 2011. [Google Scholar]
- Naghili, H.; Tajik, H.; Mardani, K.; Rouhani, S.M.R.; Ehsani, A.; Zare, P. Validation of drop plate technique for bacterial enumeration by parametric and nonparametric tests. Vet. Res. Forum 2013, 4, 179–183. [Google Scholar] [PubMed]
- Zarrinpar, A.; Chaix, A.; Yooseph, S.; Panda, S. Diet and Feeding Pattern Affect the Diurnal Dynamics of the Gut Microbiome. Cell Metab. 2014, 20, 1006–1017. [Google Scholar] [CrossRef] [PubMed] [Green Version]
- Gu, S.; Chen, D.; Zhang, J.-N.; Lv, X.; Wang, K.; Duan, L.-P.; Nie, Y.; Wu, X.-L. Bacterial Community Mapping of the Mouse Gastrointestinal Tract. PLoS ONE 2013, 8, e74957. [Google Scholar] [CrossRef] [PubMed] [Green Version]
- Guzzo, G.L.; Andrews, J.M.; Weyrich, L.S. The Neglected Gut Microbiome: Fungi, Protozoa, and Bacteriophages in Inflammatory Bowel Disease. Inflamm. Bowel Dis. 2022, 28, 1112–1122. [Google Scholar] [CrossRef] [PubMed]
- Chen, S.; Fuller, K.K.; Dunlap, J.C.; Loros, J.J. Circadian Clearance of a Fungal Pathogen from the Lung is not Based on Cell-intrinsic Macrophage Rhythms. J. Biol. Rhythm. 2017, 33, 99–105. [Google Scholar] [CrossRef] [Green Version]
- Hazen, K.C.; Hazen, B.W. Temperature-Modulated Physiological Characteristics of Candida albicans. Microbiol. Immunol. 1987, 31, 497–508. [Google Scholar] [CrossRef]
- Valentine, M.; Benadé, E.; Mouton, M.; Khan, W.; Botha, A. Binary interactions between the yeast Candida albicans and two gut-associated Bacteroides species. Microb. Pathog. 2019, 135, 103619. [Google Scholar] [CrossRef]
- Rampelotto, P.H.; Sereia, A.F.; de Oliveira, L.F.V.; Margis, R. Exploring the Hospital Microbiome by High-Resolution 16S rRNA Profiling. Int. J. Mol. Sci. 2019, 20, 3099. [Google Scholar] [CrossRef] [Green Version]
- Wierson, M.; Long, P.J.; Forehand, R.L. Toward a new understanding of early menarche: The role of environmental stress in pubertal timing. Adolescence 1993, 28, 913–924. [Google Scholar]
- Smith, M.S. Estrus and Menstrual Cycles: Neuroendocrine Control. In Encyclopedia of Neuroscience; Squire, L.R., Ed.; Academic Press: Oxford, UK, 2009. [Google Scholar]
- Wagenmaker, E.R.; Moenter, S.M. Exposure to Acute Psychosocial Stress Disrupts the Luteinizing Hormone Surge Independent of Estrous Cycle Alterations in Female Mice. Endocrinology 2017, 158, 2593–2602. [Google Scholar] [CrossRef] [Green Version]
- Batista, M.P.B.; Cavalcante, F.S.; Cassini, S.T.A.; Schuenck, R.P. Diversity of bacteria carrying antibiotic resistance genes in hospital raw sewage in Southeastern Brazil. Water Sci. Technol. 2022, 87, 239–250. [Google Scholar] [CrossRef] [PubMed]
- Omar, N.M.S.; Erismis, B.; Osman, M.M.; Garba, B.; Hassan, M.A.; Akuku, I.G. Retrospective Evaluation of Nosocomial Bacterial Infections and Their Antimicrobial Resistance Patterns Among Hospitalized Patients in Mogadishu, Somalia. Infect. Drug Resist. 2023, 16, 705–720. [Google Scholar] [CrossRef]
- Tyakht, A.V.; Manolov, A.I.; Kanygina, A.V.; Ischenko, D.S.; Kovarsky, B.A.; Popenko, A.S.; Pavlenko, A.V.; Elizarova, A.V.; Rakitina, D.V.; Baikova, J.P.; et al. Genetic diversity of Escherichia coli in gut microbiota of patients with Crohn’s disease discovered using metagenomic and genomic analyses. BMC Genom. 2018, 19, 968. [Google Scholar] [CrossRef]
- Santos-Neto, J.F.; Santos, A.; Nascimento, J.A.; Trovão, L.O.; Santos, F.F.; Valiatti, T.B.; Gales, A.C.; Marques, A.L.; Pinaffi, I.C.; Vieira, M.A.; et al. Virulence Profile, Antibiotic Resistance, and Phylogenetic Relationships among Escherichia Coli Strains Isolated from the Feces and Urine of Hospitalized Patients. Pathogens 2022, 11, 1528. [Google Scholar] [CrossRef] [PubMed]
- Mansour, S.; Asrar, T.; Elhenawy, W. The multifaceted virulence of adherent-invasive Escherichia coli. Gut Microbes 2023, 15, 2172669. [Google Scholar] [CrossRef] [PubMed]
- Wang, Q.-J.; Guo, Y.; Zhang, K.-H.; Zhang, L.; Geng, S.-X.; Shan, C.-H.; Liu, P.; Zhu, M.-Q.; Jin, Q.-Y.; Liu, Z.-Y.; et al. Night-Restricted Feeding Improves Gut Health by Synchronizing Microbe-Driven Serotonin Rhythm and Eating Activity-Driven Body Temperature Oscillations in Growing Rabbits. Front. Cell. Infect. Microbiol. 2021, 11, 771088. [Google Scholar] [CrossRef]


Disclaimer/Publisher’s Note: The statements, opinions and data contained in all publications are solely those of the individual author(s) and contributor(s) and not of MDPI and/or the editor(s). MDPI and/or the editor(s) disclaim responsibility for any injury to people or property resulting from any ideas, methods, instructions or products referred to in the content. |
© 2023 by the authors. Licensee MDPI, Basel, Switzerland. This article is an open access article distributed under the terms and conditions of the Creative Commons Attribution (CC BY) license (https://creativecommons.org/licenses/by/4.0/).
Share and Cite
Amando, G.; Tonon, A.; Constantino, D.; Hidalgo, M.P.; Rampelotto, P.H.; Montagner, F. Understanding the Diurnal Oscillation of the Gut Microbiota Using Microbial Culture. Life 2023, 13, 831. https://doi.org/10.3390/life13030831
Amando G, Tonon A, Constantino D, Hidalgo MP, Rampelotto PH, Montagner F. Understanding the Diurnal Oscillation of the Gut Microbiota Using Microbial Culture. Life. 2023; 13(3):831. https://doi.org/10.3390/life13030831
Chicago/Turabian StyleAmando, Guilherme, André Tonon, Débora Constantino, Maria Paz Hidalgo, Pabulo Henrique Rampelotto, and Francisco Montagner. 2023. "Understanding the Diurnal Oscillation of the Gut Microbiota Using Microbial Culture" Life 13, no. 3: 831. https://doi.org/10.3390/life13030831