
ABO Blood Group in Relation to COVID-19 Susceptibility and Clinical Outcomes: A Retrospective Observational Study in the United Arab Emirates

 ,
, 
Abstract
:1. Introduction
2. Materials and Methods
2.1. Study Design and Participants
2.2. Data Collection
2.3. ABO Blood Grouping and Rh Genotyping
2.4. Statistical Analysis
3. Results
3.1. Demographic and Clinical Characteristics of Patients
3.2. The Association between ABO Blood Groups and Laboratory Findings
3.3. The Association between ABO Blood Groups and Laboratory Findings
4. Discussion
5. Conclusions
Supplementary Materials
Author Contributions
Funding
Institutional Review Board Statement
Informed Consent Statement
Data Availability Statement
Acknowledgments
Conflicts of Interest
References
- Singhal, T. A Review of Coronavirus Disease-2019 (COVID-19). Indian J. Pediatr. 2020, 87, 281–286. [Google Scholar] [CrossRef] [PubMed] [Green Version]
- Shimizu, K. 2019-NCoV, Fake News, and Racism. Lancet 2020, 395, 685–686. [Google Scholar] [CrossRef]
- World Meter. Available online: https://www.worldometers.info/coronavirus/ (accessed on 9 July 2021).
- Rothe, C.; Schunk, M.; Sothmann, P.; Bretzel, G.; Froeschl, G.; Wallrauch, C.; Zimmer, T.; Thiel, V.; Janke, C.; Guggemos, W.; et al. Transmission of 2019-NCoV Infection from an Asymptomatic Contact in Germany. N. Engl. J. Med. 2020, 382, 970–971. [Google Scholar] [CrossRef] [PubMed] [Green Version]
- Chen, C. Distribution of ABO and Rh (D) Blood Group and Qualty Analysis. Int. J. Lab. Med. 2010, 31, 77–78. [Google Scholar]
- Batool, Z.; Durrani, S.H.; Tariq, S. Association of ABO and Rh Blood Group Types to Hepatitis B, Hepatitis C, HIV and Syphillis Infection, a Five Year’experience in Healthy Blood Donors in a Tertiary Care Hospital. J. Ayub Med. Coll. Abbottabad 2017, 29, 90–92. [Google Scholar]
- Lindesmith, L.; Moe, C.; Marionneau, S.; Ruvoen, N.; Jiang, X.I.; Lindblad, L.; Stewart, P.; LePendu, J.; Baric, R. Human Susceptibility and Resistance to Norwalk Virus Infection. Nat. Med. 2003, 9, 548–553. [Google Scholar] [CrossRef]
- Cheng, Y.; Cheng, G.; Chui, C.H.; Lau, F.Y.; Chan, P.K.S.; Ng, M.H.L.; Sung, J.J.Y.; Wong, R.S.M. ABO Blood Group and Susceptibility to Severe Acute Respiratory Syndrome. JAMA 2005, 293, 1447. [Google Scholar] [CrossRef]
- Boudin, L.; Janvier, F.; Bylicki, O.; Dutasta, F. ABO Blood Groups Are Not Associated with Risk of Acquiring the SARS-CoV-2 Infection in Young Adults. Haematologica 2020, 105, 2841–2843. [Google Scholar] [CrossRef]
- Zhao, J.; Yang, Y.; Huang, H.; Li, D.; Gu, D.; Lu, X.; Zhang, Z.; Liu, L.; Liu, T.; Liu, Y.; et al. Relationship Between the ABO Blood Group and the Coronavirus Disease 2019 (COVID-19) Susceptibility. Clin. Infect. Dis. 2021, 73, 328–331. [Google Scholar] [CrossRef]
- Pourali, F.; Afshari, M.; Alizadeh-Navaei, R.; Javidnia, J.; Moosazadeh, M.; Hessami, A. Relationship between Blood Group and Risk of Infection and Death in COVID-19: A Live Meta-Analysis. New Microbes New Infect. 2020, 37, 100743. [Google Scholar] [CrossRef]
- Sainz Bueno, J.A.; Cerrillos González, L.; Abascal-Saiz, A.; Rodríguez Gallego, M.V.; López Pérez, R.; Fernández Alonso, A.M.; de la Cruz Conty, M.L.; Alonso Saiz, R.; Molina Oller, M.; Santamaría Ortiz, A.; et al. Association of ABO and Rh Blood Groups with Obstetric Outcomes in SARS-CoV-2 Infected Pregnancies: A Prospective Study with a Multivariate Analysis. Eur. J. Obstet. Gynecol. Reprod. Biol. 2021, 264, 41–48. [Google Scholar] [CrossRef]
- Nauffal, V.; Achanta, A.; Goldhaber, S.Z.; Piazza, G. Association of ABO Blood Group Type with Cardiovascular Events in COVID-19. J. Thromb. Thrombolysis 2021, 51, 584–586. [Google Scholar] [CrossRef]
- The Severe COVID-19 GWAS Group. Genomewide Association Study of Severe COVID-19 with Respiratory Failure. N. Engl. J. Med. 2020, 383, 1522–1534. [Google Scholar] [CrossRef]
- Chiodo, F.; Bruijns, S.C.M.; Rodriguez, E.; Li, R.J.E.; Molinaro, A.; Silipo, A. Novel ACE2-Independent Carbohydrate-Binding of SARS-CoV-2 Spike Protein to Host Lectins and Lung Microbiota. bioRxiv 2020. [Google Scholar] [CrossRef]
- Ortho Clinical Diagnostic Blood Grouping Reagents ABO-Rh Grouping Cassette; pp. 1–6. Available online: https://www.cardinalhealth.com/en/product-solutions/medical/laboratory-products/blood-bank/blood-bank-reagents/abo-blood-grouping-reagents.html (accessed on 13 June 2022).
- Samra, S.; Habeb, M.; Nafae, R. ABO Groups Can Play a Role in Susceptibility and Severity of COVID-19. Egypt. J. Bronchol. 2021, 15, 9. [Google Scholar] [CrossRef]
- Zietz, M.; Zucker, J.; Tatonetti, N.P. Associations between Blood Type and COVID-19 Infection, Intubation, and Death. Nat. Commun. 2020, 11, 5761. [Google Scholar] [CrossRef]
- Wang, B.; Li, R.; Lu, Z.; Huang, Y. Does Comorbidity Increase the Risk of Patients with COVID-19: Evidence from Meta-Analysis. Aging 2020, 12, 6049–6057. [Google Scholar] [CrossRef]
- Latz, C.A.; DeCarlo, C.; Boitano, L.; Png, C.Y.M.; Patell, R.; Conrad, M.F.; Eagleton, M.; Dua, A. Blood Type and Outcomes in Patients with COVID-19. Ann. Hematol. 2020, 99, 2113–2118. [Google Scholar] [CrossRef]
- Hoiland, R.L.; Fergusson, N.A.; Mitra, A.R.; Griesdale, D.E.G.; Devine, D.V.; Stukas, S.; Cooper, J.; Thiara, S.; Foster, D.; Chen, L.Y.C.; et al. The Association of ABO Blood Group with Indices of Disease Severity and Multiorgan Dysfunction in COVID-19. Blood Adv. 2020, 4, 4981–4989. [Google Scholar] [CrossRef]
- Acik, D.Y.; Bankir, M. Relationship of SARS-CoV-2 Pandemic with Blood Groups. Transfus. Med. Hemother. 2021, 48, 161–167. [Google Scholar] [CrossRef]
- Trégouët, D.-A.; Heath, S.; Saut, N.; Biron-Andreani, C.; Schved, J.-F.; Pernod, G.; Galan, P.; Drouet, L.; Zelenika, D.; Juhan-Vague, I.; et al. Common Susceptibility Alleles Are Unlikely to Contribute as Strongly as the FV and ABO Loci to VTE Risk: Results from a GWAS Approach. Blood 2009, 113, 5298–5303. [Google Scholar] [CrossRef] [Green Version]
- Zhang, Y.; Garner, R.; Salehi, S.; La Rocca, M.; Duncan, D. Association between ABO Blood Types and Coronavirus Disease 2019 (COVID-19), Genetic Associations, and Underlying Molecular Mechanisms: A Literature Review of 23 Studies. Ann. Hematol. 2021, 100, 1123–1132. [Google Scholar] [CrossRef]
- Goel, R.; Bloch, E.M.; Pirenne, F.; Al-Riyami, A.Z.; Crowe, E.; Dau, L.; Land, K.; Townsend, M.; Jecko, T.; Rahimi-Levene, N.; et al. ABO Blood Group and COVID-19: A Review on Behalf of the ISBT COVID-19 Working Group. Vox Sang. 2021, 116, 849–861. [Google Scholar] [CrossRef]


| N = 303 (100%) | “O Group” 122 (40.3%) | “A Group” 84 (27.7%) | “AB Group” 21 (6.9%) | “B Group” 76 (25.1%) | p Value | |
|---|---|---|---|---|---|---|
| Demographics | ||||||
| Age (years) | Mean (SD) | 38.6 (11.3) | 38.4 (10.3) | 41.9 (10.8) | 40.7 (9.9) | 0.174 |
| BMI (kg/m2) | Mean (SD) | 27.4 (5.0) | 26.6 (5.7) | 26.8 (3.3) | 27.2 (3.8) | 0.712 |
| Sex | Female | 39 (32.0%) | 26 (31.0%) | 4 (19.0%) | 13 (17.1%) | 0.085 |
| Male | 83 (68.0%) | 58 (69.0%) | 17 (81.0%) | 63 (82.9%) | ||
| Race/Ethnicity | African | 1 (0.8%) | 0 (0.0%) | 0 (0.0%) | 2 (2.6%) | 0.251 |
| Asian | 106 (86.9%) | 70 (83.3%) | 18 (85.7%) | 70 (92.1%) | ||
| Black | 1 (0.8%) | 1 (1.2%) | 0 (0.0%) | 1 (1.3%) | ||
| White | 14 (11.5%) | 13 (15.5%) | 3 (14.3%) | 3 (3.9%) | ||
| RH Factor | Negative | 18 (16.1%) | 5 (6.5%) | 1 (4.8%) | 4 (5.8%) | 0.077 |
| Positive | 94 (83.9%) | 72 (93.5%) | 20 (95.2%) | 65 (94.2%) | ||
| Co-morbidities | ||||||
| Hypertension | No | 109 (91.6%) | 68 (94.4%) | 19 (95.0%) | 59 (89.4%) | 0.749 |
| Yes | 10 (8.4%) | 4 (5.6%) | 1 (5.0%) | 7 (10.6%) | ||
| Diabetes Mellitus | No | 110 (94.0%) | 63 (85.1%) | 19 (90.5%) | 59 (89.4%) | 0.222 |
| Yes | 7 (6.0%) | 11 (14.9%) | 2 (9.5%) | 7 (10.6%) | ||
| Cardiovascular Diseases | No | 118 (98.3%) | 80 (97.6%) | 20 (100.0%) | 71 (94.7%) | 0.43 |
| Yes | 2 (1.7%) | 2 (2.4%) | 0 (0.0%) | 4 (5.3%) | ||
| COVID-19 Outcomes | ||||||
| Radiology | Normal | 60 (49.2%) | 35 (41.7%) | 7 (33.3%) | 34 (44.7%) | 0.495 |
| Pneumonia | 62 (50.8%) | 49 (58.3%) | 14 (66.7%) | 42 (55.3%) | ||
| Icu Admission | No | 116 (95.1%) | 78 (92.9%) | 18 (85.7%) | 71 (93.4%) | 0.418 |
| Yes | 6 (4.9%) | 6 (7.1%) | 3 (14.3%) | 5 (6.6%) | ||
| Severity | No | 108 (88.5%) | 69 (82.1%) | 15 (71.4%) | 67 (88.2%) | 0.152 |
| Yes | 14 (11.5%) | 15 (17.9%) | 6 (28.6%) | 9 (11.8%) | ||
| Oxygen Need | No | 114 (93.4%) | 73 (86.9%) | 17 (81.0%) | 72 (94.7%) | 0.079 |
| Yes | 8 (6.6%) | 11 (13.1%) | 4 (19.0%) | 4 (5.3%) | ||
| Multi-Organ Failure/Renal Replacement Therapy | No | 118 (96.7%) | 83 (98.8%) | 19 (90.5%) | 75 (98.7%) | 0.172 |
| Yes | 4 (3.3%) | 1 (1.2%) | 2 (9.5%) | 1 (1.3%) | ||
| Mortality | No | 117 (95.9%) | 81 (96.4%) | 19 (90.5%) | 75 (98.7%) | 0.279 |
| Yes | 5 (4.1%) | 3 (3.6%) | 2 (9.5%) | 1 (1.3%) | ||
| “A Group” | “AB Group” | “B Group” | ||||
|---|---|---|---|---|---|---|
| OR (95%CI) | p Value | OR (95%CI) | p Value | OR (95%CI) | p Value | |
| Pneumonia | 1.35 (0.78–2.38) | 0.288 | 1.94 (0.75–5.41) | 0.184 | 1.20 (0.67–2.13) | 0.543 |
| ICU admission | 1.49 (0.45–4.92) | 0.505 | 3.22 (0.64–13.42) | 0.119 | 1.36 (0.38–4.68) | 0.621 |
| Severity | 1.68 (0.76–3.73) | 0.199 | 3.09 (0.97–9.05) | 0.044 | 1.04 (0.41–2.50) | 0.938 |
| Oxygen need | 2.15 (0.83–5.79) | 0.118 | 3.35 (0.82–11.93) | 0.069 | 0.79 (0.21–2.61) | 0.711 |
| Multiorgan Failure, Renal Replacement Therapy | 0.36 (0.02–2.46) | 0.359 | 3.11 (0.41–17.09) | 0.208 | 0.39 (0.02–2.72) | 0.408 |
| Mortality | 0.87 (0.17–3.63) | 0.848 | 2.46 (0.34–12.37) | 0.301 | 0.31 (0.02–1.98) | 0.292 |
| “O Group” | “AB Group” | “B Group” | ||||
|---|---|---|---|---|---|---|
| OR (95%CI) | p Value | OR (95%CI) | p Value | OR (95%CI) | p Value | |
| Pneumonia | 0.74 (0.42–1.29) | 0.288 | 1.43 (0.54–4.11) | 0.487 | 0.88 (0.47–1.65) | 0.695 |
| ICU admission | 0.67 (0.20–2.22) | 0.505 | 2.17 (0.43–9.07) | 0.305 | 0.92 (0.25–3.17) | 0.888 |
| Severity | 0.60 (0.27–1.32) | 0.199 | 1.84 (0.58–5.39) | 0.277 | 0.62 (0.24–1.49) | 0.290 |
| Oxygen need | 0.47 (0.17–1.20) | 0.118 | 1.56 (0.40–5.22) | 0.488 | 0.37 (0.10–1.13) | 0.100 |
| Multiorgan Failure, Renal Replacement Therapy | 2.81 (0.41–55.57) | 0.359 | 8.74 (0.80–193.84) | 0.083 | 1.11 (0.04–28.31) | 0.943 |
| Mortality | 1.15 (0.28–5.75) | 0.848 | 2.84 (0.36–18.32) | 0.270 | 0.36 (0.02–2.88) | 0.381 |
| Pneumonia | Severity | Mortality | ||||||||||
|---|---|---|---|---|---|---|---|---|---|---|---|---|
| Crude OR (95% CI) | p | Adj. OR (95% CI) | p | Crude OR (95% CI) | p | Adj. OR (95% CI) | p | Crude OR (95% CI) | p | Adj. OR (95% CI) | p | |
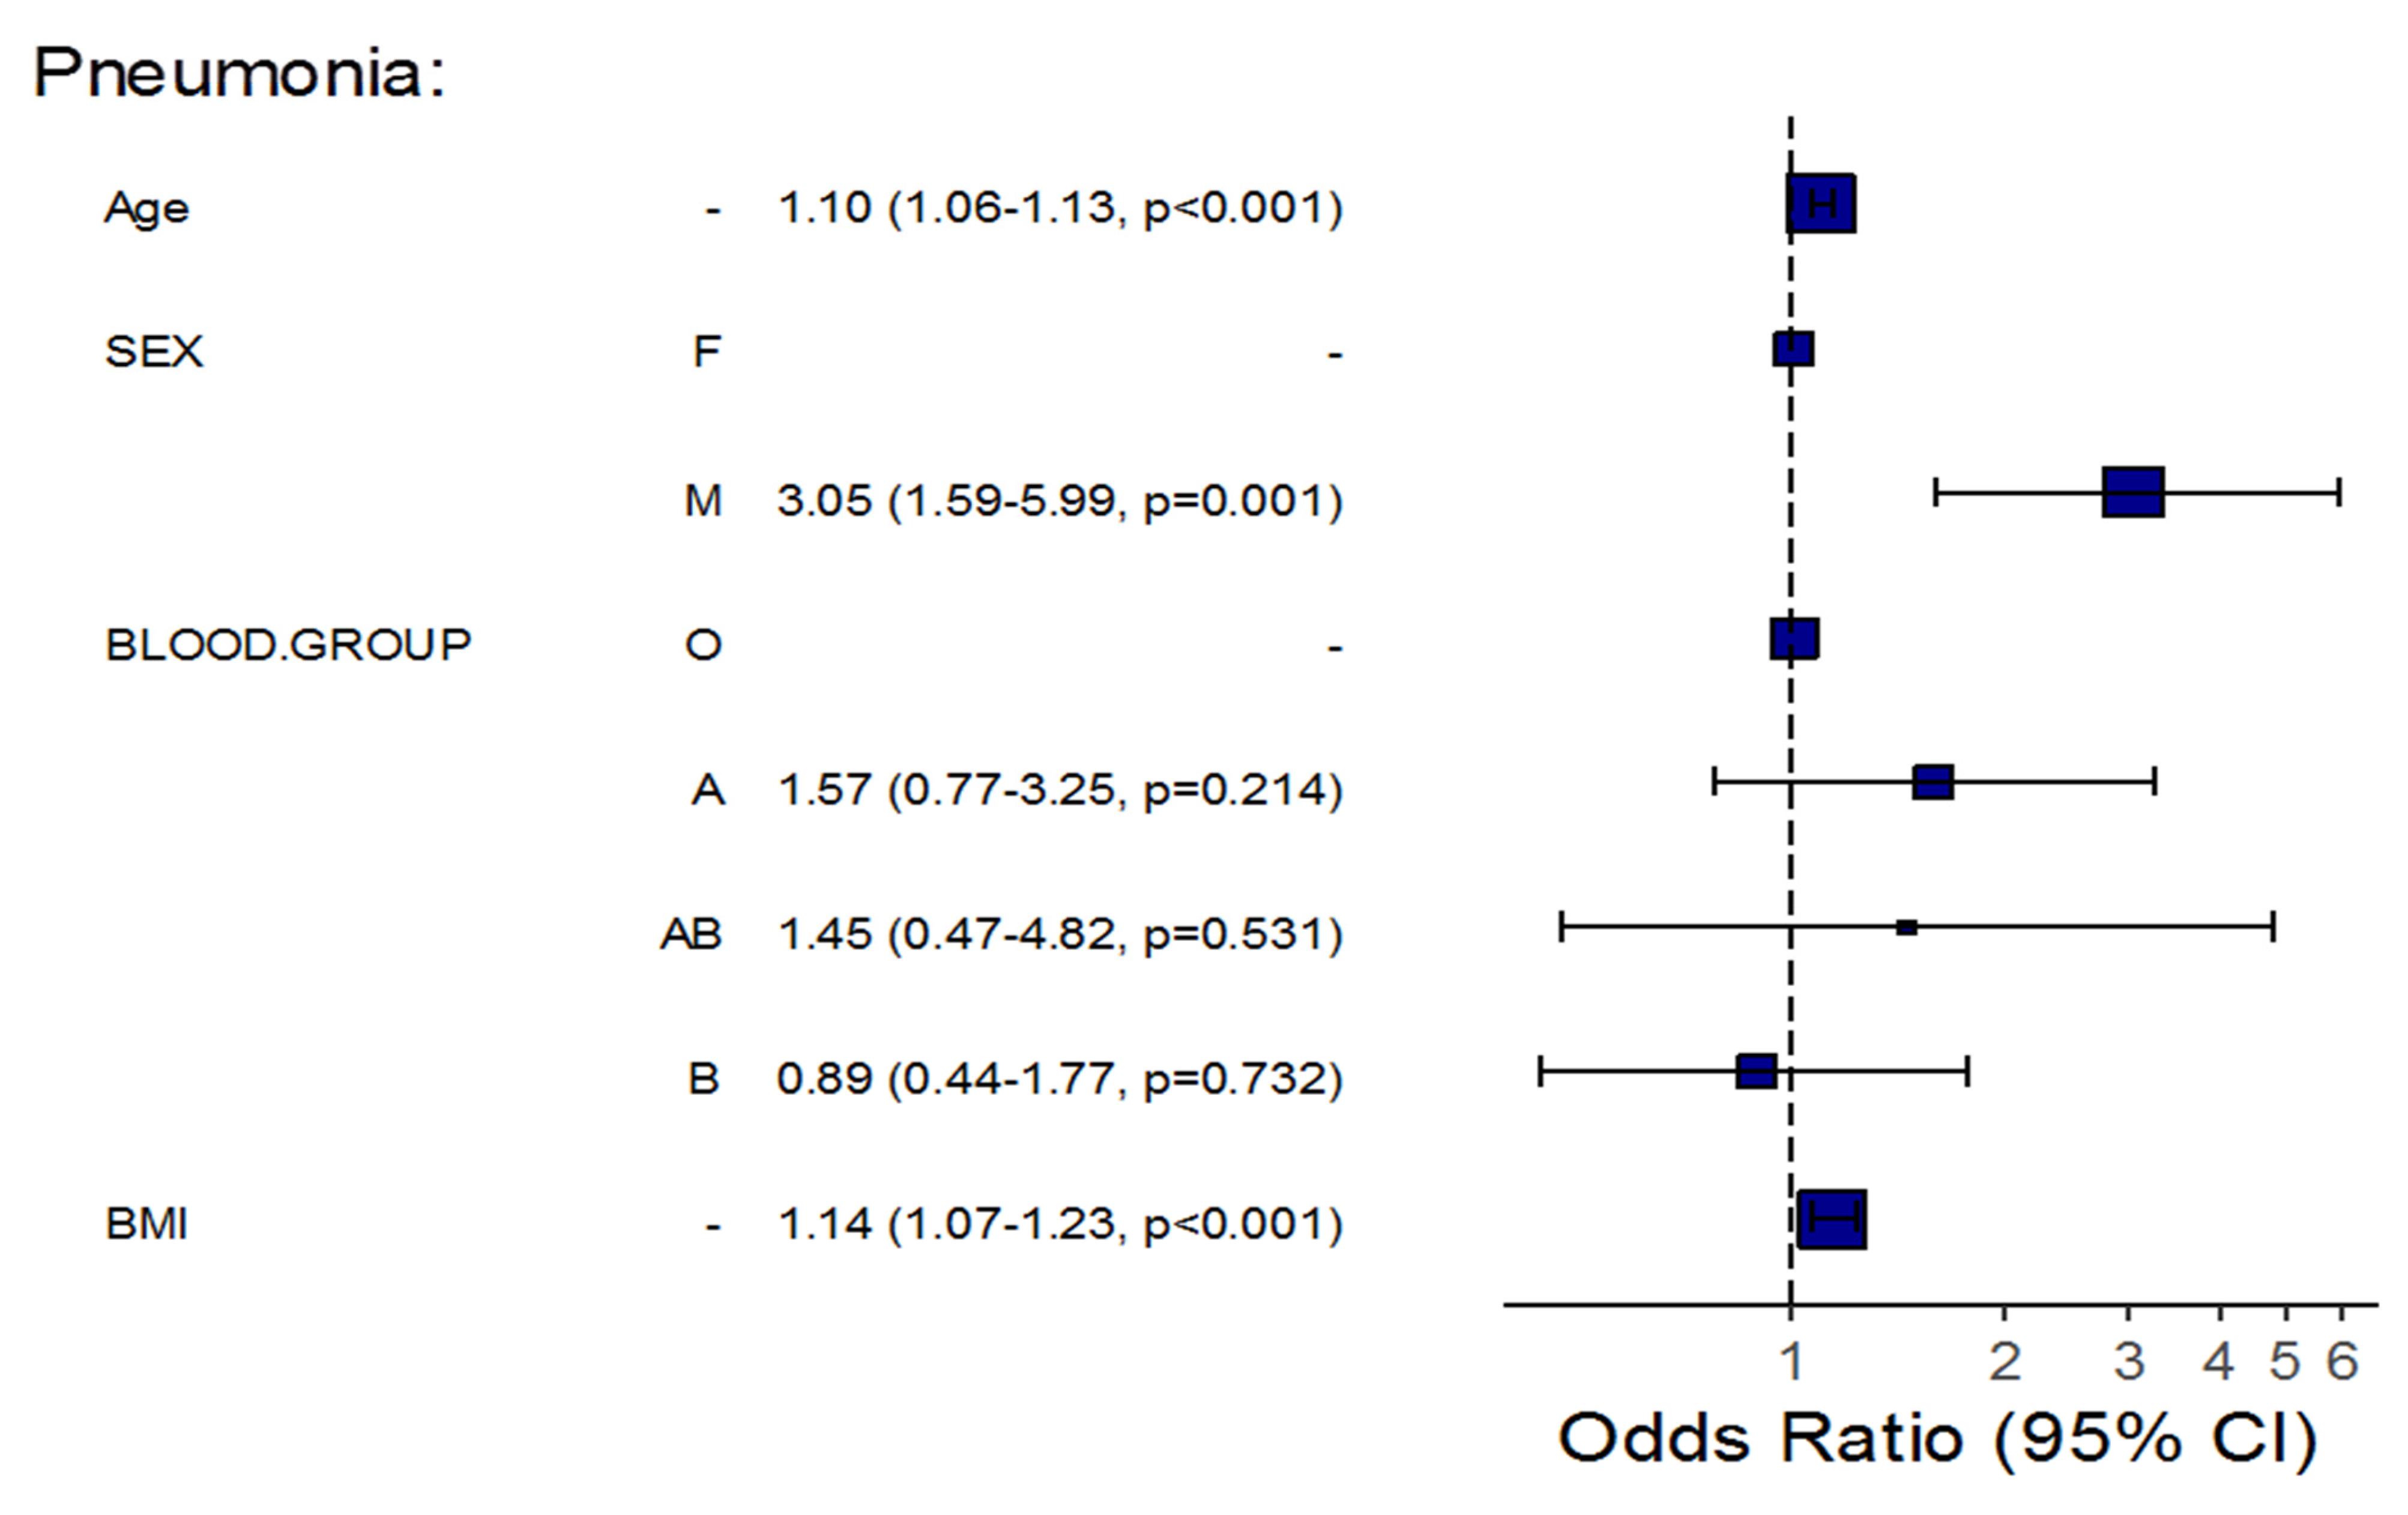
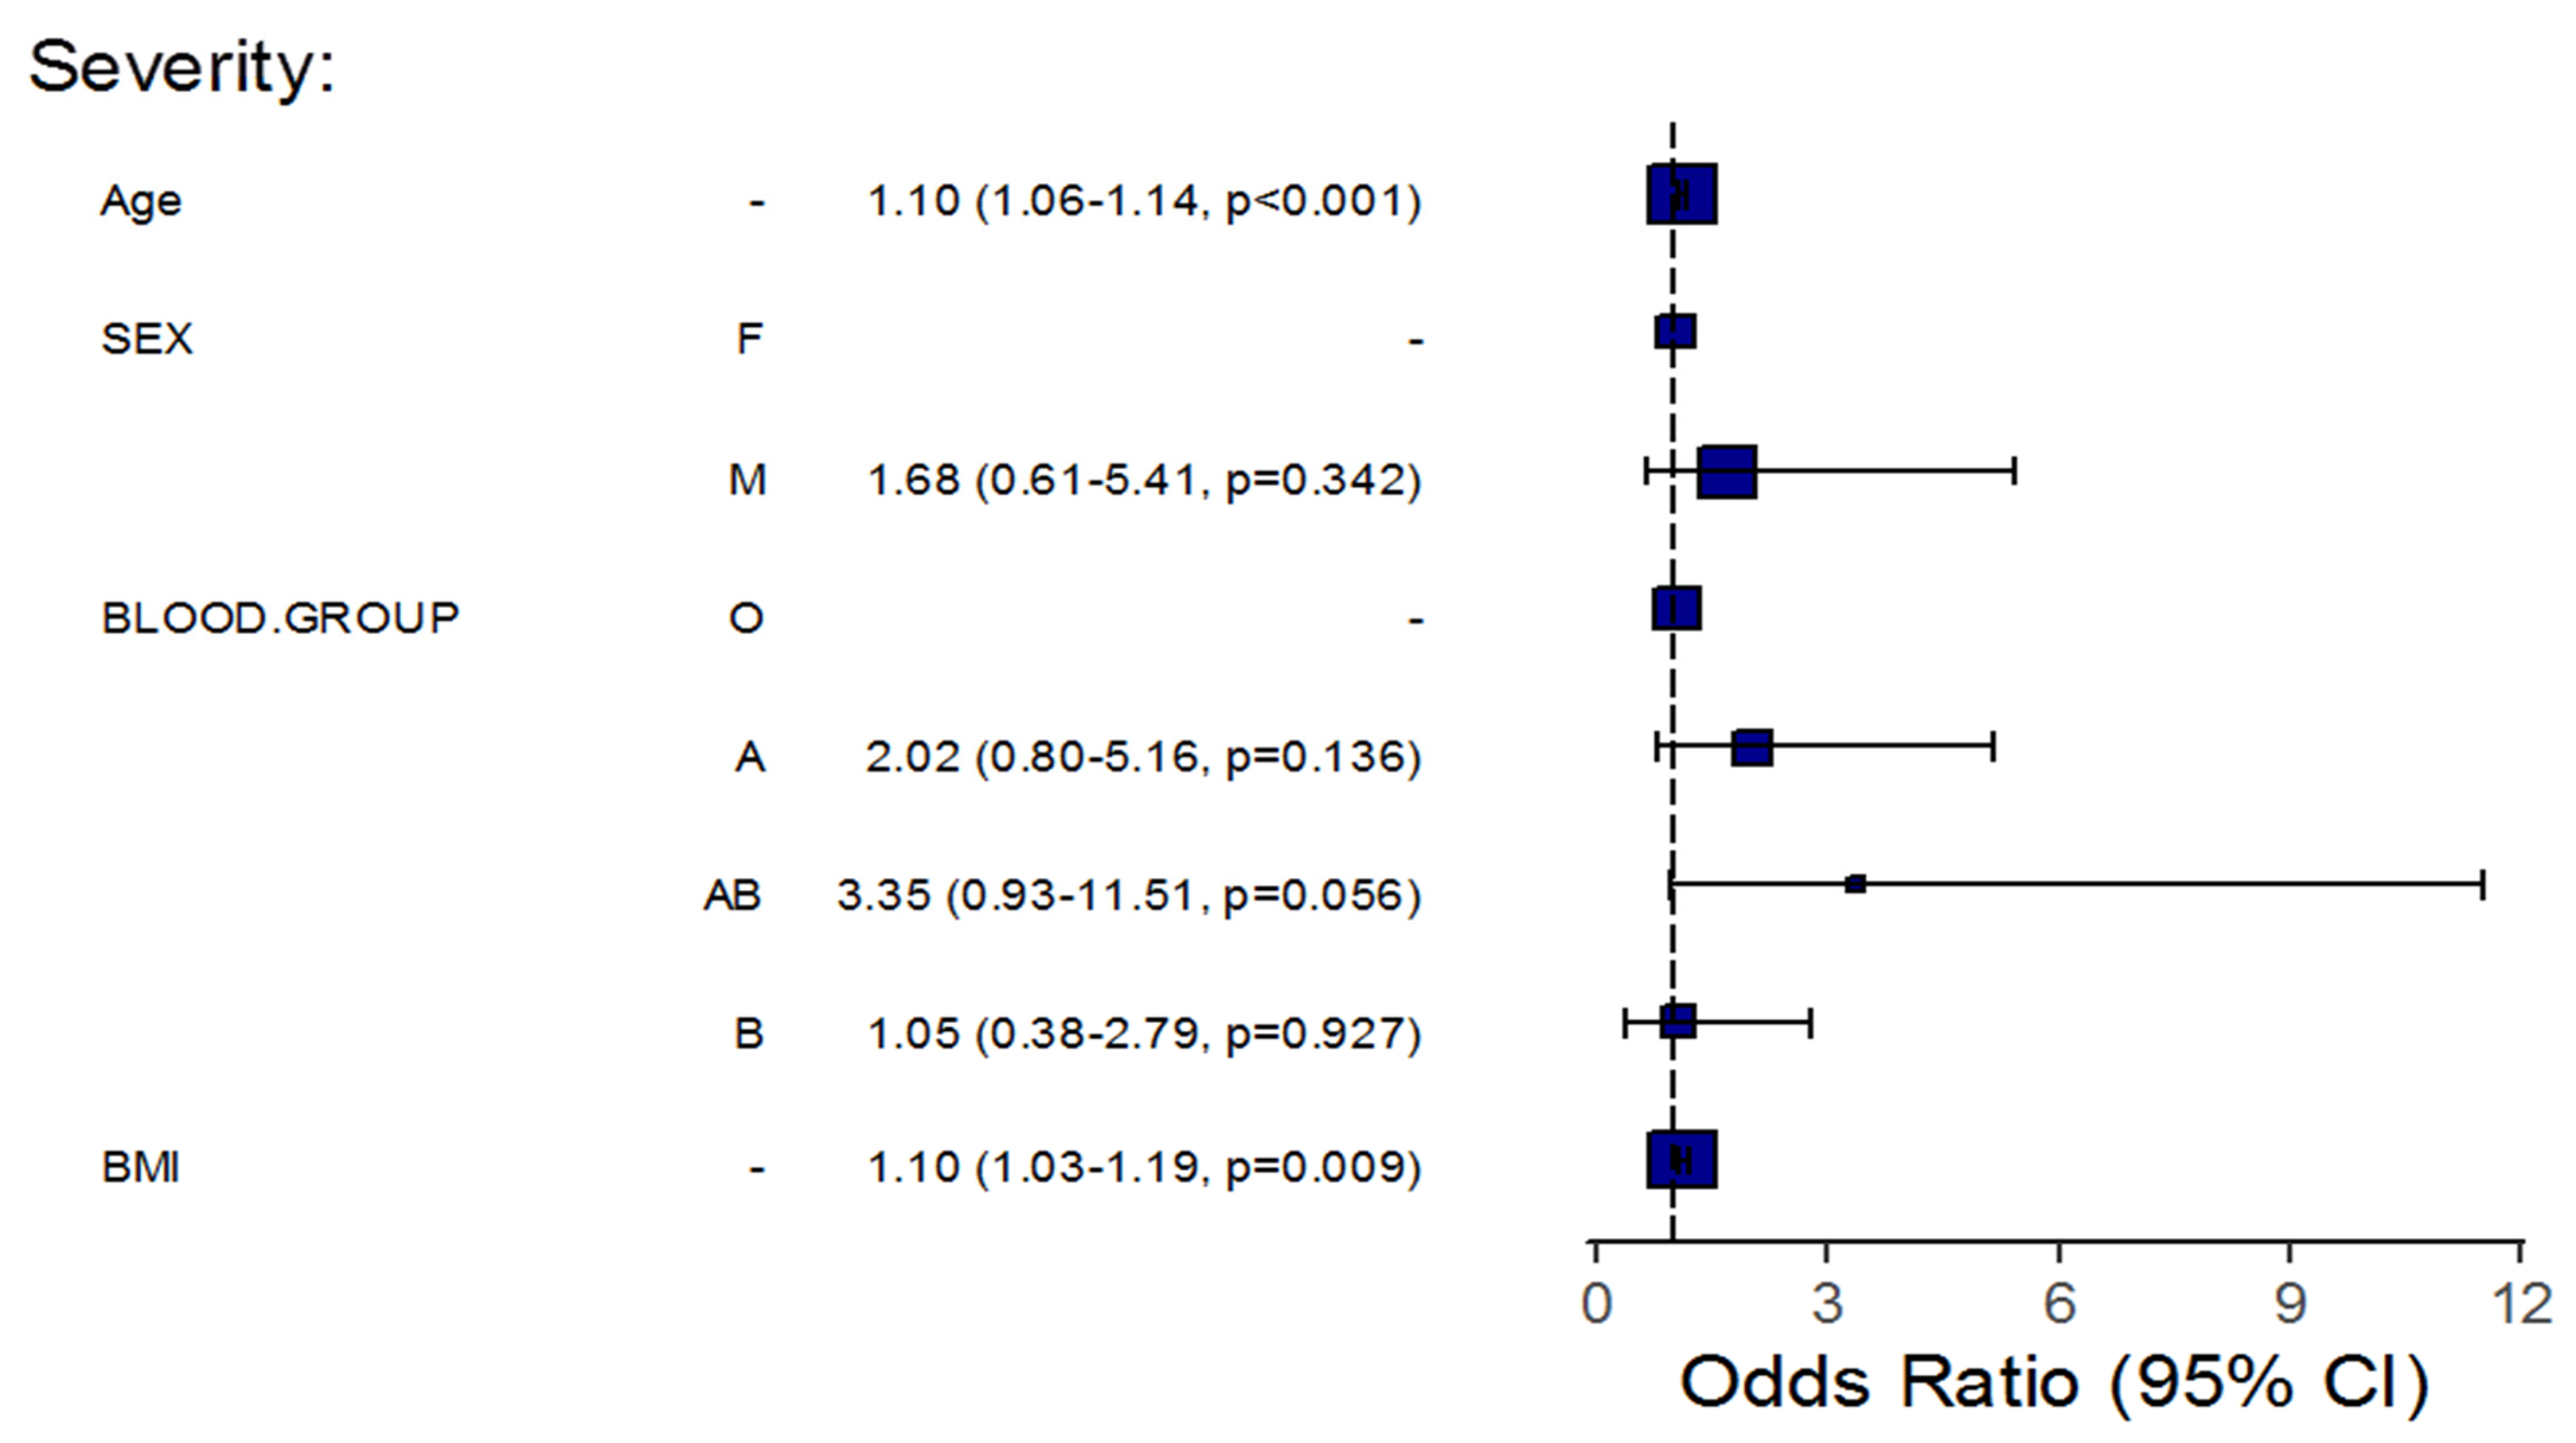
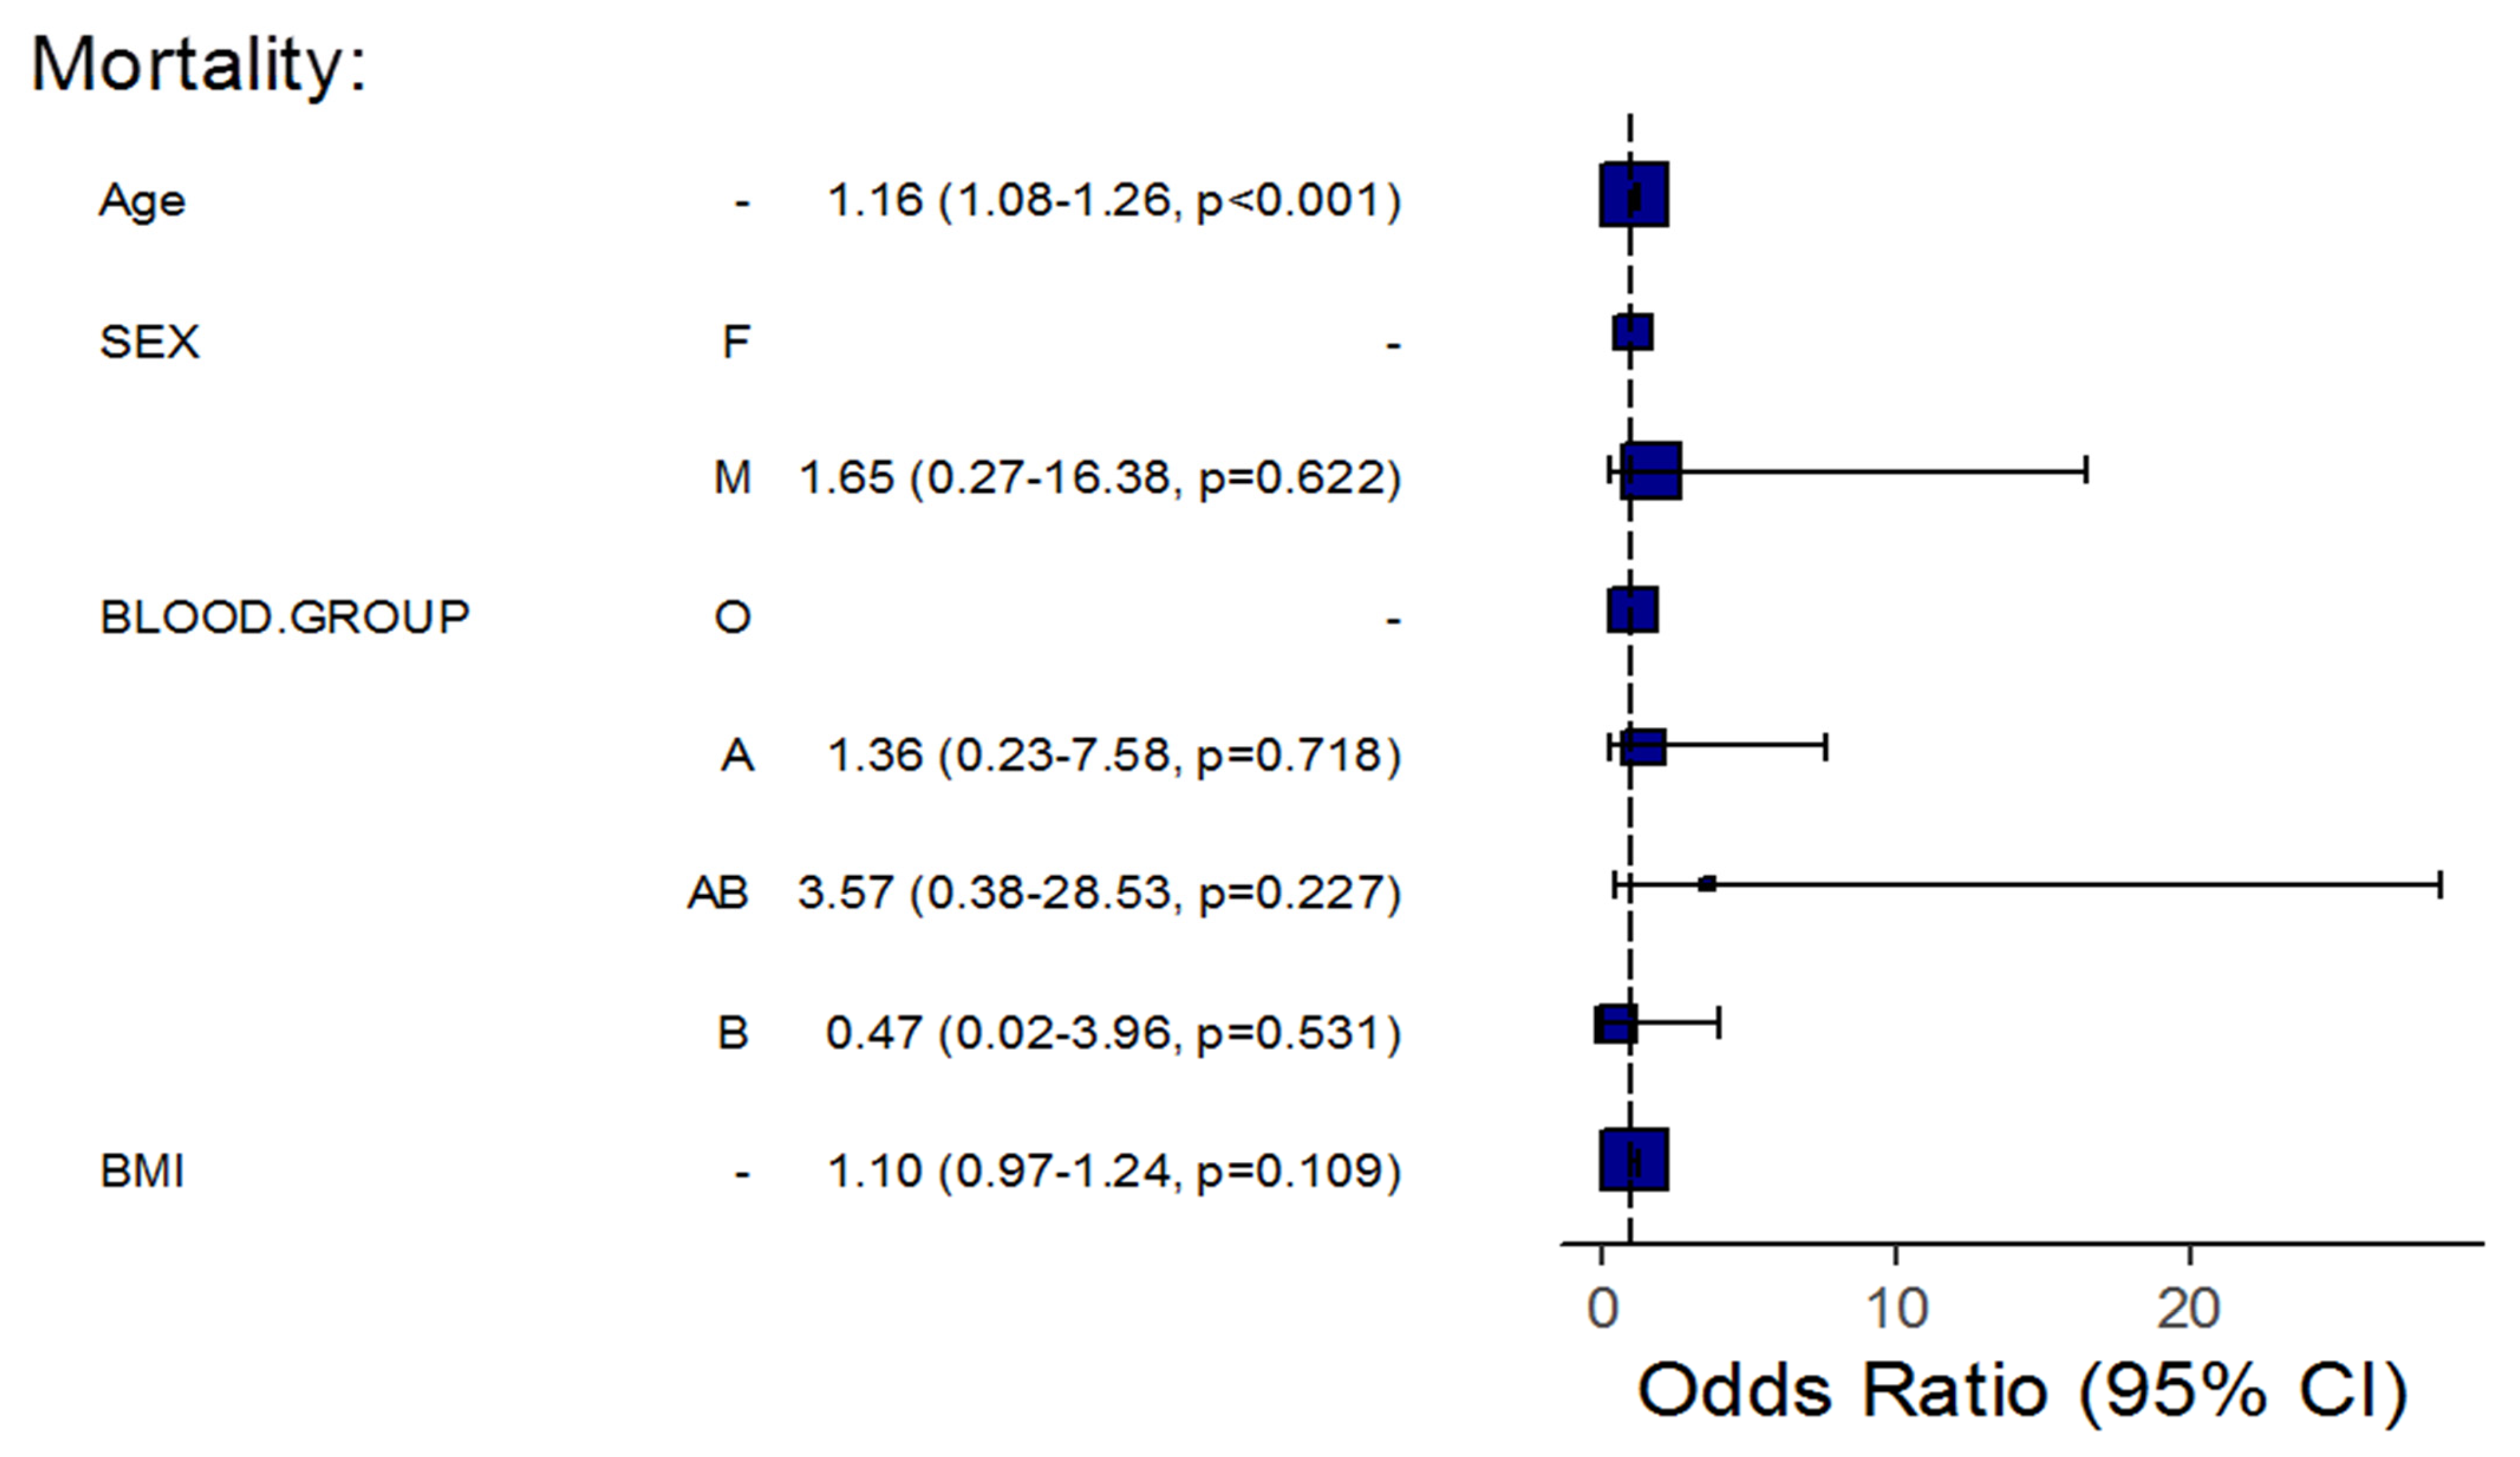
| Age | 1.12 (1.09–1.16) | <0.001 | 1.10 (1.06–1.13) | <0.001 | 1.10 (1.07–1.14) | <0.001 | 1.10 (1.06–1.14) | <0.001 | 1.16 (1.09–1.25) | <0.001 | 1.16 (1.08–1.26) | <0.001 |
| BMI | 1.18 (1.11–1.26) | <0.001 | 1.14 (1.07–1.23) | <0.001 | 1.12 (1.05–1.20) | <0.001 | 1.10 (1.03–1.19) | 0.009 | 1.12 (1.01–1.23) | 0.017 | 1.10 (0.97–1.24) | 0.109 |
| Sex (Male) | 4.43 (2.58–7.79) | <0.001 | 3.05 (1.59–5.99) | 0.001 | 2.63 (1.14–7.15) | 0.036 | 1.68 (0.61–5.41) | 0.342 | 1.70 (0.43–11.30) | 0.504 | 1.65 (0.27–16.38) | 0.622 |
| Group O | Reference group | |||||||||||
| Group A | 1.35 (0.78–2.38) | 0.288 | 1.57 (0.77–3.25) | 0.214 | 1.68 (0.76–3.73) | 0.199 | 2.02 (0.80–5.16) | 0.136 | 0.87 (0.17–3.63) | 0.848 | 1.36 (0.23–7.58) | 0.718 |
| Group AB | 1.94 (0.75–5.41) | 0.184 | 1.45 (0.47–4.82) | 0.531 | 3.09 (0.97–9.05) | 0.044 | 3.35 (0.93–11.51) | 0.056 | 2.46 (0.34–12.37) | 0.301 | 3.57 (0.38–28.53) | 0.227 |
| Group B | 1.20 (0.67–2.13) | 0.543 | 0.89 (0.44–1.77) | 0.732 | 1.04 (0.41–2.50) | 0.938 | 1.05 (0.38–2.79) | 0.927 | 0.31 (0.02–1.98) | 0.292 | 0.47 (0.02–3.96) | 0.531 |
| Age in group B | - | - | 0.911 | 0.0179 | - | - | - | - | - | - | 0.748 | 0.045 |
| BMI in group B | - | - | 0.797 | 0.0071 | - | - | - | - | - | - | - | - |
| Laboratory Findings | Coefficient (95% CI) | p-Value |
|---|---|---|
| White Blood Cell Count (×109/L) | 0.44 (−0.61 to 1.49) | 0.407 |
| Hemoglobin (g/L) | −0.14 (−1.22 to 0.94) | 0.799 |
| Platelets (×109/L) | −1.64 (−47.26 to 43.97) | 0.943 |
| C-Reactive Protein (mg/L) | −16.56 (−45.89 to 12.77) | 0.266 |
| D-dIMER (µg/mL) | −0.87 (−3.12 to 1.39) | 0.449 |
| Lactate Dehydrogenase (U/L) | −50.46 (−183.67 to 82.76) | 0.455 |
| Alanine Aminotransferase (U/L) | −2339.66 (−8075.41 to 3396.08) | 0.421 |
| Aspartate Aminotransferase (U/L) | −9.31 (−24.77 to 6.15) | 0.236 |
| Creatinine (mg/dL) | 0.15 (−0.04 to 0.33) | 0.127 |
| Neutrophil Count (%) | −0.73 (−5.72 to 4.25) | 0.771 |
| Lymphocyte Count (%) | 0.11 (−4.07 to 4.28) | 0.960 |
| Neutrophil to Lymphocyte Ratio | 0.21 (−1.58 to 2.00) | 0.817 |
| Red Cell Distribution Width CV (%) | −0.14 (−0.84 to 0.56) | 0.689 |
| Fibrinogen (mg/dL) | −42.07 (−116.96 to 32.81) | 0.269 |
| Ferritin (ng/mL) | −37.00 (−493.66 to 419.65) | 0.873 |
| Prothrombin Time (sec) | −0.06 (−0.66 to 0.54) | 0.840 |
| International Normalized Ratio | −0.02 (−0.07 to 0.04) | 0.536 |
| Troponin I (ng/mL) | −0.20 (−0.62 to 0.22) | 0.351 |
| Procalcitonin (ng/mL) | 0.18 (−0.11 to 0.47) | 0.229 |
| Glucose Mmol/L) | −1.69 (−3.91 to 0.52) | 0.132 |
| Laboratory Findings | Coefficient (95% CI) | p-Value |
|---|---|---|
| White Blood Cell Count (×109/L) | 0.13 (−1.00 to 1.27) | 0.819 |
| Hemoglobin (g/L) | −0.83 (−1.98 to 0.33) | 0.159 |
| Platelets (×109/L) | 58.51 (10.19 to 106.82) | 0.018 |
| C-Reactive Protein (mg/L) | 26.95 (−4.52 to 58.43) | 0.093 |
| D-dIMER (µg/mL) | 1.54 (−0.88 to 3.95) | 0.211 |
| Lactate Dehydrogenase (U/L) | 81.66 (−61.89 to 225.22) | 0.263 |
| Alanine Aminotransferase (U/L) | −1983.20 (−8189.67 to 4223.27) | 0.529 |
| Aspartate Aminotransferase (U/L) | 1.43 (−15.48 to 18.34) | 0.867 |
| Creatinine (mg/dL) | −0.13 (−0.34 to 0.07) | 0.201 |
| Neutrophil Count (%) | 1.90 (−3.48 to 7.28) | 0.486 |
| Lymphocyte Count (%) | −1.20 (−5.71 to 3.30) | 0.599 |
| Neutrophil to Lymphocyte Ratio | −0.27 (−2.20 to 1.67) | 0.786 |
| Red Cell Distribution Width CV (%) | −0.02 (−0.78 to 0.74) | 0.961 |
| Fibrinogen (mg/dL) | 54.61 (−26.06 to 135.28) | 0.183 |
| Ferritin (ng/mL) | 41.22 (−450.05 to 532.48) | 0.869 |
| Prothrombin Time (sec) | 0.50 (−0.14 to 1.14) | 0.121 |
| International Normalized Ratio | 0.02 (−0.04 to 0.07) | 0.588 |
| Troponin I (ng/mL) | 0.45 (0.01 to 0.89) | 0.046 |
| Procalcitonin (ng/mL) | −0.05 (−0.36 to 0.25) | 0.722 |
| Glucose (Mmol/L) | 1.72 (−0.80 to 4.25) | 0.178 |
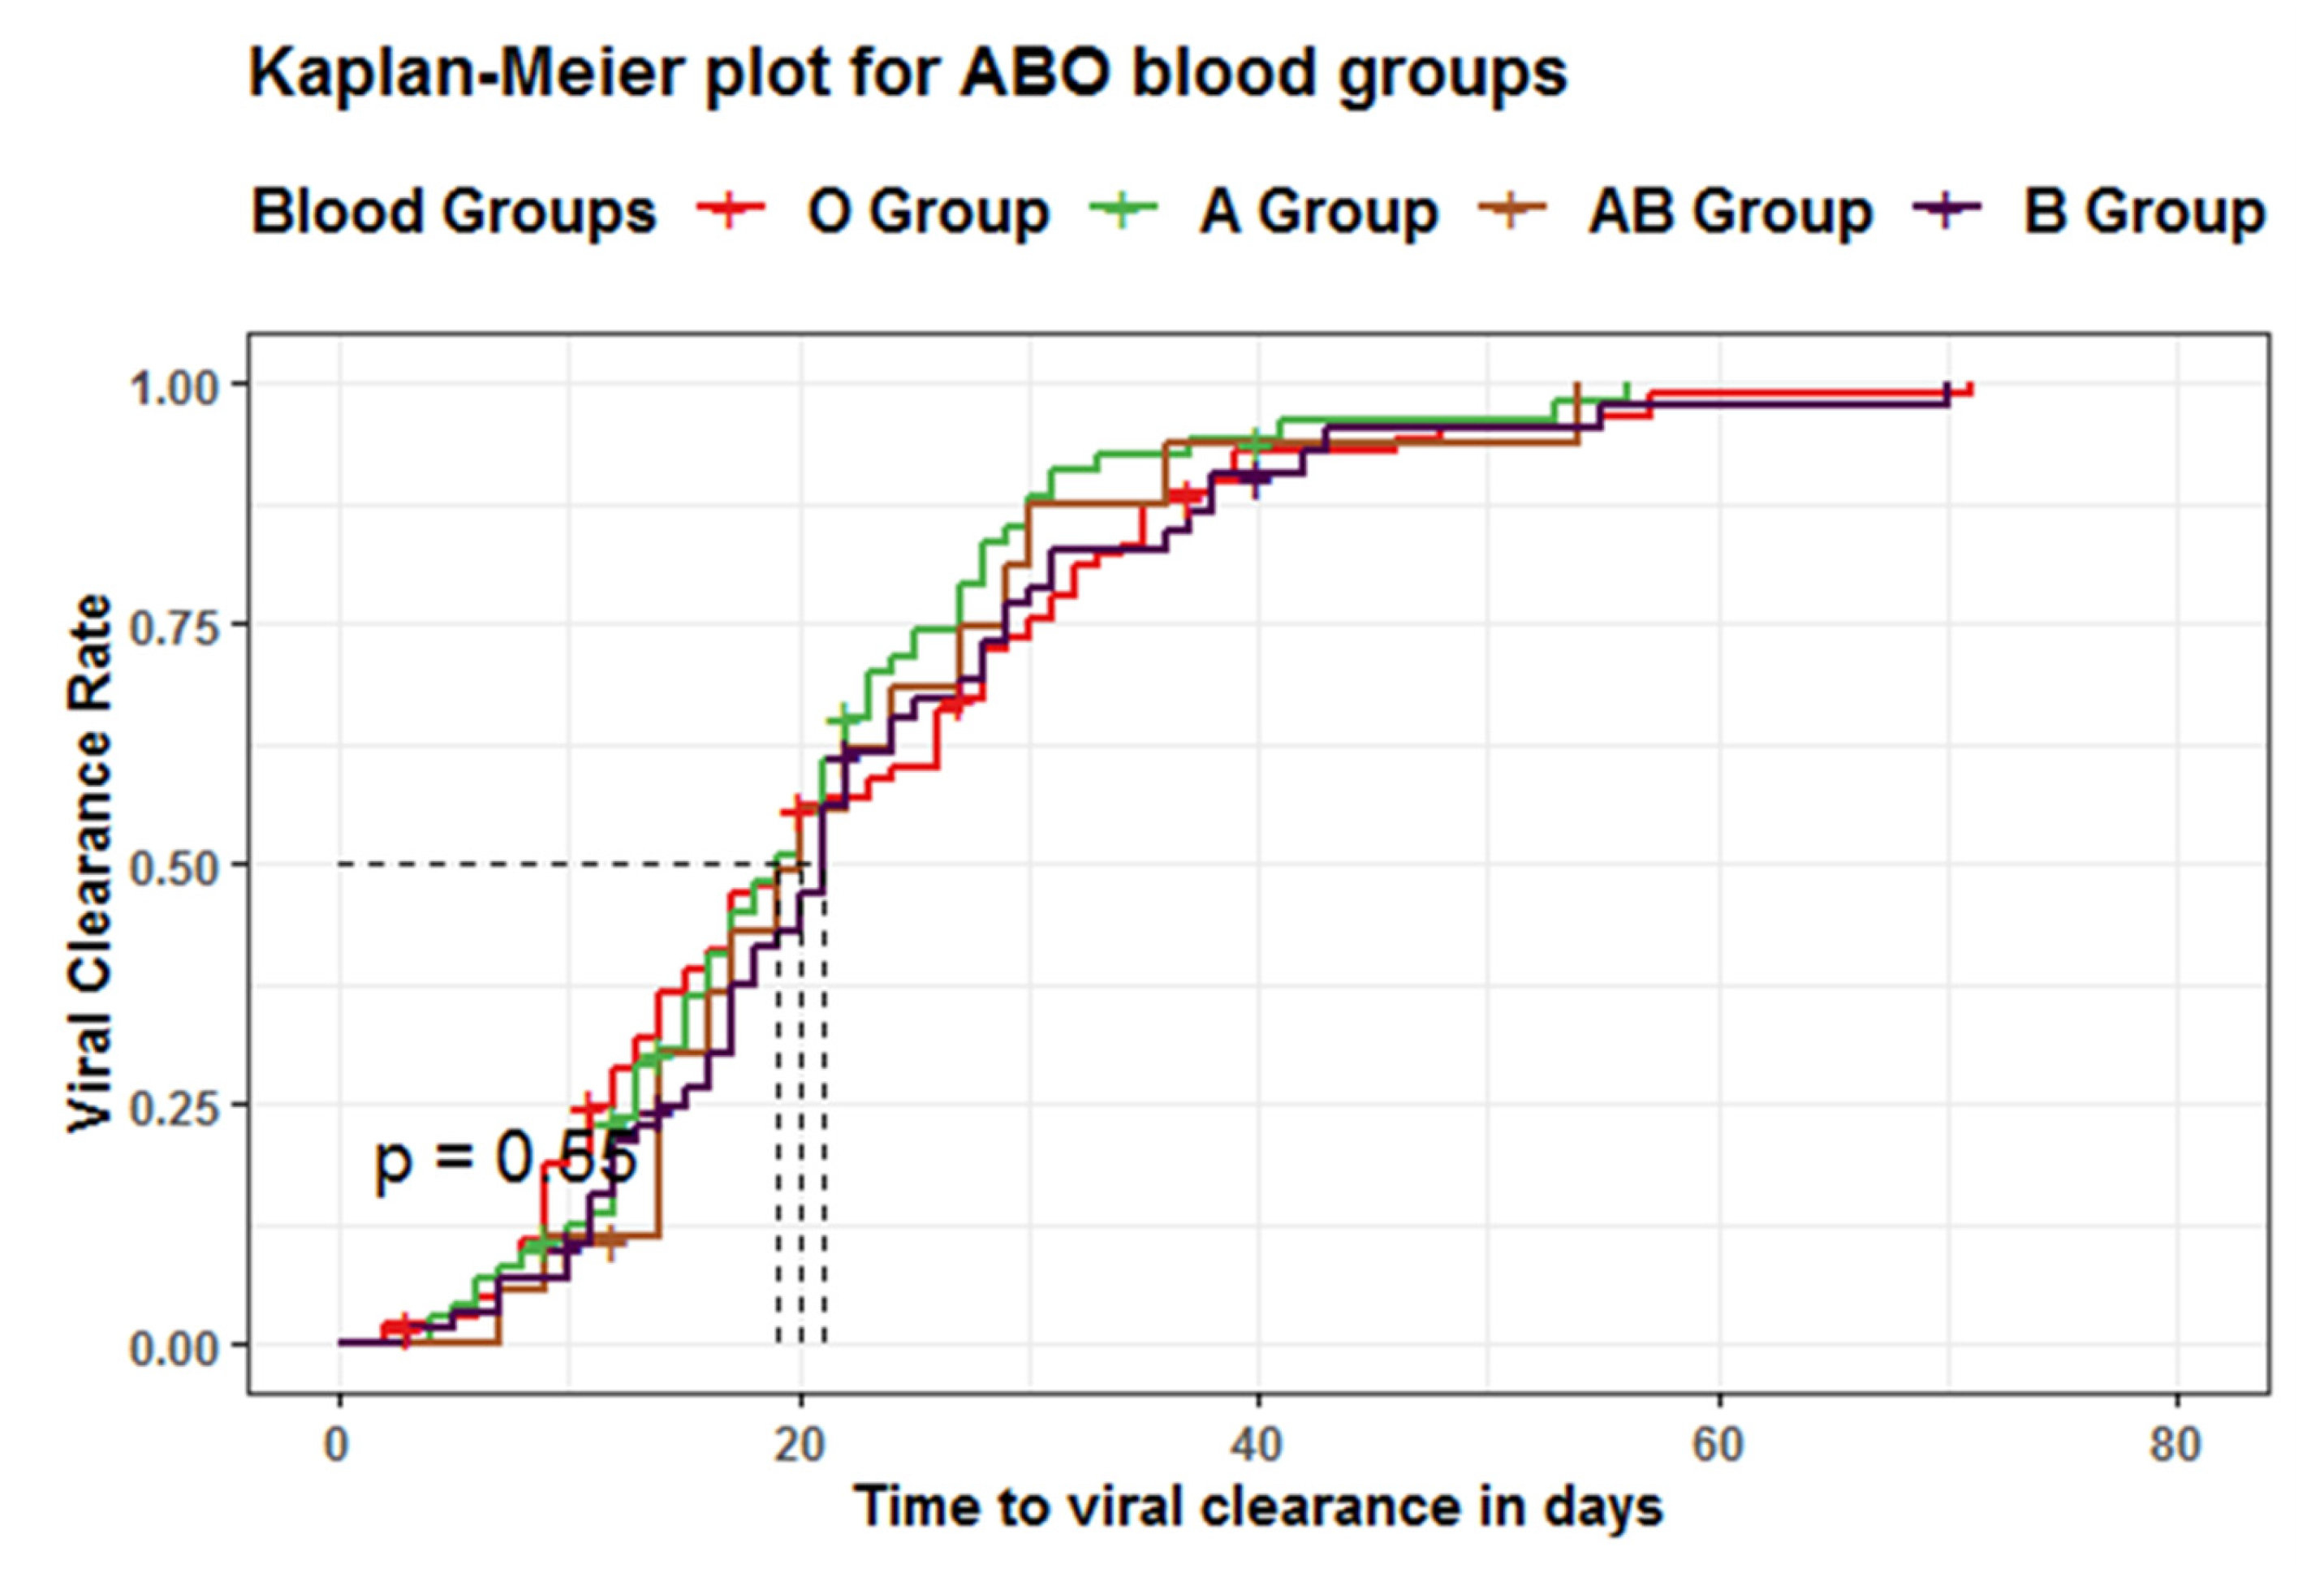
| Blood Groups | Total Number of Events | Median time to Viral Clearance (Days) | 95%CI (Days) | p-Value | Log-Rank |
|---|---|---|---|---|---|
| Group O | 97 | 19 | 17–26 | 0.6 | 2.1 |
| Group A | 68 | 19 | 16–22 | ||
| Group AB | 16 | 20 | 16–30 | ||
| Group B | 53 | 21 | 18–24 |
| Crude HR (95% CI) | p Value | Adj. HR (95% CI) | p Value | ||
|---|---|---|---|---|---|
| Blood Group | O | Reference group | |||
| A | 1.21 (0.89–1.66) | 0.230 | 1.37 (0.45–4.15) | 0.577 | |
| AB | 1.07 (0.63–1.82) | 0.808 | 1.16 (0.67–1.997) | 0.6012 | |
| B | 0.96 (0.68–1.34) | 0.792 | 0.272 (0.076–0.968) | 0.0445 | |
| RH | Negative | Reference group | |||
| Positive | 1.14 (0.73–1.79) | 0.553 | 0.806 (0.459–1.41) | 0.4517 | |
| Positive RH: Group B | - | - | 4.15 (1.089–15.85) | 0.037 | |
Publisher’s Note: MDPI stays neutral with regard to jurisdictional claims in published maps and institutional affiliations. |
© 2022 by the authors. Licensee MDPI, Basel, Switzerland. This article is an open access article distributed under the terms and conditions of the Creative Commons Attribution (CC BY) license (https://creativecommons.org/licenses/by/4.0/).
Share and Cite
Hafez, W.; Ahmed, S.; Abbas, N.; Ahmed, K.; Kamran, S.; Arya, A.; Rao, S.R.; Abdelshakor, M.; Ali, S.; Sebastian, H.; et al. ABO Blood Group in Relation to COVID-19 Susceptibility and Clinical Outcomes: A Retrospective Observational Study in the United Arab Emirates. Life 2022, 12, 1157. https://doi.org/10.3390/life12081157
Hafez W, Ahmed S, Abbas N, Ahmed K, Kamran S, Arya A, Rao SR, Abdelshakor M, Ali S, Sebastian H, et al. ABO Blood Group in Relation to COVID-19 Susceptibility and Clinical Outcomes: A Retrospective Observational Study in the United Arab Emirates. Life. 2022; 12(8):1157. https://doi.org/10.3390/life12081157
Chicago/Turabian StyleHafez, Wael, Shougyat Ahmed, Nihad Abbas, Kamran Ahmed, Samera Kamran, Arun Arya, Srinivasa Raghu Rao, Mahmoud Abdelshakor, Sara Ali, Honeymol Sebastian, and et al. 2022. "ABO Blood Group in Relation to COVID-19 Susceptibility and Clinical Outcomes: A Retrospective Observational Study in the United Arab Emirates" Life 12, no. 8: 1157. https://doi.org/10.3390/life12081157