1. Introduction
Gracilis muscle interposition (GMI) is an established treatment option for rectovaginal (RVF), pouch–vaginal (PVF) and recto–urethral (RUF) fistulas, as well as for perineal defects, either primarily or when other procedures have failed [
1,
2,
3,
4,
5].
The reported success rates of GMI range between 40–90% and tend to be higher with additional local procedures, such as advancement flaps [
6,
7,
8,
9,
10]. For patients with Crohn’s disease, which, along with ulcerative colitis (UC) and previous radiation therapy, is a risk factor for unsuccessful fistula repair, the success rate of GMI has been reported to be as high as 92% [
11,
12,
13].
However, postoperative complications include muscle necrosis, impaired wound healing, harvest site infection, incontinence, and fistula recurrence [
1,
6]. Reported rates of fistula recurrence range between 12–15% and are higher for patients with IBD [
13,
14].
The technical aim of GMI is to place healthy, well-vascularized muscle tissue in the space between the former fistula openings after fistula excision and closure from both sides [
15]. The identification and meticulous preparation of the proximal neurovascular bundle carrying the main blood supply of the gracilis muscle is crucial for the procedure [
15,
16]. Thus, assessing muscle perfusion after complete mobilization, and before final placement, is decisive.
To date, intraoperative perfusion assessment relies on subjective parameters, such as tissue color and the presence of a palpable pulse. These may be affected by a multitude of factors, such as the surgical site and individual experience of the surgeon.
Quantifiable methods of perfusion assessment are still lacking. One method showing promising results is indocyanine green derived near-infrared fluorescence (ICG-NIRF) [
17,
18,
19]. As intravenously administered indocyanine green (ICG) initially remains in the intravascular compartment due to its plasma-binding properties, its near-infrared fluorescence signal is proportional to perfusion [
20,
21].
However, standardized and objective criteria for ICG-NIRF assessment have not been uniformly established, causing its interpretation to remain subjective in many cases. Furthermore, an ICG-NIRF perfusion assessment has not been previously reported for GMI in correlation with the clinical outcome.
The aim of this study was to evaluate a novel and objective software-based method for ICG-NIRF perfusion assessment in GMI.
2. Materials and Methods
In a single-center retrospective study, all patients that had undergone GMI with intraoperative ICG-NIRF imaging at our institution (Charité University Hospital Berlin, Campus Benjamin Franklin, a tertiary colorectal and IBD referral center) from October 2019 to October 2020 were included. All procedures were performed by a single surgeon.
The indications for GMI were RVF, PVF and a persisting perineal defect. Underlying conditions were Crohn’s disease, ulcerative colitis or indeterminate colitis. All patients gave written informed consent for the procedure and ICG-NIRF visualization.
Ethical approval of the study was obtained from The Charité University Hospital Ethics Committee (EA4/029/21, Ethikkommission der Charité—Universitätsmedizin Berlin).
2.1. Surgical Technique
The procedure began with fistula tract identification by probing, followed by a perineal incision. The fistula was then debrided, resecting the components. After sufficient irrigation, the fistula openings were closed by interrupted sutures. This was followed by preparation of the remaining perineal space.
Access to the gracilis muscle was gained via two longitudinal incisions on the medial aspect of the thigh, one proximal and one distal. The muscle was mobilized by careful preparation to avoid impairment of the proximal neurovascular bundle. Smaller vessels and collaterals were ligated. After complete mobilization, the gracilis tendon was transected above its insertion, resulting in a completely mobile muscle. This was followed by the preparation of a subcutaneous tunnel from the medial thigh to the perineal incision. The mobilized gracilis muscle was then transferred through this tunnel, allowing its distal segment to be placed in the space between the divided fistula components in a tension-free manner and to be secured by suturing. The perineal wound was closed primarily by suturing. In two cases, fecal diversion by laparoscopic ileostomy was performed additionally to GMI. All other patients had already undergone fecal diversion prior to the procedure.
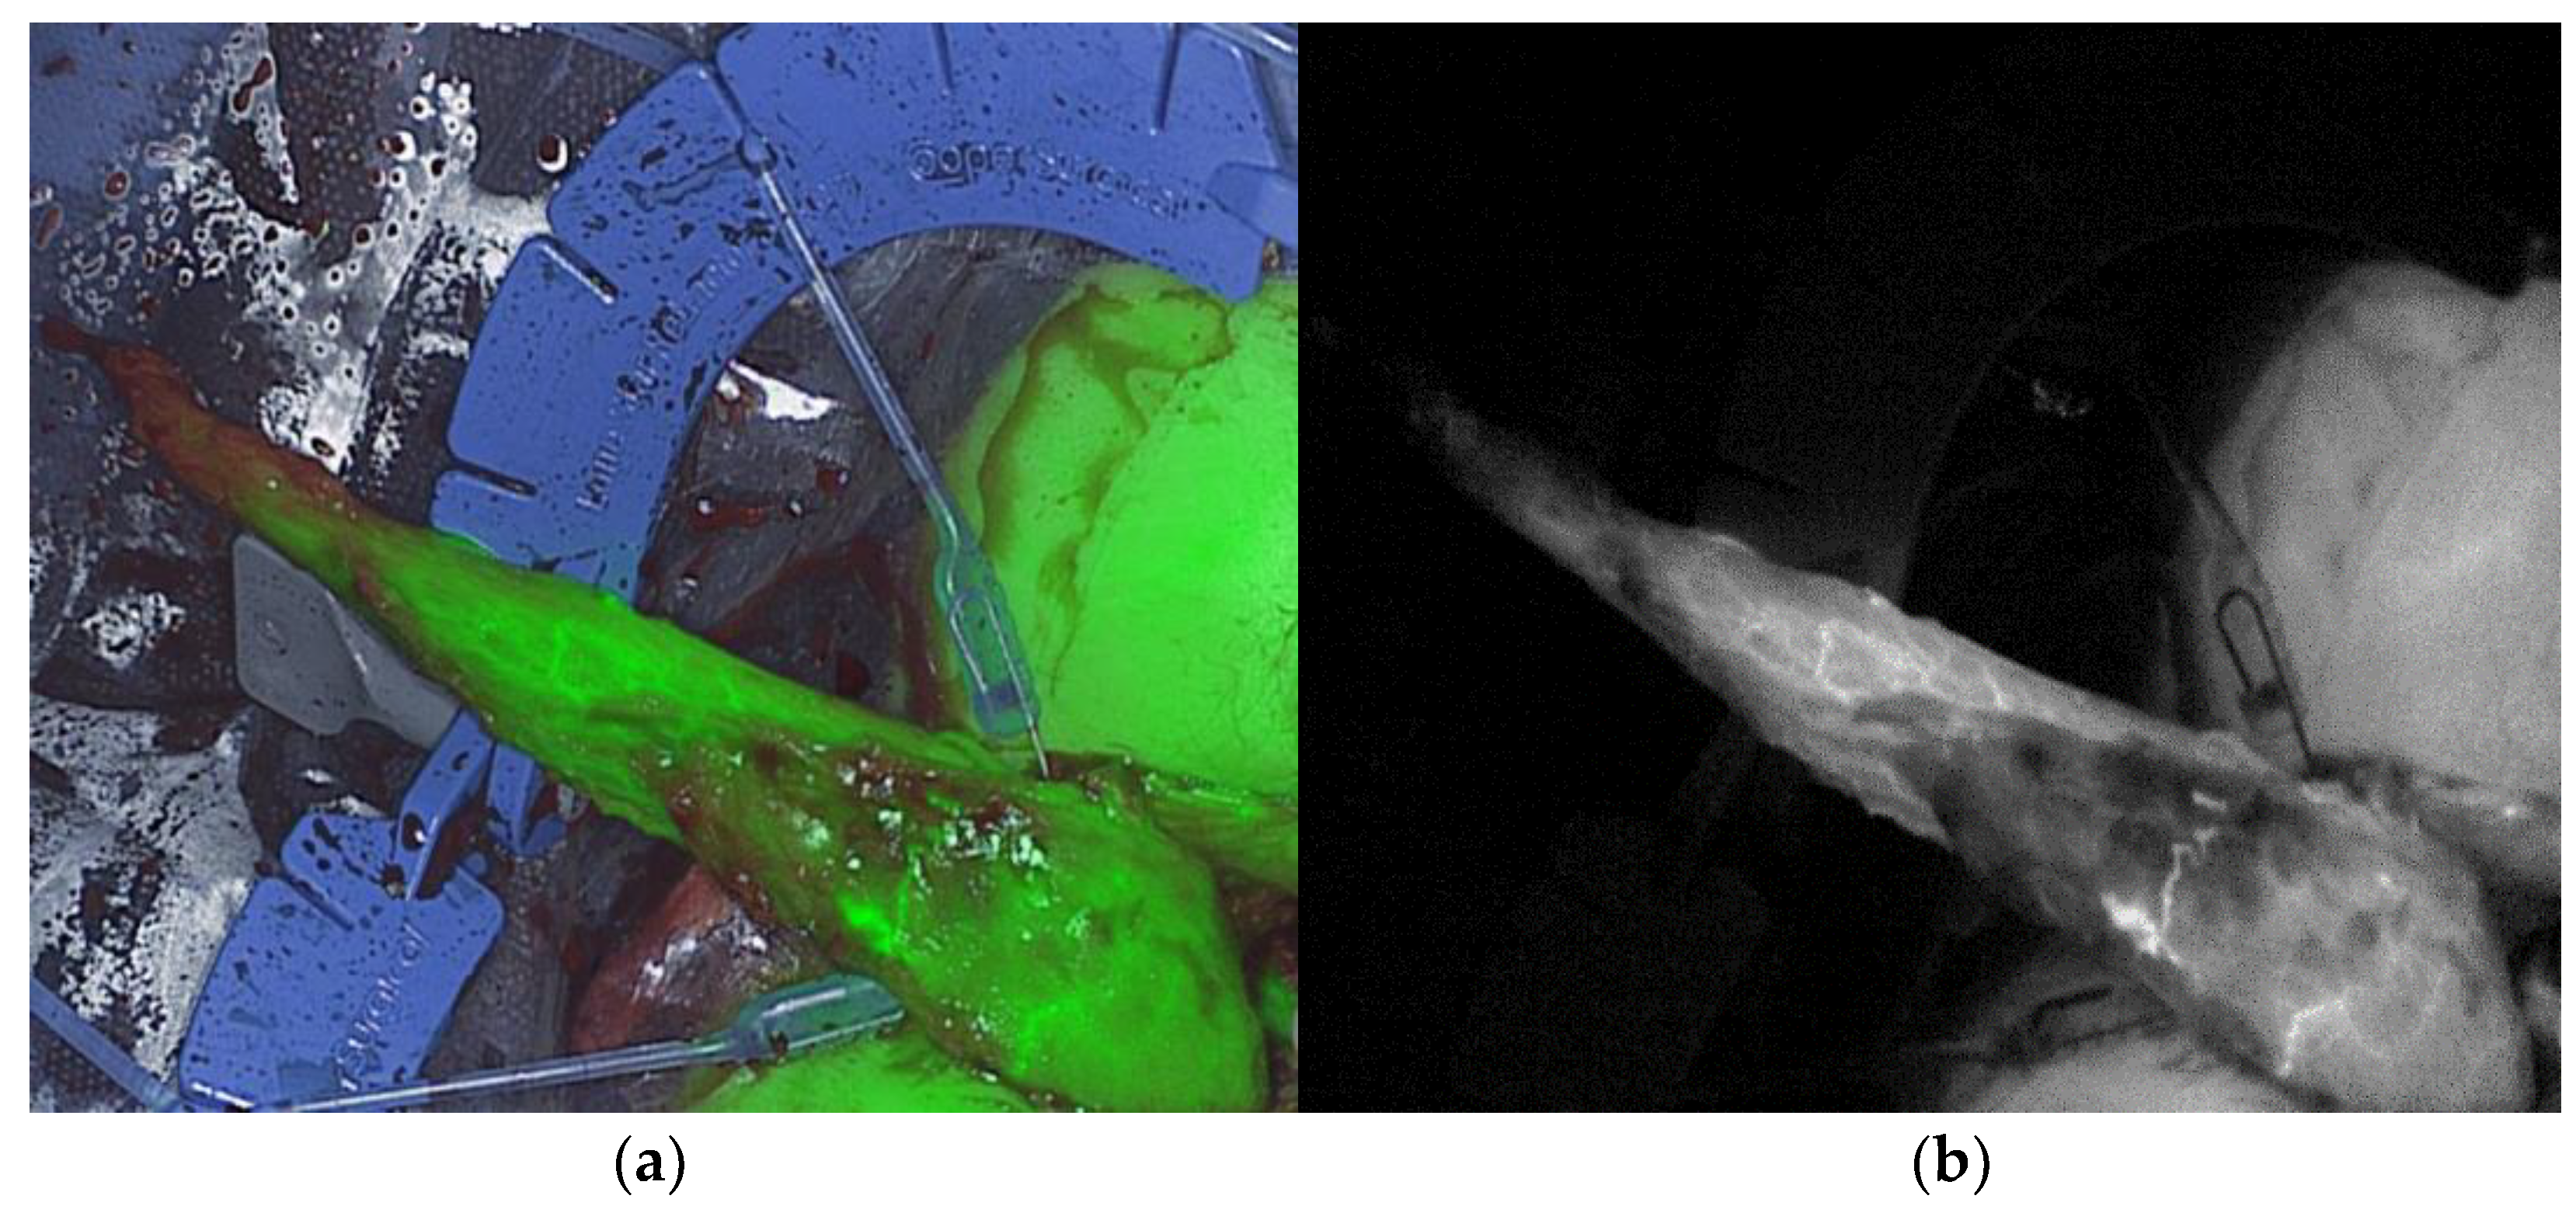
2.2. Intraoperative ICG-NIRF Perfusion Visualization
Real-time intraoperative ICG-NIRF perfusion visualization of the gracilis muscle was performed after mobilization and transfer to the perineal region, before final placement, with the Quest Spectrum
® Fluorescence Imaging Platform (Quest Medical Imaging, Middenmeer, The Netherlands) equipped for open surgery (
Figure 1).
ICG (VerDye, Diagnostic Green GmbH, Aschheim Germany, 25 mg vials) was dissolved in 5 mL sterile water to yield a 5 mg/mL concentration. It was then administered intravenously as a bolus of 1 mL (5 mg). Each visualization was video recorded to enable postoperative assessment. Clinical and technical data during visualization were collected. In particular, hemodynamics and the distance of the camera to the imaging site were recorded in detail and standardized as far as possible in the clinical set-up. The time to visual detection of a fluorescence signal (time to fluorescence signal) and subjective perception of signal strength were determined (0 = no signal, 1 = detectable signal, 2 = strong, homogenous signal).
2.3. Postoperative Follow-Up
Follow-up consisted of a digital rectal and vaginal exam, vaginoscopy and rectoscopy or pouchoscopy, and was initially conducted within 6 weeks after surgery. A second follow-up was conducted 3 months after surgery or if symptoms occurred.
Clinical data were collected from all patients on postoperative complications of GMI within 3 months. GMI failure was defined as the occurrence of one of the following: persistence or recurrence of the preoperative fistula; required resection of the interposed gracilis muscle due to necrosis or wound site infection; postoperative incontinence.
If none of these complications occurred, the outcome was categorized as successful GMI.
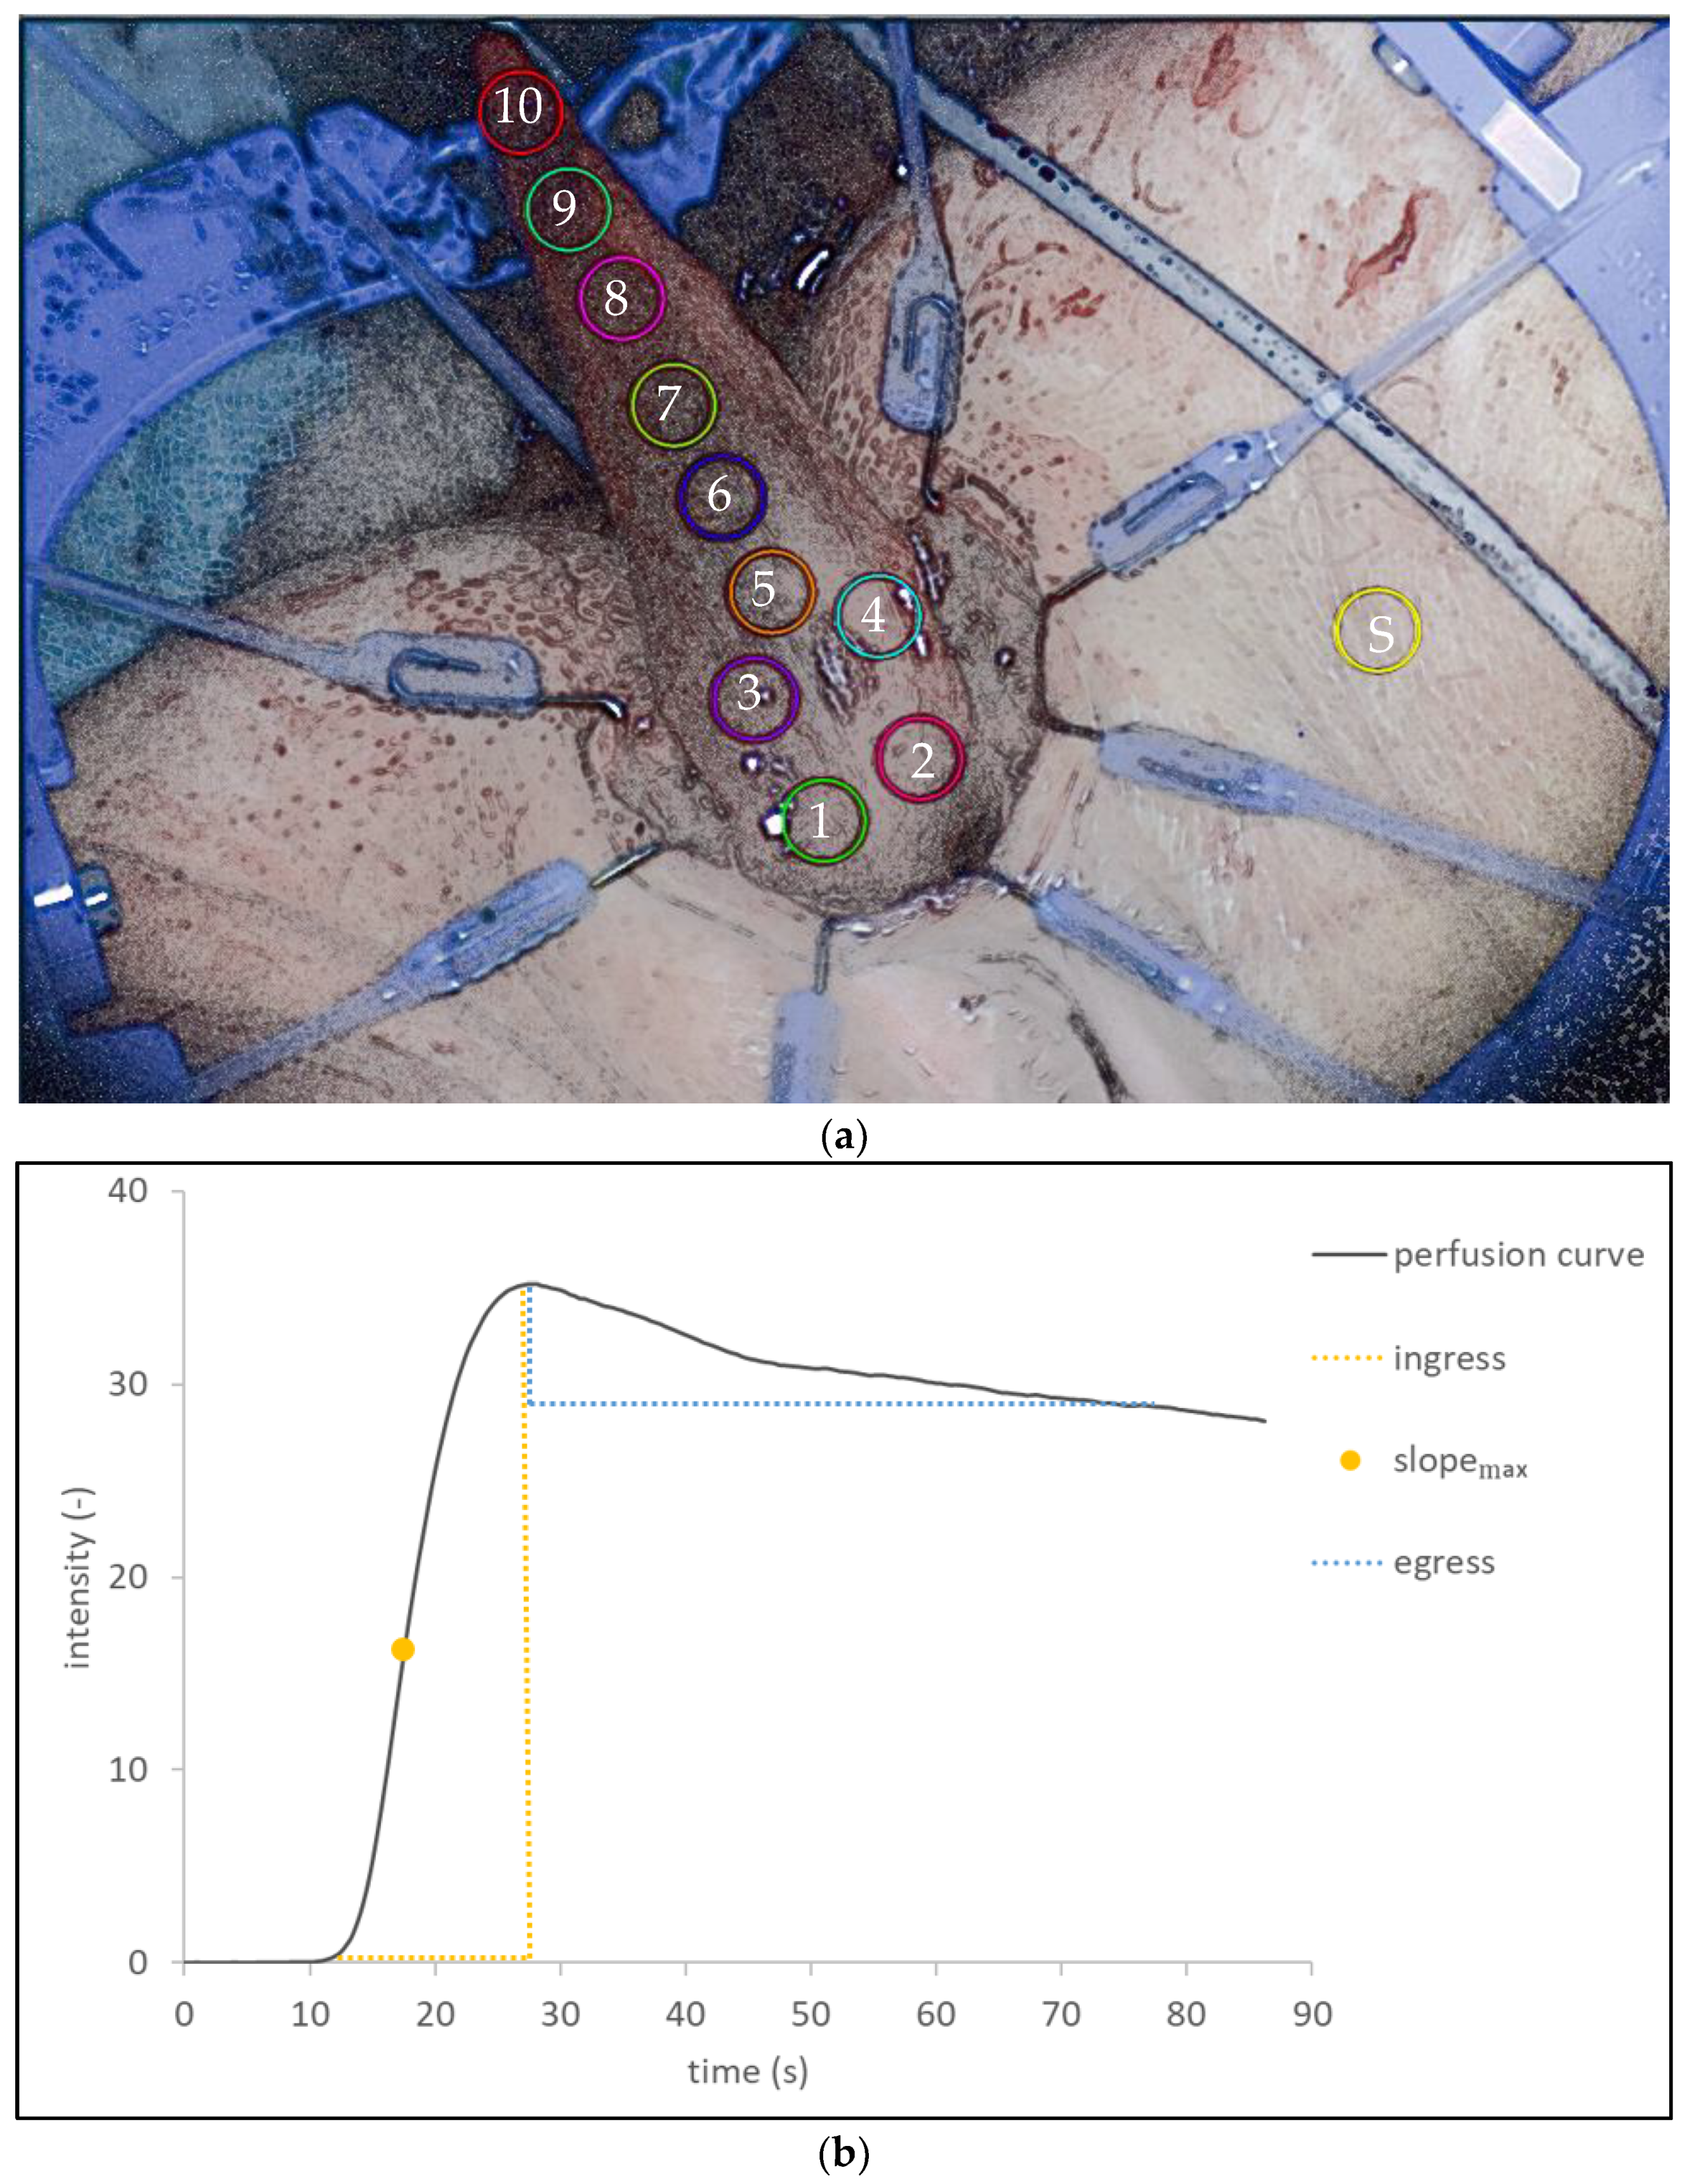
2.4. Postoperative Software-Based Assessment of ICG-NIRF Perfusion Visualization Data
The recordings of the ICG-NIRF perfusion visualization were analyzed using a novel perfusion assessment software (Quest Research Framework, Quest Medical Imaging, Middenmeer, The Netherlands).
Standardized regions of interest (ROIs) were determined in each visualization recording, covering all areas of the mobilized gracilis muscle from the proximal base to the distal tip and numbered from 1 to 10, including an ROI on the skin as a positive control to indicate sufficient visualization, the influence of confounders and reproducibility (
Figure 2a). The change in fluorescence intensity over time was then visualized for each ROI (
Figure 2b). In this graph, the ingress and egress region of the perfusion process of the ICG bolus through the tissue is visualized. For the ingress (positive slope) phase of the curve, the maximum slope was calculated.
Additionally, fluorescence intensity over time was assessed in an automated pixel-to-pixel analysis, depicting maximum slope per value per pixel in a color-coded and quantitative manner.
The findings were then correlated with the clinical outcome of each GMI.
3. Results
Clinical characteristics (
Table 1) and technical data during visualization (
Table 2) confirmed, in detail, the standardization of the intraoperative method applied in all patients.
Patient 1, a 52-year-old woman with indeterminate colitis, presented with RVF recurrence after repeated advancement flap. A laparoscopic loop ileostomy and GMI were performed. The intraoperative ICG-NIRF perfusion visualization showed a sufficient perfusion of the mobilized gracilis muscle. The follow-up showed no sign of persistence or recurrence. The perineal and harvest site wounds had healed primarily. At the second follow-up, the successful fistula repair was confirmed (
Table 1).
Patient 2, a 29-year-old woman with Crohn’s disease, underwent open proctolocectomy and end ileostomy for severe refractory Crohn’s colitis. Ten days after surgery, the rectoscopy revealed rectal stump leak and vaginal air insufflation. Primary vaginal fistula closure was followed by endorectal vacuum therapy for 16 days. The follow-up revealed RVF recurrence. A month later, GMI was performed. The intraoperative ICG-NIRF perfusion visualization showed sufficient perfusion. The follow-up showed no sign of fistula persistence or recurrence. The perineal and harvest site wounds were healing primarily. The second follow-up confirmed successful fistula repair and complete wound healing.
Patient 3, a 42-year-old woman with Crohn’s disease, had previously undergone colectomy with end ileostomy and a low anterior resection of the rectum with closure of the rectal stump. This patient presented with chronic leak of the rectal stump and underwent a transanal completion mucosectomy with primary endoluminal vacuum therapy. After prolonged endoluminal vacuum therapy, a large perineal wound defect remained. Subsequently, a transanal sphincterectomy with closure of the perineal wound by GMI was performed. The intraoperative ICG-NIRF perfusion visualization showed sufficient perfusion. The initial follow-up showed sufficient perineal repair 11 days after surgery. At the second follow-up 3 months after surgery, the perineal wound had healed completely.
Patient 4, a 52-year-old woman with UC presented with repeated PVF recurrence after ileostomy reversal, having previously undergone redo ileal pouch for PVF. Laparoscopic loop ileostomy and GMI were performed. Intraoperatively, due to possible proximal pedicle impairment, an ICG-NIRF perfusion visualization was performed twice: directly after mobilization before tunneling to the perineal region, and again before final placement (at the same time point as in the previous cases). As the second visualization occurred only 16 min after the first, an increased dose of 15 mg of ICG was used to reduce the effect of background fluorescence. Although the ICG-NIRF perfusion visualization showed a lower signal at the tip of the interposed gracilis muscle, the overall fluorescence signal indicated sufficient overall perfusion on subjective interpretation.
At the first follow-up visit, there was no clinical sign of muscle necrosis or fistula persistence. The second follow-up showed a perineal wound dehiscence in secondary healing, with no evidence of GMI necrosis or fistula. At the third follow-up visit 6 weeks after surgery, pouchoscopy revealed vaginal air insufflation, highly suggestive for PVF persistence. Successful redo GMI from the opposite side was performed thereafter.
Patient 5, a 36-year-old woman with indeterminate colitis, presented with PVF after ileostomy reversal 6 months after having undergone a restorative proctocolectomy with ileal J-pouch. A primary fistula closure and redo ileostomy were performed, followed by GMI 2 months later. The ICG-NIRF perfusion visualization showed sufficient perfusion. The follow-up revealed a complete primary healing of the perineal and harvest site wounds and no sign of fistula persistence or recurrence. A second follow-up confirmed complete healing and successful fistula repair.
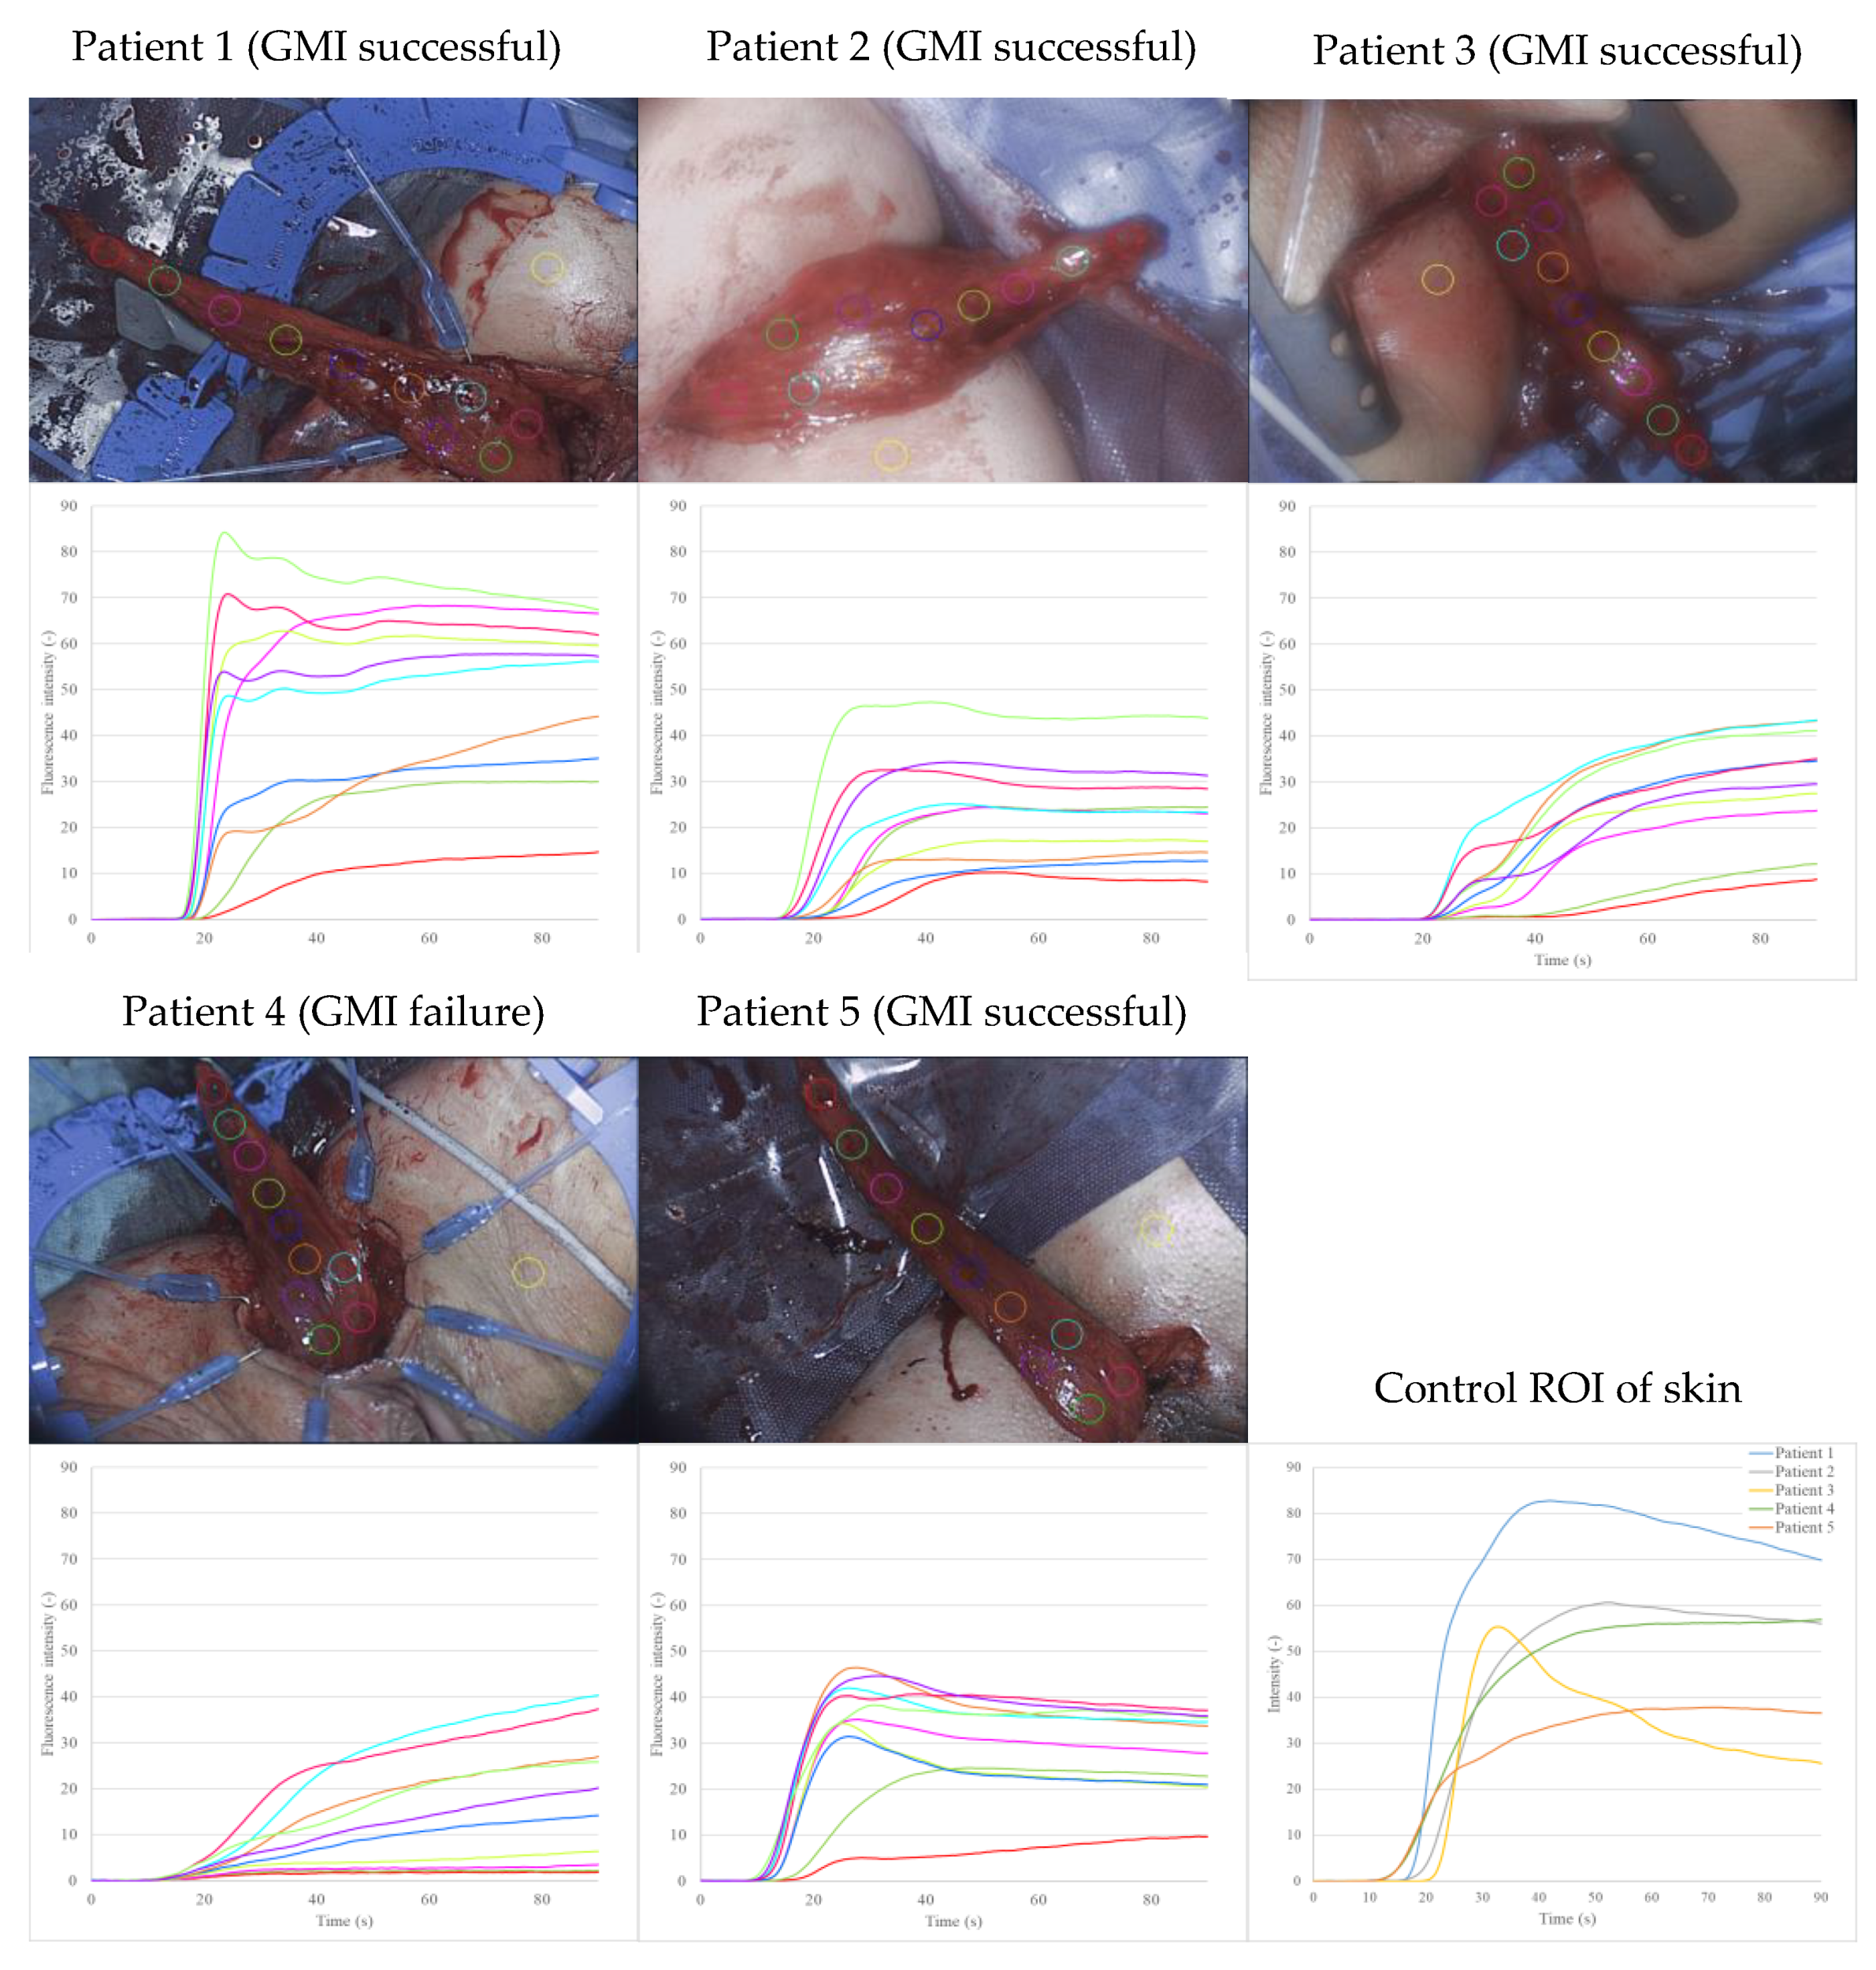
The retrospective visualization of fluorescence intensity over time as a graph for each predefined ROI resulted in perfusion curves, representing the inflow and outflow of blood in the gracilis muscle (
Figure 3). The fluorescence intensity was higher for ROIs near the base of the mobilized gracilis muscle and decreased towards the tip.
In general, the shape of the perfusion curves followed a pattern: a steep, positive slope (ingress) was followed by a flattening out and negative slope (egress) of the curve. This was particularly apparent in patients 1, 2 and 5 (successful GMI). The perfusion curves of patient 3 (successful GMI) showed an ingress twice, with a more gradual flattening of the curves. In contrast, the perfusion curves of patient 4 (GMI failure) lacked an egress across all ROIs of the gracilis muscle and lacked an ingress in the distal ROIs, whilst having a low overall fluorescence intensity.
The ROIs on the skin were placed as a positive control to indicate sufficient visualization after ICG injection, the influence of confounding variables and the reproducibility of the assessment. The skin perfusion curves had a similar shape to the muscle perfusion curve. The skin ROI of patient 3 had a particularly steep increase and high fluorescence intensity over time.
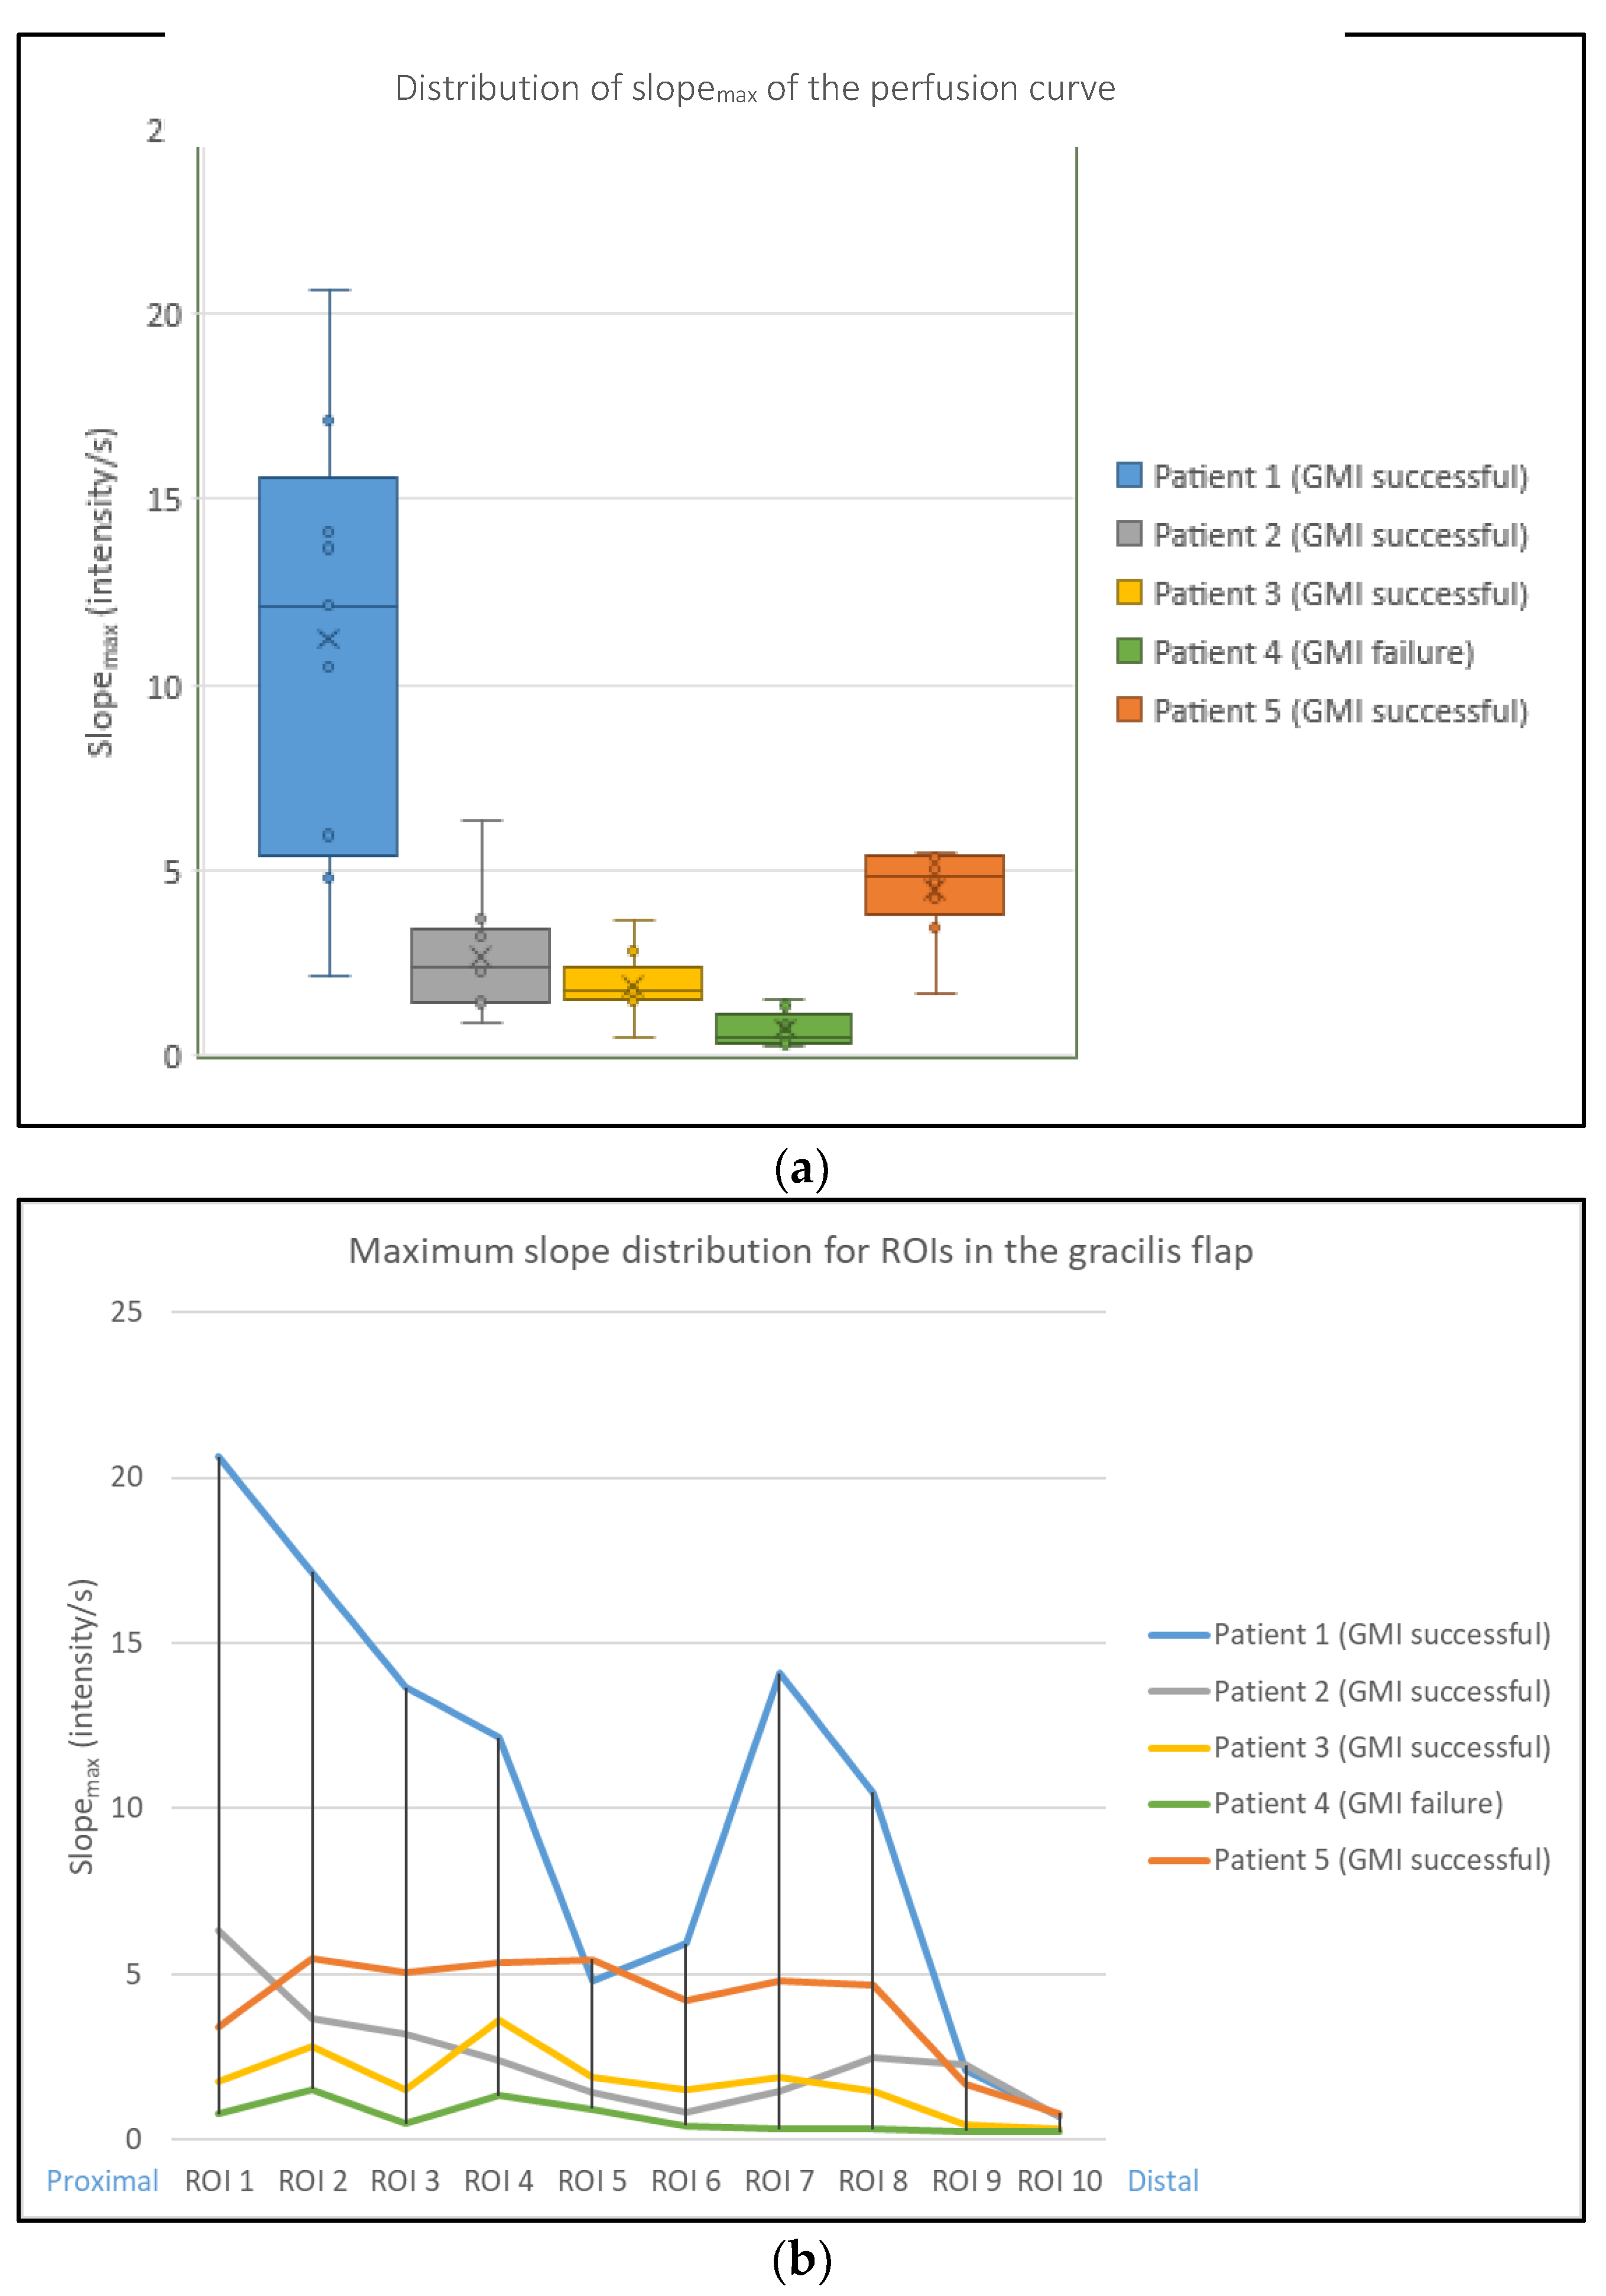
The maximum slope of the curve for each ROI (slope
max) was calculated and compared, including its mean, maximum, minimum value, and standard deviation (
Figure 4a). Slope
max was lowest in patient 4 (GMI failure). Slope
max was highest in patient 1 (GMI successful), as was the range between the maximum and minimum slope
max value.
The distribution of slope
max for ROIs 1–10 was analyzed for each patient (
Figure 4b). Patient 1 showed a decrease across ROIs 5 and 6 and regained slope
max distally. Patients 2, 3 and 5 showed a homogenous slope
max distribution. Patient 4 (GMI failure) had the lowest slope
max distribution across all ROIs.
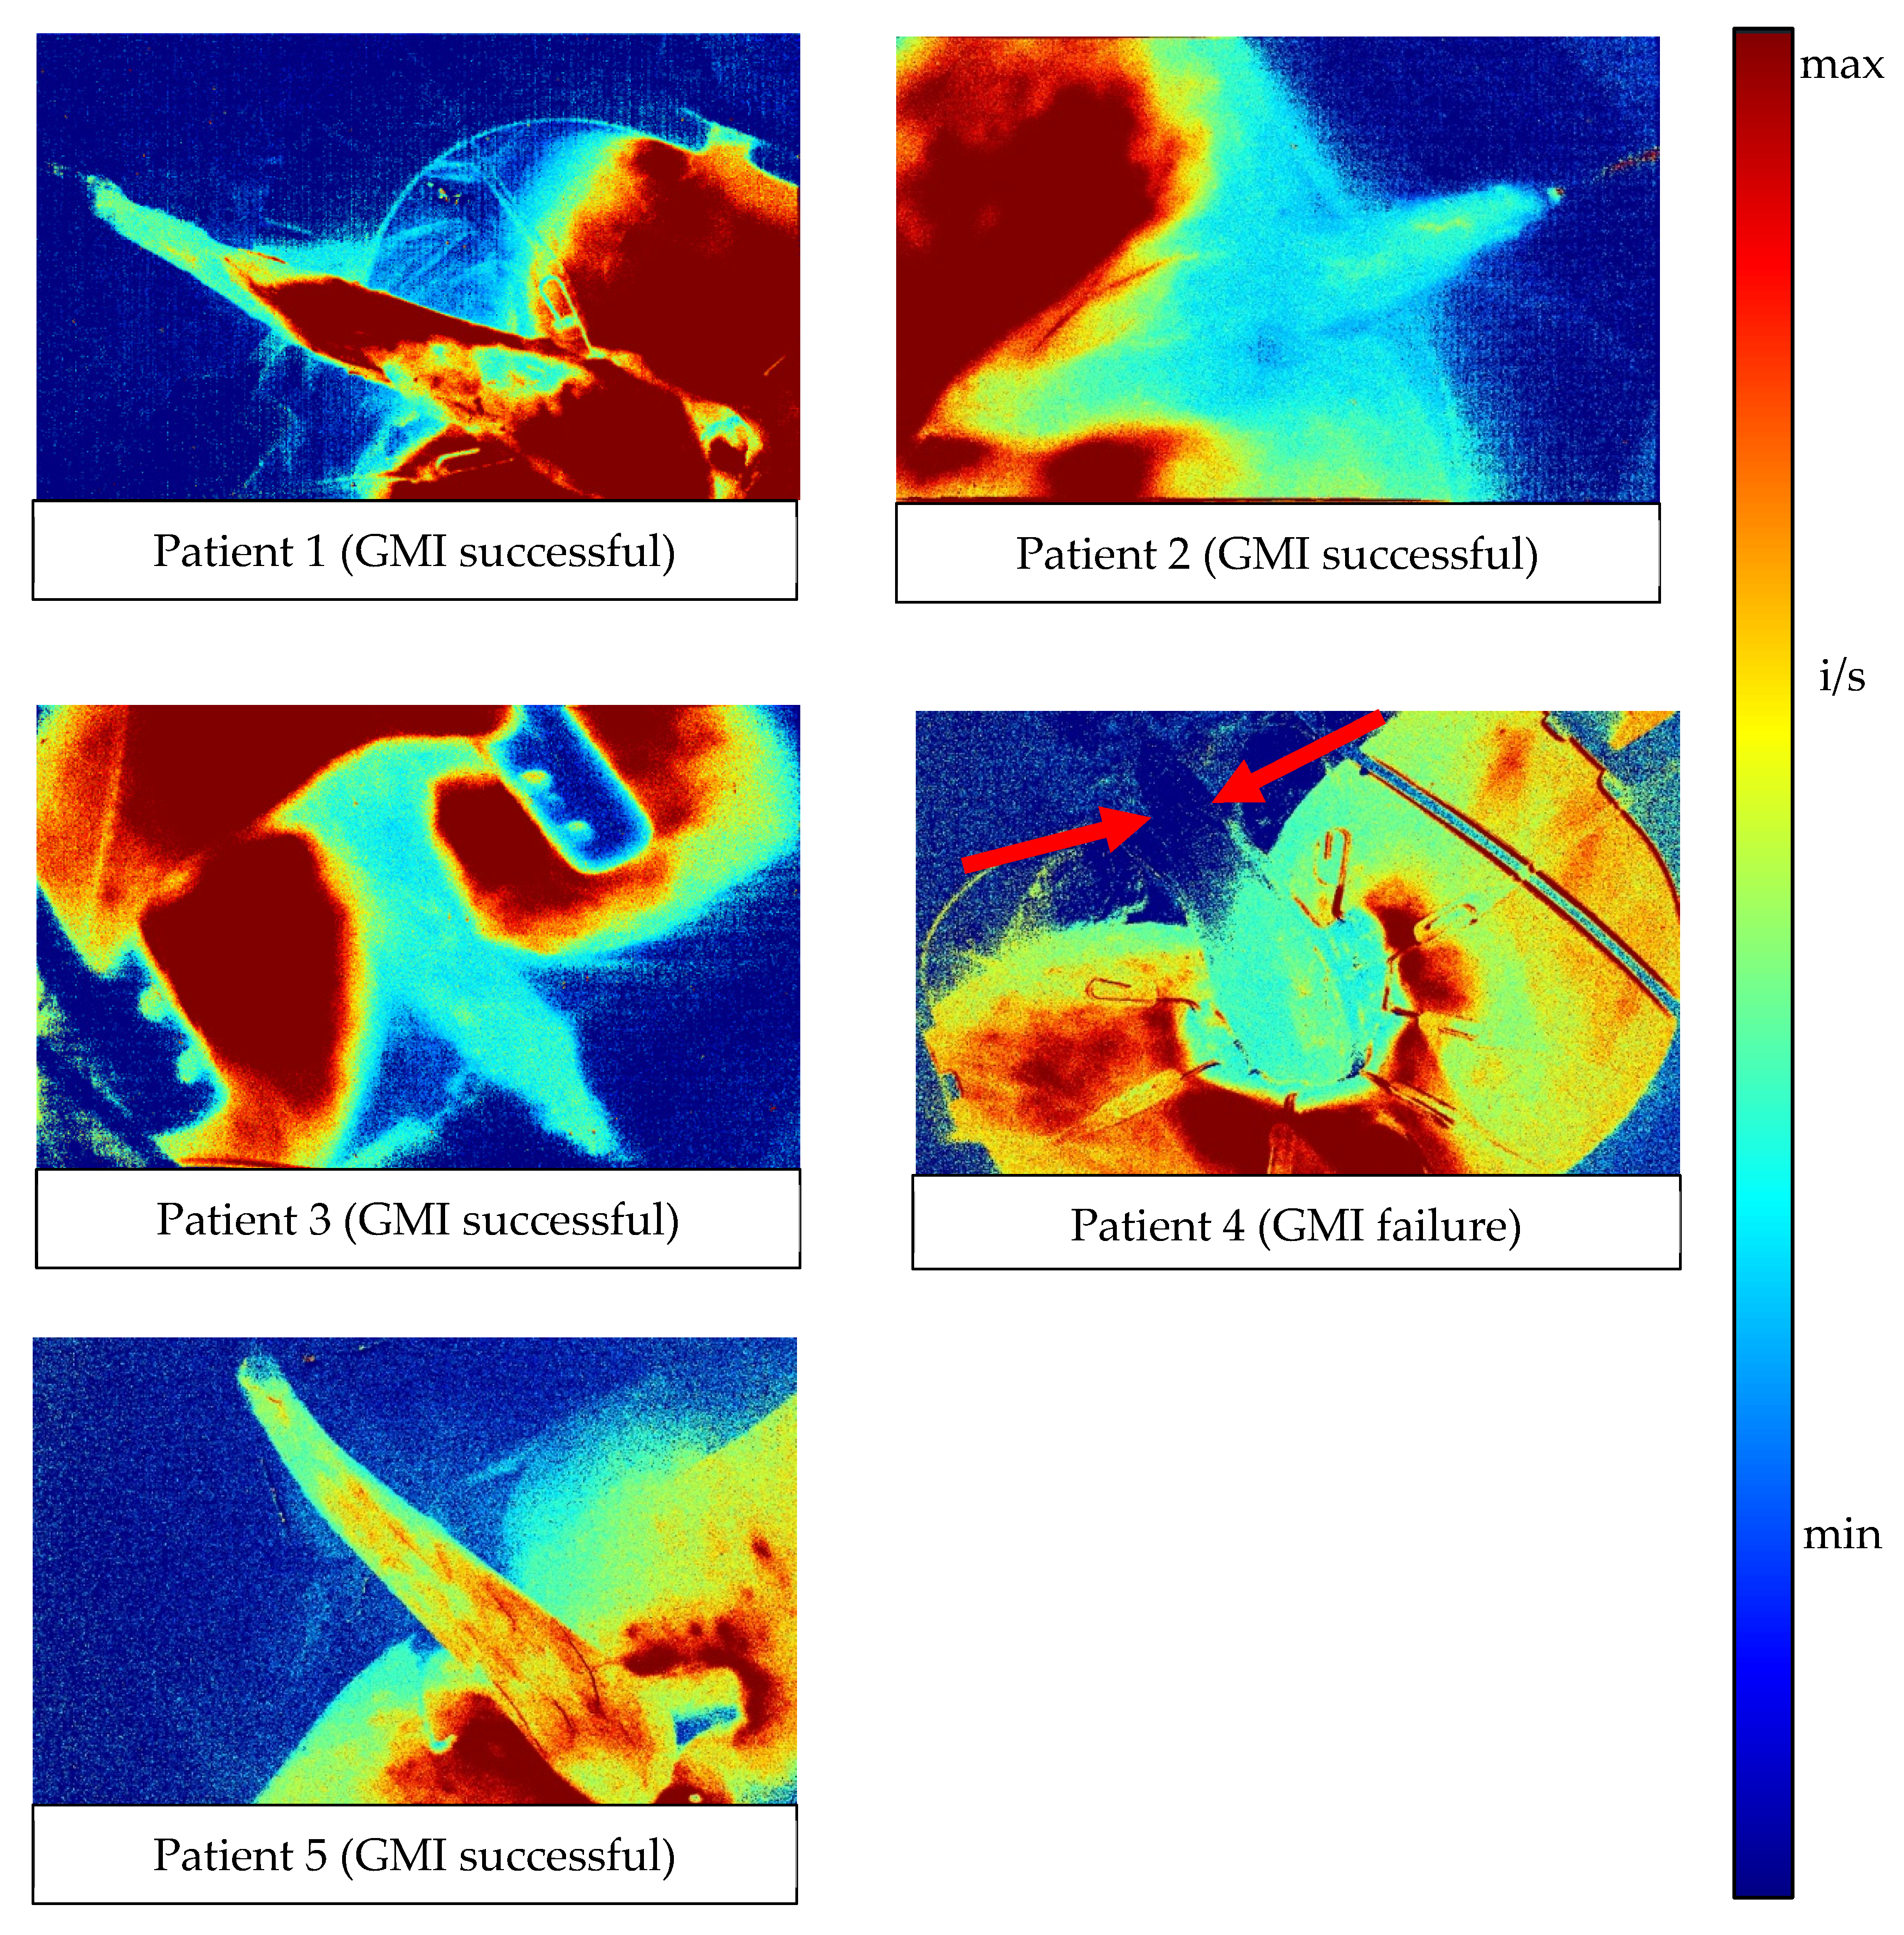
In the automated pixel-to-pixel analysis of the fluorescence intensity over time, the slope
max value per pixel was visualized by color-coding (
Figure 5): red indicates a high slope
max value, and blue indicates no slope across the perfusion curve. Patients 1, 2, 3 and 5 had moderate to high slope
max values across the whole gracilis muscle (green/turquoise). In patient 4, only the proximal half of the gracilis muscle showed slope
max values. The distal half lacked slope
max completely (dark blue, red arrows).
Based on the anatomic direction of vascularization, perfusion zones 1–4 were determined (
Figure 6a). By pixel-to-pixel analysis, the maximum, minimum and mean slope
max value and its standard deviation (SD) were calculated and plotted per zone (
Figure 6b, scatter plot per patient).
Generally, across zones 1 (proximal)—4 (distal), there was a decrease in the range and mean slopemax value. In patients 1, 2, 3 and 5 (GMI successful), there was a greater range of slopemax values than in patient 4 (GMI failure). Patient 3 (GMI successful) and patient 4 (GMI failure) displayed lower mean slopemax values. However, in patient 3, the difference between the maximum and minimum value of slopemax was greater than in patient 4 across all zones, especially in zone 4 (distal).
4. Discussion
ICG fluorescence-based methods are gaining popularity for intraoperative perfusion visualization. This applies to plastic and reconstructive surgery, as well as general and colorectal surgery [
19,
22,
23,
24,
25]. However, objective criteria for assessing the dynamic process of perfusion in tissues of surgical interest are still lacking. As reviewed before, the currently available devices and software solutions differ significantly from each other and often focus on the fluorescence intensity at a single point in time [
17,
18,
26,
27]. This may affect the validity and reliability of assessing perfusion. Slooter et al. performed an extensive review of quantitative fluorescence angiography methods, identifying fluorescence–time curves as the most promising future perfusion indicators [
28]. The authors identified seven studies investigating fluorescence–time curves in humans, of which, five assess the clinical outcome of gastrointestinal anastomosis. While the studies describe a similar methodology, highlighting its potential, none of these assess muscle flap perfusion and its clinical outcome. In contrast to our results, while slope and several fluorescence time points are described, none of the mentioned studies identify slope
max or proceed to analyze its distribution, including a pixel-to-pixel analysis.
ICG-NIRF perfusion visualization for GMI and its software-based objective assessment have not previously been reported or correlated with the clinical outcome.
Using a comparatively low dose of ICG [
29], an ICG-NIRF visualization of the gracilis muscle was achieved in all cases at the chosen time point with a subjectively sufficient fluorescence signal.
However, in our data, the subjective parameters of visualization (signal strength, time to signal) did not show a correlation with the clinical outcome. This raises the question of whether an objective software-based perfusion assessment may be more valid.
The first step of our postoperative software-based assessment resulted in perfusion curves depicting fluorescence intensity over time for specifically determined ROIs (
Figure 3). The pattern of an ingress followed by an egress could generally be identified for GMIs with a successful clinical outcome (patients 1, 2, 3 and 5). In contrast, patient 4 (GMI failure) showed no egress in the distal ROIs, suggesting impaired perfusion. The perfusion curves of patient 3 (GMI successful) show two ingress phases, with a more gradual flattening of the curve. The reason for this is unclear and a greater number of cases is required to investigate this topic further.
One ROI per patient was placed on the surrounding skin as a positive control (
Figure 3). The perfusion curves of the control-ROIs indicated validity and a homogenous distribution of ICG after injection. They further suggested that the shape of ingress followed by egress is characteristic for several types of tissue.
The skin ROIs of patient 1 and 3 have a particularly steep increase and high fluorescence intensity over time. Future research into this is warranted.
When correlated with the clinical outcome, the perfusion curves confirm that the fluorescence intensity (the main marker in conventional, subjective ICG-NIRF assessment) may not be representative of perfusion, but rather the fluorescence intensity over time. The fluorescence intensity is generally lower in the distal part of the gracilis muscle, which can be explained anatomically by decreasing vascularization.
The identification of slope
max, and its distribution (
Figure 4) supports these findings. The dip across ROIs 5 and 6 in the graph of patient 1 may be explained by superficial haematoma covering the muscle in that region (
Figure 3, patient 1). The results propose that slope
max is a relevant indicator of perfusion in GMI, as it decreased across all regions of the gracilis muscle in the case of GMI failure (patient 4,
Figure 4). This was confirmed by pixel-to-pixel and perfusion zone analysis (
Figure 5 and
Figure 6). The findings further suggest that the range between the minimum and maximum slope
max value across a tissue of interest may be more relevant to indicate impaired perfusion than the mean slope
max value (
Figure 6). This could be explained by the presence of scattered blood vessels in areas of low vascularization, which increase the range of slope
max punctually despite a low mean slope
max value across that region (
Figure 5 and
Figure 6; patients 2 and 3).
The assessment steps presented here may lead to the identification of tissue-specific quantitative indicators of perfusion.
This study has some limitations. Only five patients were included. This number was insufficient for the statistical analysis of additional documented variables, such as haemodynamics, the distance of the camera to the surgical site, the subjective signal strength and the subjective time to signal. However, there seems to be no relevant influence of these variables on the fluorescence intensity, shape of the perfusion curve and slopemax value.
An intraoperative ICG-NIRF perfusion visualization was performed following a standardized protocol based on empirical single-center experience, which specified the ICG dosing and time of assessment and allowed for data collection during visualization. However, in one case (patient 4), there was clinical need for an additional perfusion visualization prior to the time point defined by the protocol, due to suspected pedicular impairment during mobilization. Here, the dose of ICG was increased for the second visualization. This highlights the need for standardized and objective protocols for the use of ICG-NIRF. In this case, the increased dose is unlikely to affect the postoperative software-based assessment, as this is based on the shape of the perfusion curve over time rather than on the interpretation of fluorescence intensity. These limitations need to be addressed in larger, prospective trials in the future, using real-time assessment software.
The presented pixel-to-pixel analysis (
Figure 5) is a novel method of an automated perfusion assessment of the surgeon’s field of view. This method can visualize objective parameters, such as the fluorescence intensity over time and maximum or minimum slope under the perfusion curve.
The perfusion zones were determined to investigate different regions of vascularization (
Figure 6). The perfusion zone analysis offers the possibility of determining perfusion zones of anatomic interest (such as zones of a muscle flap with decreasing vascularization from pedicle base to tip). As we can see by comparing
Figure 3,
Figure 4 and
Figure 5 in correlation with the clinical outcome, the distribution of slopemax values across an anatomic area of interest may be more important to assess perfusion than fluorescence–time curves alone. Potentially, perfusion zone analysis can be performed for any individual surgical strategy and anatomic area of interest.
All aforementioned steps of the objective ICG-NIRF perfusion assessment can potentially be carried out in real-time, as the required time for calculation ranges from 1–5 min. We conducted this non-interventional retrospective study first in order to investigate its feasibility before altering procedures intraoperatively.
In this study, we present the feasibility of an ICG-NIRF perfusion visualization in GMI surgery. We further present, for the first time, a novel software-based multi-step approach for intraoperative real-time ICG-NIRF perfusion assessment and objective indicators of perfusion to potentially improve the clinical outcome in the future.


 ,
, 


