

Computer Aided COVID-19 Diagnosis in Pandemic Era Using CNN in Chest X-ray Images
 , ,
, ,  , ,
, ,
Abstract
:1. Introduction
- A new, well fine-tuned CNN architecture named COV-Net with fewer parameters is proposed to diagnose COVID-19 efficiently.
- Using edges exploitation operation in an optimized structure with the convolutional operator facilitates learning edges-related features of infection patterns in chest X-ray images. It leads to improved detection of COVID-19 in a timely manner.
- A D-HL-based framework for COVID-19 and pneumonia identification in chest X-ray images was proposed by using new deep CNN and SVM.
- We exploit the structural and empirical risk error minimization using the proposed COV-Net and ML classifier in hybrid learning (HL) for COVID-19 analysis. In the proposed deep hybrid learning scheme, the learning capability of the proposed CNN is explored and ML classifiers are used to enhance the discrimination proficiency of the proposed framework for chest X-ray analysis.
2. Related Work
- Most of the work presented in the past has been assessed using only accuracy, but recall, precision, and F-score are better performance measures to evaluate the generalization of the model for the complex dataset.
- In most of the previous works, only COVID-19 detection is performed. However, simply detecting COVID-19 is insufficient to diagnose other severe abnormalities, e.g., pneumonia.
- In COVID-19 analysis, the detection rate of infected X-ray images from normal individuals is still challenging because of fewer inter-class variations.
3. Methods and Materials
3.1. Dataset
3.2. Data Augmentation
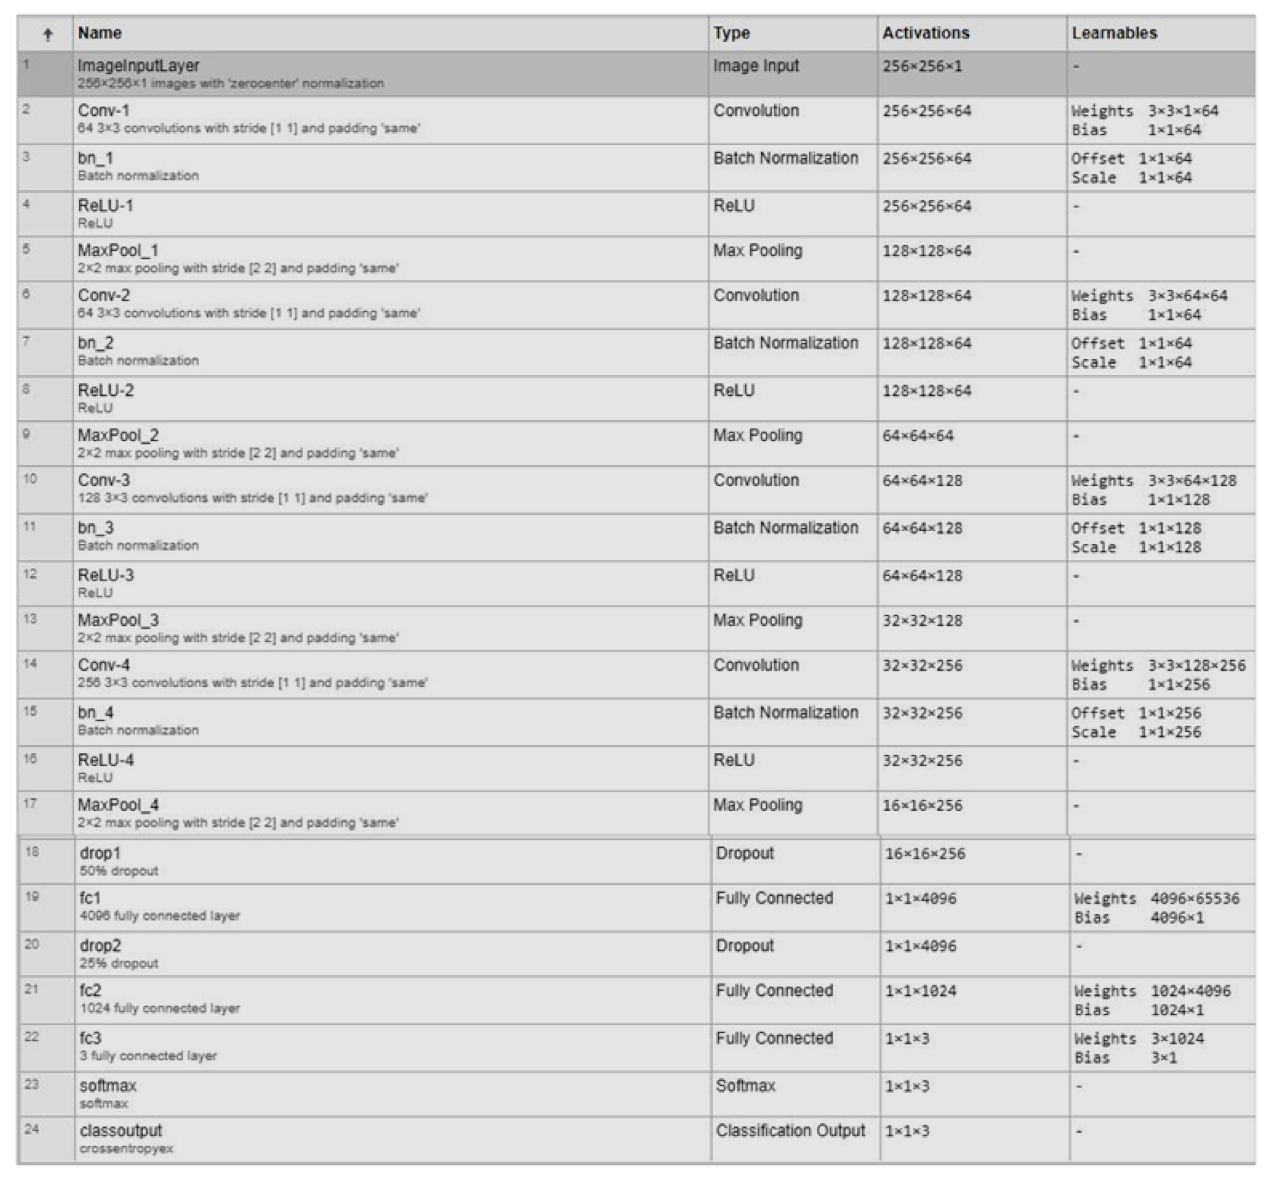
3.3. Proposed CNN Architecture
3.4. Implementation Details
3.5. Initial Training
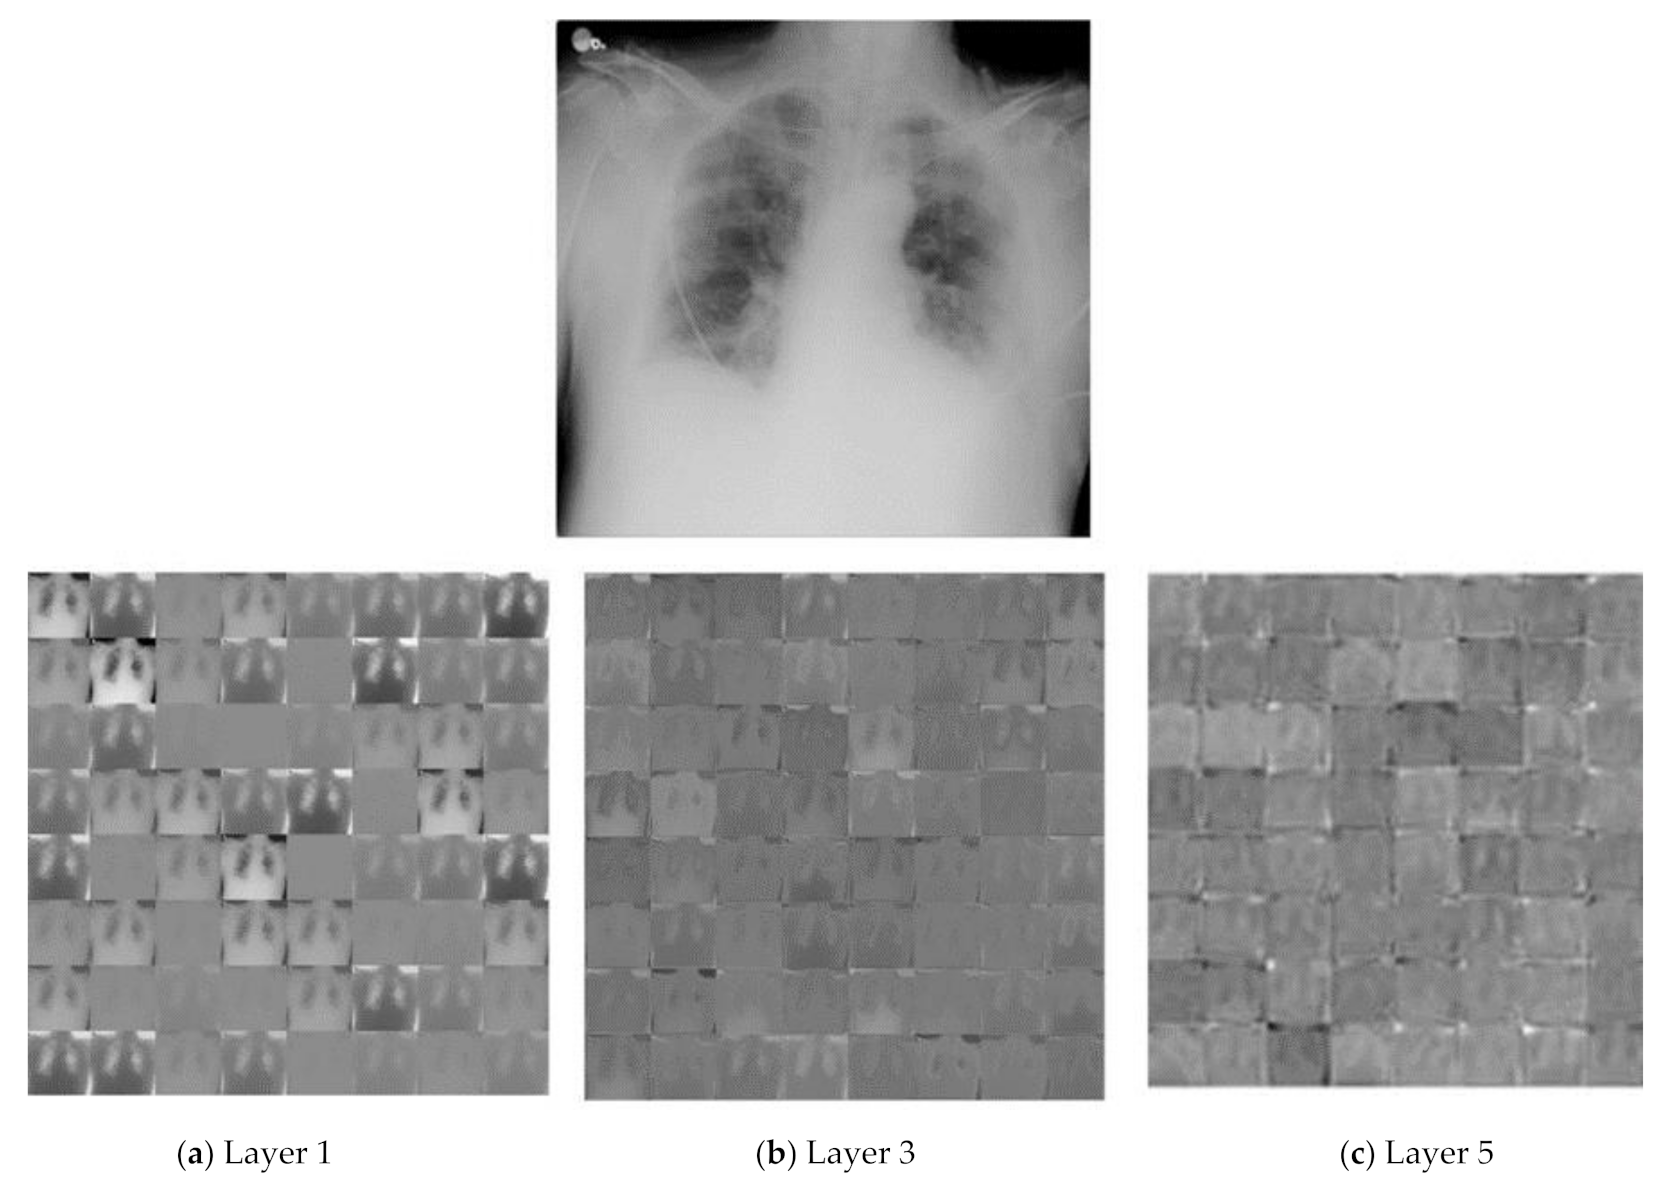
3.6. Feature Extraction Using Proposed CNN Architecture
- (a)
- As we go to the higher layer, activation started to keep fewer data.
- (b)
- At a deep level, the information became more detailed.
3.7. Classification Using Conventional ML Classifiers
3.7.1. SVM
3.7.2. k_NN
3.7.3. Naïve Bayes
3.7.4. Random Forest
3.8. Performance Metrics
3.8.1. Precision
3.8.2. Recall
3.8.3. Accuracy
3.8.4. F-Score
4. Results
5. Discussion
6. Conclusions
Author Contributions
Funding
Institutional Review Board Statement
Informed Consent Statement
Data Availability Statement
Acknowledgments
Conflicts of Interest
References
- Roosa, K.; Lee, Y.; Luo, R.; Kirpich, A.; Rothenberg, R.; Hyman, J.; Yan, P.; Chowell, G. Real-time forecasts of the COVID-19 epidemic in China from February 5th to February 24th, 2020. Infect. Dis. Model. 2020, 5, 256–263. [Google Scholar] [CrossRef] [PubMed]
- Coronaviridae Study Group of the International Committee on Taxonomy of Viruses. The species Severe acute respiratory syndrome-related coronavirus: Classifying 2019-nCoV and naming it SARS-CoV-2. Nat. Microbiol. 2020, 5, 536–544. [Google Scholar] [CrossRef] [PubMed] [Green Version]
- Rabaan, A.A.; Al-Ahmed, S.H.; Haque, S.; Sah, R.; Tiwari, R.; Malik, Y.S.; Dhama, K.; Yatoo, M.I.; Bonilla-Aldana, D.K.; Rodriguez-Morales, A.J. SARS-CoV-2, SARS-CoV, and MERS-COV: A comparative overview. Infez. Med. 2020, 28, 174–184. [Google Scholar] [PubMed]
- Evans, R. European Centre for Disease Prevention and Control. Nurs. Stand. 2014, 29, 30. [Google Scholar] [CrossRef] [PubMed] [Green Version]
- Ren, L.-L.; Wang, Y.-M.; Wu, Z.-Q.; Xiang, Z.-C.; Guo, L.; Xu, T.; Jiang, Y.-Z.; Xiong, Y.; Li, Y.-J.; Li, X.-W.; et al. Identification of a novel coronavirus causing severe pneumonia in human: A descriptive study. Chin. Med. J. 2020, 133, 1015–1024. [Google Scholar] [CrossRef] [PubMed]
- Wan, Z.; Zhang, Y.; He, Z.; Liu, J.; Lan, K.; Hu, Y.; Zhang, C. A Melting Curve-Based Multiplex RT-qPCR Assay for Simultaneous Detection of Four Human Coronaviruses. Int. J. Mol. Sci. 2016, 17, 1880. [Google Scholar] [CrossRef] [Green Version]
- Khan, A.; Khan, S.H.; Saif, M.; Batool, A.; Sohail, A.; Khan, M.W. A Survey of Deep Learning Techniques for the Analysis of COVID-19 and their usability for Detecting Omicron. arXiv 2022, arXiv:2202.06372. [Google Scholar]
- He, J.-L.; Luo, L.; Luo, Z.-D.; Lyu, J.-X.; Ng, M.-Y.; Shen, X.-P.; Wen, Z. Diagnostic performance between CT and initial real-time RT-PCR for clinically suspected 2019 coronavirus disease (COVID-19) patients outside Wuhan, China. Respir. Med. 2020, 168, 105980. [Google Scholar] [CrossRef] [PubMed]
- Palagi, L.; Pesyridis, A.; Sciubba, E.; Tocci, L. Machine Learning for the prediction of the dynamic behavior of a small scale ORC system. Energy 2019, 166, 72–82. [Google Scholar] [CrossRef]
- Zahoor, M.M.; Qureshi, S.A.; Bibi, S.; Khan, S.H.; Khan, A.; Ghafoor, U.; Bhutta, M.R. A New Deep Hybrid Boosted and Ensemble Learning-Based Brain Tumor Analysis Using MRI. Sensors 2022, 22, 2726. [Google Scholar] [CrossRef] [PubMed]
- Guo, Y.; Liu, Y.; Oerlemans, A.; Lao, S.; Wu, S.; Lew, M.S. Deep learning for visual understanding: A review. Neurocomputing 2016, 187, 27–48. [Google Scholar] [CrossRef]
- Zahoor, M.M.; Qureshi, S.A.; Khan, A.; Rehman, A.U.; Rafique, M. A novel dual-channel brain tumor detection system for MR images using dynamic and static features with conventional machine learning techniques. Waves Random Complex Media 2022, 1–20. [Google Scholar] [CrossRef]
- Li, L.; Qin, L.; Xu, Z.; Yin, Y.; Wang, X.; Kong, B.; Bai, J.; Lu, Y.; Fang, Z.; Song, Q.; et al. Using artificial intelligence to detect COVID-19 and community-acquired pneumonia based on pulmonary CT: Evaluation of the diagnostic accuracy. Radiology 2020, 296, E65–E71. [Google Scholar] [CrossRef] [PubMed]
- Xu, X.; Jiang, X.; Ma, C.; Du, P.; Li, X.; Lv, S.; Yu, L.; Chen, Y.; Su, J.; Lang, G. Deep Learning System to Screen novel Coronavirus Disease 2019 Pneumonia. Engineering 2020, 6, 1122–1129. [Google Scholar] [CrossRef] [PubMed]
- Ghoshal, B.; Tucker, A. Estimating Uncertainty and Interpretability in Deep Learning for Coronavirus (COVID-19) Detection. arXiv 2020, arXiv:2003.10769. [Google Scholar]
- Wang, S.; Kang, B.; Ma, J.; Zeng, X.; Xiao, M.; Guo, J.; Cai, M.; Yang, J.; Li, Y.; Meng, X.; et al. A deep learning algorithm using CT images to screen for Corona Virus Disease (COVID-19). Eur. Radiol. 2021, 31, 6096–6104. [Google Scholar] [CrossRef]
- Jin, C.; Chen, W.; Cao, Y.; Xu, Z.; Tan, Z.; Zhang, X.; Deng, L.; Zheng, C.; Zhou, J.; Shi, H.; et al. Development and evaluation of an artificial intelligence system for COVID-19 diagnosis. Nat. Commun. 2020, 11, 5088. [Google Scholar] [CrossRef]
- Jin, S.; Wang, B.; Xu, H.; Luo, C.; Wei, L.; Zhao, W.; Hou, X.; Ma, W.; Xu, Z.; Zheng, Z.; et al. AI-assisted CT imaging analysis for COVID-19 screening: Building and deploying a medical AI system in four weeks. medRxiv 2020. [Google Scholar] [CrossRef] [Green Version]
- Narin, A.; Kaya, C.; Pamuk, Z. Automatic detection of coronavirus disease (COVID-19) using X-ray images and deep convolutional neural networks. Pattern Anal. Appl. 2021, 24, 1207–1220. [Google Scholar] [CrossRef]
- Wang, L.; Lin, Z.Q.; Wong, A. COVID-Net: A tailored deep convolutional neural network design for detection of COVID-19 cases from chest X-ray images. Sci. Rep. 2020, 10, 19549. [Google Scholar] [CrossRef]
- Mohammed, M.A.; Abdulkareem, K.; Garcia-Zapirain, B.; Mostafa, S.A.; Maashi, M.S.; Al-Waisy, A.S.; Subhi, M.A.; Mutlag, A.A.; Le, D.-N. A Comprehensive Investigation of Machine Learning Feature Extraction and Classification Methods for Automated Diagnosis of COVID-19 Based on X-Ray Images. Comput. Mater. Contin. 2021, 66, 3289–3310. [Google Scholar] [CrossRef]
- El-Din Hemdan, E.; Shouman, M.A.; Karar, M.E. COVIDX-Net: A Framework of Deep Learning Classifiers to Diagnose COVID-19 in X-Ray Images. arXiv 2020, arXiv:2003.11055. [Google Scholar]
- Chowdhury, M.E.H.; Rahman, T.; Khandakar, A.; Mazhar, R.; Kadir, M.A.; Bin Mahbub, Z.; Islam, K.R.; Khan, M.S.; Iqbal, A.; Al Emadi, N.; et al. Can AI Help in Screening Viral and COVID-19 Pneumonia? IEEE Access 2020, 8, 132665–132676. [Google Scholar] [CrossRef]
- Maghdid, H.S.; Asaad, A.T.; Ghafoor, K.Z.G.; Sadiq, A.S.; Mirjalili, S.; Khan, M.K.K. Diagnosing COVID-19 pneumonia from x-ray and CT images using deep learning and transfer learning algorithms. In Proceedings of the Multimodal Image Exploitation and Learning 2021, Online, 12–17 April 2021; p. 26. [Google Scholar] [CrossRef]
- Nour, M.; Cömert, Z.; Polat, K. A Novel Medical Diagnosis model for COVID-19 infection detection based on Deep Features and Bayesian Optimization. Appl. Soft Comput. 2020, 97, 106580. [Google Scholar] [CrossRef]
- Rahman, T.; Chowdhury, M.E.H.; Khandakar, A.; Islam, K.R.; Mahbub, Z.B.; Kadir, M.A.; Kashem, S. Transfer Learning with Deep Convolutional Neural Network (CNN) for Pneumonia Detection Using Chest X-ray. Appl. Sci. 2020, 10, 3233. [Google Scholar] [CrossRef]
- Loey, M.; Smarandache, F.; Khalifa, N.E.M. Within the Lack of Chest COVID-19 X-ray Dataset: A Novel Detection Model Based on GAN and Deep Transfer Learning. Symmetry 2020, 12, 651. [Google Scholar] [CrossRef] [Green Version]
- Degerli, A.; Ahishali, M.; Yamac, M.; Kiranyaz, S.; Chowdhury, M.E.H.; Hameed, K.; Hamid, T.; Mazhar, R.; Gabbouj, M. COVID-19 infection map generation and detection from chest X-ray images. Health Inf. Sci. Syst. 2021, 9, 15. [Google Scholar] [CrossRef]
- Alirr, O.I. Automatic deep learning system for COVID-19 infection quantification in chest CT. arXiv 2020, arXiv:2010.01982. [Google Scholar] [CrossRef]
- Rahman, T.; Chowdhury, M.; Khandakar, A. COVID-19 Radiography Database. Kaggle. Available online: https://www.kaggle.com/datasets/tawsifurrahman/covid19-radiography-database (accessed on 11 October 2022).
- Perez, L.; Wang, J. The Effectiveness of Data Augmentation in Image Classification using Deep Learning. arXiv 2017, arXiv:171204621. [Google Scholar]
- Reddi, S.J.; Kale, S.; Kumar, S. On the Convergence of Adam and Beyond. arXiv 2019, arXiv:1904.09237. [Google Scholar]
- Manthiramoorthi, M.; Mani, M.; Murthy, A.G. Application of Pareto’s Principle on Deep Learning Research Output: A Scientometric Analysis. In Proceedings of the International Conference on Machine Learning and Smart Technology–ICMLST, Chennai, India, 2021; Available online: https://www.researchgate.net/profile/Ganesa-Murthy-Arasakumar/publication/355753261_Application_of_Pareto’s_Principle_on_Deep_Learning_Research_Output_A_Scientometric_Analysis/links/617c1b213c987366c300002b/Application-of-Paretos-Principle-on-Deep-Learning-Research-Output-A-Scientometric-Analysis.pdf (accessed on 11 October 2022).
- Alpaydın, E. Machine Learning Textbook: Introduction to Machine Learning; MIT Press: Cambridge, MA, USA, 2020. [Google Scholar]
- Guo, G.; Wang, H.; Bell, D.; Bi, Y.; Greer, K. KNN Model-Based Approach in Classification. In Proceedings of the OTM 2003: On the Move to Meaningful Internet Systems 2003: CoopIS DOA, and ODBASE, Catania, Italy, 3–7 November 2003; Lecture Notes in Computer Science. Springer: Berlin/Heidelberg, Germany, 2003; Volume 2888, pp. 986–996. [Google Scholar] [CrossRef]
- Breiman, L. Random forests. Mach. Lang. 2001, 45, 5–32. [Google Scholar]
- Diebold, F.X.; Mariano, R.S. Comparing Predictive Accuracy. J. Bus. Econ. Stat. 2002, 20, 134–144. [Google Scholar] [CrossRef]
- Buckland, M.; Gey, F. The relationship between recall and precision. J. Am. Soc. Inf. Sci. 1994, 45, 12–19. [Google Scholar] [CrossRef]
- Sokolova, M.; Japkowicz, N.; Szpakowicz, S. Beyond Accuracy, F-Score and ROC: A Family of Discriminant Measures for Performance Evaluation. In Proceedings of the AI 2006: Advances in Artificial Intelligence, Hobart, Australia, 4–8 December 2006; pp. 1015–1021. [Google Scholar]
- Apostolopoulos, I.D.; Mpesiana, T.A. Covid-19: Automatic detection from X-ray images utilizing transfer learning with convolutional neural networks. Phys. Eng. Sci. Med. 2020, 43, 635–640. [Google Scholar] [CrossRef]
- Khan, S.S.; Khoshbakhtian, F.; Ashraf, A.B. Anomaly Detection Approach to Identify Early Cases in a Pandemic using Chest X-rays. arXiv 2021, arXiv:2010.02814. [Google Scholar] [CrossRef]
- Kumar, R.; Arora, R.; Bansal, V.; Sahayasheela, V.J.; Buckchash, H.; Imran, J.; Narayanan, N.; Pandian, G.N.; Raman, B. Classification of COVID-19 from chest x-ray images using deep features and correlation coefficient. Multimed. Tools Appl. 2022, 81, 27631–27655. [Google Scholar] [CrossRef] [PubMed]
- Makris, A.; Kontopoulos, I.; Tserpes, K. COVID-19 detection from chest X-Ray images using Deep Learning and Convolutional Neural Networks. medRxiv 2020. [Google Scholar] [CrossRef]
- Irfan, M.; Iftikhar, M.; Yasin, S.; Draz, U.; Ali, T.; Hussain, S.; Bukhari, S.; Alwadie, A.; Rahman, S.; Glowacz, A.; et al. Role of Hybrid Deep Neural Networks (HDNNs), Computed Tomography, and Chest X-rays for the Detection of COVID-19. Int. J. Environ. Res. Public Health 2021, 18, 3056. [Google Scholar] [CrossRef]
- Arora, R.; Bansal, V.; Buckchash, H.; Kumar, R.; Sahayasheela, V.J.; Narayanan, N.; Pandian, G.N.; Raman, B. AI-based diagnosis of COVID-19 patients using X-ray scans with stochastic ensemble of CNNs. Phys. Eng. Sci. Med. 2021, 44, 1257–1271. [Google Scholar] [CrossRef]


| Parameters | Values |
|---|---|
| Random Rotation | [−5, 5] |
| Random Horizontal Translation | [−0.5, 1] |
| Random Vertical Translation | [−0.5, 1] |
| Features Layer | Feature Dimension |
|---|---|
| FC-1 | 1 × 1 × 4096 |
| Classifiers | Parameters | Type | TP | FP | FN | Recall (%) | Precision (%) | F1-Score (%) | Accuracy (%) |
|---|---|---|---|---|---|---|---|---|---|
| KNN | K = 2 | Cov | 60 | 0 | 0 | 100 | 100 | 100 | 100 |
| Pne | 60 | 0 | 0 | ||||||
| K = 3 | Cov | 60 | 0 | 0 | 100 | 100 | 100 | 100 | |
| Pne | 60 | 0 | 0 | ||||||
| K = 4 | Cov | 60 | 0 | 0 | 100 | 100 | 100 | 100 | |
| Pne | 60 | 0 | 0 | ||||||
| K = 5 | Cov | 59 | 1 | 0 | 99.2 | 99.2 | 99.2 | 99.2 | |
| Pne | 60 | 0 | 1 | ||||||
| SVM | Linear | Cov | 60 | 0 | 1 | 99.21 | 99.22 | 99.21 | 99.23 |
| Pne | 59 | 1 | 0 | ||||||
| RBF | Cov | 60 | 0 | 1 | 99.2 | 96.2 | 97.7 | 99.2 | |
| Pne | 59 | 1 | 0 | ||||||
| Gaussian | Cov | 60 | 0 | 1 | 99.2 | 99.2 | 99.2 | 99.2 | |
| Pne | 50 | 1 | 0 | ||||||
| PolyOrder-2 | Cov | 60 | 0 | 0 | 100 | 100 | 100 | 100 | |
| Pne | 60 | 0 | 0 | ||||||
| PolyOrder-3 | Cov | 60 | 0 | 1 | 99.2 | 99.2 | 99.2 | 99.2 | |
| Pne | 59 | 1 | 0 | ||||||
| PolyOrder-4 | Cov | 60 | 0 | 0 | 100 | 100 | 100 | 100 | |
| Pne | 60 | 0 | 0 | ||||||
| PolyOrder-5 | Cov | 60 | 0 | 0 | 100 | 100 | 100 | 100 | |
| Pne | 60 | 0 | 0 | ||||||
| Decision tree | Cov | 55 | 5 | 1 | 95 | 95.2 | 95.1 | 95.0 | |
| Pne | 59 | 1 | 5 | ||||||
| Naïve Bayes | Cov | 59 | 1 | 1 | 98.3 | 98.3 | 98.3 | 98.3 | |
| Pne | 59 | 1 | 1 | ||||||
| RF | max no. of splits 5 | Cov | 59 | 1 | 0 | 99.15 | 99.2 | 99.2 | 99.2 |
| Pne | 60 | 0 | 1 |
| Classifiers | Parameters | Type | TP | FP | FN | Recall (%) | Precision (%) | F1-Score (%) | Accuracy (%) |
|---|---|---|---|---|---|---|---|---|---|
| K-Nearest Neighbors | K = 2 | Cov | 56 | 4 | 5 | 92.2 | 92.2 | 92.2 | 92.2 |
| Pne | 56 | 4 | 4 | ||||||
| Nor | 54 | 6 | 5 | ||||||
| K = 3 | Cov | 56 | 3 | 3 | 93.3 | 93.3 | 93.3 | 93.3 | |
| Pne | 58 | 2 | 5 | ||||||
| Nor | 54 | 6 | 3 | ||||||
| K = 4 | Cov | 57 | 3 | 5 | 93.3 | 93.3 | 93.3 | 93.3 | |
| Pne | 58 | 2 | 4 | ||||||
| Nor | 53 | 7 | 3 | ||||||
| K = 5 | Cov | 53 | 7 | 3 | 92.2 | 92.4 | 92.3 | 92.2 | |
| Pne | 58 | 2 | 8 | ||||||
| Nor | 55 | 5 | 3 | ||||||
| Decision Tree | Cov | 50 | 10 | 11 | 81.1 | 81.1 | 81.1 | 81.1 | |
| Pne | 48 | 12 | 11 | ||||||
| Nor | 48 | 12 | 12 | ||||||
| Naïve Bayes | Cov | 57 | 3 | 6 | 92.2 | 92.3 | 92.2 | 92.2 | |
| Pne | 56 | 4 | 3 | ||||||
| Nor | 53 | 7 | 5 | ||||||
| Random Forest | max no. of splits 5 | Cov | 56 | 4 | 2 | 95 | 95.1 | 95.1 | 95.0 |
| Pne | 60 | 0 | 5 | ||||||
| Nor | 55 | 5 | 2 | ||||||
| SVM | Linear | Cov | 56 | 4 | 2 | 96.6 | 96.7 | 96.7 | 96.7 |
| Pne | 60 | 0 | 2 | ||||||
| Nor | 58 | 2 | 2 | ||||||
| Gaussian | Cov | 57 | 3 | 5 | 94.5 | 94.5 | 94.5 | 94.4 | |
| Pne | 58 | 2 | 3 | ||||||
| Nor | 55 | 5 | 2 | ||||||
| RBF | Cov | 56 | 4 | 5 | 93.9 | 93.9 | 93.9 | 93.9 | |
| Pne | 58 | 2 | 3 | ||||||
| Nor | 55 | 5 | 3 | ||||||
| Poly- Order3 | Cov | 57 | 3 | 3 | 95.6 | 95.6 | 95.6 | 95.6 | |
| Pne | 60 | 0 | 3 | ||||||
| Nor | 55 | 5 | 2 | ||||||
| Poly- Order4 | Cov | 57 | 3 | 3 | 95 | 95.1 | 95.03 | 95.0 | |
| Pne | 60 | 0 | 4 | ||||||
| Nor | 54 | 6 | 2 | ||||||
| Poly- Order5 | Cov | 56 | 4 | 3 | 94.43 | 94.5 | 94.5 | 94.4 | |
| Pne | 60 | 0 | 5 | ||||||
| Nor | 54 | 6 | 2 |
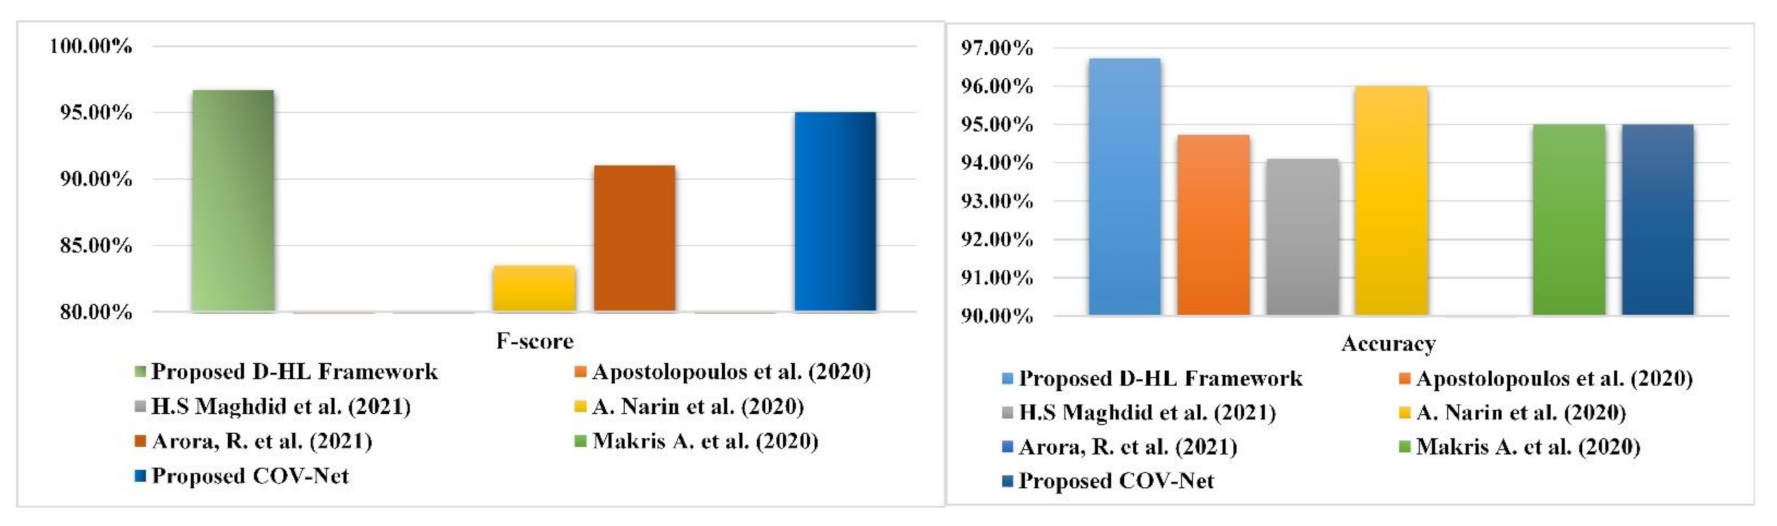
| Model | Recall | Precision | Accuracy | F-Score |
|---|---|---|---|---|
| Proposed COV-Net | 95.0% | 95.07% | 95.0% | 95.03% |
| Proposed D-HL-based Framework | 96.69% | 96.72% | 96.73% | 96.71% |
| Author | Methodology | Recall | Precision | Accuracy | F-score |
|---|---|---|---|---|---|
| Apostolopoulos et al. (2020) [40] | VGG19, MobileNet, Inception, Xception, Inception ResNet v2. | 98.6% | - | 94.72% | - |
| H.S Maghdid et al. (2021) [24] | Transfer learning with AlexNet model | 72% | - | 94.1% | - |
| A. Narin et al. (2020) [19] | Pre-trained CNN architectures: ResNet50, ResNet101, ResNet152, inception-ResNetV2 and InceptionV3 | 91.8% | 76.5% | 96% | 83.5% |
| Arora, R. et al. (2021) [45] | CNN architecture DenseNet & GoogleNet | 91% | - | - | 91% |
| Makris A. et al. (2020) [43] | 5 pre-trained CNNs | - | - | 95% | - |
| Proposed DH-L Framework | Proposed COV-Net with conventional ML classifier | 96.69% | 96.72% | 96.73% | 96.71% |
Publisher’s Note: MDPI stays neutral with regard to jurisdictional claims in published maps and institutional affiliations. |
© 2022 by the authors. Licensee MDPI, Basel, Switzerland. This article is an open access article distributed under the terms and conditions of the Creative Commons Attribution (CC BY) license (https://creativecommons.org/licenses/by/4.0/).
Share and Cite
Alqahtani, A.; Zahoor, M.M.; Nasrullah, R.; Fareed, A.; Cheema, A.A.; Shahrose, A.; Irfan, M.; Alqhatani, A.; Alsulami, A.A.; Zaffar, M.; et al. Computer Aided COVID-19 Diagnosis in Pandemic Era Using CNN in Chest X-ray Images. Life 2022, 12, 1709. https://doi.org/10.3390/life12111709
Alqahtani A, Zahoor MM, Nasrullah R, Fareed A, Cheema AA, Shahrose A, Irfan M, Alqhatani A, Alsulami AA, Zaffar M, et al. Computer Aided COVID-19 Diagnosis in Pandemic Era Using CNN in Chest X-ray Images. Life. 2022; 12(11):1709. https://doi.org/10.3390/life12111709
Chicago/Turabian StyleAlqahtani, Ali, Mirza Mumtaz Zahoor, Rimsha Nasrullah, Aqil Fareed, Ahmad Afzaal Cheema, Abdullah Shahrose, Muhammad Irfan, Abdulmajeed Alqhatani, Abdulaziz A. Alsulami, Maryam Zaffar, and et al. 2022. "Computer Aided COVID-19 Diagnosis in Pandemic Era Using CNN in Chest X-ray Images" Life 12, no. 11: 1709. https://doi.org/10.3390/life12111709