Article

Development and Testing of a High-Frequency Dynamometer for High-Speed Milling Process

1
School of Software Engineering, Jinling Institute of Technology, Nanjing 211169, China
2
College of Mechanical & Electrical Engineering, Nanjing University of Aeronautics and Astronautics, Nanjing 210016, China
3
Key Laboratory of High Efficiency and Clean Mechanical Manufacture, Ministry of Education, School of Mechanical Engineering, Shandong University, Jinan 250100, China
4
Department of Automated Mechanical Engineering, South Ural State University, Lenin Prosp. 76, 454080 Chelyabinsk, Russia
*
Authors to whom correspondence should be addressed.
Machines 2021, 9(1), 11; https://doi.org/10.3390/machines9010011
Submission received: 26 November 2020 / Revised: 5 January 2021 / Accepted: 8 January 2021 / Published: 12 January 2021
(This article belongs to the Special Issue Dynamic Analysis of Multibody Mechanical Systems)

Abstract

:
Cutting forces are strongly associated with the mechanics of the cutting process. Hence, machining forces measurements are very important to investigate the machining process, and numerous methods of cutting forces measurements have been applied. Nowadays, a dynamometer is the most popular tool for cutting forces measurements. However, the natural frequency of a dynamometer has a direct impact on the accuracy of measured cutting forces in the machining process. Therefore, few dynamometers are appropriate and reliable to measure the cutting forces at high frequencies. In this work, a new strain-gauge-based dynamometer (SGBD) with a special structure was designed, manufactured, and put to the test to ensure the measurement of high-frequency dynamic forces in the milling process. The main structure of the SGBD is symmetrical and mainly consists of a center quadrangular prism surrounded by four force sensing elastic elements, an upper support plate, and a lower support plate. The dynamic identification test was conducted and indicated that the SGBD′s natural frequency could be stabilized at a high value of 9.15 kHz. To automatically obtain the milling force data with a computer during high rotational speed milling, a data acquisition system was devised for the dynamometer. To reduce the effects of cross-sensitivity and acting point of force, an innovative model based on a conversion matrix was established for the dynamometer. Furthermore, the cutting tests were conducted at high rotational speeds (10,000–18,000 rpm), and it was found that the difference of cutting forces between the SGBD and a Kistler dynamometer are 2.3–5.8% in the X direction and 3.5–8.8% in the Y direction. The experimental findings disclosed that the new kind of dynamometer is reliably for the measurement of high-frequency dynamic forces in milling at high rotational speeds.

1. Introduction

Cutting forces are one of the most significant parameters for evaluating the metal cutting process [1]. The measurement of cutting force is therefore essential for investigating the cutting mechanism, calculating machine power, optimizing cutting parameters, as well as designing machine tools, fixtures, and cutting tools, etc. To date, there are many studies concerning the measurement of cutting force, and many dynamometers have been established for these purposes. There are several materials and methods are practiced in literature. For commercially available dynamometers, the most popular methods for measuring cutting force are using strain gauges fixed on flexible mechanical parts of the machining system or embedding piezoelectric based sensors into the machining system.
In addition to the commercial dynamometer, some new stain-gauge-based dynamometers (SGBDs) have been designed. Korkut [2] designed and constructed a strain gauge-based dynamometer capable of measuring three-force components during metal cutting. The dynamometer consists of four elastic octagonal rings, on which strain gauges were mounted, clamped between the upper and lower plates, forming a platform; by using a strain gauge and piezoelectric accelerometer, Yaldız et al. designed and developed a turning dynamometer that can measure static and dynamic cutting forces [3] and a milling dynamometer that can measure static and dynamic cutting forces and torque [4]. Rizal et al. [5] proposed an integrated rotating dynamometer with a strain gauge-based sensor and a newly designed force sensing element. Moreover, later, they developed an embedded multisensory system on the rotating dynamometer for real-time condition monitoring in milling [6]. Rathri et al. [7] designed a strain gauge type 3-axis milling tool dynamometer, which contains four octagonal ring members bonded with strain gauges. Qin et al. [8] developed a cutting force dynamometer for measuring axial force and torque in milling. The device is based on a semiconductor strain gauge that measures the deformation of the lantern-shape sensing element. Gomez et al. [9] proposed a new method of measuring cutting forces during milling using a flexure-based dynamometer. While the forces can be determined by structural deconvolution; meanwhile, some innovative piezoelectric-plate-based dynamometers (PPBDs) have been developed. By integrating piezoelectric force sensors, Kang et al. [10] designed a tool dynamometer for measuring the high-frequency cutting forces in high-speed micro-milling. In addition, Transchel et al. [11] proposed an effective dynamometer for measuring high dynamic process force signals in micromachining operations. Moreover, Totis et al. developed a rotating dynamometer for cutting force measurement in milling [12], a modular dynamometer for triaxial cutting force measurement in turning [13], and a plate dynamometer for advanced milling and drilling applications [14]. The above research work on the SGBDs and PPBDs provide effective methods and devices for the measurement of cutting force.
Generally, the machining system stiffness could be controlled by dynamometers. However, the frequency of the dynamometers should be as wide as possible for getting accurate measurements of dynamic cutting forces, which is because interrupted cutting conditions, chatter, and tool break may cause noise signals that are difficult to detect. In high-speed milling, the increase of rotational speed increases the frequency of the cutter tooth, which may be close to or even higher than the natural frequency of most force measurement systems (dynamometer fixed workpiece). In this case, measurement errors may be unavoidable. Castro et al. [15] developed a method to precise the dynamical force measurement using the frequency response function (FRF), which increased the bandwidth of the force transducer from 650 Hz to 4 kHz and permits to measure of the cutting forces at large frequency surpassing the bandwidth of the piezoelectric dynamometer used. Auchet et al. [16] developed an experimental approach to achieving the cutting forces in terms of voltages of the milling spindle’s magnetic bearings, which allowed cutting force measurement up to 4 kHz. Moreover, the widest bandwidth of other approaches could be found in [14] is 5 kHz. However, a conflict between the increasing exciting frequency of cutter tooth and limited natural frequency of force measurement system exists. For forces measurement in milling, the PPBD such as Kistler’s products are popularly used, but it will result in signal distortion due to its self-dynamic behavior [17]. Jullien-Corrigan et al. [18] proposed two new methods based on regularized deconvolution (RD) and sliding mode observer (SMO) to rectify the dynamic distortion of the high-frequency milling forces measured using piezoelectric dynamometers. The two methods can be applied for offline and online force estimation, respectively. Compared with SGBDs, the PPBDs are, however, more expensive, around 20:1 [3]. Then the SGBDs may be a good choice with no need for choosing the piezoelectric option.
The review presented above indicates that the SGBDs and PPBDs are both reliable methods for the measurement of cutting force, but the measurement results are inevitably affected by dynamic characteristics of the dynamometer, e.g., natural frequency, stiffness, etc. In this work, a new design for an SGBD with high natural frequency is provided. To conveniently obtain the milling force data with a computer during the high rotational speed milling process, a data acquisition system matched with the necessary hardware and software was also devised for this dynamometer. In addition, static calibration, dynamic identification, and milling tests were undertaken to verify the feasibility of the SGBD.
In the following sections, first, the materials and methods are explained. The new SGBD is designed and constructed in Section 3. The dynamometer calibration is conducted in Section 4. The implementation of the new SGBD is described in Section 5 by presenting the results of a set of experimental measurements.

2. Materials and Methods

A three-dimensional dynamic force dynamometer (SGBD) was used to measure the cutting forces during the milling process was designed and constructed. National Instruments (NI) is attached to a computer to acquire the data. The analog data of voltage signals can be assessed statistically and converted into force signals on a computer. Figure 1 illustrates the schematic depicting the milling force measurement system.

2.1. Preliminary Description of the SGBD

The designed and constructed SGBD is efficient in determining the cutting force in the feed direction (Fx), the cutting force perpendicular to the feed direction (Fy), and the cutting force in the axial direction (Fz). The main structure of the SGBD is symmetrical and consists mainly of a center quadrangular prism (quasi-rigid part) surrounded with four force sensing elastic elements (two thick elastic parts and a thin elastic part in the middle), an upper support plate, and a lower support plate, as shown in Figure 2. The main structure can be designed into a symmetrical one with the workpiece, which can avoid the influence of links between the workpiece and the upper support platform [19]. However, it will increase a large amount of experimental preparation for different materials, such as structural optimization, manufacture, and calibration. Therefore, it has been verified that defining the size of the workpiece and gluing it to the upper support plate is a suitable method for this kind of SGBD [20].
There are several communication systems available carrying multiple signals to transfer to a data acquisition system [21]. Four sets of strain gauges are mounted on the four thin elastic parts, as shown in Figure 3. Then these strain gauges were connected as in Figure 4, which is called Wheatstone bridge connections for Fx, Fy, and Fz. Fx and Fy can be obtained directly, and Fz can be calculated by the formula: Fz = (Fz1 + Fz2)/2.

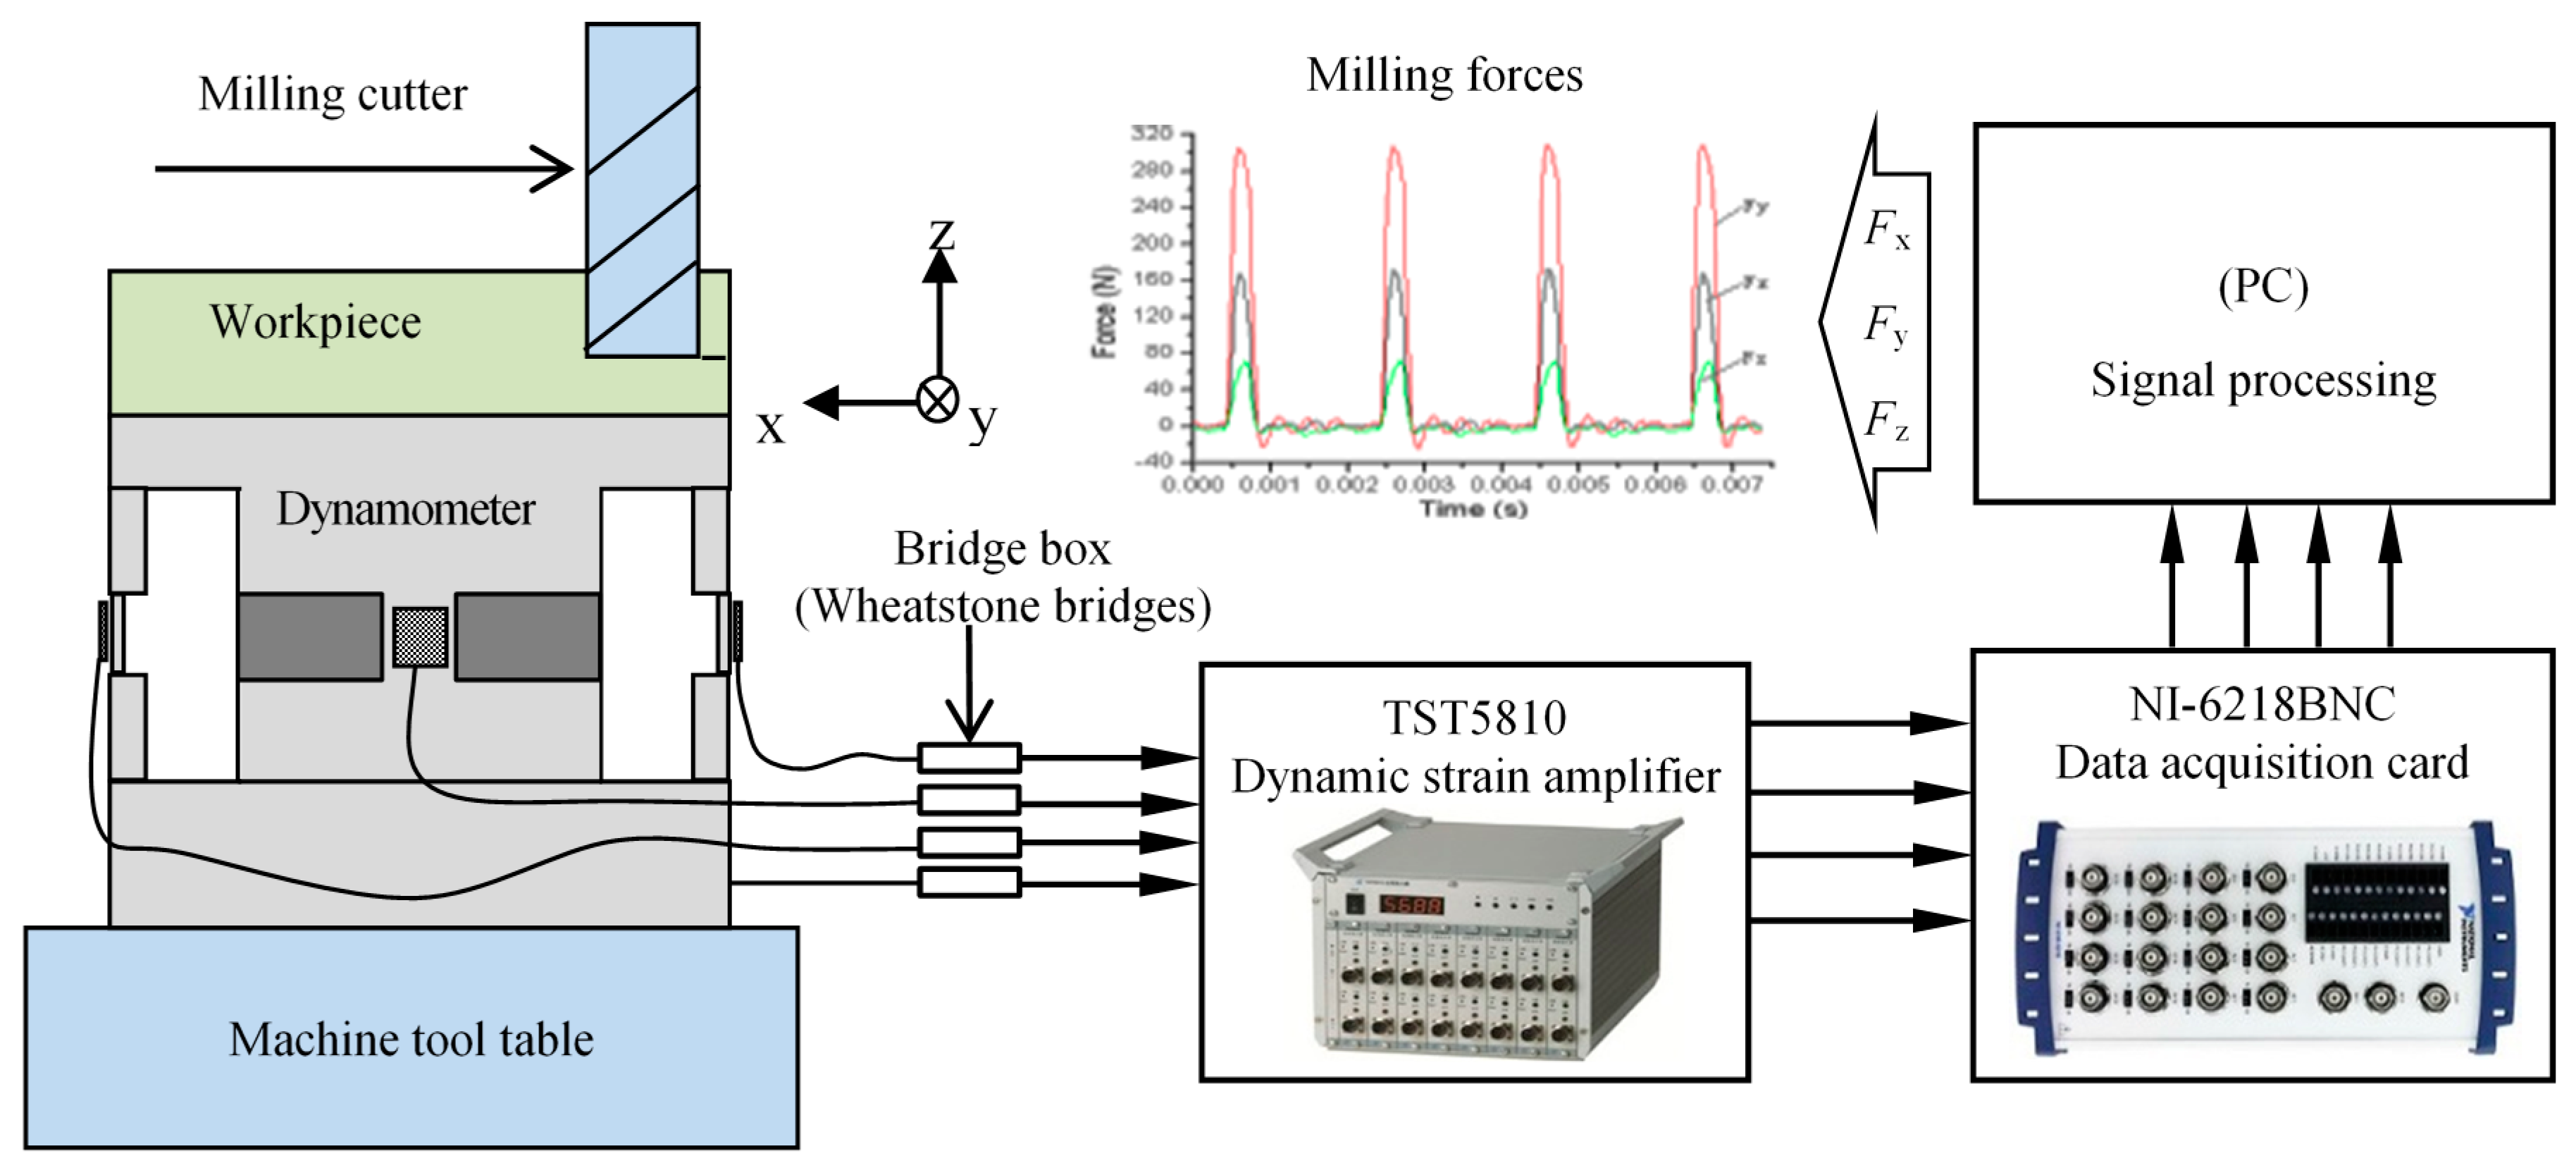
2.2. Setup of the Data Acquisition System

To interpret and store the cutting force data (strain signals) automatically, a data acquisition system with the essential hardware and software was developed and associated with the developed dynamometer. The high-speed communication system is very important to consider [22,23]. The main equipment used here is as follows (as shown in Figure 1): a TST5810 dynamic strain amplifier with signal amplifier function, a NI 6218BNC data acquisition card, and a personal computer. A self-developed software was utilized to convert the voltage signals (Vx, Vy, Vz) into force signals (Fx, Fy, Fz).

2.3. Basic Mythology for the Test

In this work, a static calibration test, dynamic identification test, and a milling test of the designed SGBD were conducted. First, the dynamometer was calibrated in three directions for Fx, Fy, and Fz under static loads conditions to establish the connection between the input and output data. All the loads were applied at the same point (center of each plane of the workpiece, e.g., plane XY in top view, plane YZ in the side view, and plane XZ in front view). Then, the load with a 40 N interval was applied (up to 160 N) in this calibration, and the corresponding strain values were recorded by the measurement system for each load interval.
Second, to verify the natural frequency of the designed dynamometer, the main structure of the SGBD was identified by a pulse test. Where the main structure was fixed on a machine tool table and excited using an impact hammer. Sixteen test points were selected on the surface of the upper support plate, and acceleration sensors were glued on the thin elastic parts in X, Y directions and the upper support plate in the Z direction, respectively. The signals were then acquired for the analysis of the amplitude and phase response function of the pulse.
Finally, milling tests at high rotational speeds (10,000 r/min–18,000 r/min) were carried out to verify the reliability of the designed dynamometer in the application. Then, the SGBD was fixed on a commercial dynamometer (Kistler 9265B), and then the Kistler was fixed on the machine tool table. The cutting conditions can be kept the same for both dynamometers at each round of the milling process. In the above tests, all of the measurements were conducted three times, and the average of three values was used for the analysis.

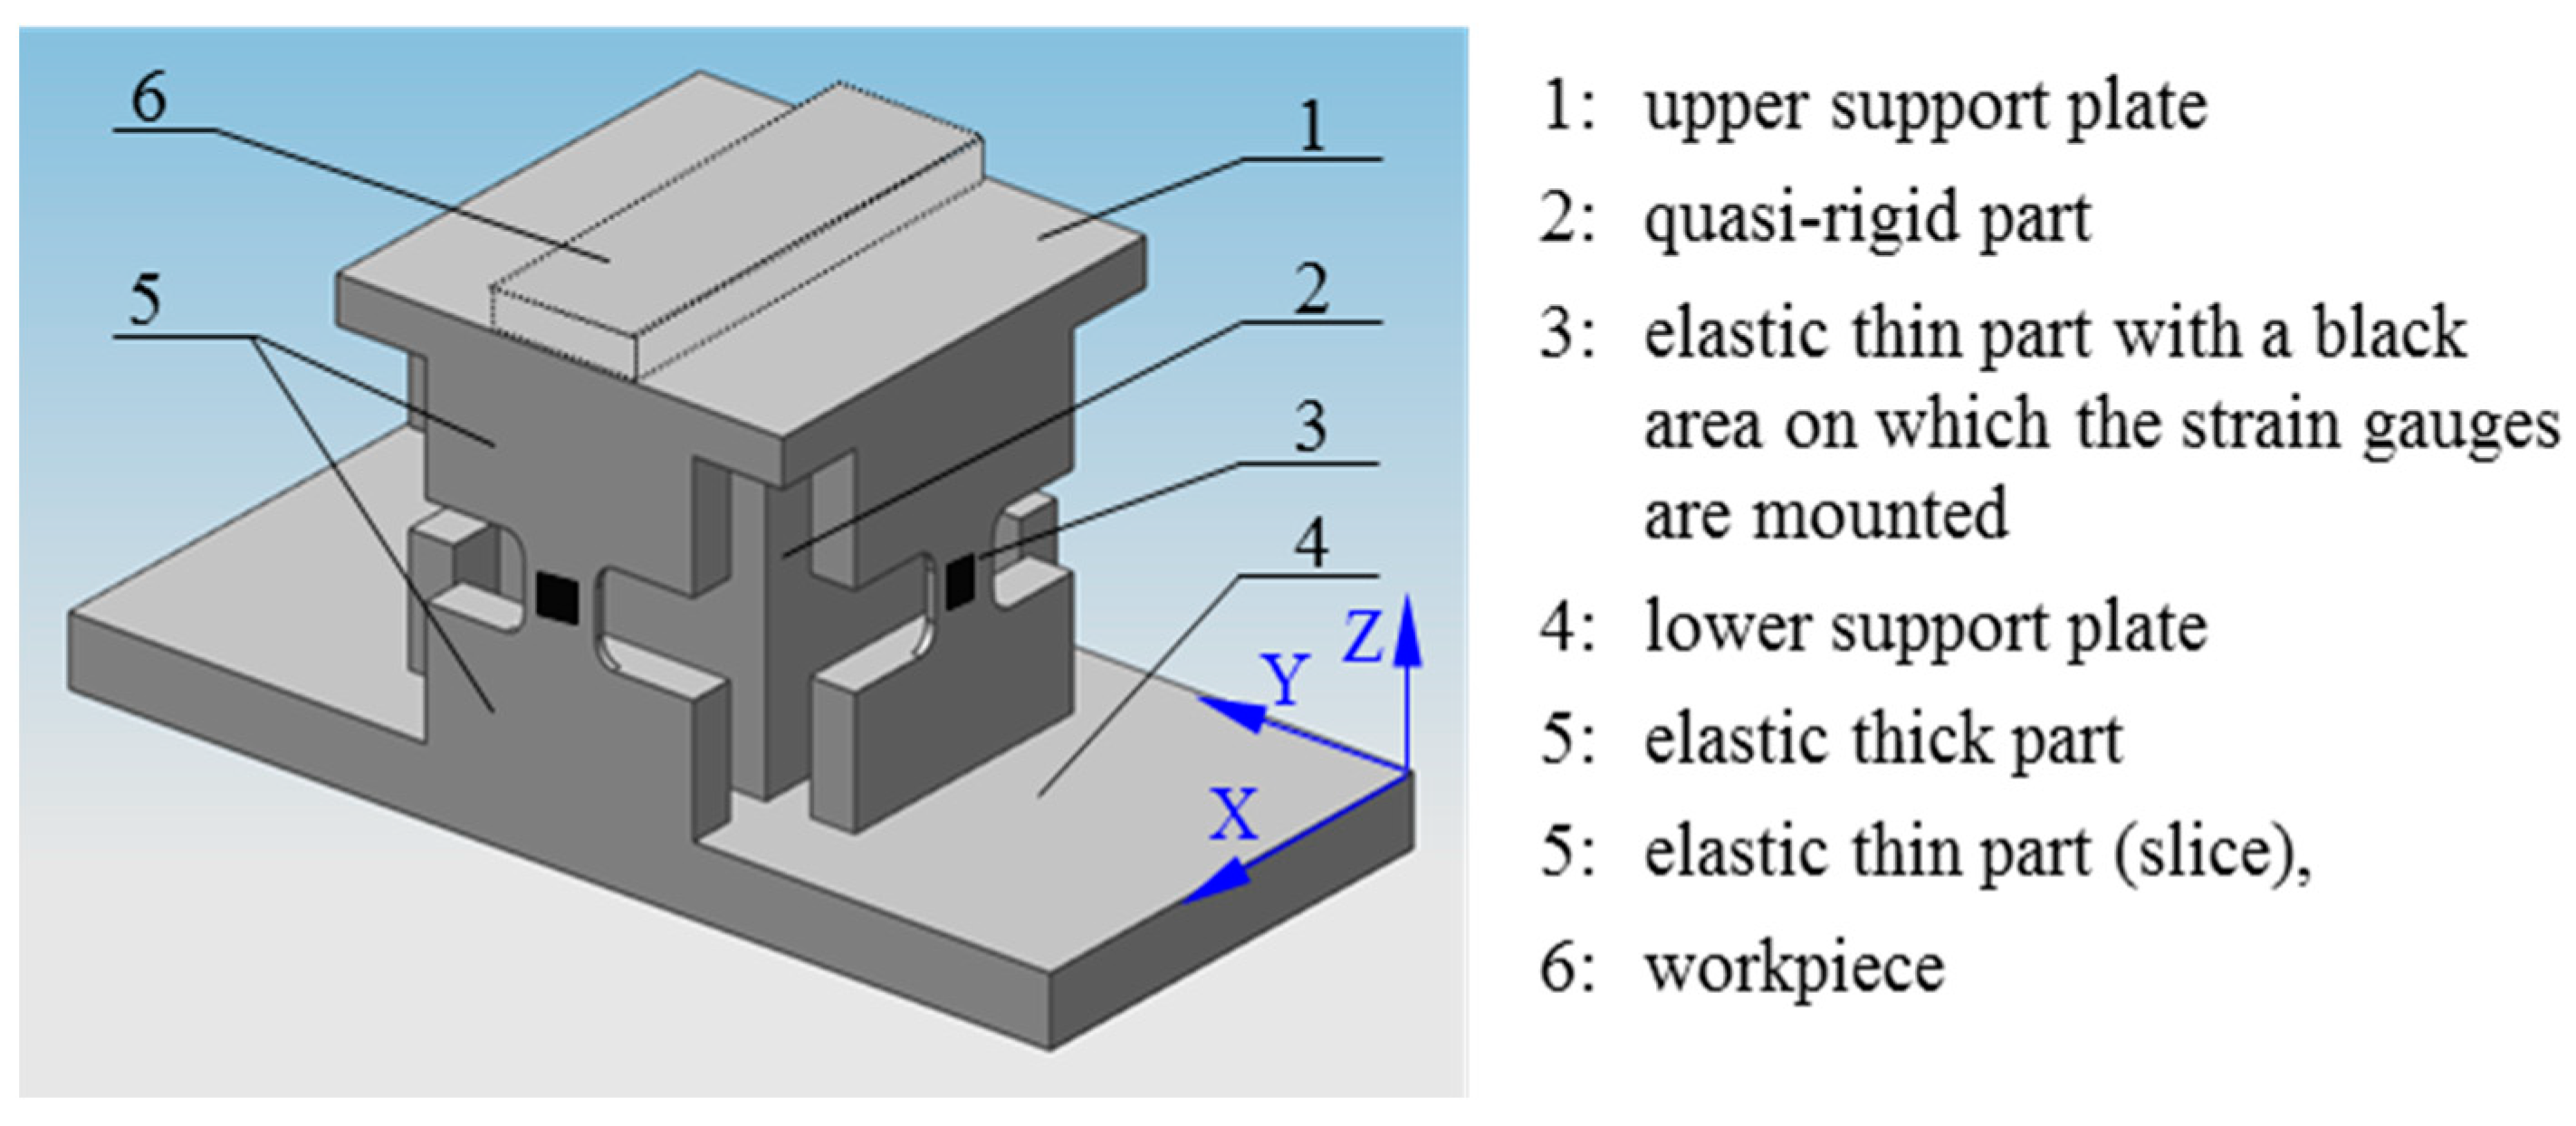
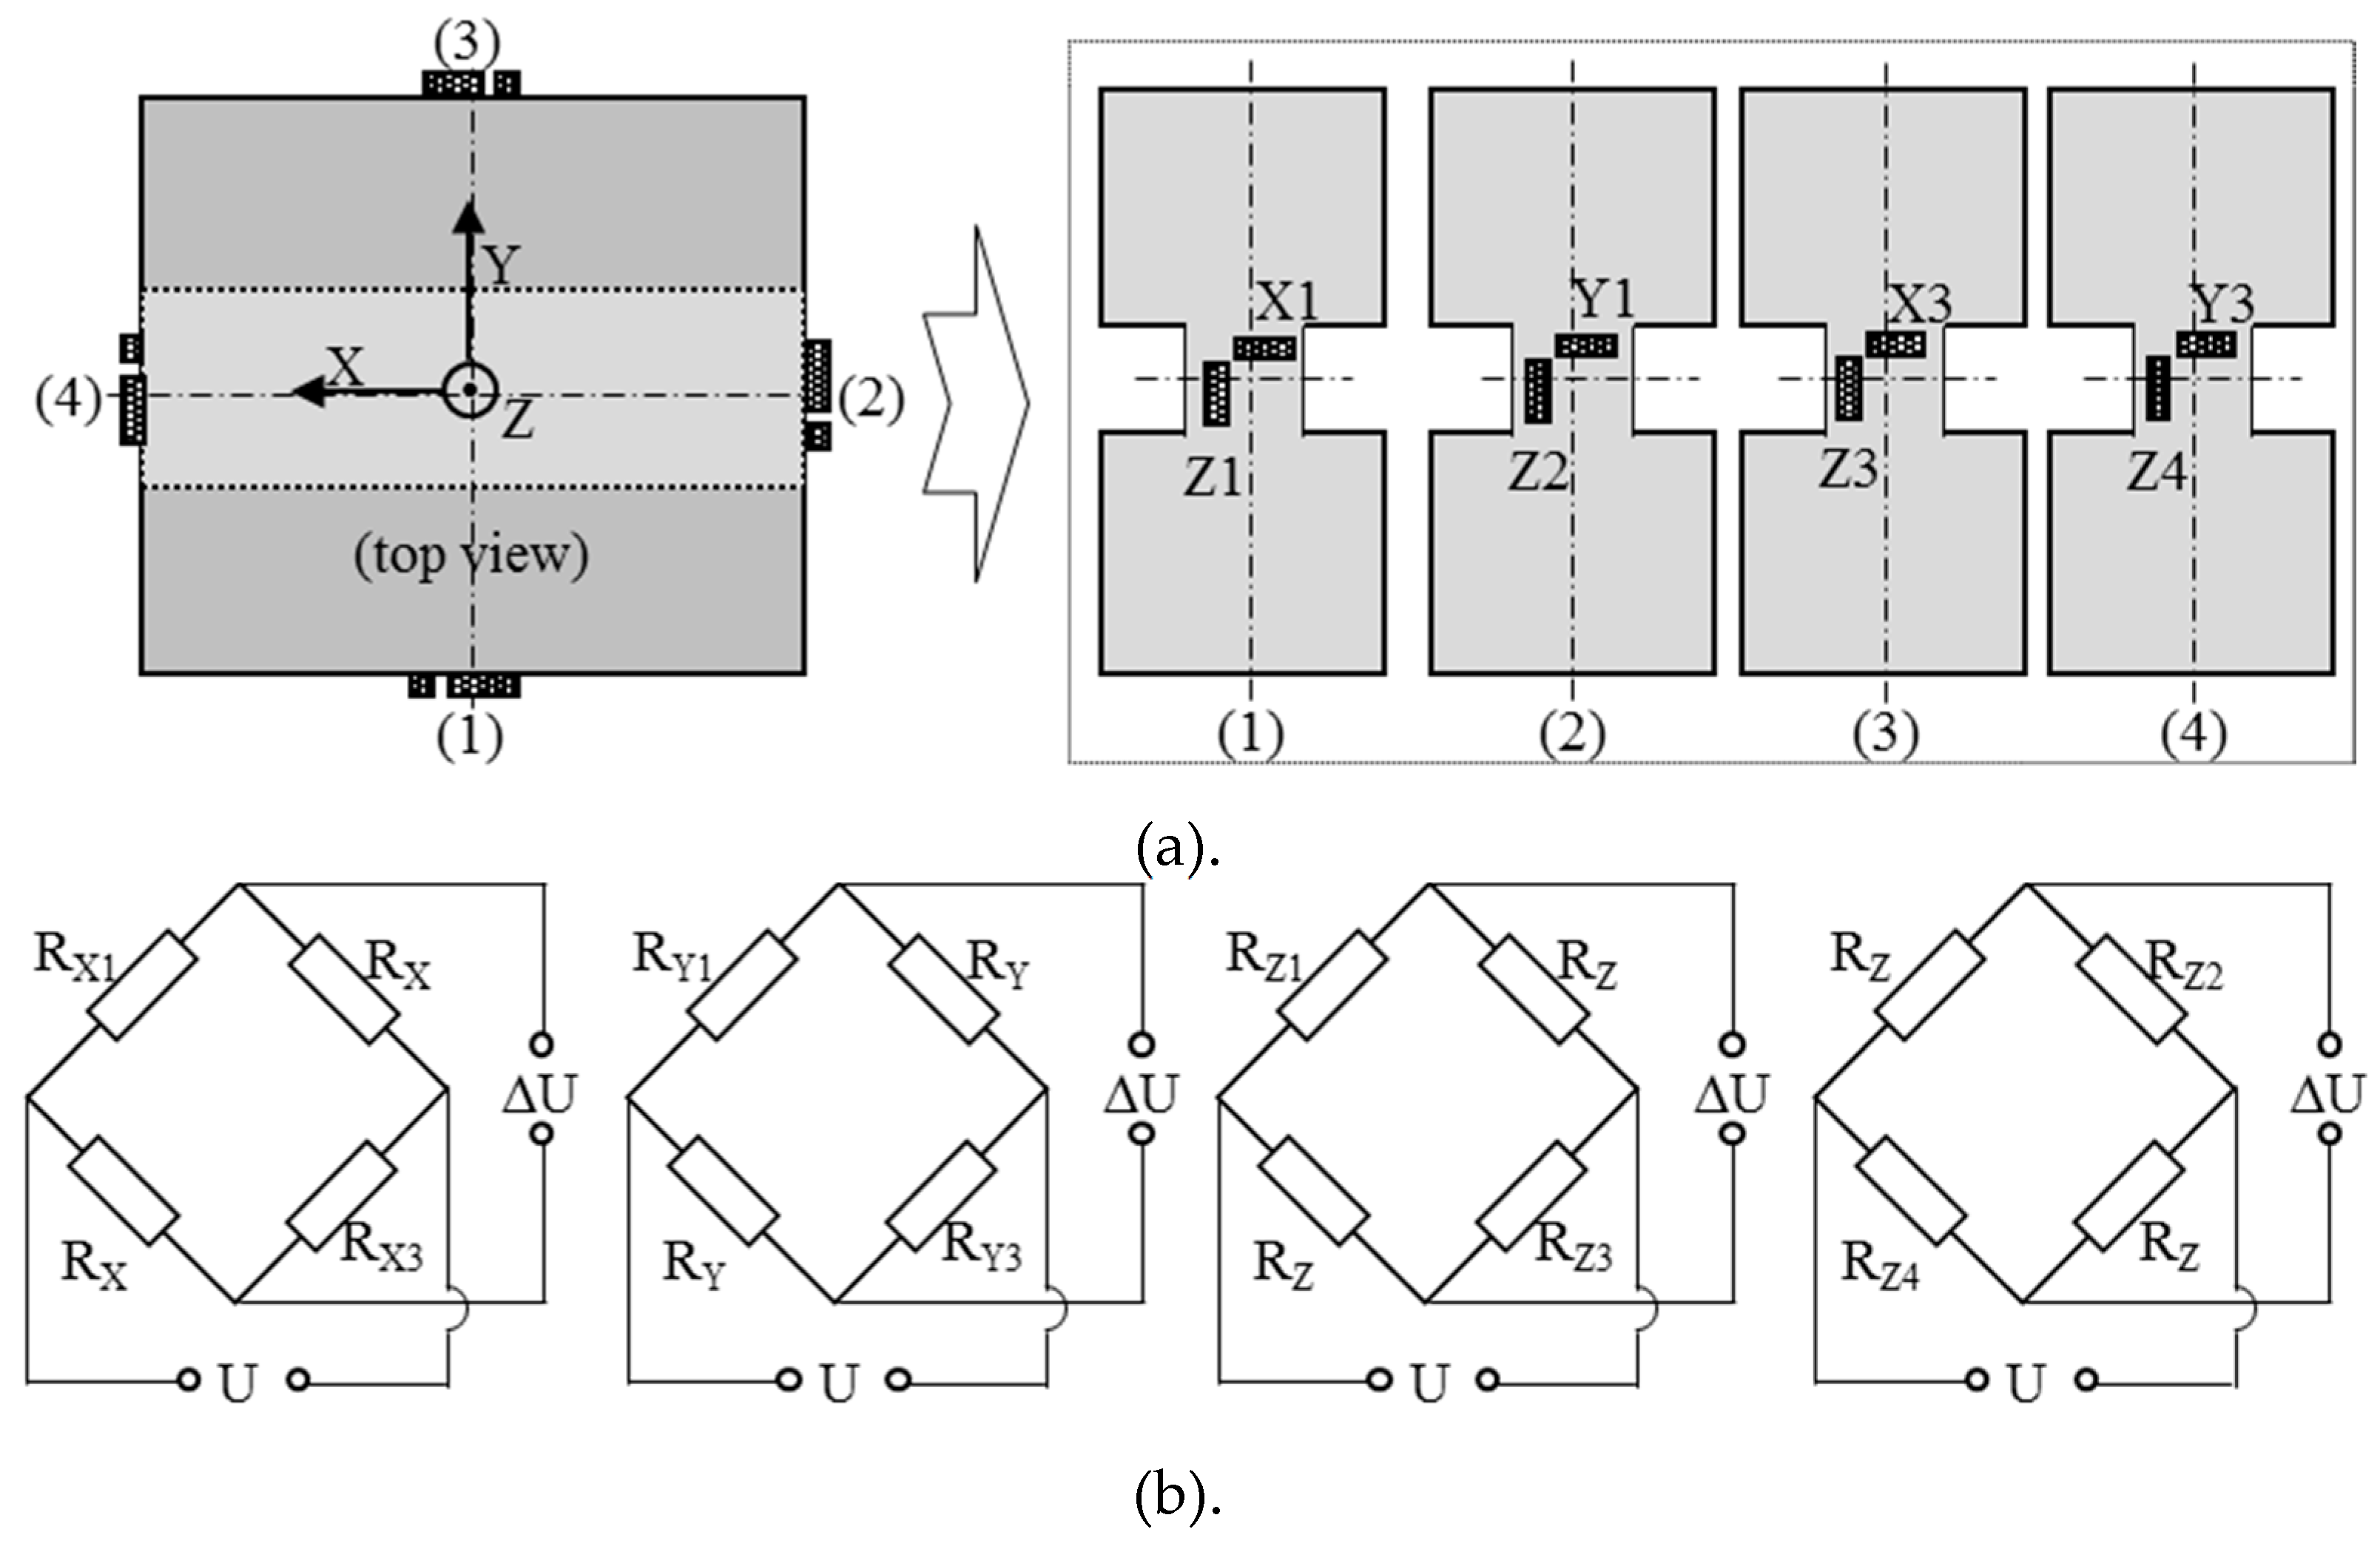
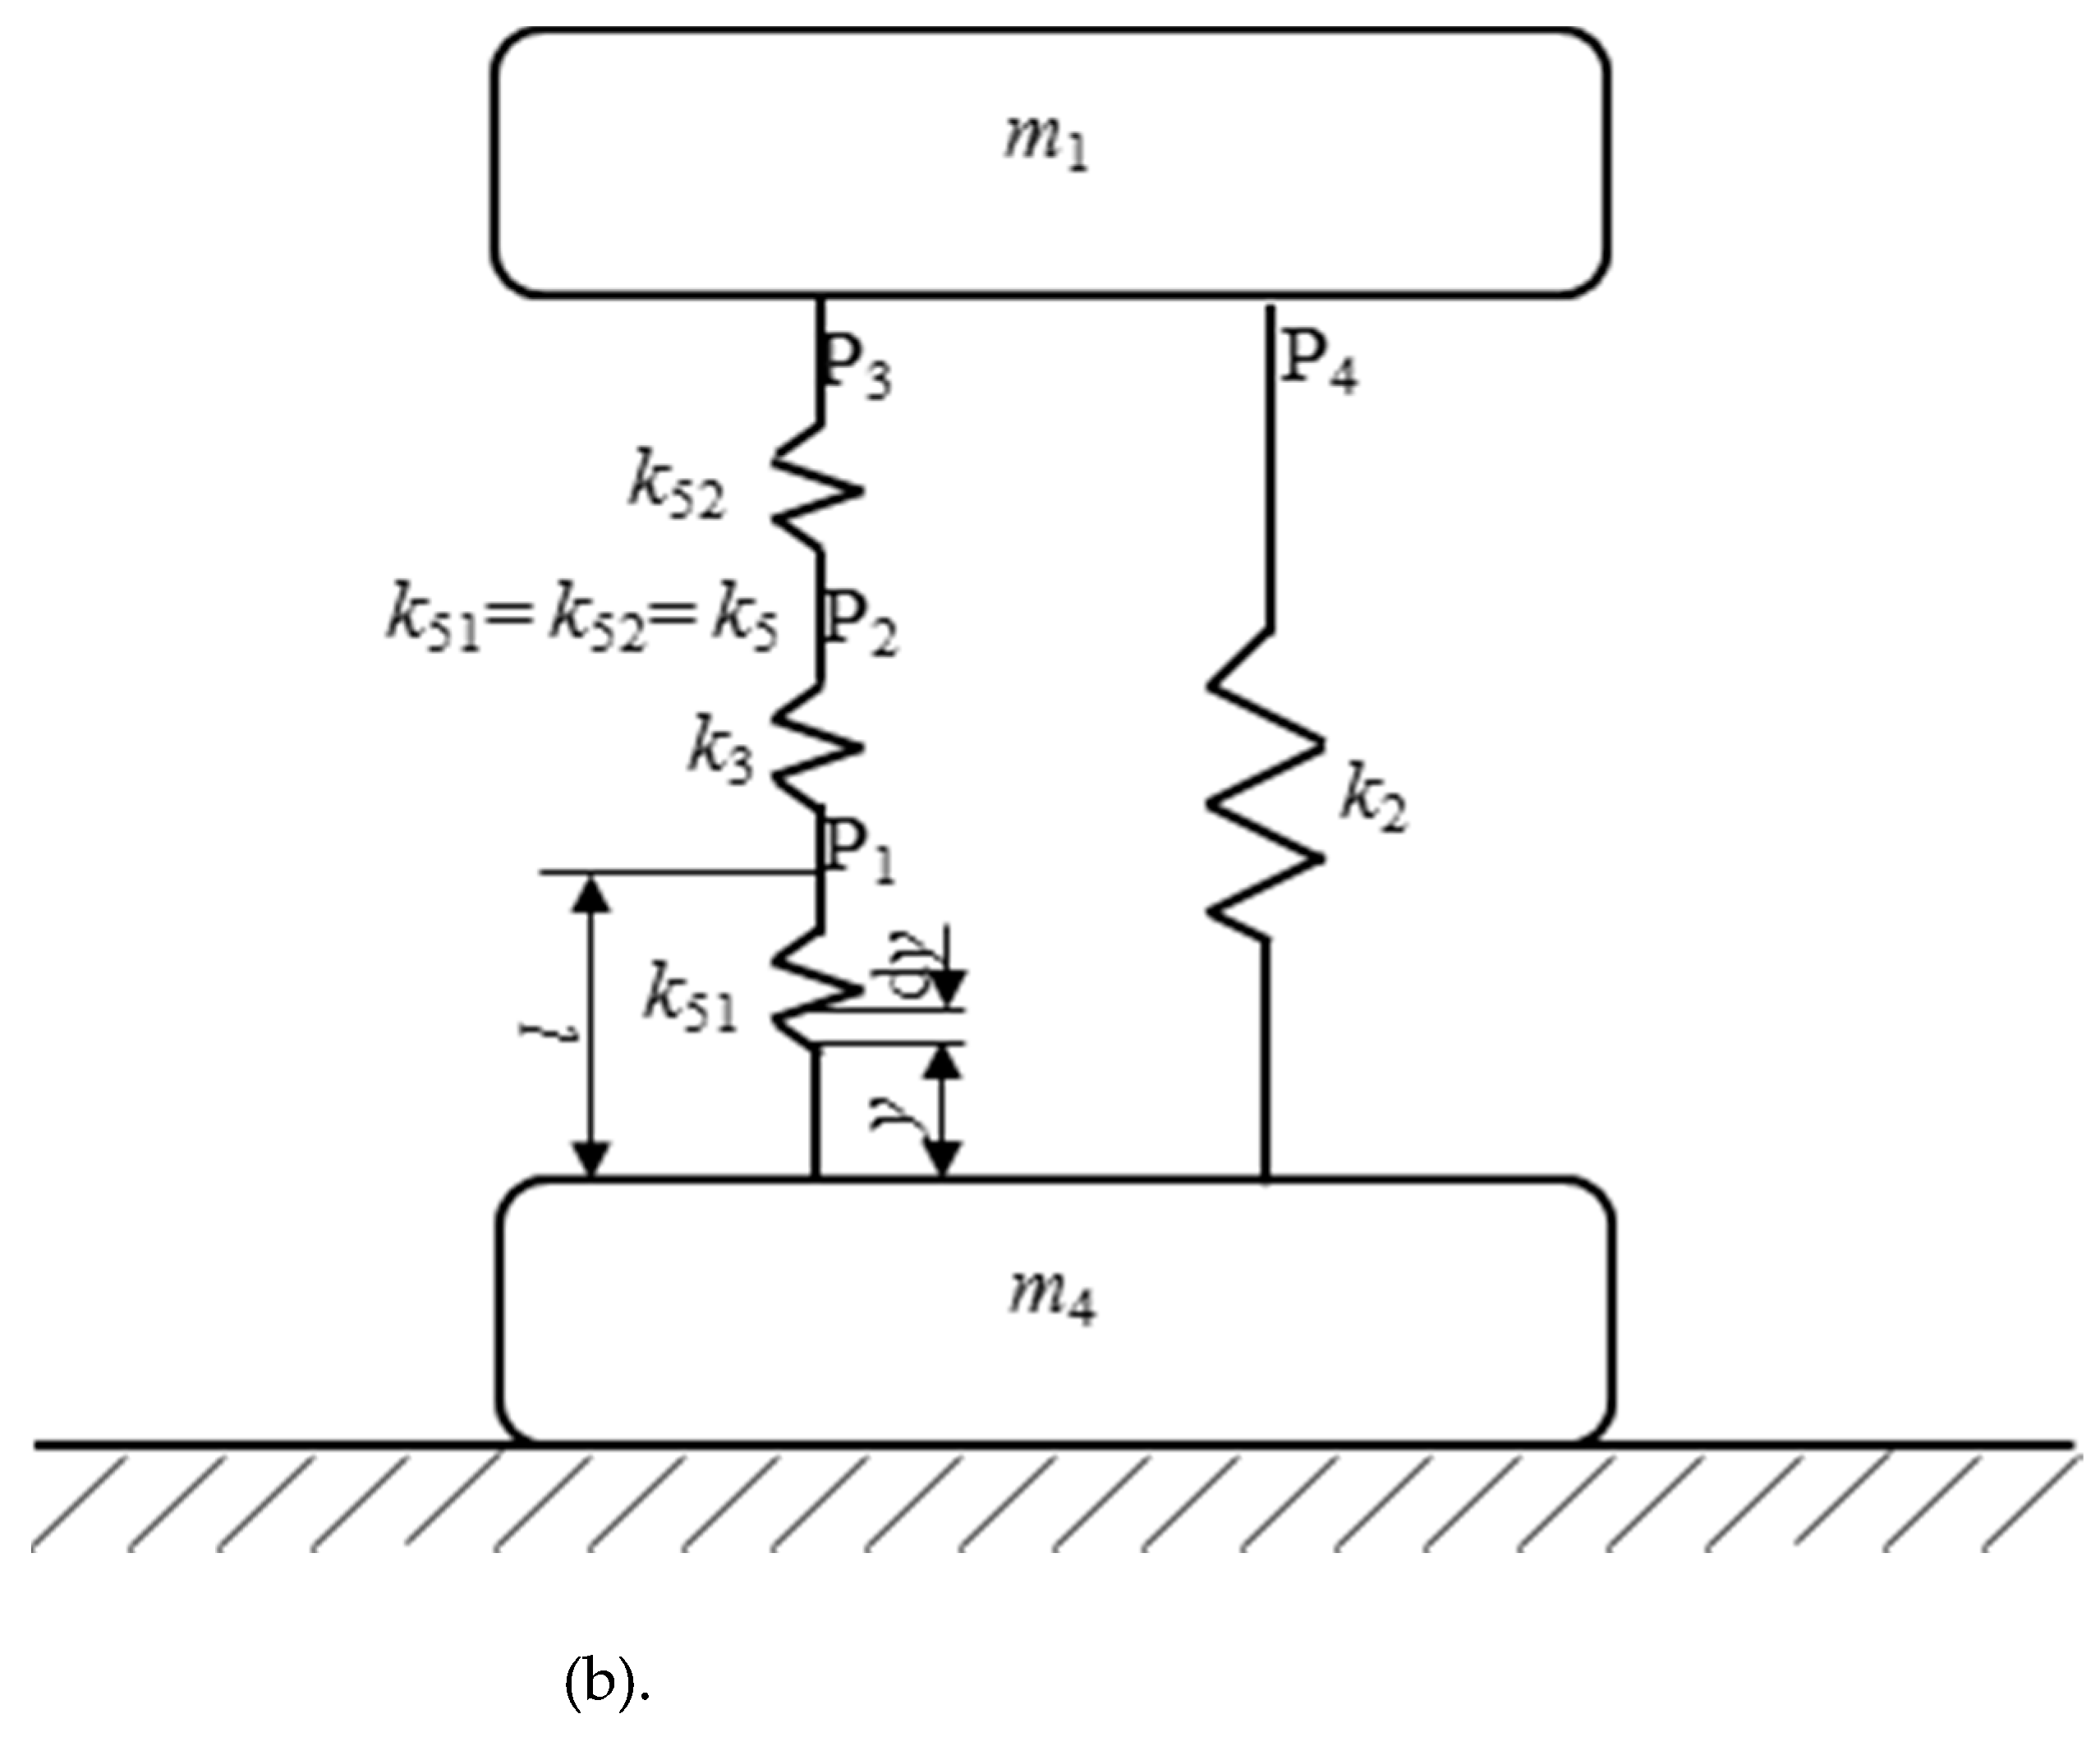
3. Design and Construction of the SGBD

3.1. Specifications and Material of the Main Structure

The main structure is the most important component of the force measurement system. It′s construction profited initially from the strain-gauge-based force measurement method with additional elastic elements [24]. It was designed to meet the following requirements:
  • Natural frequency (without workpiece) higher than 9 kHz;
  • Natural frequency (with the reference workpiece, oversize less than 48 mm × 20 mm × 10 mm) higher than 8 kHz;
  • Suitable for measuring milling forces, especially at high or super high rotational speed, the highest rotational speed allowed is about 40,000 r/min or more;
  • Three cutting force components Fx, Fy, Fz, should be available, and the measuring range of transversal components Fx, Fy, Fz ≈±1 kN;
  • The sensitivity of the thin elastic part should be more than 1.5 µε/N;
  • Cross-sensitivity should be lower than about 10% for all sensing routes;
  • Relatively simple to do and of relatively low cost.
Sensitivity and rigidity are important conditions that are always in opposition to designing a dynamometer [25]. Where a good sensitivity means a little bit increment or decrement of the load should be easily readable for the designed dynamometer, and a good rigidity means the designed dynamometer should be rigid enough so that the cutting operations are not influenced by the accompanying deflection. Frequently, the two functions of an SGBD can be fulfilled by designing the special elastic elements and main structure. In addition, the dominating stiffness criterion is generally the natural frequency of the dynamometer, and the natural frequency must be large (i.e., 4 times as large) compared to the frequency of exciting vibration.
Therefore, the sensitivity and rigidity are crucial factors for choosing the material of the main structure as well as high-frequency, the magnitude of the force, and corrosion resistance, etc. In this work, aluminum alloy 2A12 was selected because it meets the above criteria. The mechanical properties of this material are summarized in Table 1.
The symmetrical main structure of the SGBD can be disintegrated into several parts, and the variables ai bi, and li (i = 1, 2, 3, 4, 5) are used to represent the width, length, and height of each part (as shown in Figure 4).

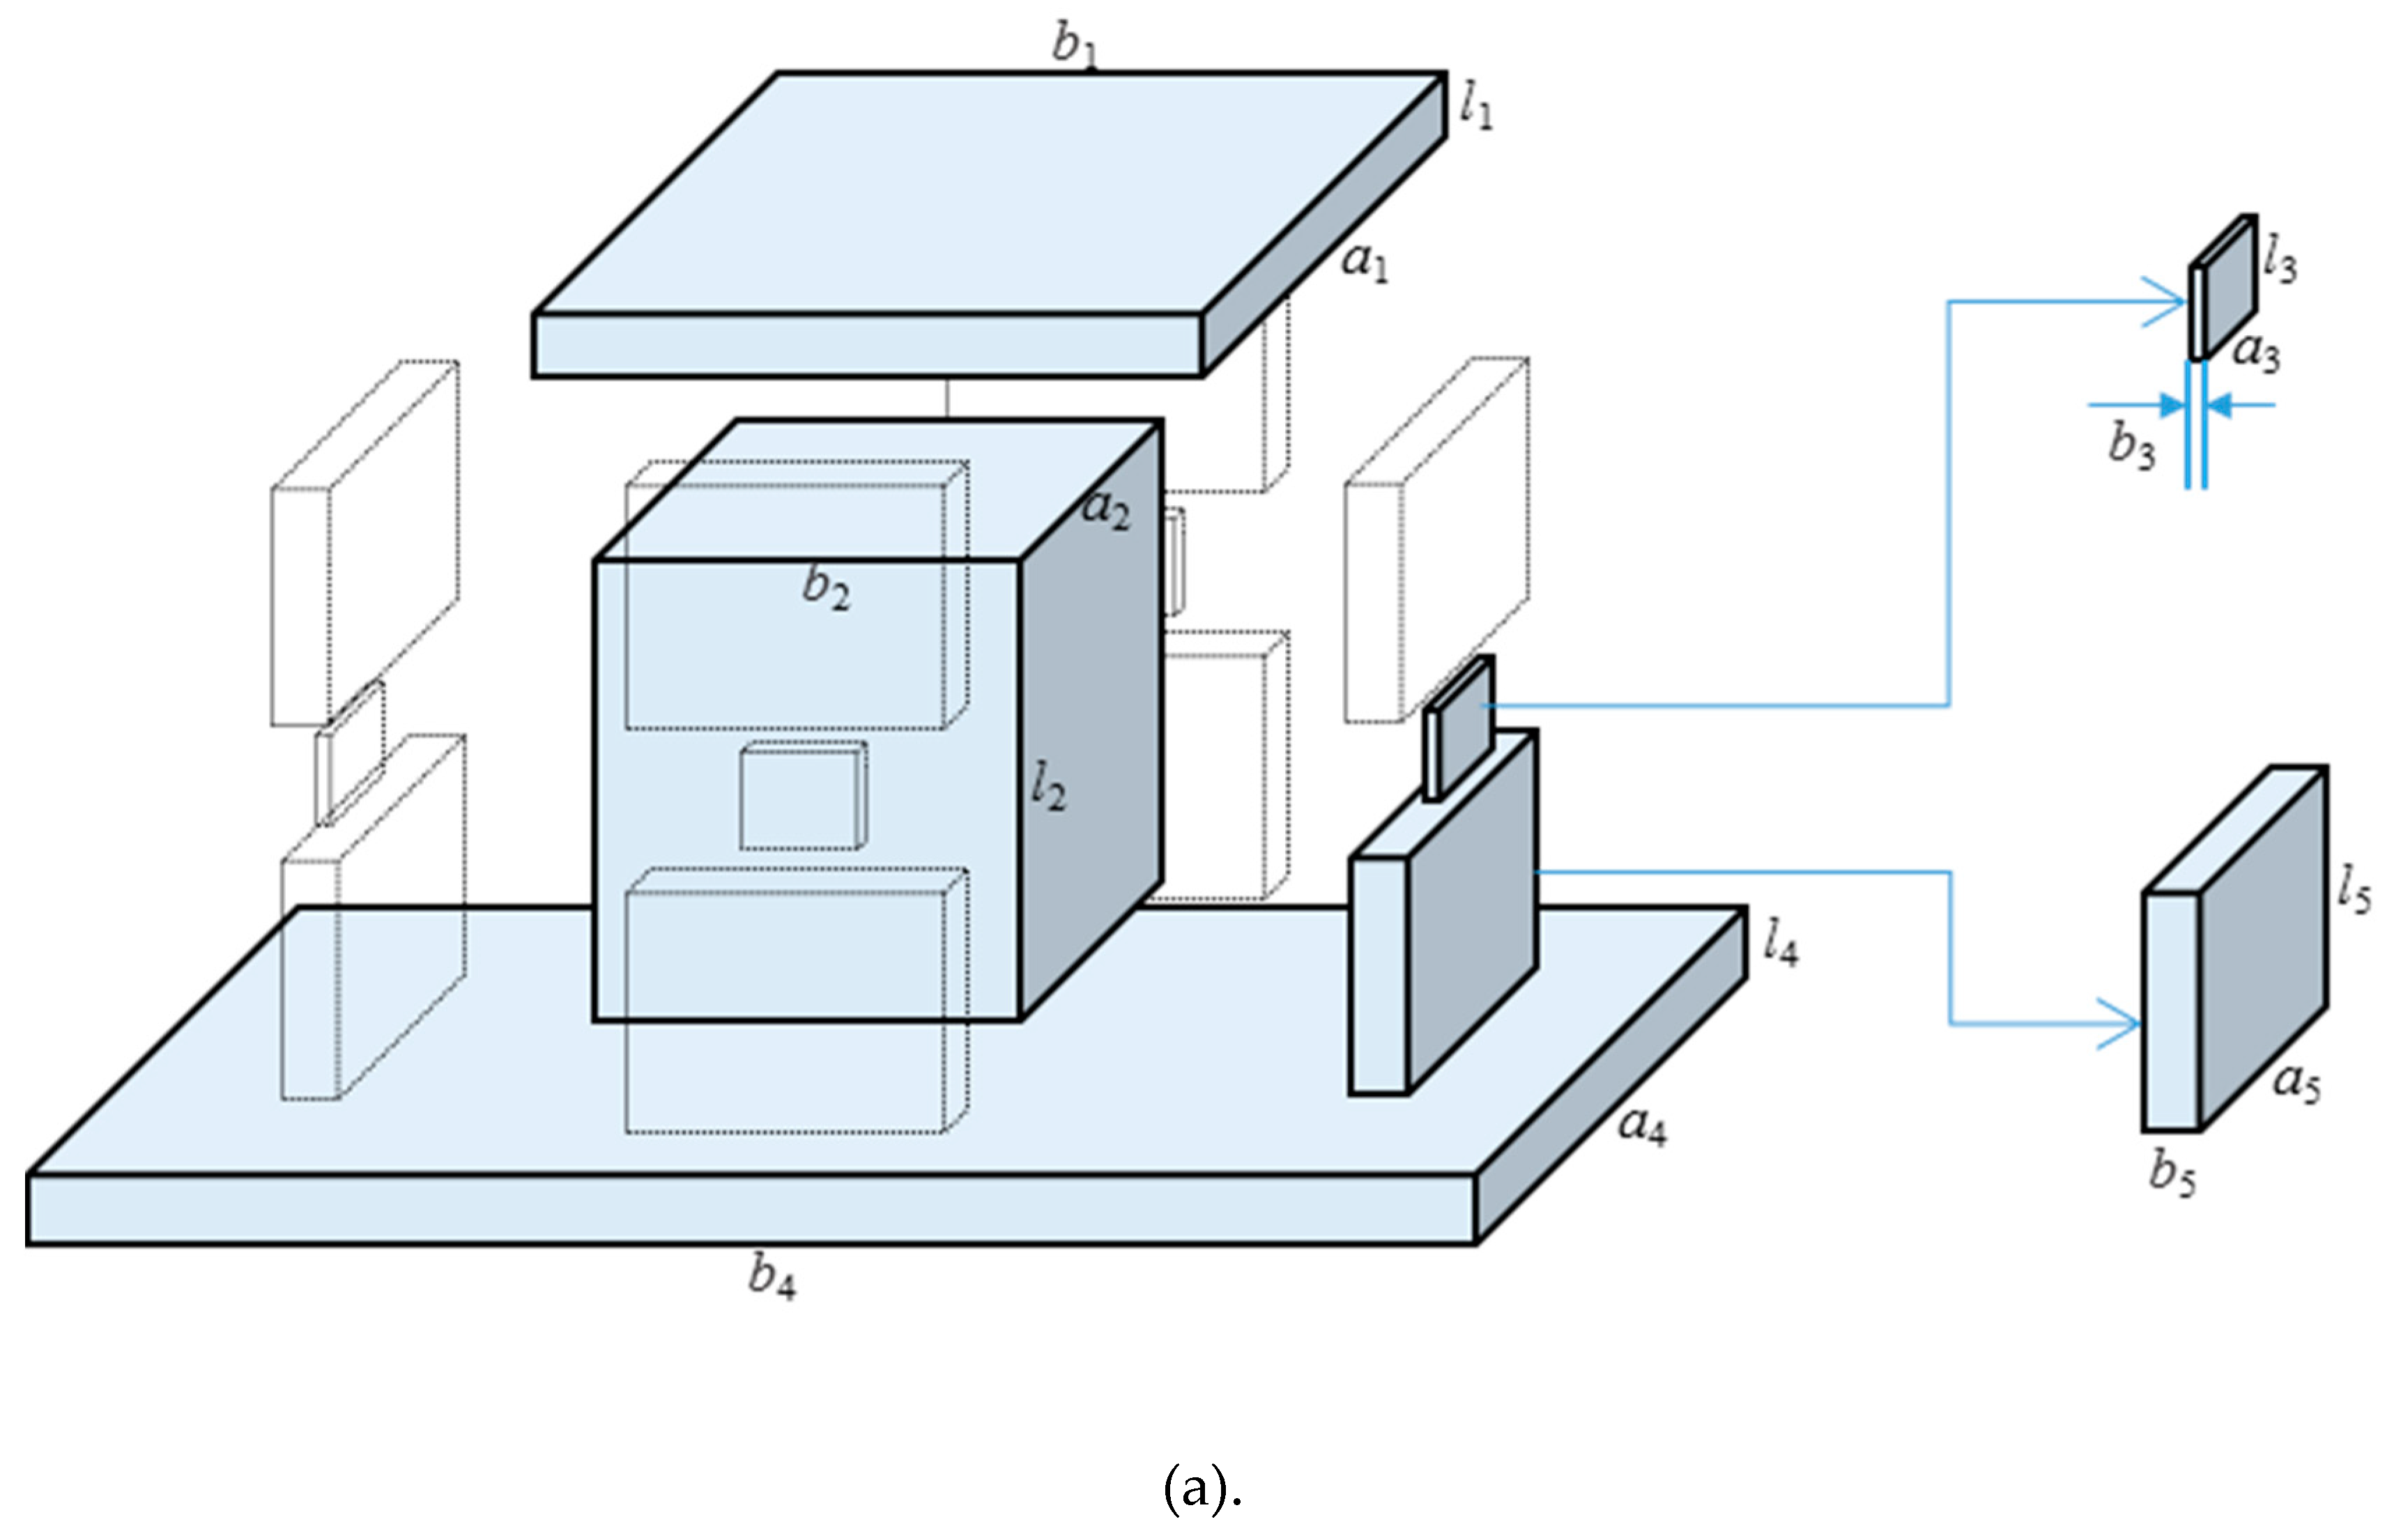
3.2. Determination of Dimensions of the Main Structure

To analyze the system, a dynamometer can be lowered to a mass supported by a spring [25]. Considering a symmetrical position of the elastic elements of the SGBD, the main structure can be reduced and modeled as a mass supported by springs in [20], where m1 is the quality of the upper support plate, m4 is the quality of the lower support plate, k2 is the stiffness of quasi-rigid part, k3 and k5 are the stiffness of thin elastic part and thick elastic part, respectively.
According to Dun Kerley’s method of finding the natural frequency of a multi-degree of freedom system, if there are n coupled degrees of freedom, the natural frequency of the dynamometer ω can be calculated approximately by Equation (1).
1 / ω 2 1 / ω 11 2 + 1 / ω 22 2 + + 1 / ω n n 2
where ωii |i = 1, 2, …, n is the natural frequency of the system in which the quality of the ith part mi is only considered.
As to the simplified model of this dynamometer, three parts are considered, i.e., ωk, ω1, and ω4, where ωk is the angular frequency of the system in which the m1 and m4 are not considered, ω1 is the angular frequency of the system in which the m1 is only considered, and ω4 is the angular frequency of the system in which the m4 is only considered. Thus, the angular frequency of the simplified model of the SGBD can be written as Equation (2):
ω = 1 / 1 / ω k 2 + 1 / ω 1 2 + 1 / ω 4 2
According to the basic theory of vibration, the natural frequency of a vibration system can be written as ω = K / m , where K is the spring constant, and m is the mass. As to the simplified system of SGBD, under the condition of only considering m1, K1 can be calculated as follows:
K 1 = 1 / 2 / k k + 1 / k 1 + k 3
Therefore, the angular frequency of the system when only considering m1 was calculated as Equation (4):
ω 1 = 1 / 1 / ω k 2 + 1 / ω 1 2 + 1 / ω 4 2 / m 1
Additionally, due to the complexity and relevance of the main construction, Energy Conservation Law was applied in the investigation on the free vibration of the dynamometer without considering m1 and m4. As for a vibration system, if its movement equation is expressed as Equation (5):
x = A sin ( ω t + )
Then the maximum kinetic energy of the system Tmax is:
T m a x = 1 2 m e q ω o 2 A 2
Then, the maximum potential energy of the system Vmax is:
U m a x = 1 2 k e q A 2
According to the energy conservation law, Tmax = Vmax, and then:
1 2 m e q ω o 2 A 2 = 1 2 k e q A 2
where meq and keq are the equivalent mass and equivalent stiffness of the vibrator, respectively, ωo is the angular frequency of the vibrator, and A is the amplitude.
As to the main structure without considering m1 and m4, if we define the displacement of point P1: x1 = l, the displacements of points P2, then P2 and P4 are l + (k5/k3)/l and 2l + (k5/k3)/l respectively. Assume the displacement of each cross-section of spring is proportional to the distance between the fixed end and the cross-section, which is the same as that in the condition of static deformation. When the instantaneous velocity of a mass m at any time is defined to x ˙ , the corresponding velocity of the micro section dy on the spring located at the position y will be y x ˙ / l . Furthermore, when ρ is defined as the mass of per unit of the spring (linear density), and ρdy is the quality of the micro section dy of the spring, then the kinetic energy of the dy can be written as d T = ρ d y y x ˙ / l 2 / 2 . Therefore, the kinetic energy of the spring is T = 0 1 1 2 ρ d y y x ˙ / l 2 = ρ l x ˙ / 6 . Assume the quality of the thick elastic part which is close to the fixed end mk51 = ρl, then the maximum kinetic energy of the element will be T k 51 m a x = ρ x ˙ m a x 2 / 6 . Similarly, the maximum kinetic energy of the thin elastic part, the thick elastic part which is far to the fixed end, and the quasi-rigid part can be calculated as Tk3max, Tk52max, and Tk2max.
Therefore, the maximum kinetic energy and maximum potential energy of the dynamometer when freely vibrating can be expressed as Equations (9) and (10), respectively.
T m a x = T k 51 m a x + T k 3 m a x + T k 52 m a x + T k 2 m a x
U m a x = k 5 + k 5 2 k 3 + 1 2 2 + k 5 k 3 2 k 2 x m a x
Accordingly, Equations (5) and (11) can be calculated as follows:
x ˙ m a x = ω A = ω x m a x
Importing Equations (9)–(11) into Equation (8), the first-order natural frequency of the dynamometer can be expressed as Equation (12):
ω = 1 1 1 2 l 5 A 5 E + l 3 A 3 E + A 2 E l 2 m 1 + 1 1 2 l 5 A 5 E + l 3 A 3 E + A 2 E l 2 m 4 + 1 A 5 E l 5 + A 5 2 E l 3 2 A 3 l 5 2 + A 2 E 2 + A 5 l 3 A 3 l 5 2 l 2 A 5 l 5 6 + A 3 l 3 1 2 + A 5 2 l 3 2 6 A 3 2 l 5 2 + A 5 l 5 1 6 + 1 2 1 + A 5 l 3 A 3 l 5 + 1 6 A 2 2 + A 5 l 3 A 3 l 5 2 l 2 ρ .
Equation (12) indicates the relationship between the first-order natural frequency and the sizes of the components. Through this analytical model (Equation (12)), the first-order natural frequency can be calculated directly, and the sizes of each part can be optimized vice versa. A subroutine used in MATLAB 7.0 was developed to implement the feasibility of the proposed analytical model, which is used to calculate the first-order natural frequency of the dynamometer. The relationship between the natural frequency and the dimension of each part is analyzed, as shown in Table 2. During the determination of dimensions of the main structure, some specifications are considered as follows:
  • The oversize of the main structure is limited to 150 mm × 60 mm × 60 mm to gain a high natural frequency (without workpiece), which is higher than 9 kHz.
  • The thickness of the thin elastic part (b3) should not less than 0.7 mm to measure the range of transversal components Fx, Fy, Fz ≈±1 kN.
  • The distance between the quasi-rigid part and the force-sensing elastic elements should be within 0.3 mm ~0.8 mm, and the cross-section area of the thick elastic part should be more than 10 times than that of the thin elastic part, which can maintain the sensitivity of the thin elastic part more than 1.5 µε/N.
Systematically considering all of the above specifications and utilizing the MATLAB program, the dimensions of each part of the main structure are as shown in Table 2. The calculated values of the first-order natural frequency of the dynamometer are ω = 11,423 Hz (without workpiece) and 10,079 Hz (with the workpiece, 20 × 20 × 4 mm), respectively. In addition, a finite element model of the dynamometer with the optimized dimensions was established, and the sensitivity of the thin elastic part is analyzed. The calculated value is 2.175 µε/N, which is higher than the specified value of 1.5 µε/N.

4. Dynamometer Calibration

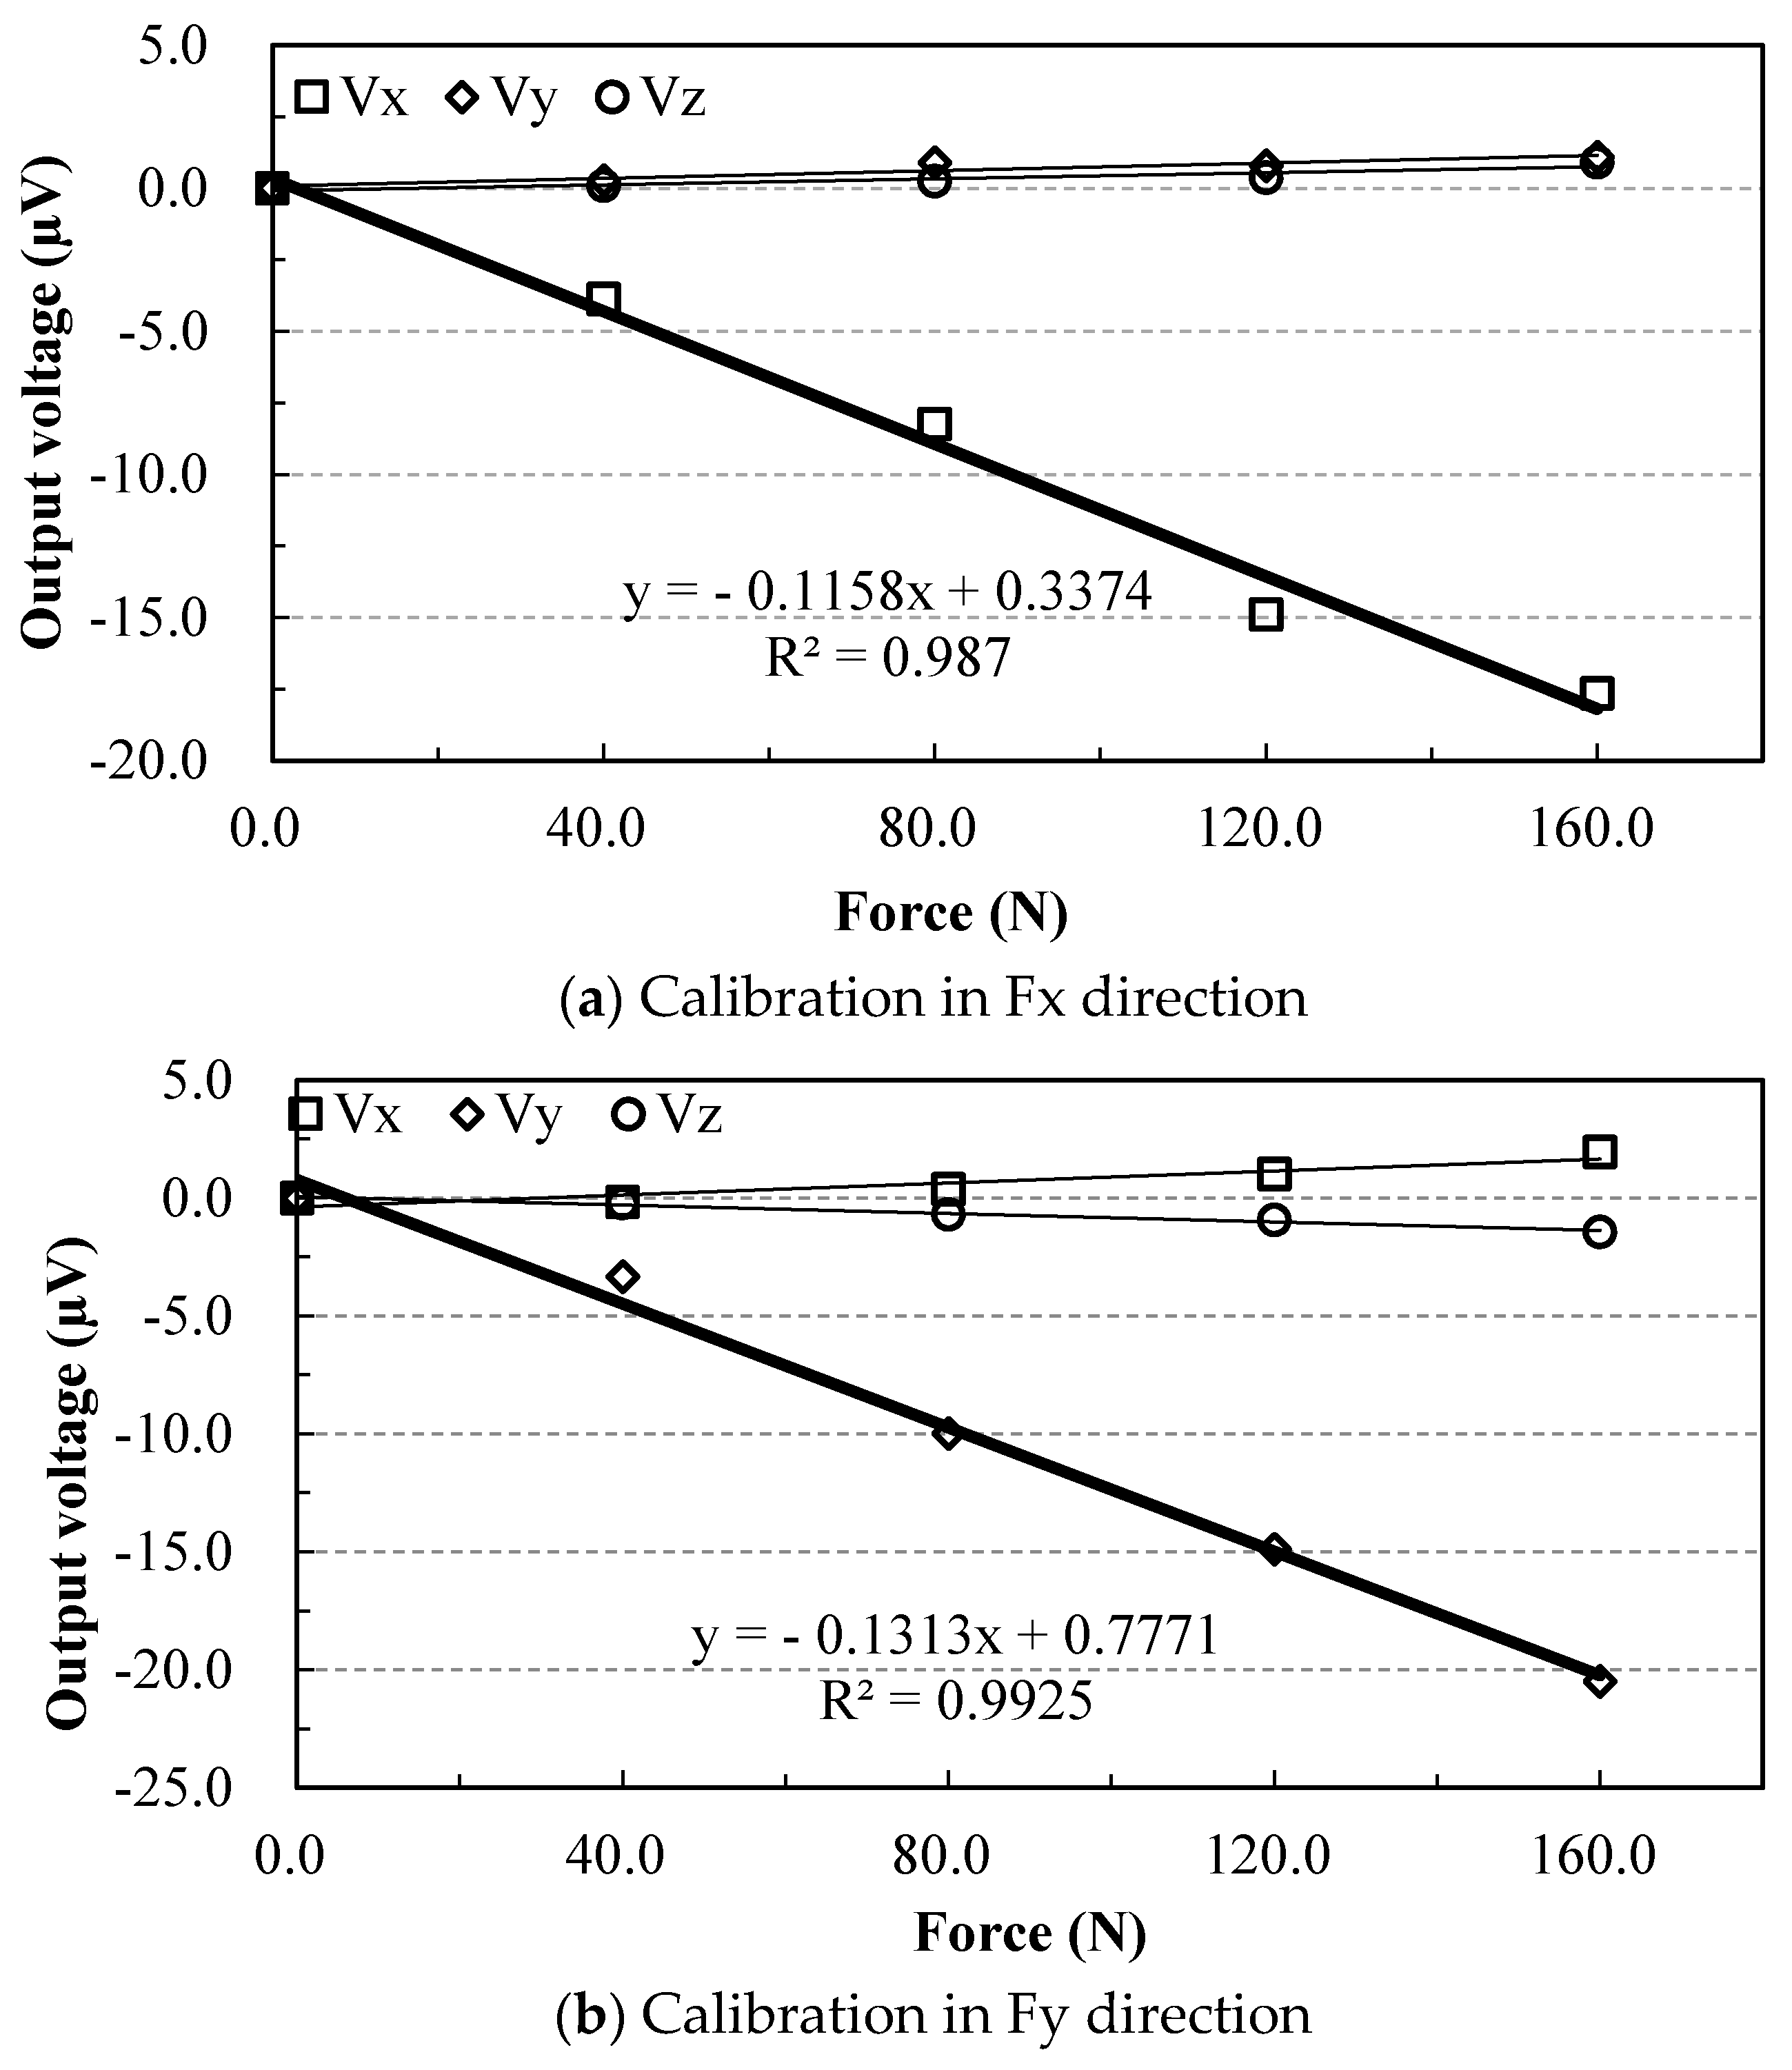
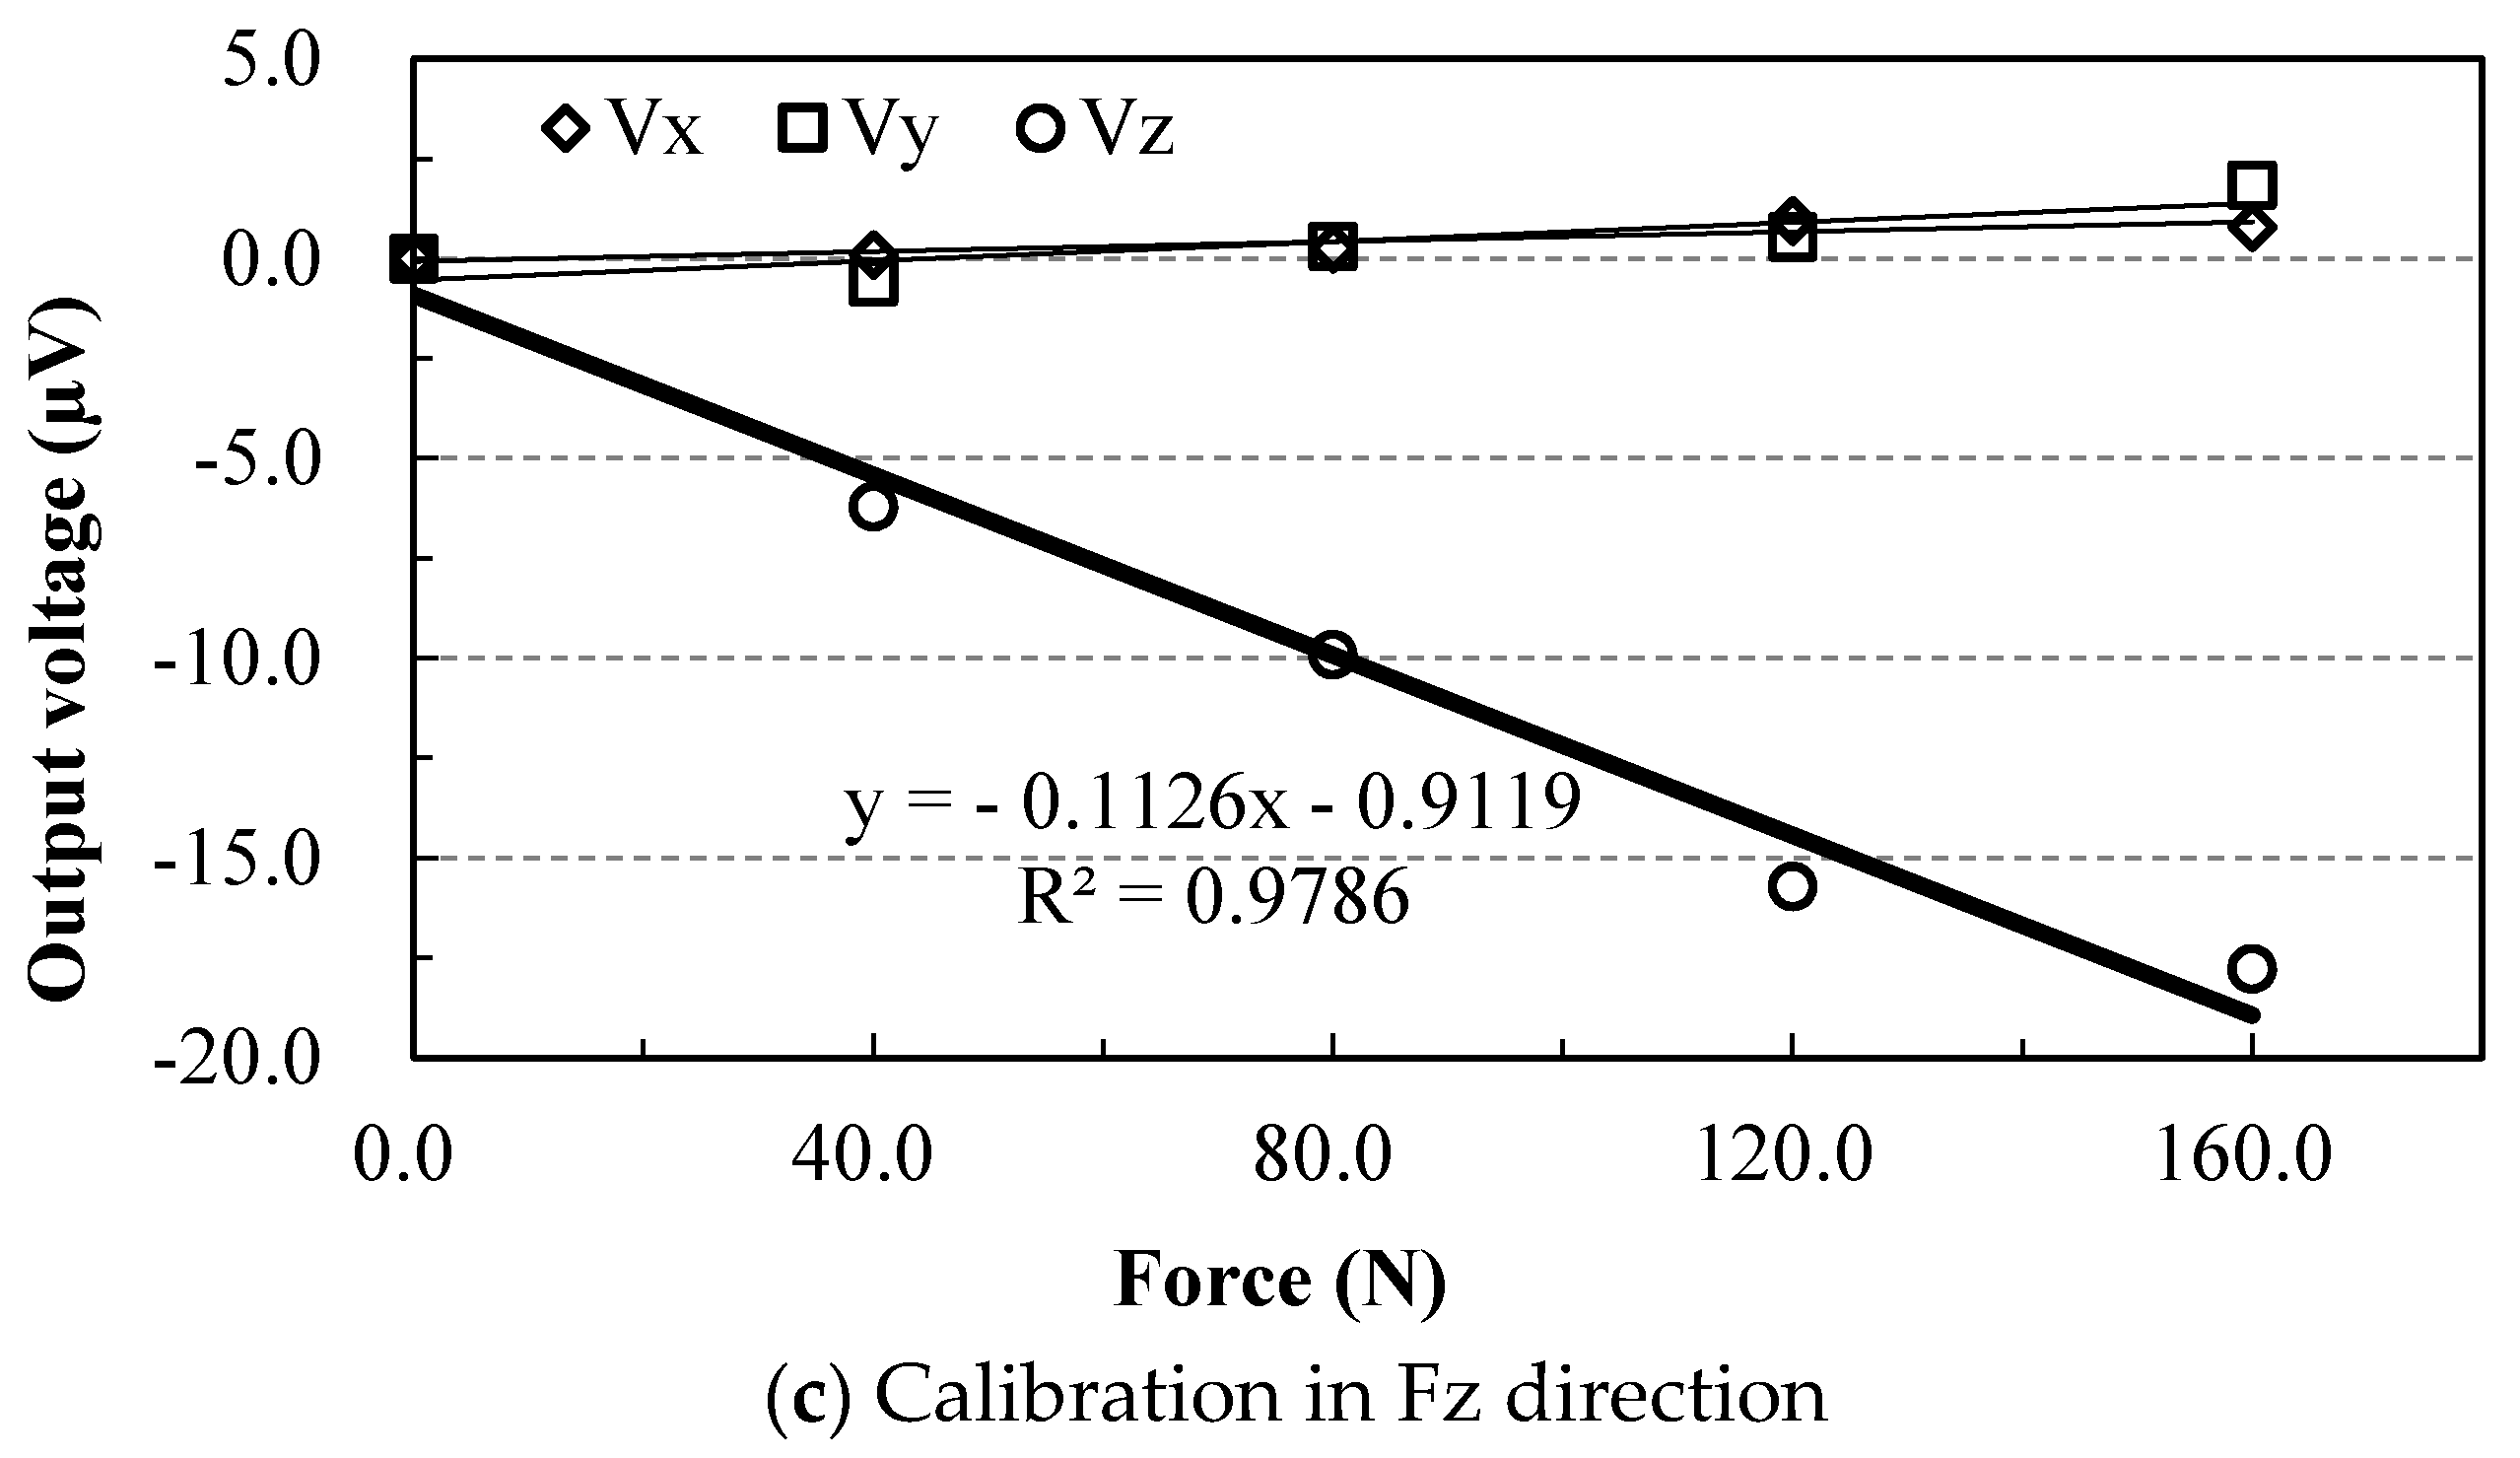
4.1. Static Calibration

A calibration test is a method to establish the connection between the input and output data [5]. To determine the relationship between the thin elastic parts and consequently the output voltage with applied load, the dynamometer was calibrated under static loads condition. The calibration was made in three directions for Fx, Fy, and Fz. The output voltages of microvolt were averaged for each direction. To decrease the dependency on the location of the acting point, all the loads were applied at the same point in the static calibration. Additionally, because of the small values of the cutting parameters used in the following milling experiments, the maximum cutting force is lower than 100 N. When the load was up to 160 N, a 40 N interval was applied in this calibration, and the corresponding strain values were recorded for each load interval. Thus, the final calibration curves were obtained by plotting the curve of load values and output readings. Figure 5 shows the calibration curves for Fx, Fy, and Fz, respectively. The effect of loading towards one direction on the other force elements was also analyzed, and minor fluctuations were detected. It can be found from Figure 5 that the cross-sensitivity is smaller than about 10% for all sensing directions.
According to Figure 5, the relations between the output voltages in X, Y, and Z direction (Vx, Vy, Vz) and the corresponding forces (Fx, Fy, Fz) for the dynamometer can be calculated, and a calibration matrix [18] can be derived. Using the calibration matrix, the three-dimensional milling forces can be computed automatically by the developed data processing software according to the output voltages. However, it was found in the process of static calibration that the location of the acting point has a direct influence on the output voltages, which results in a large deviation of measuring results for a constant input loading. Therefore, the conversion matrix for the input and output data should consider the influence of dependency on the location of an acting point. For this purpose, a new conversion matrix model combined with moment effect was developed, which will be in the following Section 4.2.

4.2. Conversion Matrix Model

The conversion matrix model is of importance for the dynamometer, and it is a bridge between the input load and output voltages. In this section, a new conversion matrix model, both three-force components and torque matrix were considered to reduce cross-sensitivity and point effect, as shown in Equation (13).
V = A F + B M
where V is the output voltage vector, F is the input load vector, M is the moment vector results from F, A and B are the calibration coefficient vectors (i.e., conversion matrix). For the three-dimensional milling forces measurement, Equation (13) can be expressed as Equation (14).
V x V y V z = a x x a x y a x z a y x a y y a y z a z x a z y a z z F x F y F z + b x x b x y b x z b y x b y y b y z b z x b z y b z z M x M y M z
where Vx, Vy, and Vz are the out voltages in X, Y, and Z directions, respectively, Fx, Fy, and Fz are the input loads (i.e., cutting forces) in X, Y, and Z directions, respectively, aij | i, j = x, y, z is the calibration coefficient between Fi and Vj, b ij | i, j = x, y, z is the calibration coefficient between Mi and Vj.
The methods of matrix vectorization and Kronecker product, least-squares method was utilized synthetically for the calculation of the conversion matrixes, and the Kronecker product of A and B can be expressed as Equation (15) [24].
A ^     B ^ = i = 1 n V i F i T i = 1 n V i M i T i = 1 n F i F i T i = 1 n F i M i T i = 1 n M i F i T i = 1 n M i M i T 1
To obtain the coefficients of conversion matrix A and B, amounts of static calibration experiments were conducted, and each experiment was repeated more than 3 times. With the help of a self-developed subroutine of MATLAB, the measured output voltages and input loads were introduced into Equation (15), and the conversion matrix A and B were calculated as follows:
A = 0.088 + 0.014 + 0.003 + 0.031 0.154 + 0.019 + 0.018 0.009 0.105   and   B = 2.995 0.204 0.019 + 0.409 + 2.391 + 0.941 + 0.525 + 0.067 + 4.321 .

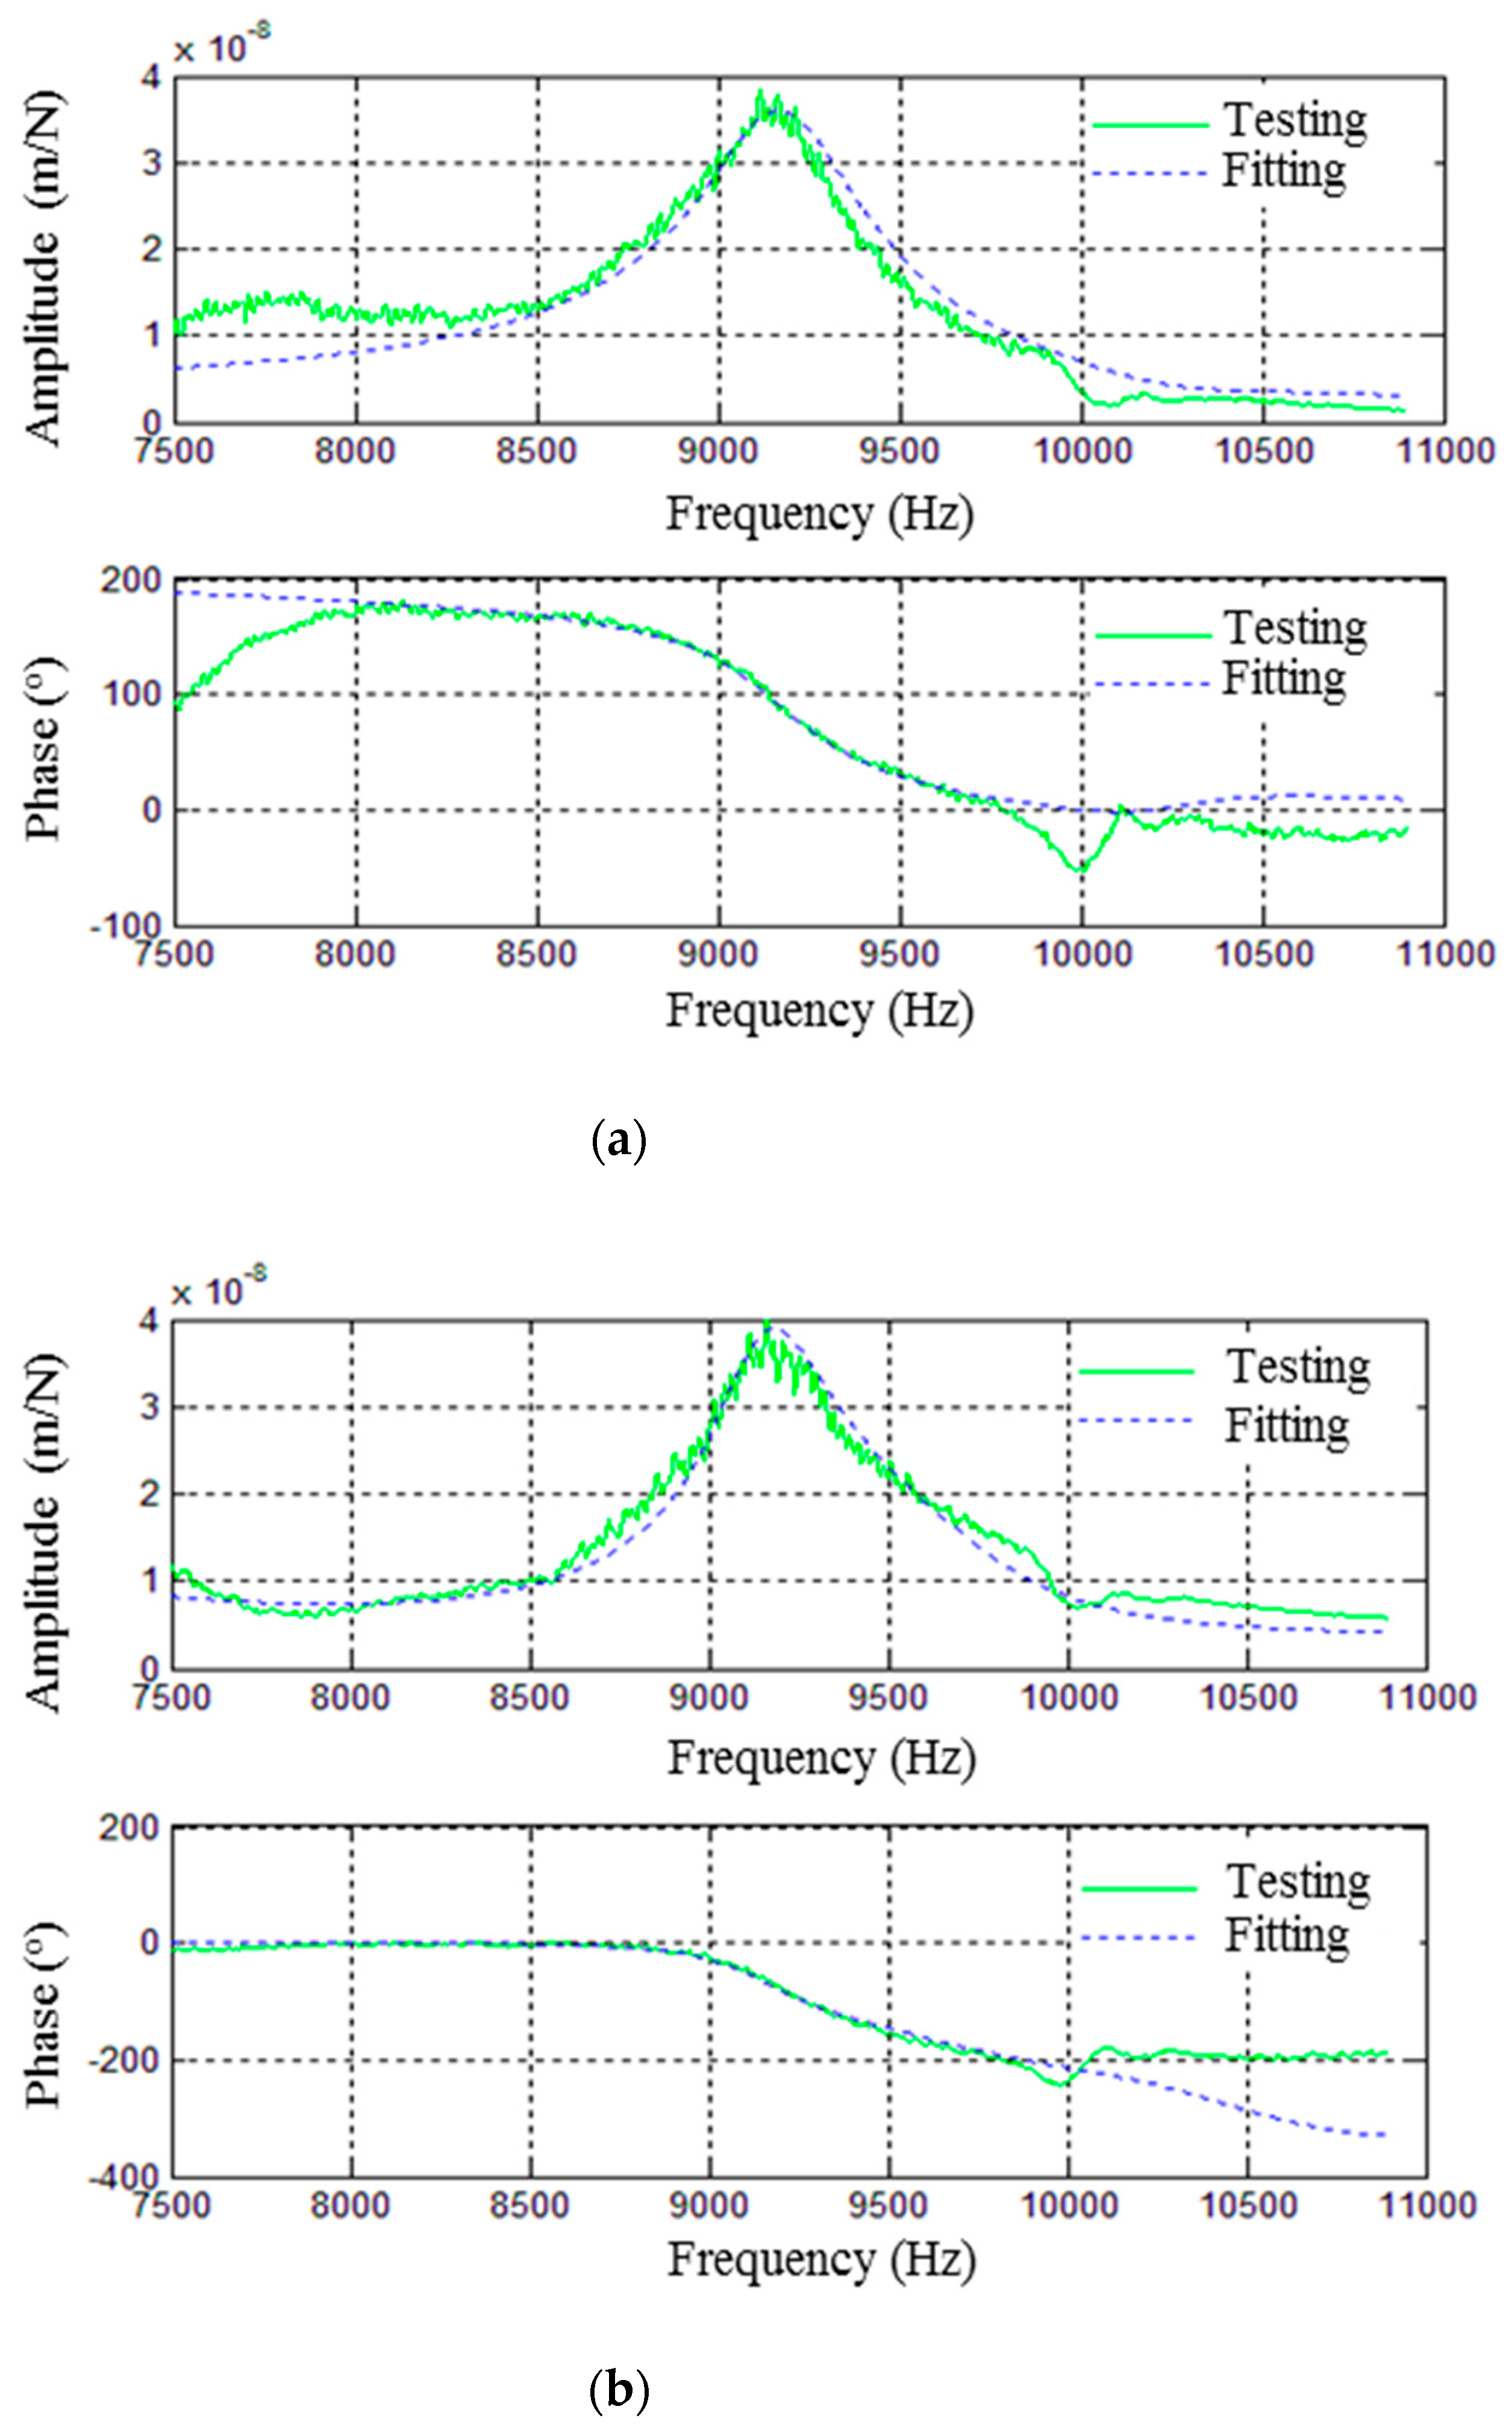
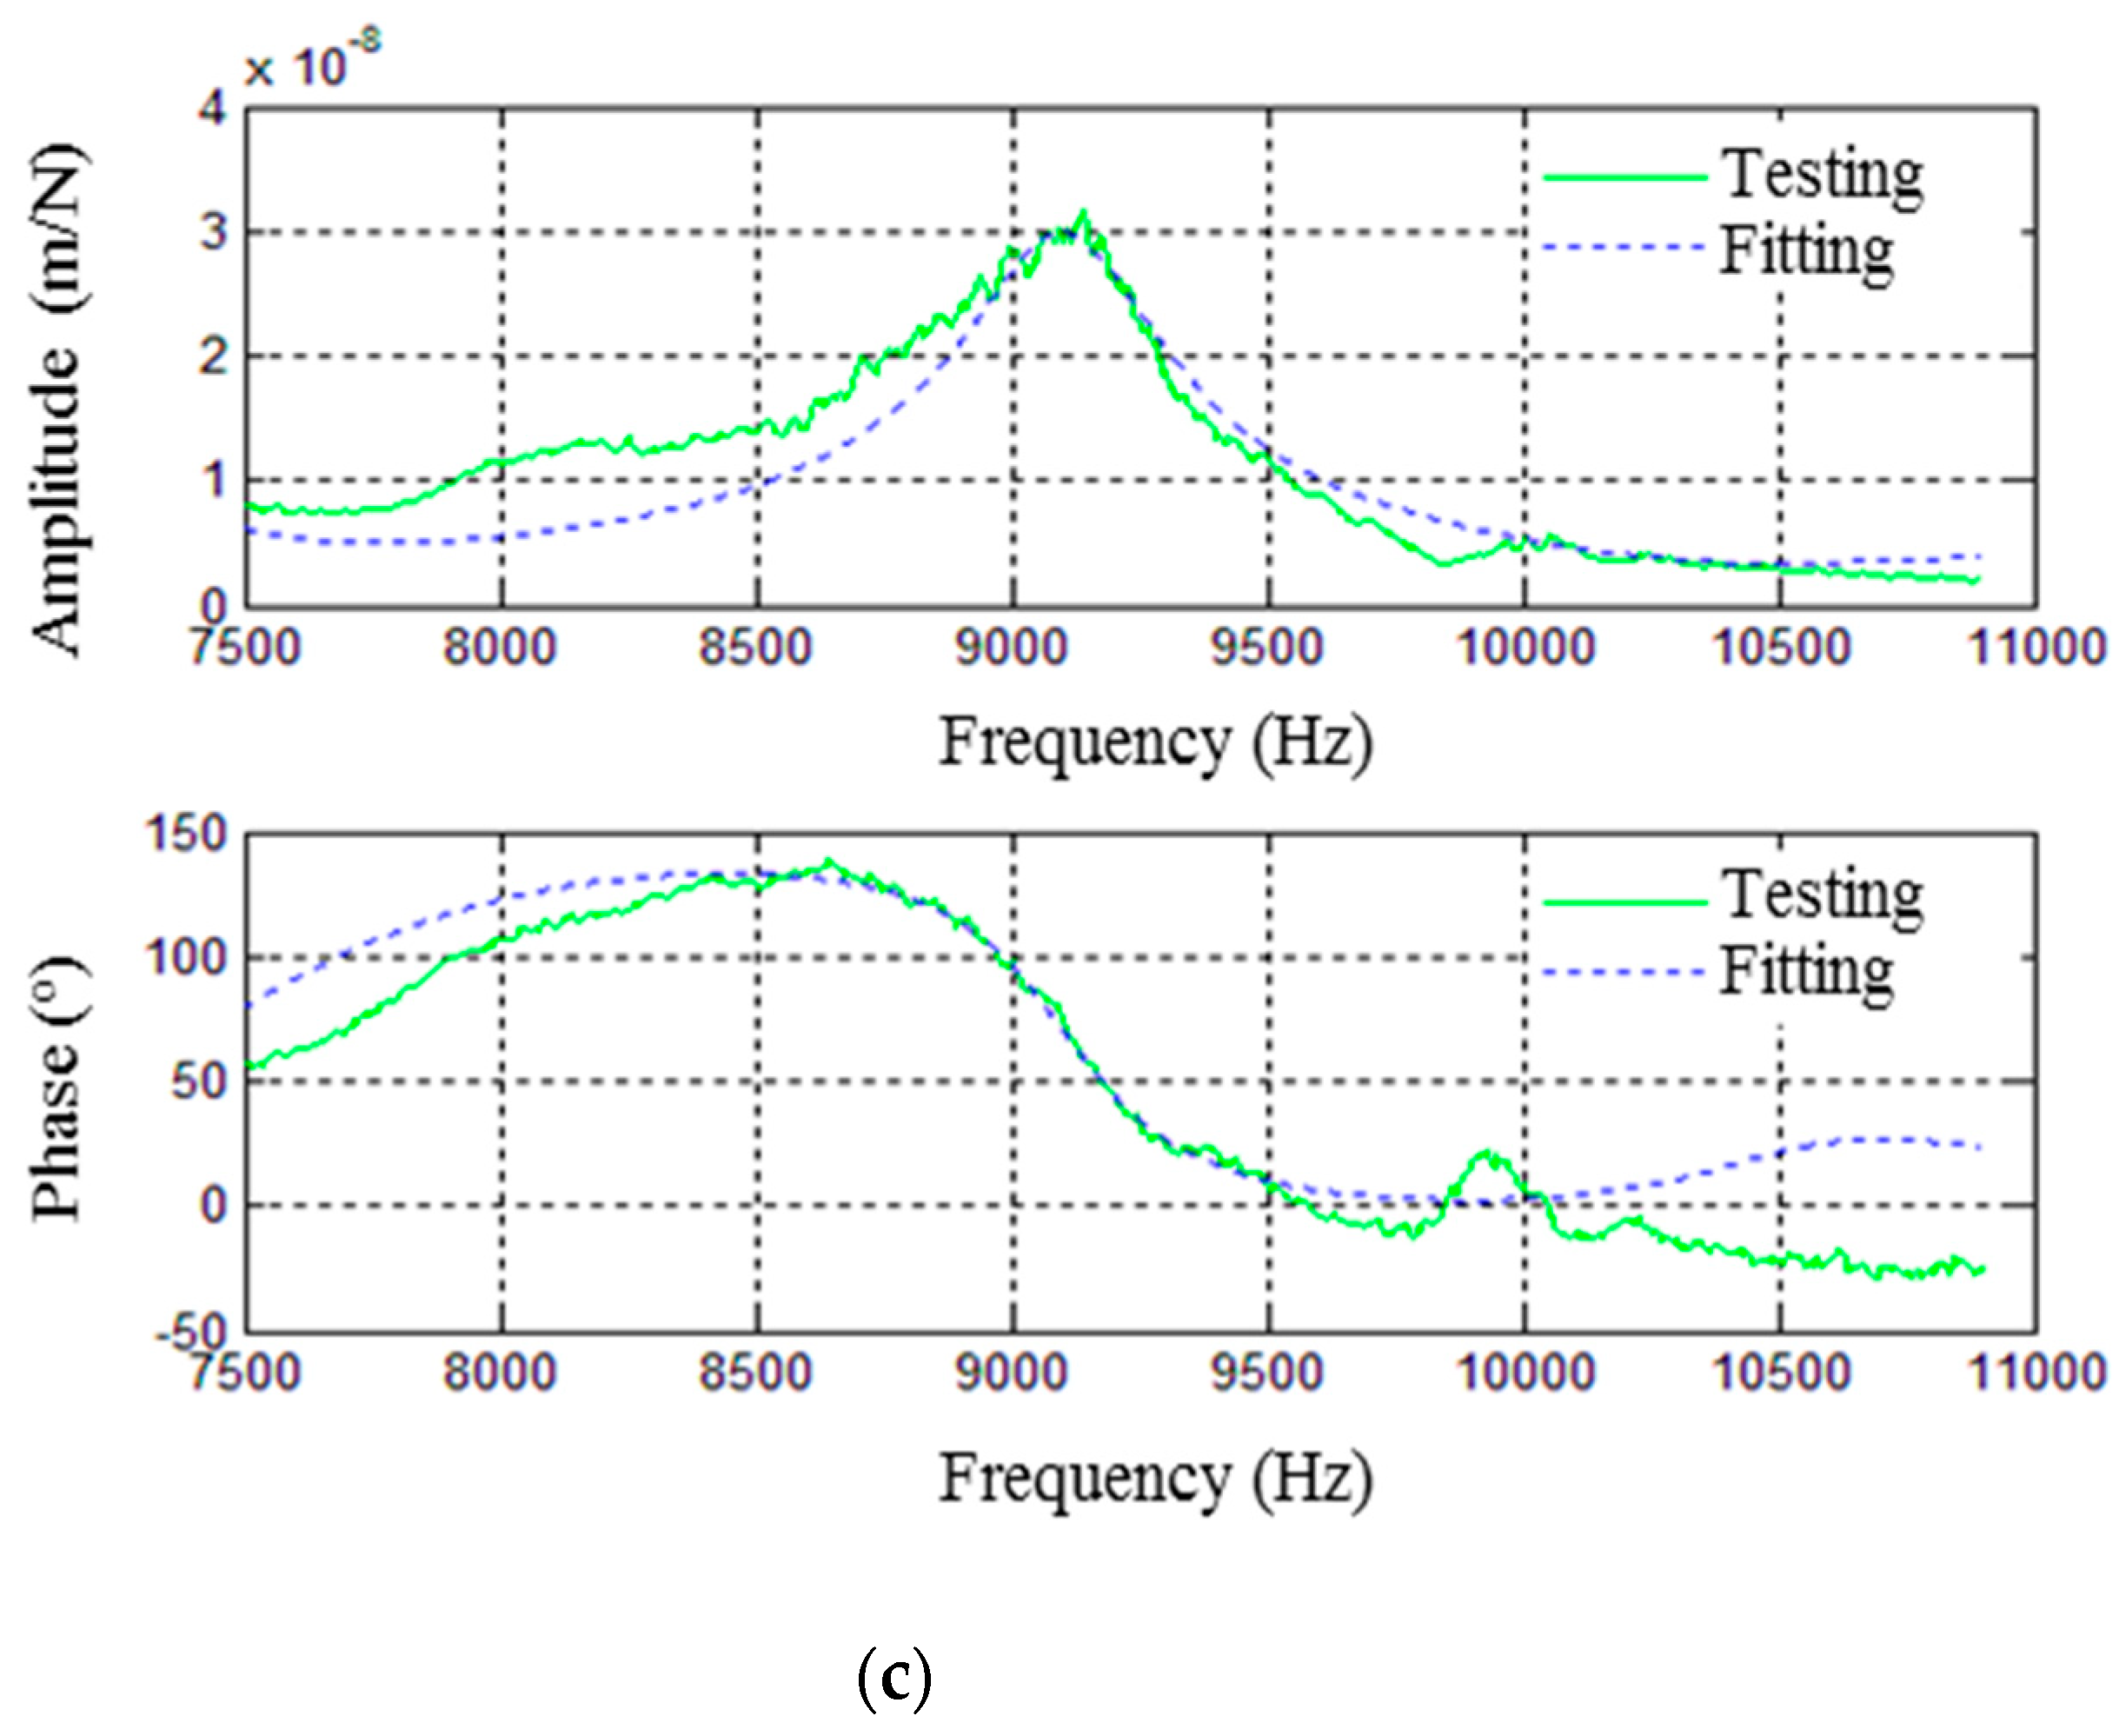
4.3. Dynamic Identification

The identification of the main structure of the SGBD was accomplished in terms of a pulse test. The main structure was fixed on the machine tool table of a 5-axis CNC milling machine Mikron UCP710 and excited using an impact hammer, Dytran5800B4. Before the pulse test, 16 test points were selected on the surface of the upper support plate (as shown in Figure 6), and acceleration sensors were glued on the thin elastic parts in X, Y directions and upper support plate in the Z direction, respectively. The pulse test at each point was run 3 times to reduce errors. The signals were acquired by an AGILENT 35,670 A spectrum analyzer, and a modal investigation was presented to obtain the frequency response function of the main structure.
A subroutine of MATLAB combined with rational fraction interpolation was developed for the calculation of the first-order natural frequency of the dynamometer’s main structure, and the amplitude and phase response function (FRF) of the pulse in three directions which possesses the lowest eigenfrequency can be seen in Figure 7.
It can be found from Figure 7 that the measured dominant resonance peaks of the SGBD’s main structure are about 9.15 kHz in X, Y, and Z directions, which are about 20% lower than the calculated result of 11,423 kHz. Considering the simplification of the theoretical calculation, the measured results are in good accordance with the calculated result. In addition, the approximate symmetric design in X and Y directions results in the FRF in the X direction is close to that in the Y direction. Moreover, the measured result in the Z direction is equal to that in the X direction because the vibration modes measured by the acceleration sensors in X and Z directions are the same. As to the phase response function, it can be found that the phase shifts in three directions are all about 180° near the eigenfrequency of 9.15 kHz. Pure translation modes in X and Y directions can be obtained, but a little bit of crosstalk from other signal channels may exist in the Z direction. In short, the measured results show that the natural frequency (without workpiece) of the dynamometer can meet the design requirement of ω ≥ 9 kHz. In this way, the reliability of the system was ensured [26].

5. Milling Test of the SGBD

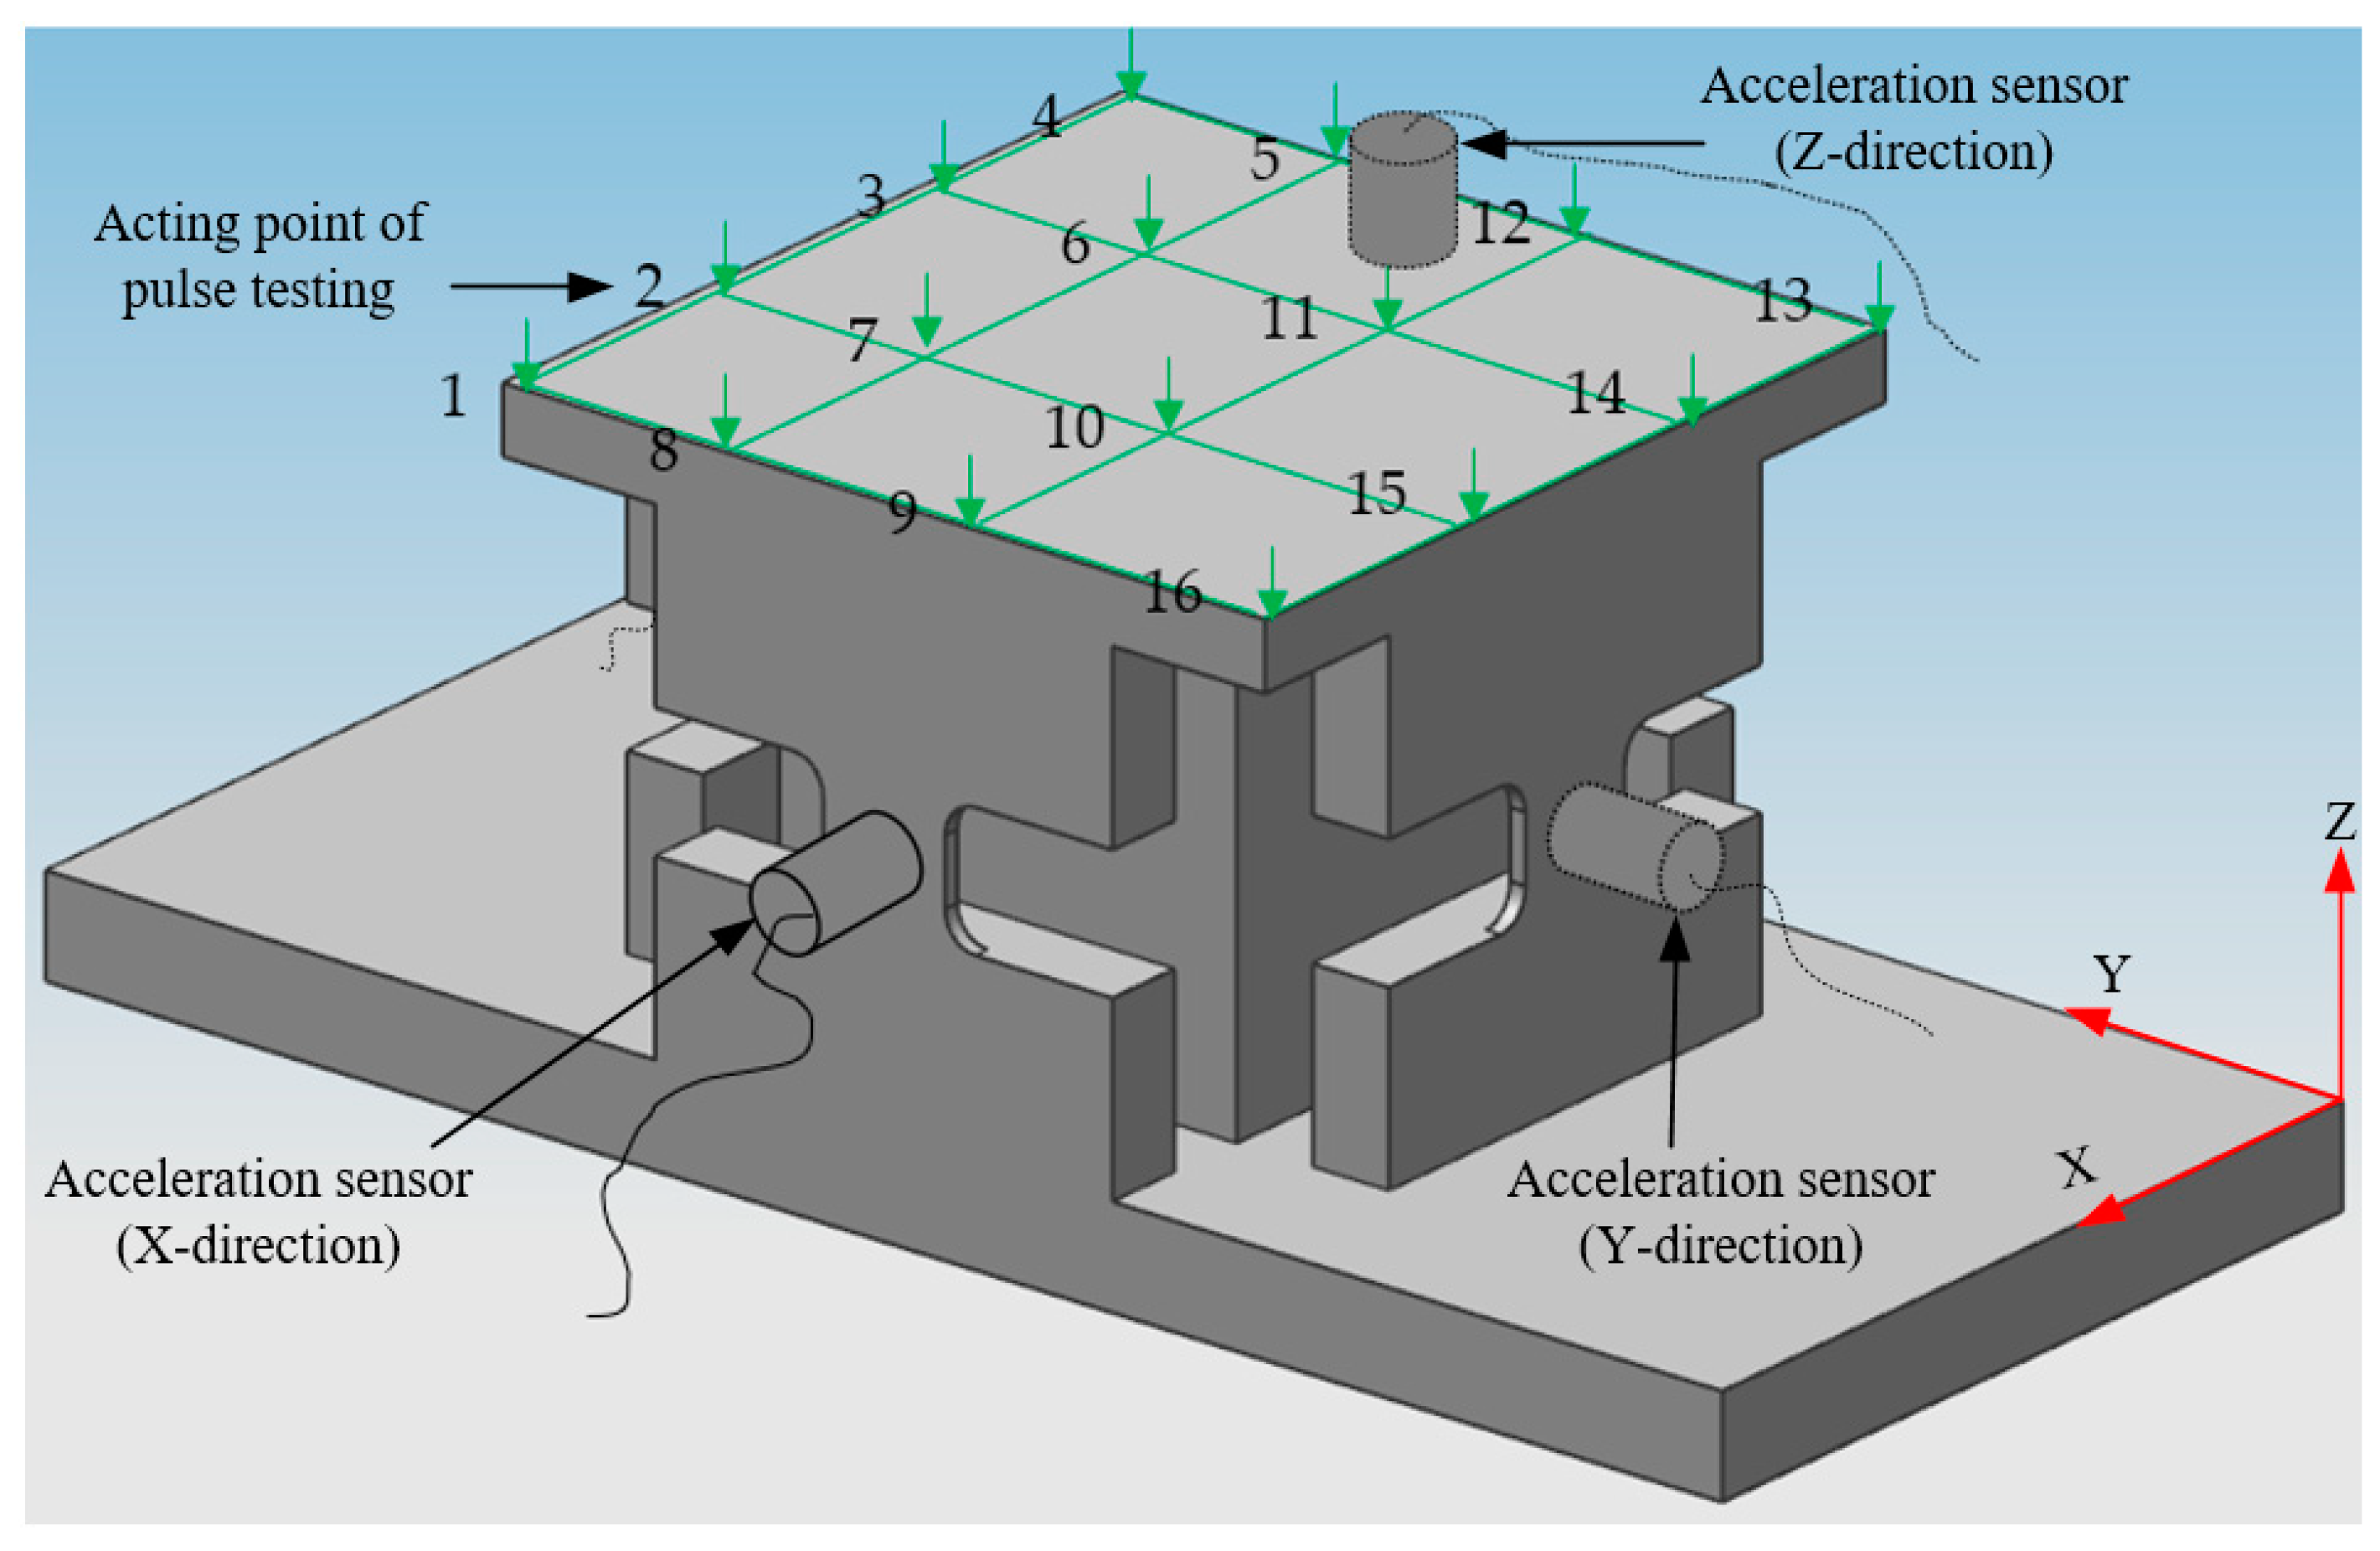
5.1. Experimental Setting

To test the dynamometer performance for in-process measurement, milling forces were measured at high rotational speeds (10,000 r/min~18,000 r/min). Down milling experiments were conducted out on a Mikron UPC 710, which is a five-axis machining center with a maximum rotational speed of 18,000 rpm, a feed rate up to 20 m/min, and a rated power of 15 kW [27]. The end mills are uncoated solid carbide tools with 2 flutes, 10 mm diameter, 0.5 mm nose radius, and 30° helix angle. The workpiece is a 20 × 20 × 4 mm aluminum 2A12 block. Its material is the same as that of the main structure of SGBD. Additionally, for simultaneous cutting force measurements and application of the same cutting conditions, the SGBD was fixed on a Kistler 9265B dynamometer, and then the latter was fixed on the machine tool table (as shown in Figure 8). The experiment setup is shown in Table 3.

5.2. Results and Discussion

Figure 9 shows the cutting forces at the cutting speed of 10,000 r/min measured simultaneously by SGBD and Kistler 9265B dynamometer. There is a good agreement between the cutting force signals in X and Y directions (Fx and Fy) obtained by SGBD and Kistler except for the cutting force signals in the Z direction (Fz), although the cutting force of one flute is smaller than that of another due to the imbalance of the end mill. It seems that the SGBD is better than Kistler in the measurement of cutting force Fz. The maximum cutting forces (Fxmax, Fymax, Fzmax) obtained by SGBD and Kistler are as shown in Figure 10. Where the value of each column shown in the figure indicates the mean value of the maximum cutting force in stable cutting conditions, it was found that there is also a fair agreement for the maximum cutting forces in X and Y directions (Fxmax, Fymax). The difference values between SGBD and Kistler are 2.3%~5.8% in the X direction and 3.5%~8.8% in the Y direction. However, for the maximum cutting forces in the Z direction (Fzmax), the difference values are 17.2%~30.2%. It is the big fluctuation of cutting force in the Z-direction measured by Kistler (as shown in Figure 9c), which results in the bigger difference of Fzmax between SGBD and Kistler. It is mainly because that the natural frequency of the Kistler dynamometer in the Z direction is about 1.6 kHz, which is far less than that of the SGBD (about 9.15 kHz). As to the measurement of high-frequency dynamic force, the frequency content (the higher harmonics) of the milling forces that exceed the bandwidth of the dynamometer may become distorted by its dynamics. When the cutting force (in the Z direction) is small, the Kistler dynamometer is very difficult to acquire the actual force signals because of the signal distortion combined with noise interference. That is why it is difficult to observe clear periodic cutting force signals in the Z direction by the Kistler dynamometer in this test.

6. Conclusions

In this work, a new SGBD with a special structure was designed, manufactured, and put to the test to ensure the measurement of high-frequency dynamic forces in the milling process. The following conclusions can be obtained:
The main structure of the SGBD is symmetrical and consists mainly of a center quadrangular prism surrounded by four force sensing elastic elements, an upper support plate, and a lower support plate. The dynamic identification test indicated that the SGBD′s natural frequency could be stabilized at a high value of 9.15 kHz.
A data acquisition system was devised for the SGBD, which can easily collect and saved the milling force data automatically on a computer during the milling operation. Meanwhile, an innovative conversion matrix model for the dynamometer was established, which can reduce the effects of cross-sensitivity and acting point of force.
The milling forces were measured by the SGBD and a commercial dynamometer (Kistler 9265B) at different rotational speeds. It was found that the difference of cutting forces between SGBD and Kistler are 2.3%~5.8% in the X direction and 3.5%~8.8% in the Y direction. However, due to the big fluctuation measured by Kistler and small values result from the given cutting conditions, the difference of cutting forces between SGBD and Kistler are 17.2%~30.2% Z direction. The experimental results show that the SGBD can be used reliably to measure dynamic milling forces at high rotational speeds.
To sum up, compared with commercially available PPBDs, the SGBD proposed in this paper is simple in construction, low in cost, but high in natural frequency, and can fulfill the requirement to measure high-frequency dynamic forces in the milling process. It is, therefore, a good choice with no need for choosing the PPBDs with a high natural frequency.

Author Contributions

Conceptualization, Y.L. and M.J.; methodology, Y.L.; software, D.Y.P.; validation, Y.L., N.H., and M.K.G.; formal analysis, D.Y.P.; investigation, Y.L.; resources, N.H.; data curation, Y.L.; writing—original draft preparation, N.H.; writing—review and editing, M.J.; visualization, Y.L.; supervision, N.H.; project administration, N.H.; funding acquisition, M.J. All authors have read and agreed to the published version of the manuscript.

Funding

The authors would like to thank the National Natural Science Foundation of China for financial support under Grant No. 51975289.

Institutional Review Board Statement

Not applicable.

Informed Consent Statement

Not applicable.

Data Availability Statement

Not applicable.

Conflicts of Interest

The authors declare no conflict of interest.

References

  1. Jamil, M.; He, N.; Zhao, W.; Li, L.; Gupta, M.K.; Sarikaya, M.; Mashood Khan, A.; Singh, R. Heat Transfer Efficiency of Cryogenic-LN2 and CO2-snow and their application in the Turn-ing of Ti-6AL-4V. Int. J. Heat Mass Transf. 2021, 166, 120716. [Google Scholar] [CrossRef]
  2. Korkut, I. A dynamometer design and its construction for milling operation. Mater. Des. 2003, 24, 631–637. [Google Scholar] [CrossRef]
  3. Yaldız, S.; Ünsaçar, F. Design, development and testing of a turning dynamometer for cutting force measurement. Mater. Des. 2006, 27, 839–846. [Google Scholar] [CrossRef]
  4. Yaldiz, S.; Ünsaçar, F.; Sağlam, H.; Işık, H. Design, development and testing of a four-component milling dynamometer for the measurement of cutting force and torque. Mech. Syst. Signal Process. 2007, 21, 1499–1511. [Google Scholar] [CrossRef]
  5. Rizal, M.; Ghani, J.; Nuawi, M.Z.; Haron, C.H.C. Development and testing of an integrated rotating dynamometer on tool holder for milling process. Mech. Syst. Signal Process. 2015, 52, 559–576. [Google Scholar] [CrossRef]
  6. Rizal, M.; Jaharah AGhani, J.A.; Nuawi, M.Z.; Haron, C.H.C. An embedded multi-sensor system on the rotating dynamometer for real-time condition monitoring in milling. Int. J. Adv. Manuf. Technol. 2018, 95, 811–823. [Google Scholar] [CrossRef]
  7. Pathri, B.P.; Garg, A.K.; Unune, D.R.; Mali, H.S.; Dhami, S.S.; Nagar, R. Design and fabrication of a strain gauge type 3-axis milling tool dynamometer: Fabrication and Testing. Int. J. Mater. Form. Mach. Process. 2016, 3, 1–15. [Google Scholar] [CrossRef]
  8. Qin, Y.; Zhao, Y.; Li, Y.; Zhao, Y.; Wang, P. A novel dynamometer for monitoring milling process. Int. J. Adv. Manuf. Technol. 2017, 92, 2535–2543. [Google Scholar] [CrossRef]
  9. Gomez, M.F.; Schmitz, T.L. Displacement-based dynamometer for milling force measurement. Procedia Manuf. 2019, 34, 867–875. [Google Scholar] [CrossRef]
  10. Kang, I.; Kim, J.; Hong, C.; Kim, J. Development and evaluation of tool dynamometer for measuring high frequency cutting forces in micro milling. Int. J. Precis. Eng. Manuf. 2010, 11, 817–821. [Google Scholar] [CrossRef]
  11. Transchel, R.; Stirnimann, J.; Blattner, M.; Bill, B.; Thiel, R.; Kuster, F.; Wegener, K. Effective dynamometer for measuring high dy-namic process force signals in micro machining operations. Procedia CIRP 2012, 1, 558–562. [Google Scholar] [CrossRef]
  12. Totis, G.; Wirtz, G.; Sortino, M.; Veselovac, D.; Kuljanic, E.; Klocke, F. Development of a dynamometer for measuring individual cutting edge forces in face milling. Mech. Syst. Signal Process. 2010, 24, 1844–1857. [Google Scholar] [CrossRef]
  13. Totis, G.; Sortino, M. Development of a modular dynamometer for triaxial cutting force measurement in turning. Int. J. Mach. Tools Manuf. 2011, 51, 34–42. [Google Scholar] [CrossRef]
  14. Totis, G.; Adams, O.; Sortino, M.; Veselovac, D.; Klocke, F. Development of an innovative plate dynamometer for advanced milling and drilling applications. Measurement 2014, 49, 164–181. [Google Scholar] [CrossRef]
  15. Castro, L.R.; Viéville, P.; Lipinski, P. Correction of dynamic effects on force measurements made with piezoelectric dynamom-eters. Int. J. Mach. Tools Manuf. 2006, 46, 1707–1715. [Google Scholar] [CrossRef]
  16. Auchet, S.; Chevrier, P.; Lacour, M.; Lipiński, P.; Lipinski, P. A new method of cutting force measurement based on command voltages of active electro-magnetic bearings. Int. J. Mach. Tools Manuf. 2004, 44, 1441–1449. [Google Scholar] [CrossRef]
  17. Tounsi, N.; Otho, A. Dynamic cutting force measuring. Int. J. Mach. Tools Manuf. 2000, 40, 1157–1170. [Google Scholar] [CrossRef]
  18. Jullien-Corrigan, A.; Ahmadi, K. Measurement of high-frequency milling forces using piezoelectric dynamometers with dy-namic compensation. Precis. Eng. 2020, 66, 1–9. [Google Scholar] [CrossRef]
  19. Zhao, W.; Sun, Y.H.; He, N. A Novel Milling Dynamometer for High Frequency Three-Dimensional Dynamic Milling Forces. In Proceedings of the 9th International Conference on High Speed Machining (HSM), San Sebastián, Spain, 7–8 March 2012. [Google Scholar]
  20. Huang, Z.; Zhao, W.; He, N.; Li, L. Structure Optimization Design and Application of a Strain Based Dynamometer. Mater. Sci. Forum 2013, 770, 385–390. [Google Scholar] [CrossRef]
  21. Niu, Z.; Zhang, B.; Wang, J.; Liu, K.; Chen, Z.; Yang, K.; Zhou, Z.; Fan, Y.; Zhang, Y.; Ji, D.; et al. The research on 220GHz multicarrier high-speed communication system. China Commun. 2020, 17, 131–139. [Google Scholar] [CrossRef]
  22. Jin, W.L.; Zhao, Y.J.; He, N. Strain gauge based force measurement sensor with additional elastic elements and its design. China Patent CN 86103169, 1986. (In Chinese). [Google Scholar]
  23. Niu, Z.; Zhang, J.; Zhang, B.; Zhou, Z.; Lixin, A.; Wang, Y.; Chen, X.; He, Y.; Hu, Y.; Chen, X. A 400 GHz Broadband Multi-Branch Waveguide Coupler. In Proceedings of the 2019 12th UK-Europe-China Workshop on Millimeter Waves and Terahertz Technologies (UCMMT), London, UK, 20–22 August 2019; pp. 1–2. [Google Scholar] [CrossRef]
  24. Karabay, S. Design criteria for electro-mechanical transducers and arrangement for measurement of strains due to metal cutting forces acting on dynamometers. Mater. Des. 2007, 28, 496–506. [Google Scholar] [CrossRef]
  25. Wang, S.Z.; Zhao, W.; Huang, Z.; He, N.; Li, L.; Yang, Y.F. A New Conversion Matrix Model of Strain-Gage Dynamometer. Mater. Sci. Forum 2014, 800, 363–367. [Google Scholar] [CrossRef]
  26. Dong, Q.; Cui, L. Reliability analysis of a system with two-stage degradation using Wiener processes with piecewise linear drift. IMA J. Manag. Math. 2020, 32, 3–29. [Google Scholar] [CrossRef]
  27. Jamil, M.; Khan, A.M.; Gupta, M.K.; Mia, M.; He, N.; Li, L.; Sivalingam, V. Influence of CO2-snow and subzero MQL on thermal aspects in the machining of Ti-6Al-4V. Appl. Therm. Eng. 2020, 177, 115480. [Google Scholar] [CrossRef]
Figure 1. A schematic illustration of the milling force measurement systems.
Machines 09 00011 g001
Figure 2. Schematic diagram of the main structure.
Machines 09 00011 g002
Figure 3. The strain gauges in dynamometer design involving (a). Distribution of strain gauges (b). Bridge connections of strain gauges for Fx, Fy, and Fz.
Machines 09 00011 g003
Figure 4. The strain gauge-based dynamometer design involves (a). Decomposition of the main structure (b). Physical model of the main structure.
Machines 09 00011 g004aMachines 09 00011 g004b
Figure 5. The Three-dimensional forces measurement through dynamometer in (a). Fx, (b). Fy, and (c). Fz directions.
Machines 09 00011 g005aMachines 09 00011 g005b
Figure 6. Schematic diagram of the pulse test.
Machines 09 00011 g006
Figure 7. Frequency response function (FRF) and phase response function of the main structure in (a) X- direction (b). Y-direction (c). Z-direction.
Machines 09 00011 g007aMachines 09 00011 g007b
Figure 8. Principle of cutting force measurement.
Machines 09 00011 g008
Figure 9. Cutting force signals obtained by strain-gauge-based dynamometer (SGBD) and Kistler (10,000 r/min), (a) cutting force signals in X direction Fx (b) cutting force signals in Y direction Fy (c) cutting force signals in Z direction Fz.
Machines 09 00011 g009
Figure 10. The maximum cutting forces were obtained by SGBD and Kistler (10,000~18,000 r/min).
Machines 09 00011 g010
Table 1. Properties of aluminum alloy 2A12.
PropertiesValues
Density2.78 kg/m3
Poisson ratio0.33
Modulus of elasticity73 GPA
Tensile strength410 MPa
Yield strength265 MPa
Hardness115 HB
Table 2. The dimension of each part and its relationship with the natural frequency of the main structure.
Dimension of Each Part of the Main StructureDimension
(mm)
Relation to the Natural Frequency
Length of the quasi-rigid part l230Inversely proportional
Length of the thin elastic part l38Inversely proportional
Length of the thick elastic part l511Inversely proportional
Cross-section area of the quasi-rigid part A2(a2 × b2)30 × 30Proportional
Cross-section area of the thin elastic part A3(a3 × b3)8 × 1Proportional
Cross-section area of the thick elastic part A5(a5 × b5)30 × 5Inversely proportional
Volume of the upper support plate V1(a1 × b1 × l1)48 × 48 × 4Inversely proportional
Volume of the lower support plate V4(a4 × b4 × l4)48 × 100 × 8Inversely proportional
Table 3. The experiment setup.
Cutting ParametersMachine ToolCutting ToolWorkpieceDynamometers
n
(r/min)
fz
(mm/z)
ae
(mm)
ap
(mm)
10,0000.10.50.5Mikron UPC 710 machining center, maximum rotational speed of 18,000 rpm, maximum feed of 20 m/min [27].Solid carbide end mills, diameter: 10 mm, 2 flutes, nose radius: 0.5 mm, helix angle: 30°.Material: 2A12 aluminum alloy, overall size: 20 × 20 × 4 mmSGBD
/
Kistler 9265B
12,0000.10.50.5
15,0000.10.50.5
18,0000.10.50.5
Publisher’s Note: MDPI stays neutral with regard to jurisdictional claims in published maps and institutional affiliations.

