1. Introduction
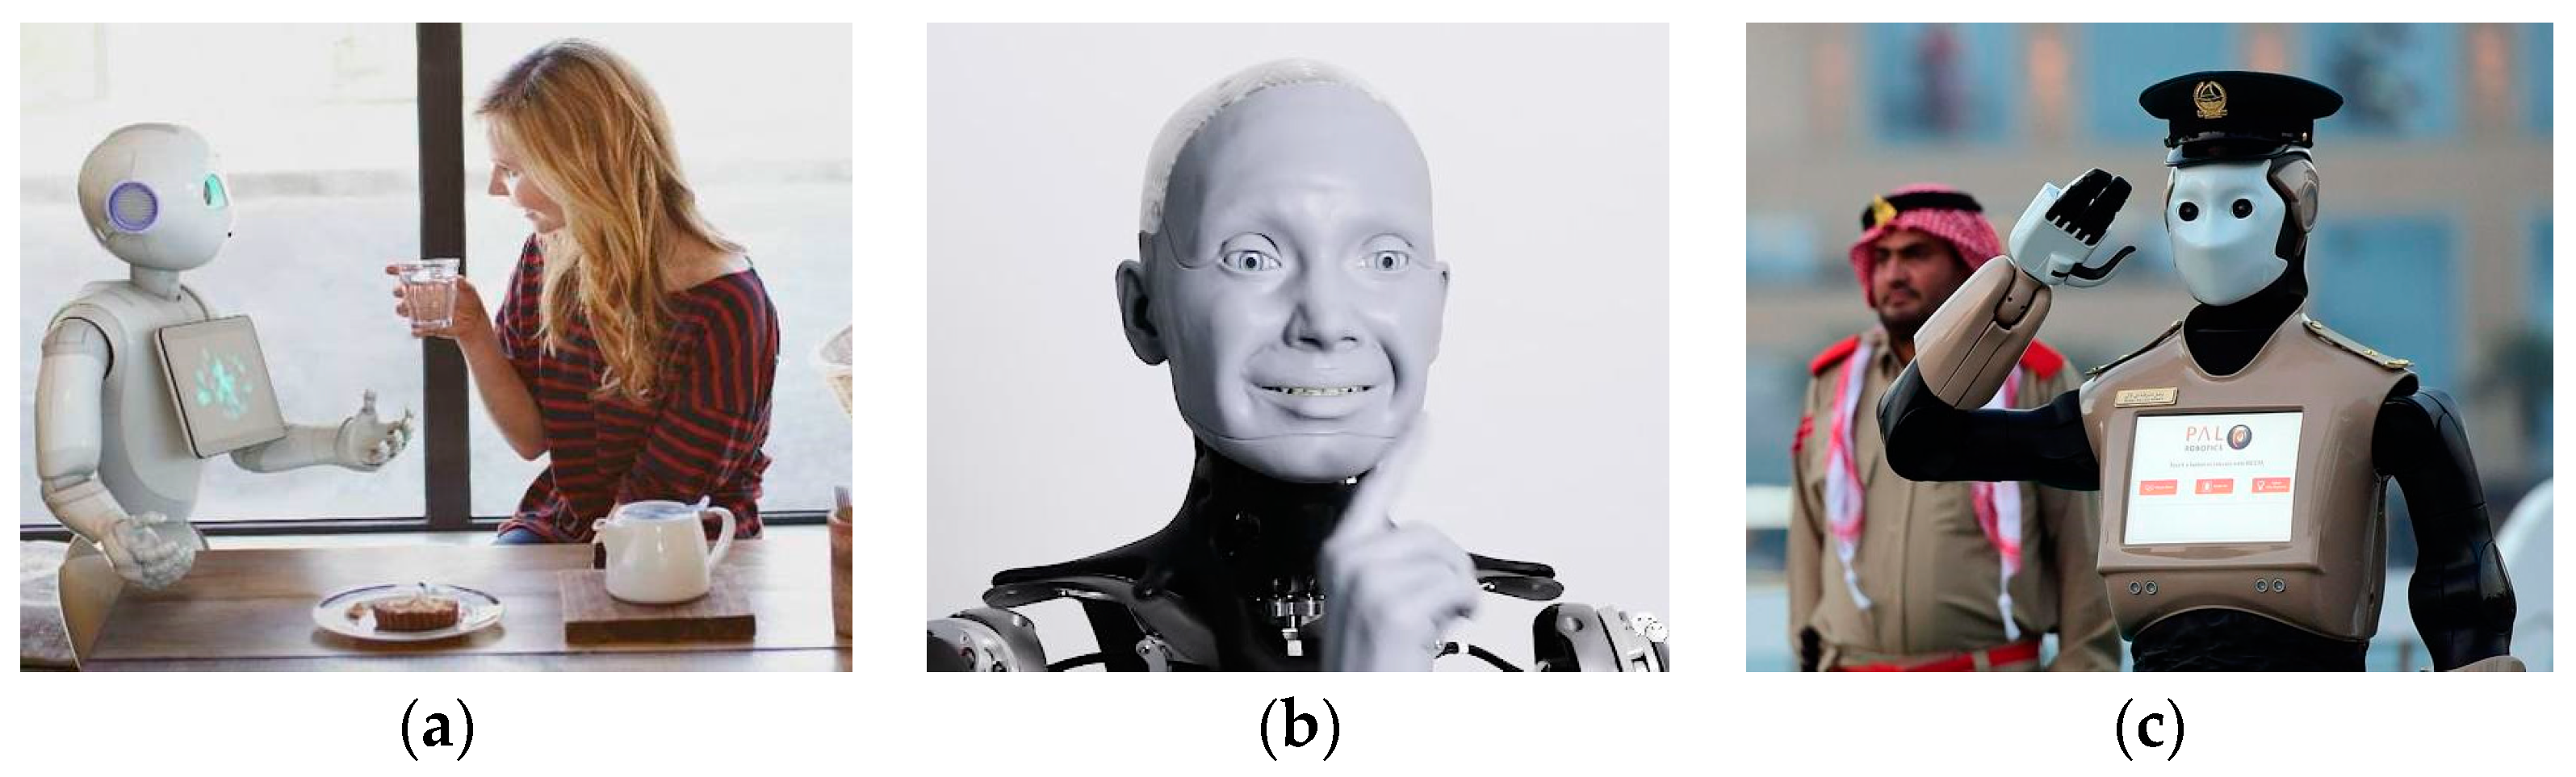
With the advent of the intelligence era and experience economy, it is highly important for robots to communicate with humans through humanoid emotions and behaviors to complete their tasks in public daily life, which can promote harmonious human–robot interactions. Robots can communicate with humans in three ways, namely, speech [
1], facial expressions [
2], and gestures [
3], as shown in
Figure 1. Although the most effective emotion transmission method may be based on facial expressions [
4], body movement can express richer emotions in daily communication interaction [
5]. Body movement can not only combine with face expressions to transmit emotion information, but it can also help to identify the information conveyed by ambiguous facial expression [
6]. Through body movement expressions, robots can influence and change the ideological state of human partners [
7] and can also directly or indirectly change their decisions [
8].
In this situation, the effective emotion expression of robots through body movements can be varied by controlling the motion behaviors of robots [
9,
10]. At present, the related research on emotion expression of robots through body movements mainly focuses on how to design the motion behaviors of robot to express emotions. Pollick et al. [
11] distinguished different basic emotions by observing human arm motions and used the motion capture system to obtain the position information of experimenters’ human arms. Camurri et al. [
12] identified different emotions from dance performances, and the motion characteristics of these emotions were described when experimenters completed different tasks as required. Wallbott et al. [
13] summarized gestures and body motions according to different emotions. Nayak et al. [
14] designed robot models through computer technology, and the body movements in various states were simulated to express specific emotions. Sial et al. [
15] established a relationship model between the motion parameters (speed and acceleration) of a robot and the emotion valence, arousal, and dominance. Wei et al. [
16] established a three-dimensional emotion space based on motion indexes, and a relationship model between the motion indexes and eight emotions in the three-dimensional emotion space was established. However, the above research on expressing emotions by designing the motion behaviors of robots only defined several solidified main emotion types based on dimensional emotion space such as PAD emotion space. The emotion types did not really form a mapping relationship with the motion behaviors of robots, and the ability of emotion expression of robots through body movements could be limited.
Nevertheless, when humans were stimulated by the external environment, their emotion states and personality characteristics can be expressed spontaneously or consciously through body movements to form body language, but if robots want to produce personalized emotions and express emotions automatically through body movements when stimulated by the external environment like a human, artificial emotion models must be established. At present, most of the artificial emotion models combine machine learning algorithms with dimensional emotion theory. Picard [
17] proposed the hidden Markov emotion model, which can capture emotion changes exhibited by external states such as changes in facial expressions, heart rate changes, voice fluctuations, and so on. Kestern et al. [
18] established a distributed emotion state model based on neural network algorithms for event processing, which could convert the external emotion events into corresponding emotion states by using neural network algorithms. Samani et al. [
19] proposed a composite artificial emotion system, which consisted of three modules: probability-based emotion matching (PLA), emotion-based artificial endocrine system (AES), and emotion state transition (AST). Broekens and Jacobs [
20] proposed an emotion model based on reinforcement learning theory, which aimed to calculate the relationship between human adaptive behavior and emotion. Esteban et al. [
21] proposed an autonomous emotion model, which was divided into three parts: emotion generation, mood model, and behavior selection. However, the above artificial emotion models were abstract models, and the artificial emotion models were not quantified and could not be applied to the motion planning of robots, so that a quantitative relationship between the motion behaviors of robot and artificial emotion models could not be established to realize human–robot emotion interactions.
The focus of this research was to establish a quantifiable artificial emotion expression method based on the motion behaviors of robot (mainly for robotic arms) to realize human–robot emotion interactions. In this paper, an artificial emotion expression method that accords with human emotion and that can deal with external stimuli and has the ability of emotion decision-making was proposed based on the motion behaviors of robots. The main contributions of the paper can be summarized as follows:
A three-dimensional emotion space was established based on the motion indexes (deviation coefficient, acceleration, and interval time). The emotion quantification of the degree of similarity or difference between emotion states could be obtained by using the coordinate information of the deviation coefficient, acceleration, and interval time in the three-dimensional emotion space.
An artificial emotion model, which can respond to external stimuli automatically, was established in the three-dimensional emotion space. Furthermore, personality and mood models were introduced in the artificial emotion model to achieve personalized emotion responses through body movements.
A discretization method of the emotion response vectors was proposed, and emotion intensity was calculated on the basis of specific emotion types.
Human–robot emotion interaction experiments were carried out by combining the motion behavior of a humanoid robot NAO with the artificial emotion model. The experimental results showed that the personalized emotion responses through body movements could be generated autonomously for external stimuli, and the change process of human emotions could be simulated effectively according to the established artificial emotion model.
2. Designing Motion Behaviors of Robots Based on Motion Primitives
The motion primitives in human arm motion can not only explain the rules of human arm motion and improve human cognition of their own motion, but they can also serve as carriers to transfer the motion experience from a human arm to a robotic humanoid arm, so that the humanoid arm has humanoid motion characteristics. The human arm’s motion primitives provide a new idea for designing motion behaviors of humanoid arms [
16].
2.1. The Structure and Motion Expression of the Human Arm
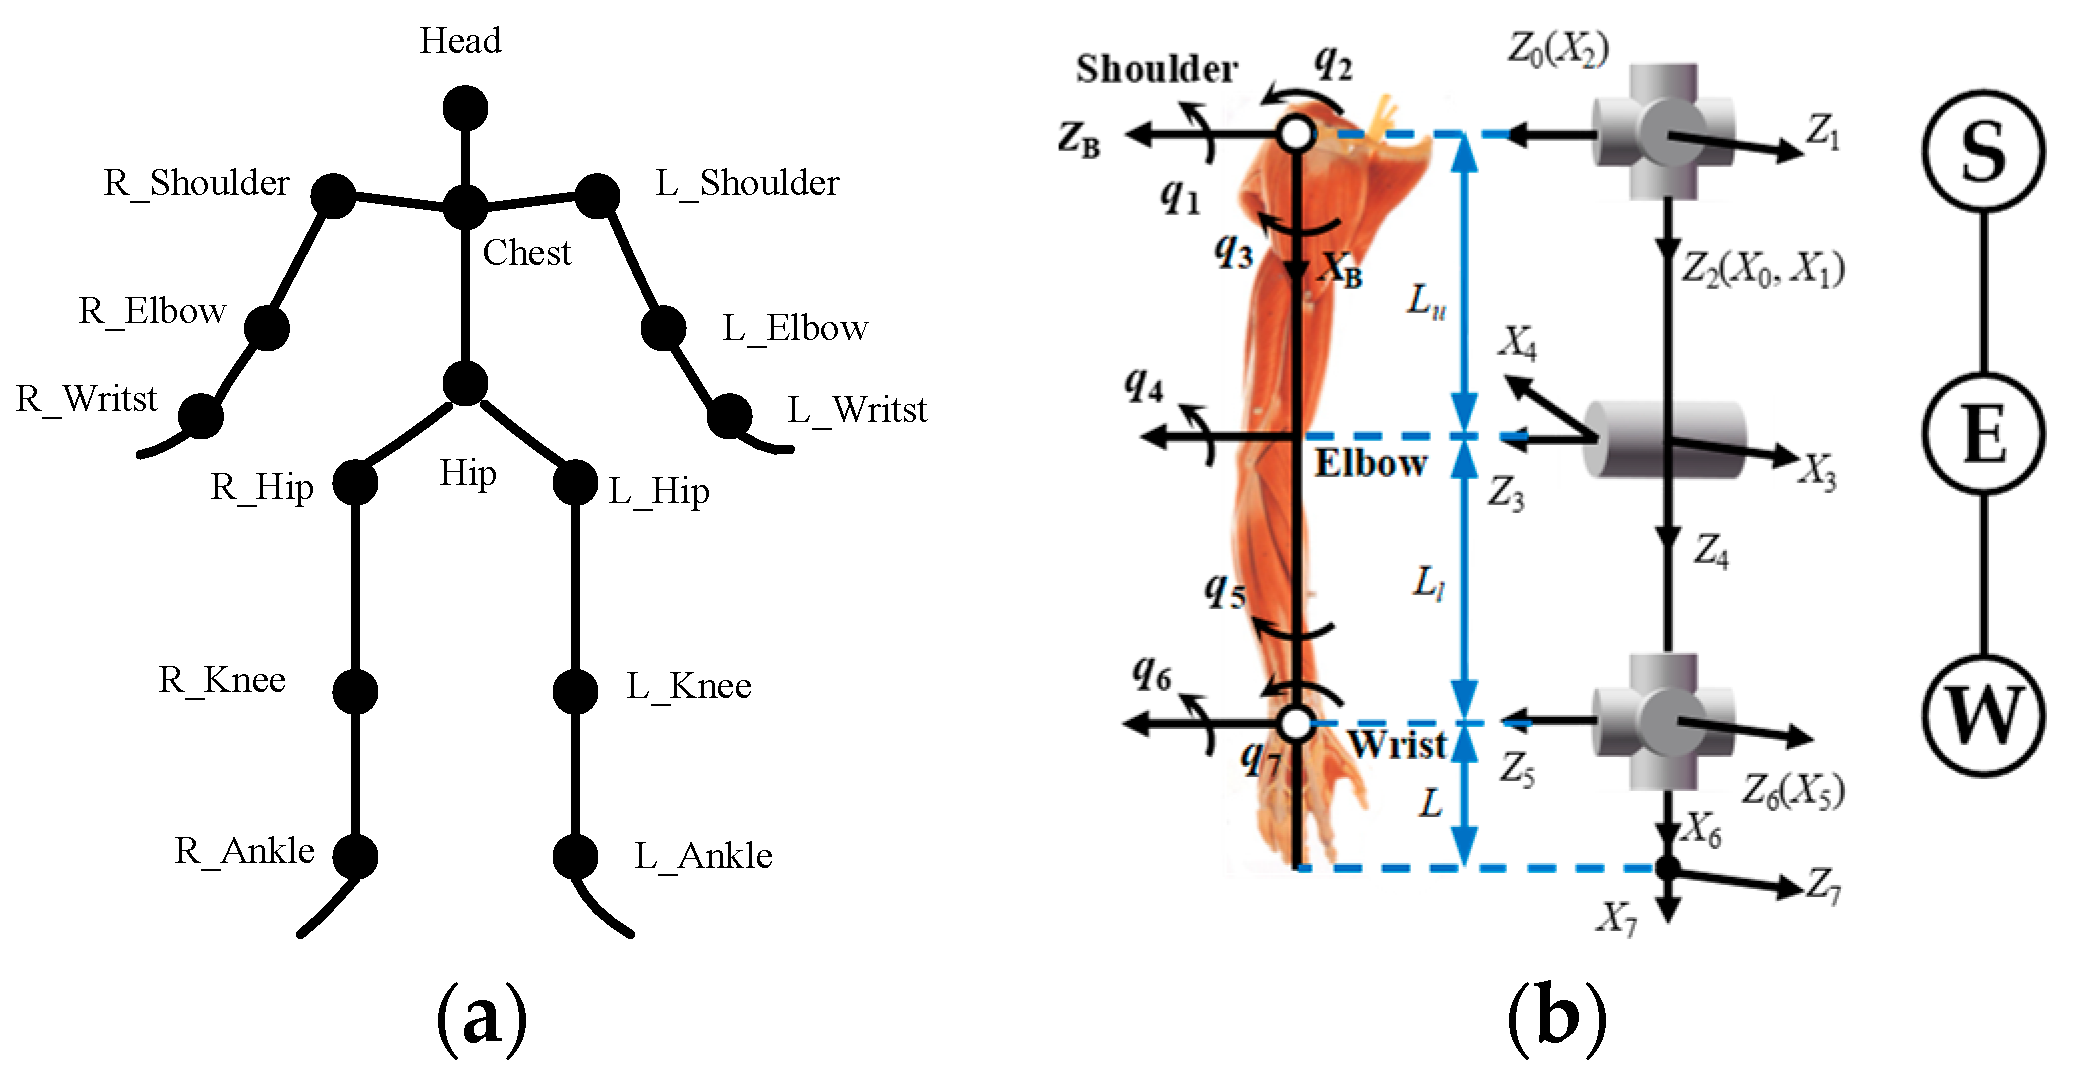
The structure of the human body can be described in the form of a tree diagram as shown in
Figure 2a. The nodes in the tree represent the physiological joints of the human body, such as shoulder joints, elbow joints, etc. There are two attributes on each node: the position (R) attribute and the posture (P) attribute. The posture attribute represents the change of joint posture, while the position attribute represents the change of joint position.
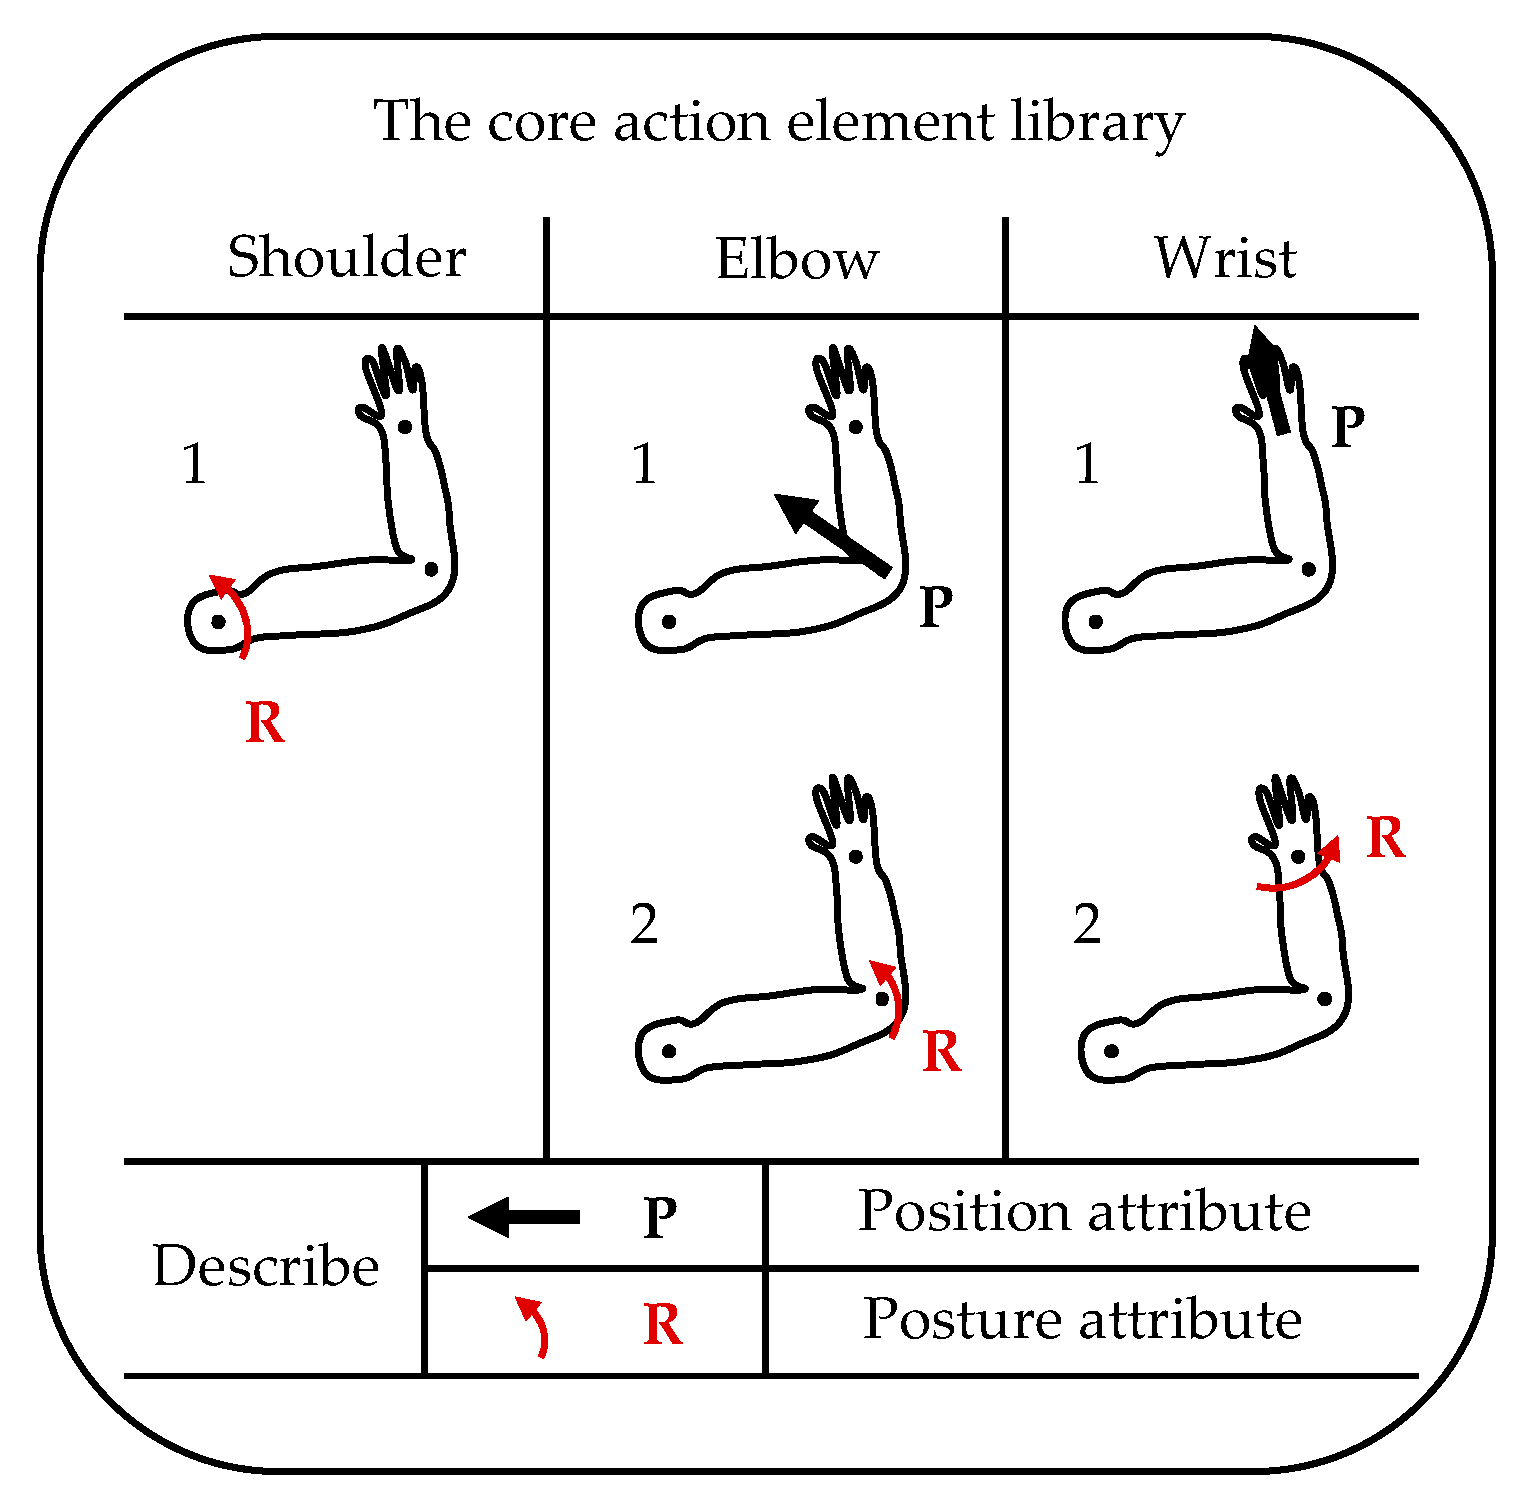
The details of node attributes are shown in
Figure 3. The structure of the human arm in this paper is described in the form of a tree diagram with three nodes representing the shoulder joint (S), elbow joint (E), and wrist joint (W), as shown in
Figure 2b. Five core motion elements, namely, S
R, E
P, E
R, W
P, and W
R, were set. These five motion elements corresponded to different attributes of different joints.
2.2. The Extraction of Motion Primitives
A total of ten motion primitives was extracted in our previous work, as shown in
Table 1. These motion primitives can be divided into two types: movement motion primitive (MMP), and function motion primitive (FMP). Movement motion primitives describe the natural motion of the arm when the arm end position changes. Function motion primitives describe special motions with constant end positions, such as obstacle avoidance and self-motion. As shown in
Table 1, the node refers to the motion primitives with active changes in physiological joints, that is, changes in the posture attributes. The degree of freedom represents the maximum degree of freedom of the motion primitive. Its degree of freedom configurations are shown in
Figure 2b (3 degrees of freedom for the shoulder, 1 degree of freedom for the elbow, and 3 degrees of freedom for the wrist).
2.3. The Realization of Motion Primitives
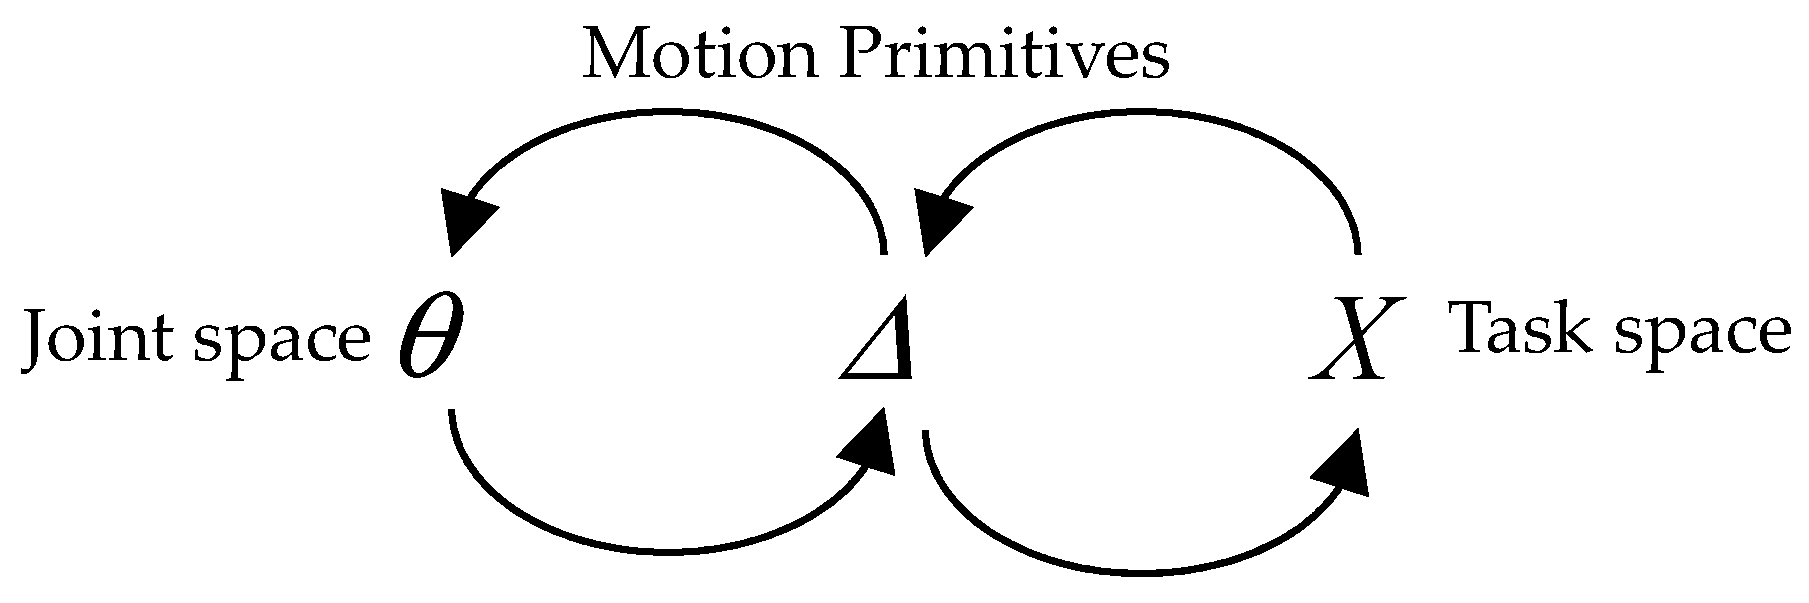
The motion primitives combine the joint and task space, as shown in
Figure 4. The next section will show the trigger conditions and specific motion form of each motion primitive.
MMP-1 SREPWP: This primitive represents the motions of shoulder joint around its rotation axis. Only the positions of the elbow and wrist change in the process of motion. At the same time, the distance between the shoulder and target point should be the same as the distance between the shoulder and wrist.
MMP-2 EPWP: This primitive represents the motions of flexion and extension of the elbow. The target point should lie in the human arm’s triangle plane constructed by the wrist, elbow, and shoulder. At the same time, the distance between the elbow and target point should be the same as the distance between the elbow and wrist.
MMP-3 SREPRWP: This primitive represents the reaching point motions without considering the change of elbow posture attribute. At the same time, the distance between the shoulder and target point should not be the same as the distance between the shoulder and wrist. Furthermore, the distance between the elbow and target point should be not the same as the distance between the elbow and wrist.
MMP-4 SREPWPR: This primitive represents the motions that only the angle between the lower arm and upper arm remains unchanged in the process of motion. The distance between the shoulder and target point should be the same as the distance between the shoulder and wrist.
MMP-5 SRWP: This primitive represents the motion of shoulder joint rotation with the big arm as the rotation axis. The attributes of the elbow joint have not changed, so the primitive is composed of the influence of the element generation by generation. According to the intergenerational transmission, the change of shoulder posture drives the wrist motion.
MMP-6 SRWPR: The motion represented by this motion primitive is similar to MMP-5. However, the difference is that the wrist joint changes its position while its posture attributes change actively during the motion.
MMP-7 EPWPR: The motion described by this motion primitive is similar to MMP-2. However, the difference is that the wrist joint changes its position while its posture attributes change actively during the motion.
MMP-8 SREPRWPR: The motion represented by the motion primitive is mainly driven by the shoulder joint, elbow joint, and wrist joint. The attributes of each motion element have changed.
FMP-1,2 SREPWR and WR: The robots detect the obstacle and re-plan the planned joint trajectories through the self-motion that can be described by these two primitives.
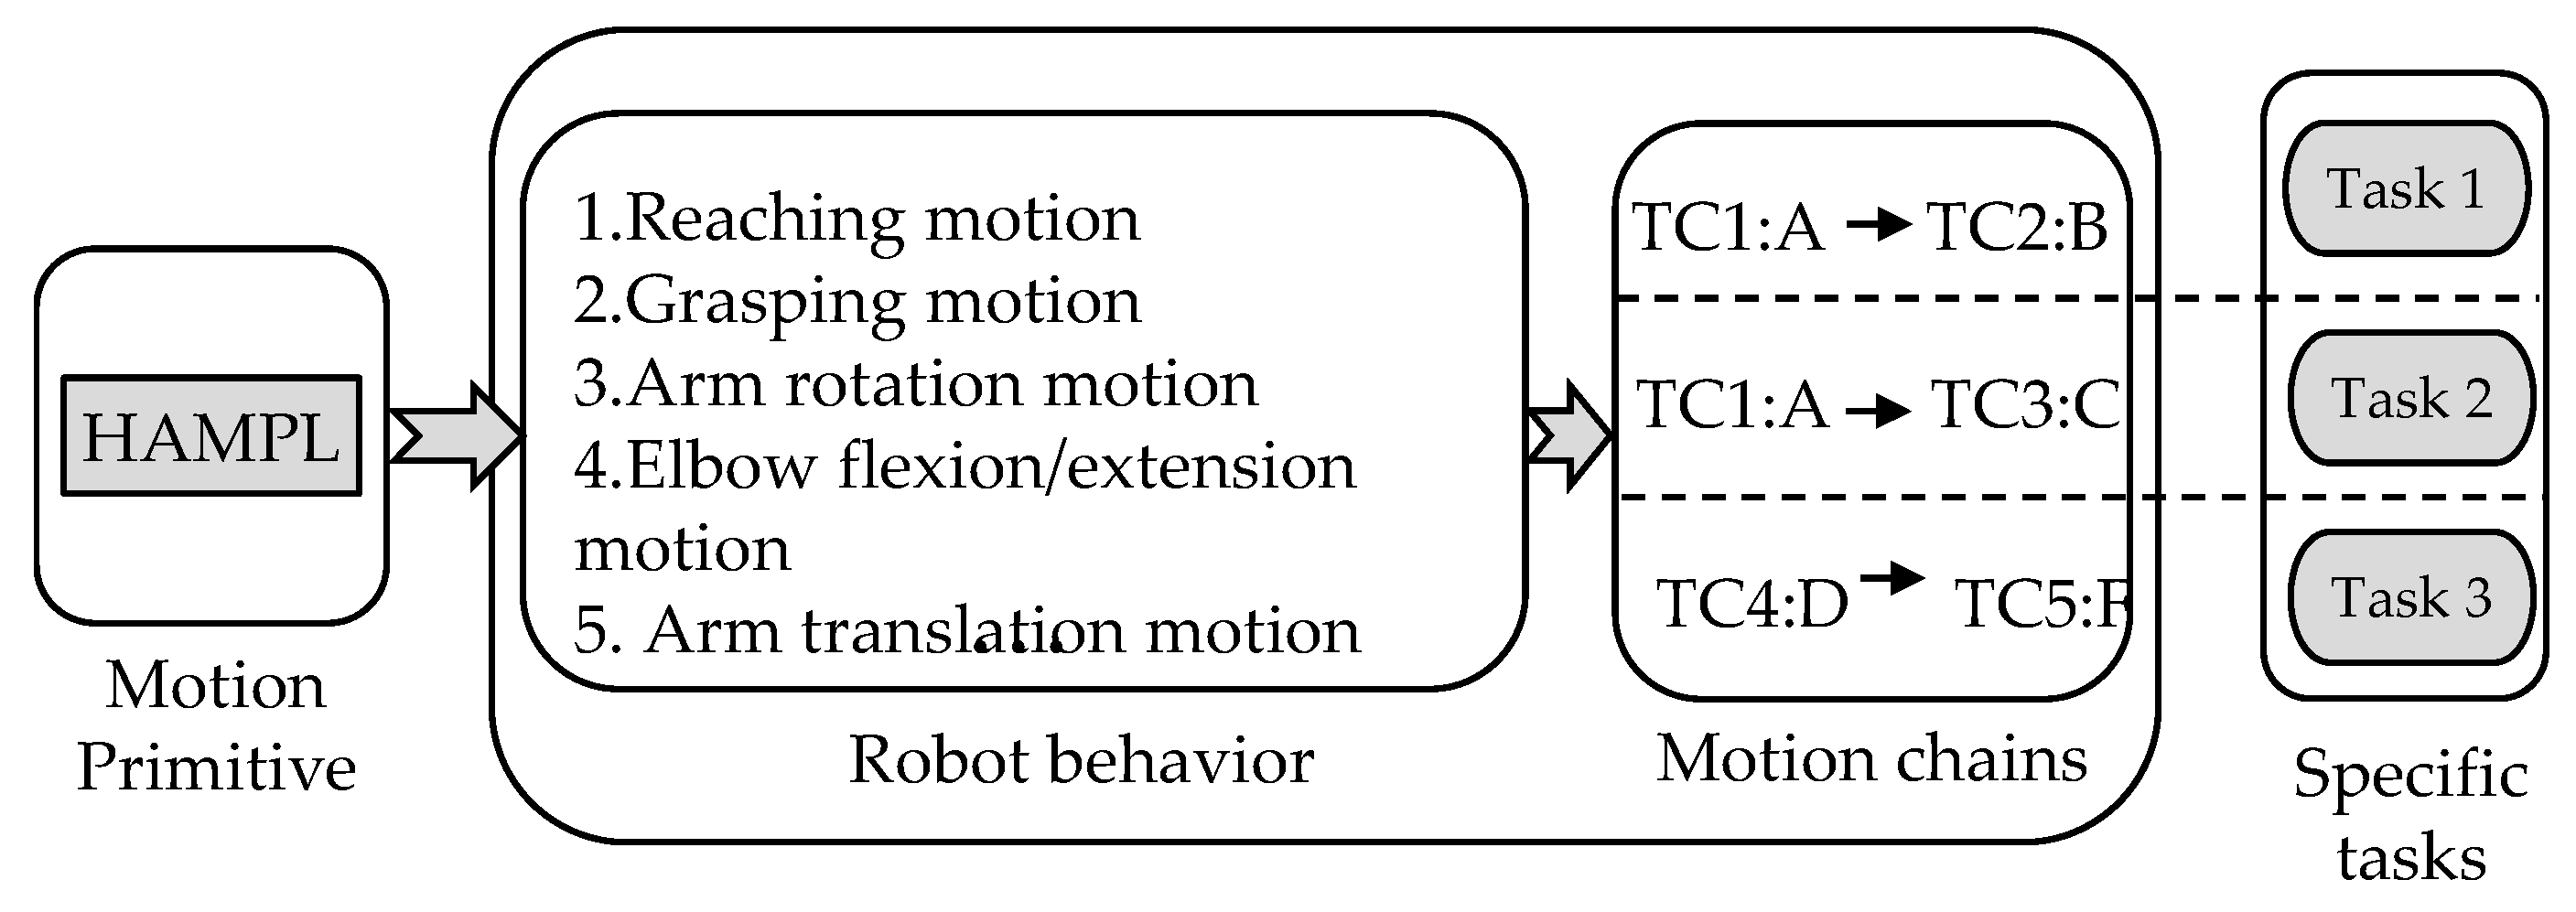
The design of the behaviors of the robot through motion primitives has the following two advantages: (1) Various human arm motions can be simulated by robots. (2) This method classifies the robot’s motion to generate robot humanoid motion, which reduces the amount of calculation of robot humanoid motion. At the same time, the robot can perform multiple tasks by selecting the different motion primitives, as shown in
Figure 5.
3. Three-Dimensional Emotion Space Based on Motion Indexes
In this paper, a new emotion dimension space to express different emotions was proposed based on the above studies. Three motion indexes, namely,
D,
A, and
T, were extracted from human motion characteristics, as shown in
Table 2. The motion index
D is a deviation coefficient that represents the magnitude of arm pose deviation from the standard pose. When the arm pose is predicted, the emotions are usually not taken into account. At this time, the arm pose without considering emotions can be defined as the standard pose. The standard pose can be obtained from indexes [
22] or other methods [
23]. The motion index
A is acceleration, which represents wrist acceleration. The motion index
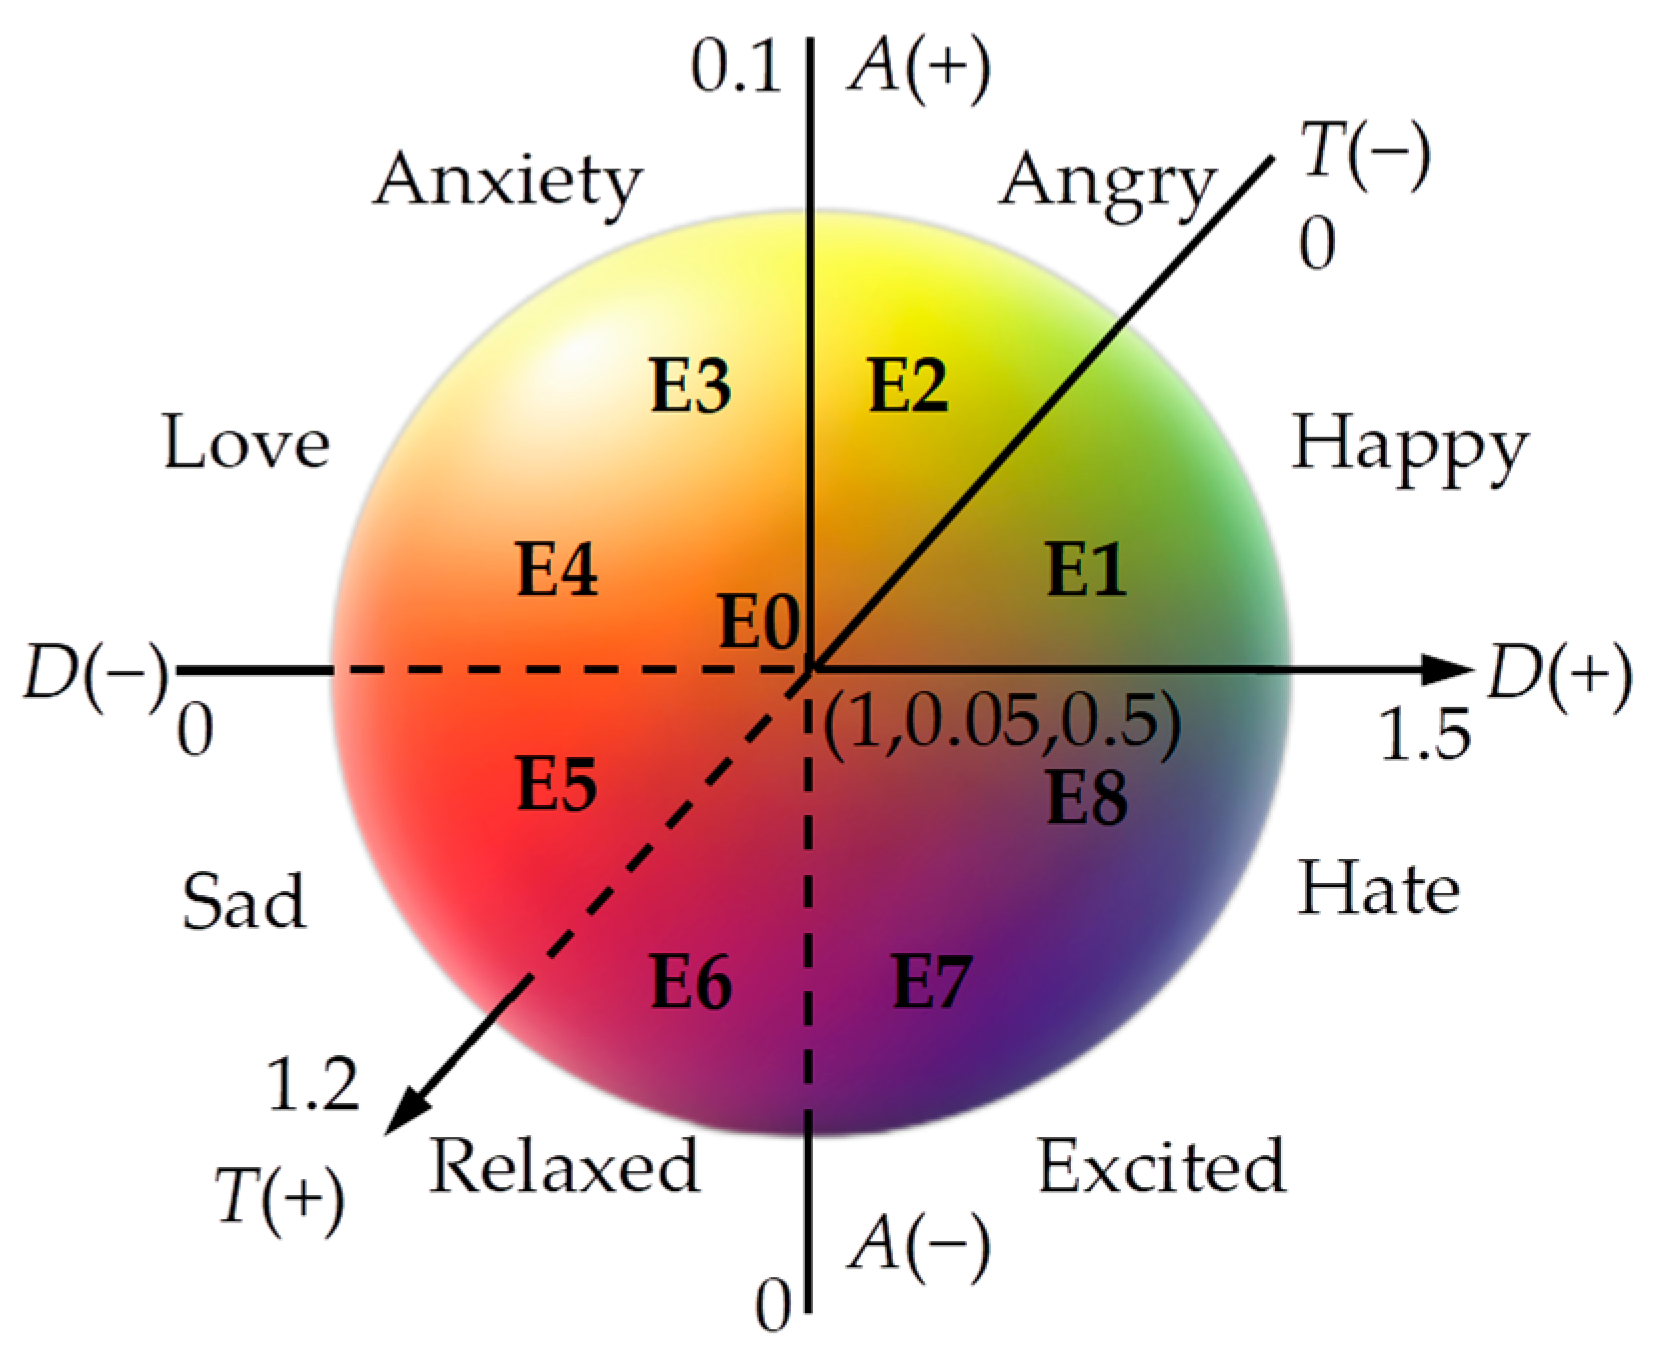
T is the interval time, which represents the time interval between two motions. The emotion quantification of the degree of similarity or difference between emotion states can be obtained by using the coordinate information of the deviation coefficient, acceleration, and interval time in the three-dimensional emotion space, as shown in
Figure 6. The three-dimensional emotion space could be defined as DAT emotion dimension space in this paper.
As shown in
Figure 6, the three dimensions of the DAT emotion dimension space are the three motion indexes, the coordinates or vectors of the emotion state are represented by
e = [D, A, T], and the origin of the three-dimensional coordinate system is
. Relative to the origin of the coordinate system, the increase is indicated by the symbols “+”, and the decrease relative to the origin of coordinate system is indicated by the symbols “−”. These three motion indexes divide the dimension space into eight subspaces. One of the original emotions is represented by each subspace. The original emotions are derived from the emotion theory of Plutchik [
24], the eight basic emotions of the emotion theory of Plutchik are improved according to the motion behaviors of the robot, and the motion behaviors of the robot could be reflected by the motion indexes. The parameters of each subspace are shown in
Table 3.
The parameters of each subspace in
Table 3 can be obtained through the human motion experiments. In total, 30 students and 10 teachers majoring in acting were invited to participate in experiments. Furthermore, they randomly completed any task (walking, grasping, talking, and so on) with any of the eight original emotions shown in
Figure 6 in the human motion experiments. The motion information could be obtained through a motion capture system. A total of 4000 sets of motion data was collected in this paper (the more motion data collected, the more accurate the parameters of each subspace), and the motion data could be analyzed by the LMA method [
25,
26]. The differences of the motion behavior in different emotion states were discovered and obtained from the three-dimensional motion data of actors. Then these behavior differences can be reflected by the different combinations of the three motion indexes. The motion index value of each original emotion is the average value of each actor’s motion data. Finally, the values of the three motion indexes can be established through experience. Different intensities of the same emotion in the same subspace can be represented by different values of motion indexes.
4. Establishing Artificial Emotion Expression Model in DAT Emotion Dimension Space
In this paper, an artificial emotion model was established based on the above DAT emotion dimension space, which could deal with the external stimuli and produce corresponding emotion responses. The artificial emotion model can be divided into three parts: (1) The detection and processing of external events. The external emotion stimuli are detected and quantified to generate the external stimuli vectors, and the external stimuli vectors are input into the artificial emotion model. (2) The generation and modification of DAT emotion response vectors. The generalized regression neural network (GRNN) can be trained by the emotion samples to make the input external stimuli produce autonomous emotion responses, that is, DAT emotion response vectors are generated. Then the personality and mood are modeled to modify DAT emotion response vectors. (3) The discretization of emotions. The modified DAT emotion response vectors and original DAT emotion vectors can be compared and classified by using the random forest classification algorithm. The specific emotion types can be obtained, and the emotion intensity can be calculated.
4.1. Annotating External Stimuli
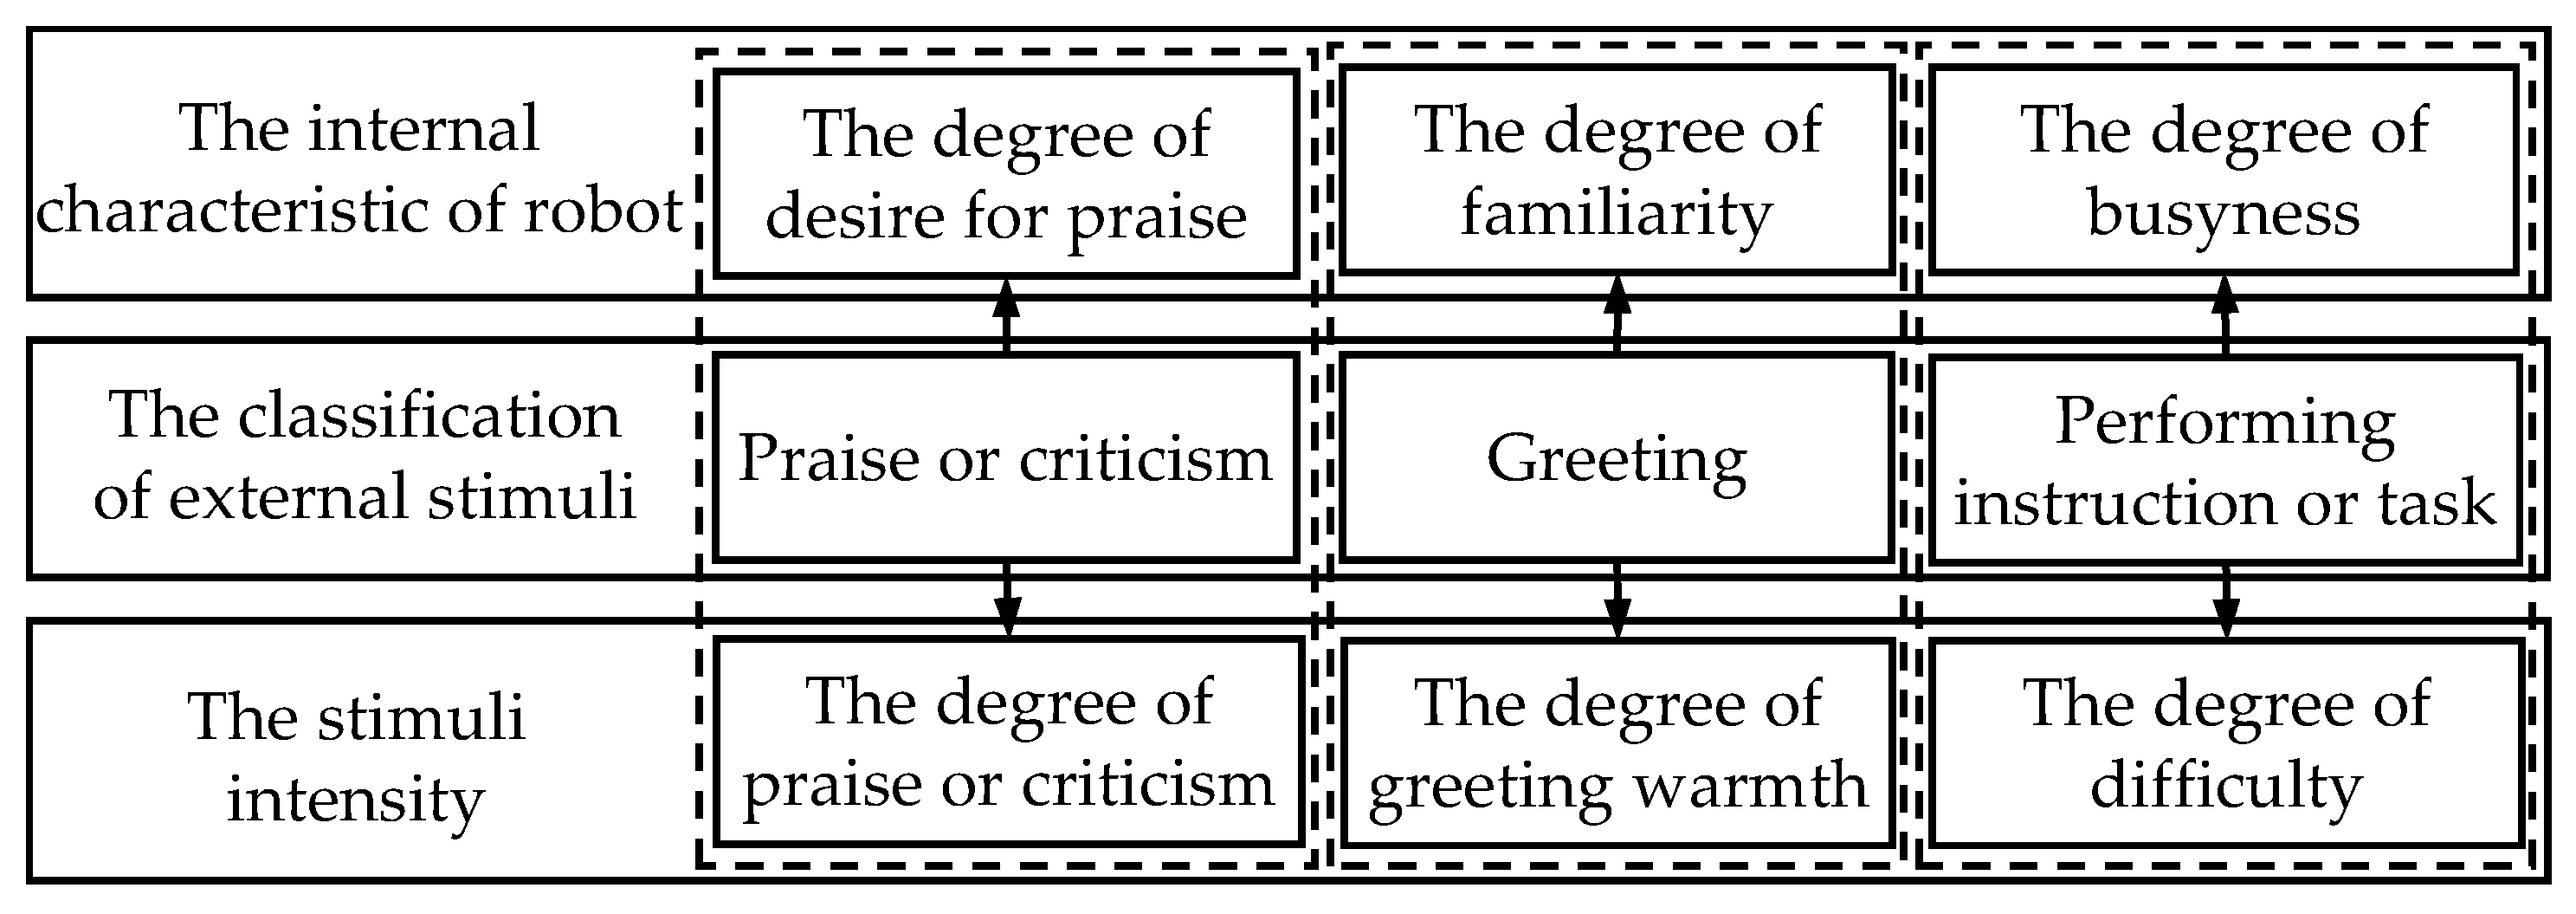
The external stimuli were classified, and the stimuli intensity and internal characteristic of robots were extracted according to different external event types. Three types of events (robots are praised or criticized, robots are greeted, and robots are asked to perform instructions or tasks) were selected for annotation in this paper. The annotation process is shown in
Figure 7. A three-dimensional external stimuli annotation vectors can be constituted by the external stimuli types, the external stimuli intensity of the robot, and the internal characteristic of the robot as follows:
where C
outside, F
outside, and I
outside represent the types of the external stimuli, the internal characteristics of the robot, and the external stimuli intensity, respectively.
The categories of these three types of events were annotated with 1, 0 and −1, respectively. Fuzzy words were used to describe the external stimuli intensity and internal characteristic of the robot. The fuzzy words were divided into five levels (generally, relatively, quite, very, and extremely) corresponding to five values (0, 0.25, 0.50, 0.75, and 1.00), respectively.
4.1.1. Calculating the Degree of Desire for Praise
Assuming that the robot receives more and more praise with each successive interaction, its desire for praise tends to the general level. The robot’s degree of desire for praise,
, in the k-th interaction is as follows:
where
represents the degree of praise or criticism obtained by the robot in the j-th interaction;
,
represents criticism and
represents praise;
represents the number of instances of praise or criticism received from starting to work to obtaining new praise or criticism.
4.1.2. Calculating the Busyness Degree or Fatigue Degree
Assume that the longer the robot performed tasks in the previous interaction and the more difficult the task was, the busier the robot was. The robot’s busyness degree,
, in the k-th interaction is as follows:
where
represents the difficulty of the j-th task,
;
represents the time spent completing the j-th task;
represents the time interval from starting the task to receiving a new task;
represents the number of tasks performed from starting the task to receiving a new task.
4.2. Generating the Emotion Response Vectors
4.2.1. Collecting Samples of DAT Emotion Responses
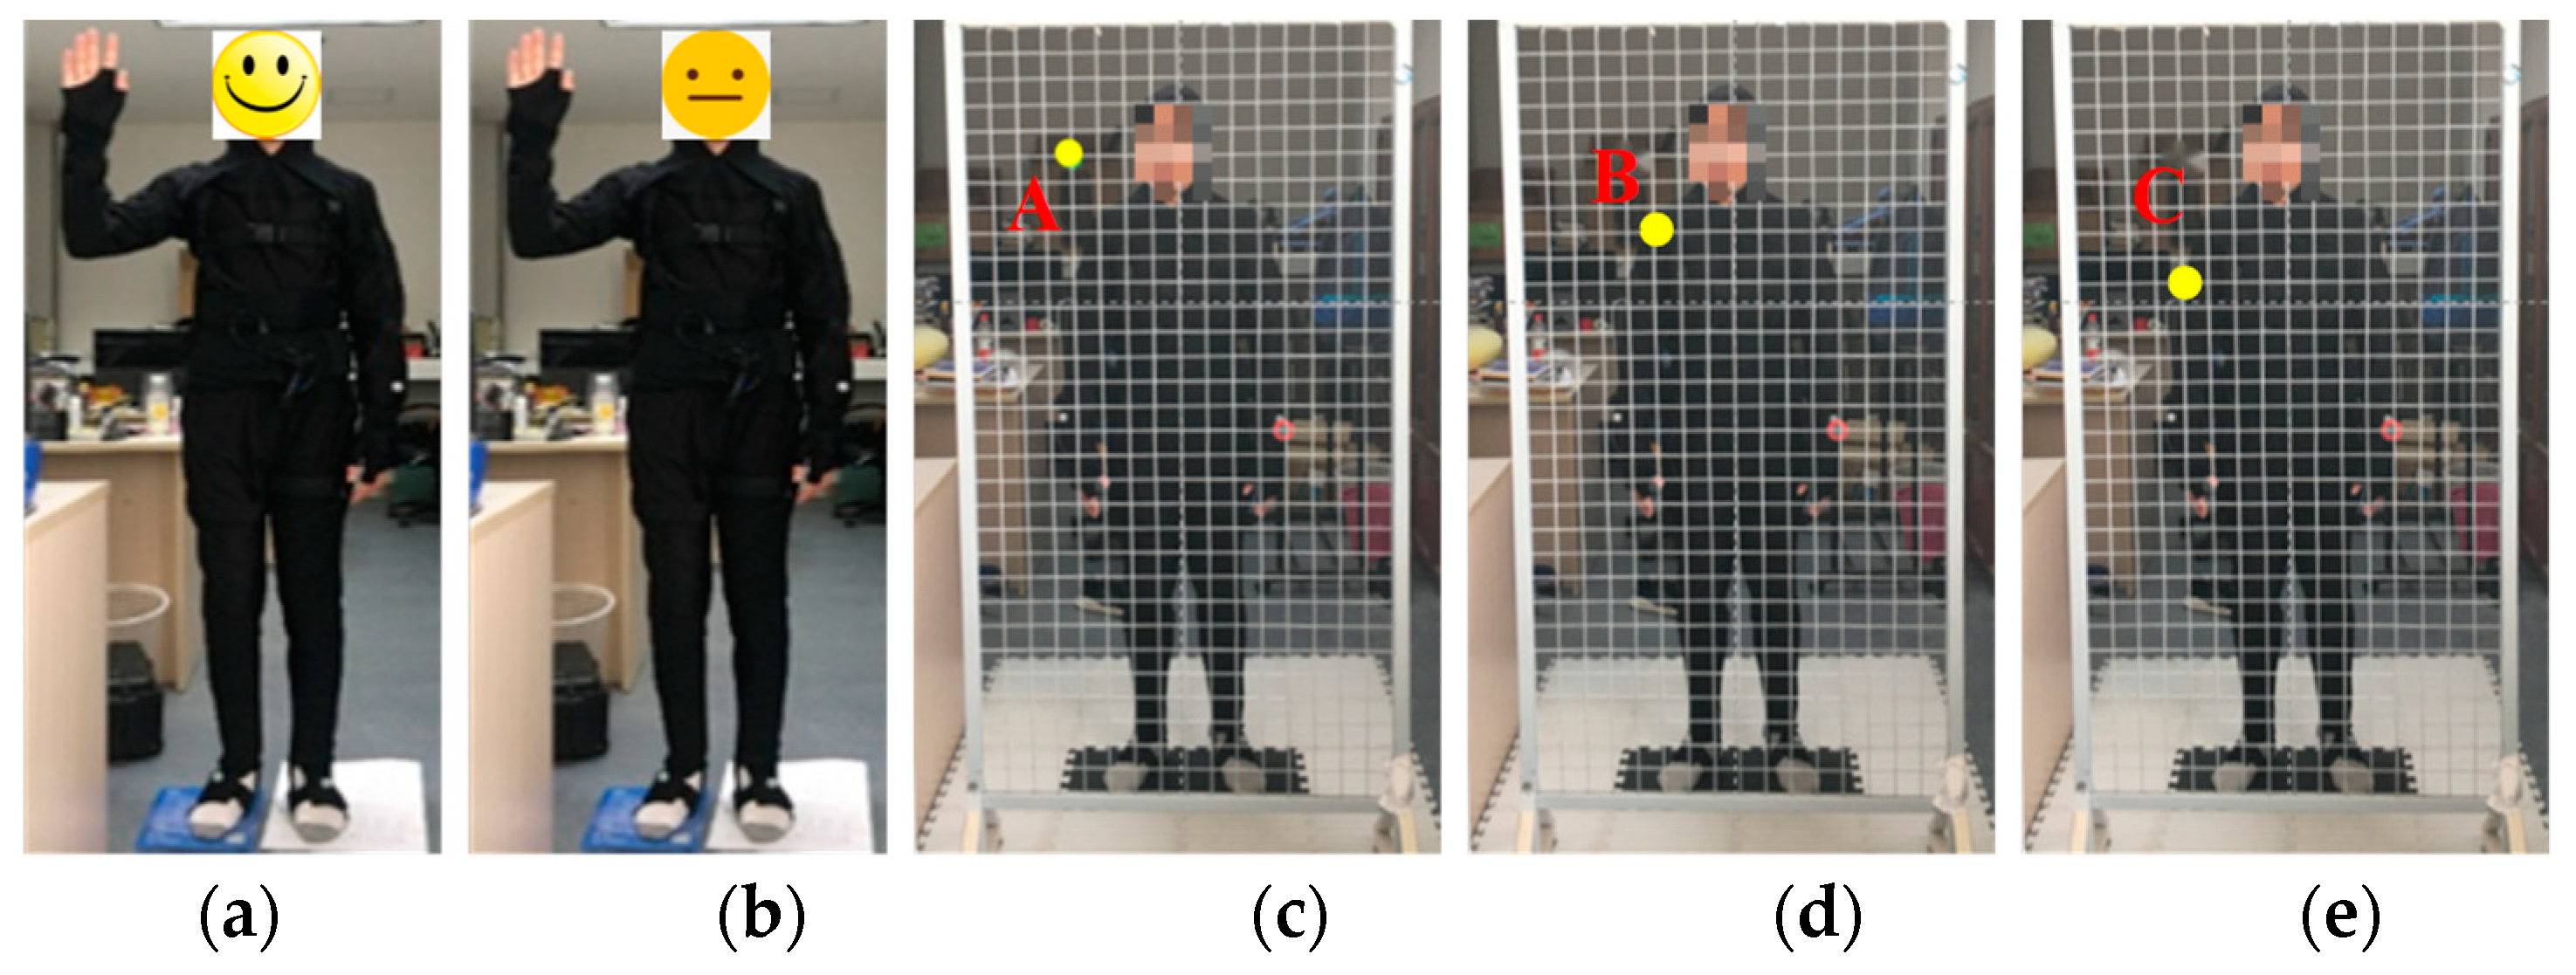
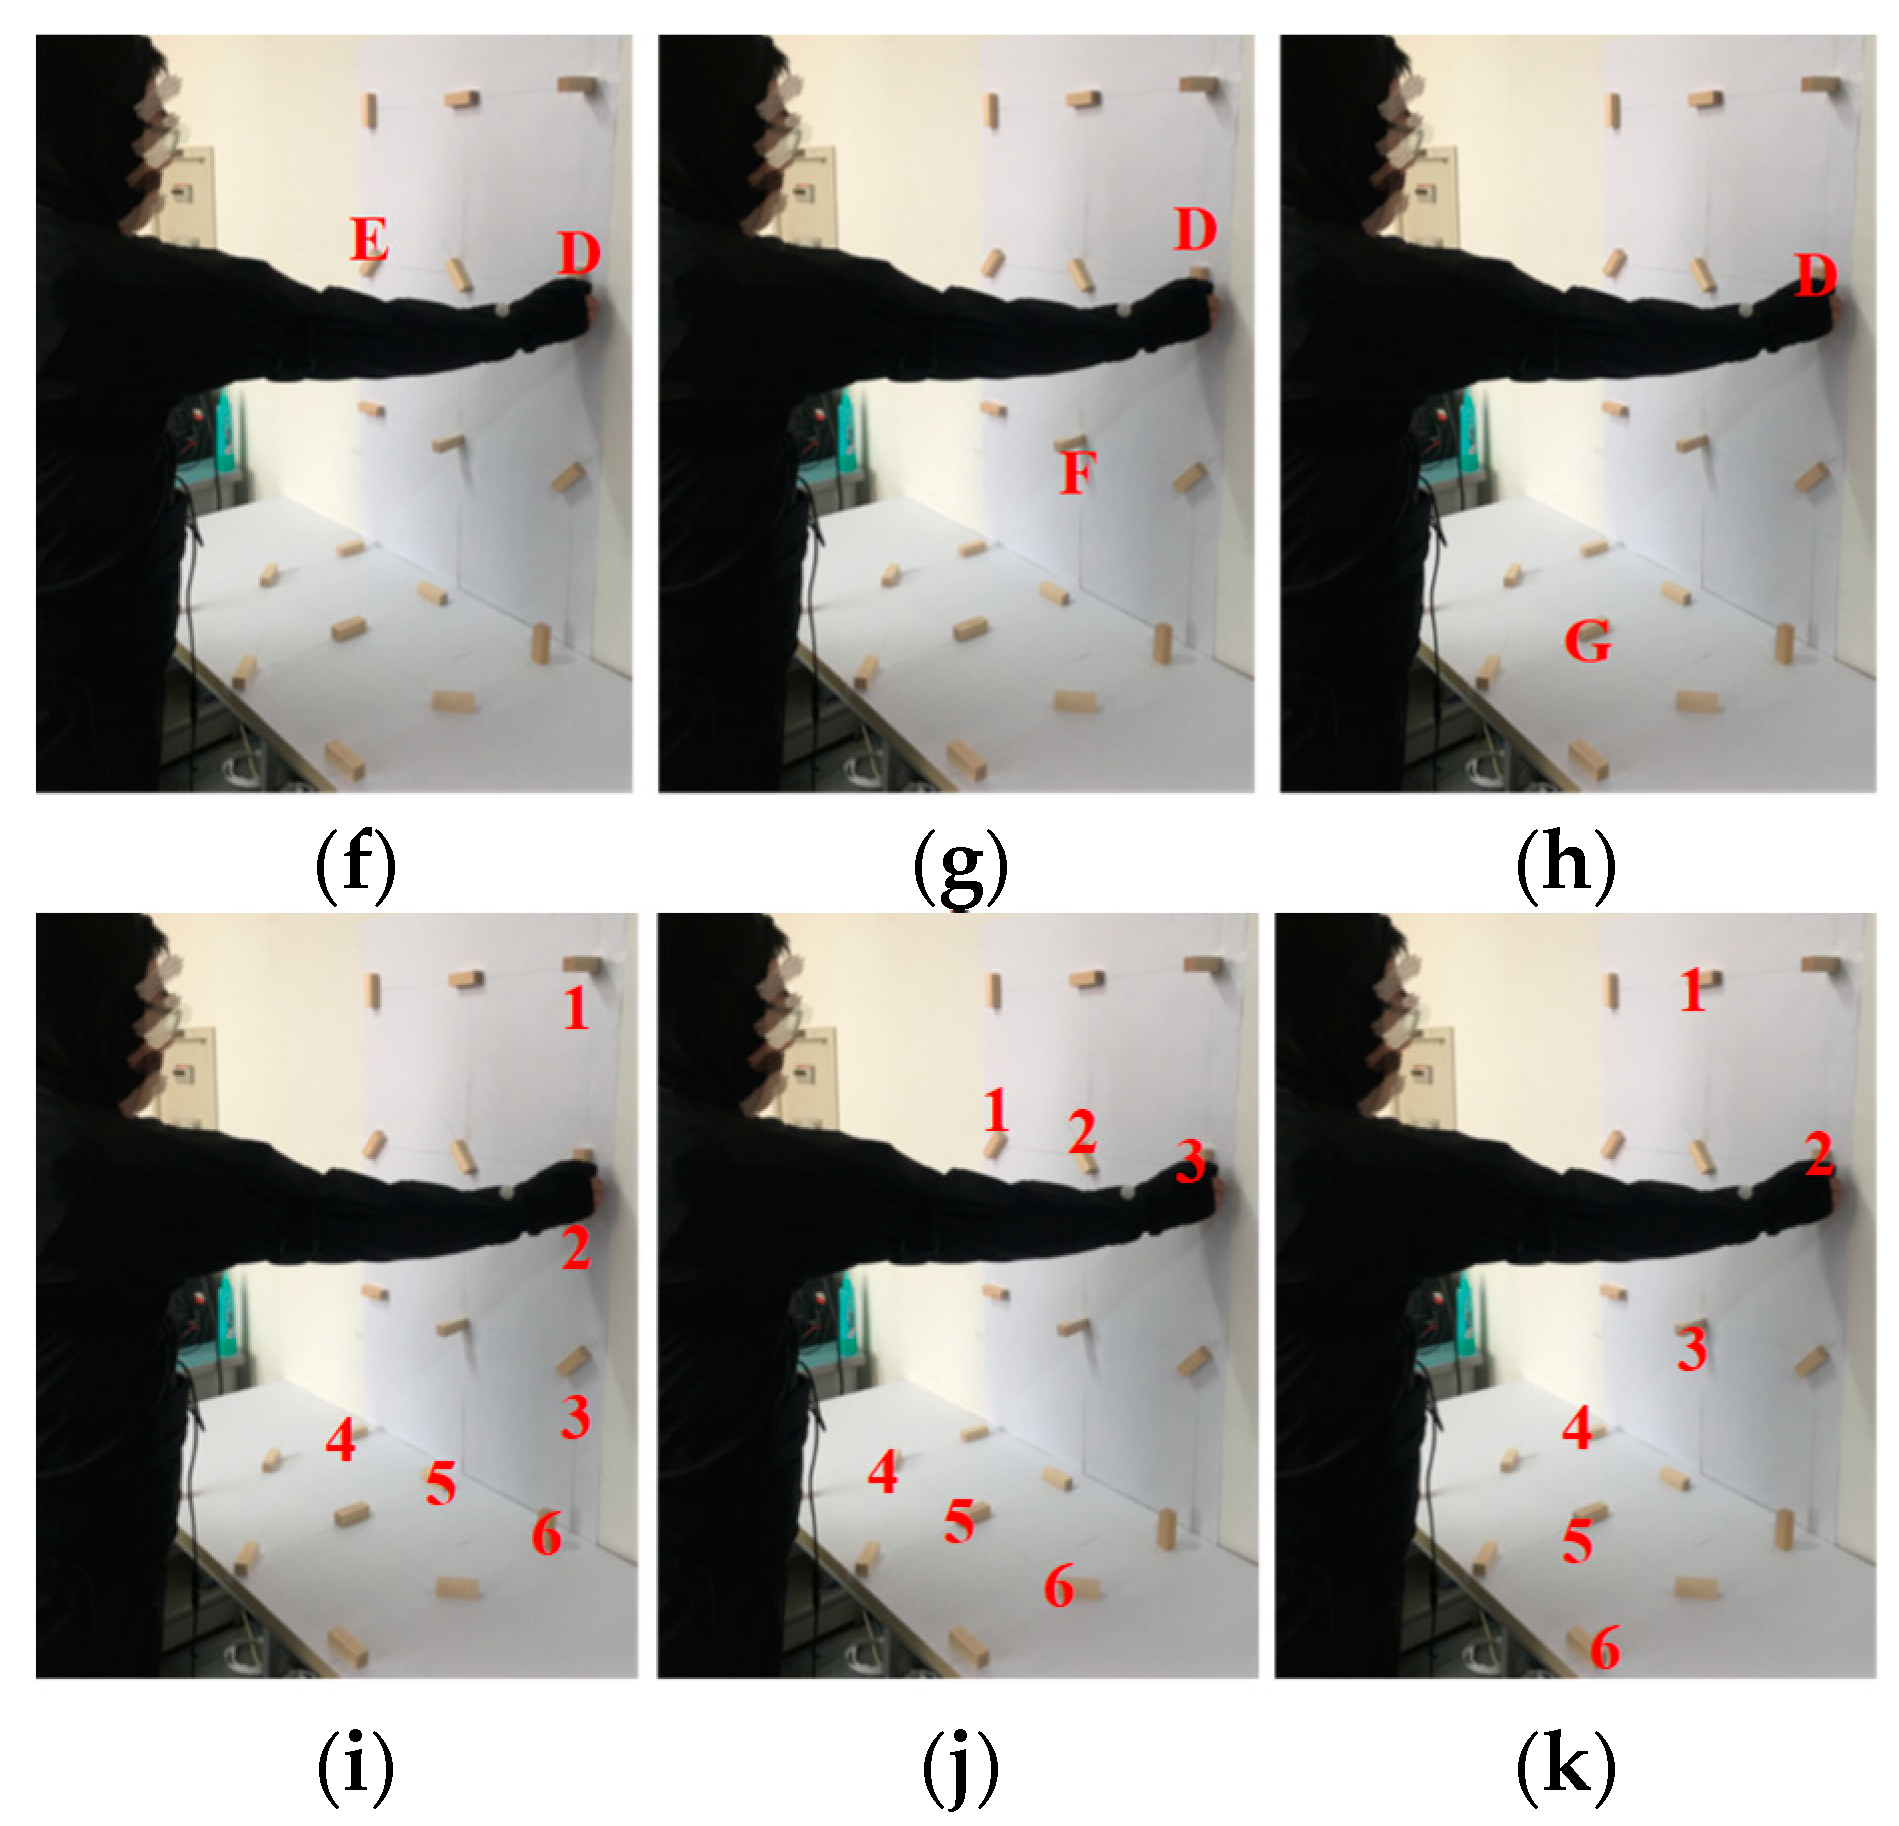
The emotion measurement method based on the behavioral response in the human–human interaction was used to measure emotion changes of testees due to the external stimuli. Thirteen testees (7 male, 6 female) were recruited to participate in the experiments. A real interaction scene was designed to evoke emotions of the thirteen testees. The escape or attack behaviors on the right arms of the thirteen testees were observed to obtain the emotion responses when the testees perceived external stimuli (thirteen testees were praised or criticized, thirteen testees were greeted, and thirteen testees were asked to perform instructions or tasks). Ten interactive participants interacted with thirteen testees in eleven kinds of interactive action behaviors. The thirteen testees completed eleven interactive actions with neutral states (1, 0.05, 0.5). Therefore, there were 143 interactive actions. The motion index data of thirteen testees’ right arms could be obtained by the motion capture system. The eleven kinds of interactive actions are shown in
Figure 8.
- (1)
An interactive participant waved hello to the testee with great enthusiasm, and the testee waved hello in response, as shown in
Figure 8a;
- (2)
The interactive participant waved hello to the testee, who was not enthusiastic enough, and the testee waved hello in response, as shown in
Figure 8b;
- (3)
The interactive participant asked the testee to complete the reaching point motion of point A, as shown in
Figure 8c;
- (4)
After praising the testee, the interactive participant asked the testee to complete the reaching point motion of point B, as shown in
Figure 8d;
- (5)
After criticizing the testee, the interactive participant asked the testee to complete the reaching point motion of point C, as shown in
Figure 8e;
- (6)
The interactive participant asked the testee to complete the motion of grabbing the small wood block from point D to point E, as shown in
Figure 8f;
- (7)
After criticizing the testee, the interactive participant asked the testee to complete the motion of grabbing the small wood block from point D to point F, as shown in
Figure 8g;
- (8)
After praising the testee, the interactive participant asked the testee to complete the motion of grabbing the small wood block from point D to point G, as shown in
Figure 8h;
- (9)
The interactive participant asked the testee to complete the motion of grabbing the small wood block in the order of 1–2–3–4–5–6, as shown in
Figure 8i;
- (10)
After criticizing the testee, the interactive participant asked the testee to complete the motion of grabbing the small wood block in the order of 1–2–3–4–5–6, as shown in
Figure 8j;
- (11)
After praising the testee, the interactive participant asked the testee to complete the motion of grabbing the small wood block in the order of 1–2–3–4–5–6, as shown in
Figure 8k.
Figure 8.
The eleven kinds of interactive actions: (a) the 1th interactive action; (b) the 2th interactive action; (c) the 3th interactive action; (d) the 4th interactive action; (e) the 5th interactive action; (f) the 6th interactive action; (g) the 7th interactive action; (h) the 8th interactive action; (i) the 9th interactive action; (j) the 10th interactive action; (k) the 11th interactive action.
For each interactive action, there are seven effective interactive actions between each testee and interactive participant. The average value of these seven effective action data can be the sample data finally applied to the artificial emotion model. Then the DAT emotion vector
e can be calculated. Taking testee 6 as an example, the calculated data are shown in
Table 4.
4.2.2. Generating DAT Emotion Response Vectors
The Min–Max normalization method can be used to normalize the original interactive action sample data [
27]. The DAT emotion vectors
e0 can be obtained. The processed emotion samples do not include the influence of people’s personalities and moods on emotions. A set of three-input and three-output samples can be composed of DAT emotion vectors
e and external stimuli annotation vectors
soutside. These samples can be used to train machine learning algorithms to make the robot realize the autonomous emotion responses to external stimuli. In this paper, the generalized regression neural network (GRNN) [
28] was used to train the GRNN network to generate emotion response vectors
corresponding to the external stimuli.
Firstly, the reliability of 143 interactive actions in “
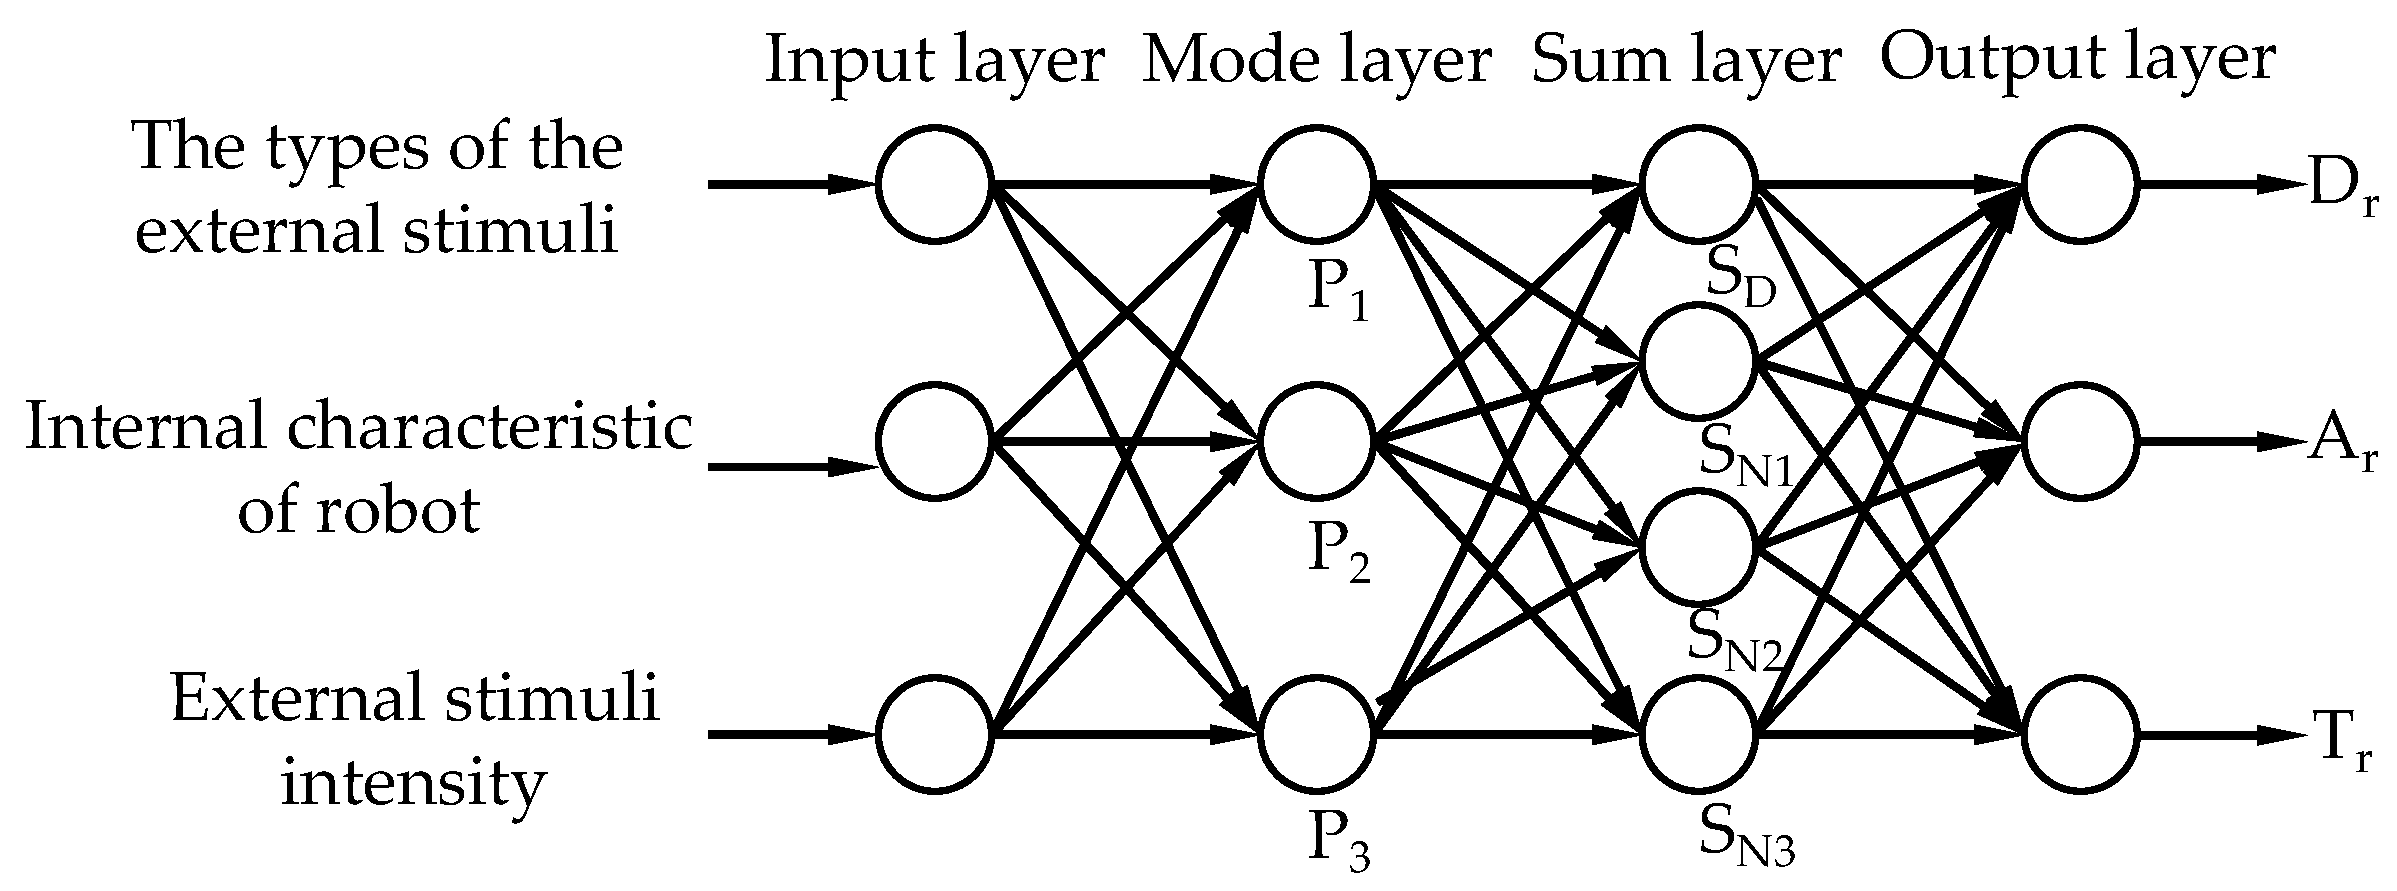
Section 4.2.1” was tested. A total of 132 interactive action samples met the requirements, that is, 132 groups of effective samples were obtained. Then 125 groups of the 132 groups were randomly selected to train the GRNN network. The remaining 7 groups were used to test the fitting effect of the GRNN network. The input layer and output layer of the GRNN network contained three neurons each. The hidden layer included one mode layer and one sum layer. The GRNN network topology for the generation of emotion response vectors is shown in
Figure 9.
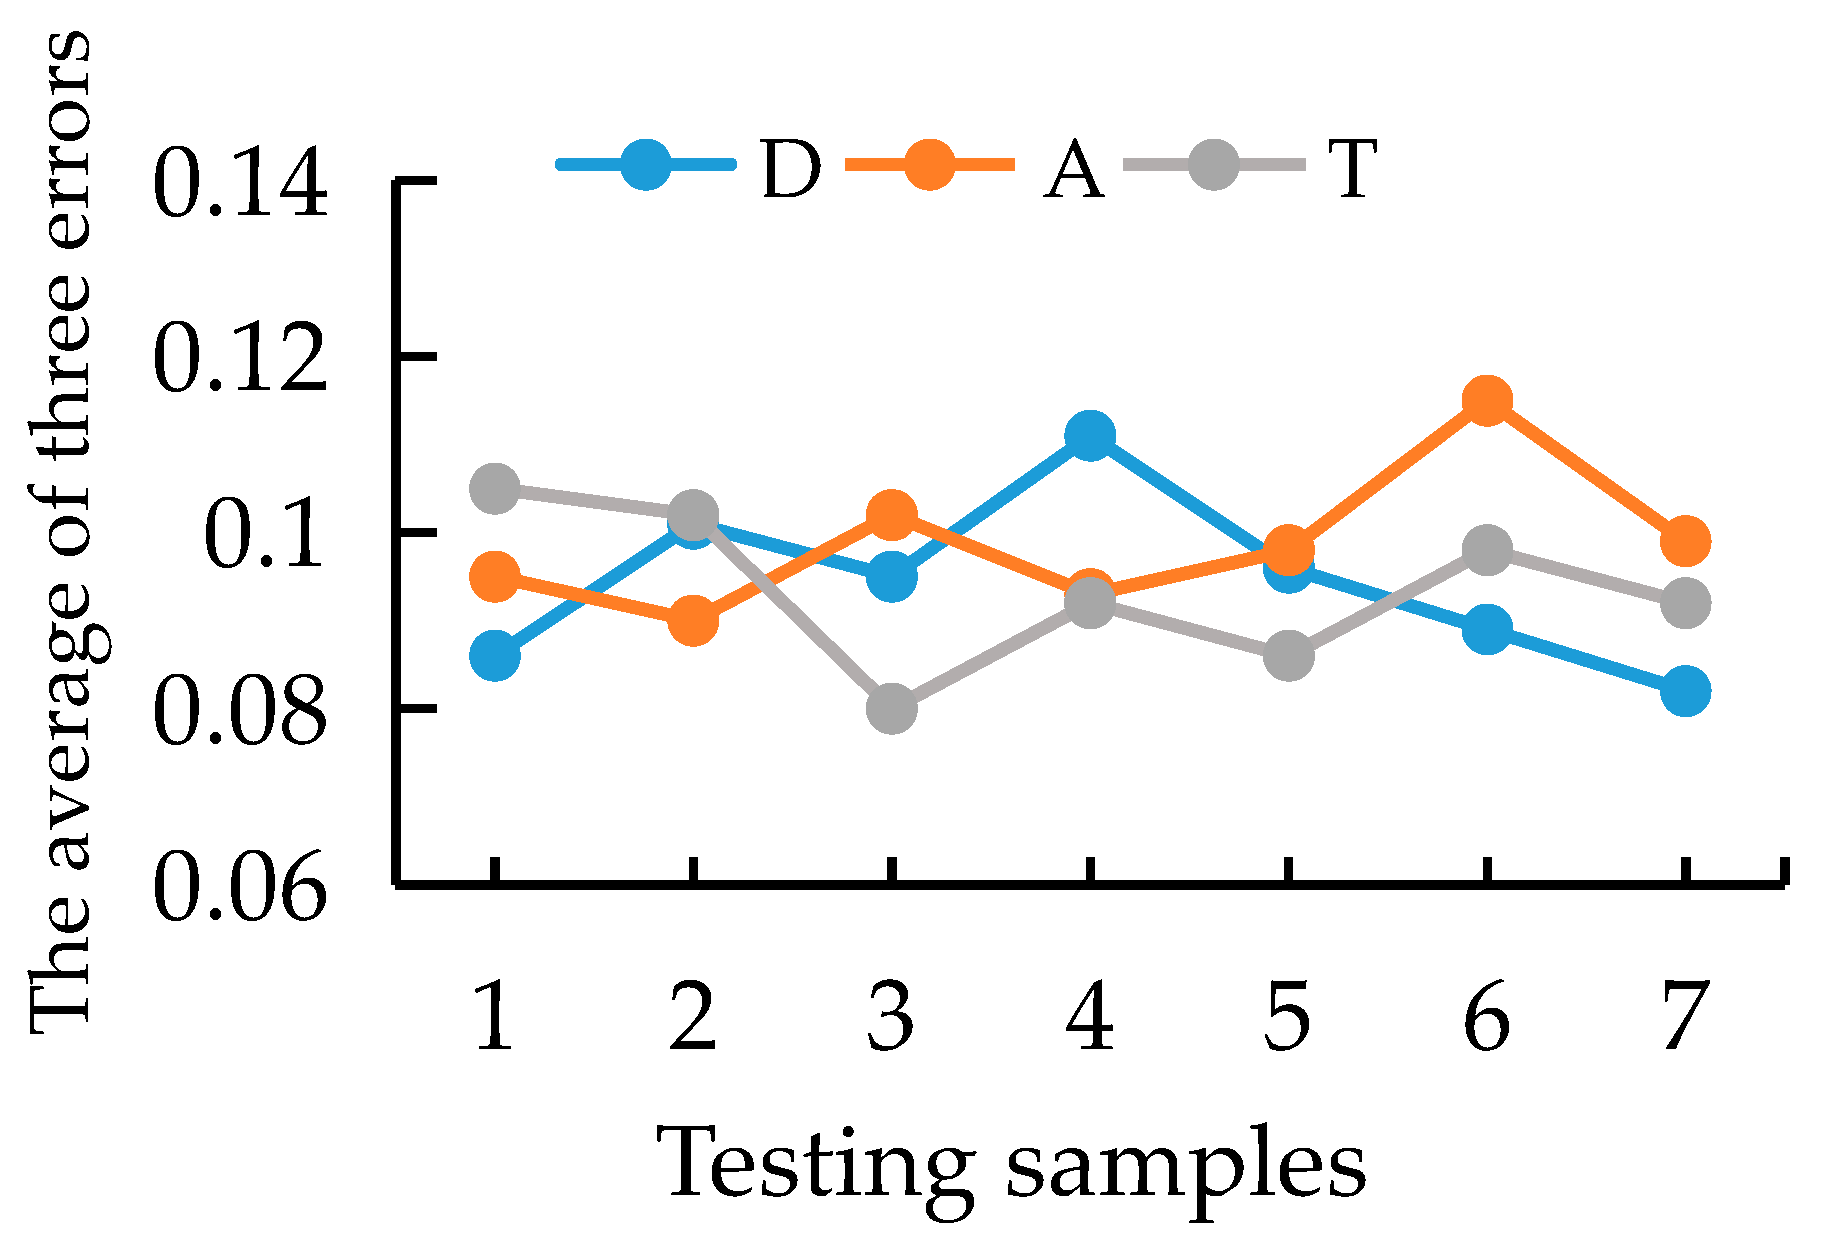
In the process of network training, the spread of the radial basis function needs to be determined. The spread parameters are traversed from 1 to 2 with a distance of 0.1, and the spread of the radial basis function is determined to be 2 by using the 10-fold cross-validation method when the test set is closest to the prediction result. The fitting effect of the network is tested by the simple cross-test method. The average fitting error can reach less than 0.1, and the minimum fitting mean square error of the single optimal can reach 0.03. The average fitting errors of the GRNN network in each dimension of DAT are shown in
Figure 10. It can be seen that the average fitting errors reached below 0.1 (±0.03). Compared with the data in
Table 3, the change trend of each dimension of DAT could not be changed by the error. It could be considered that the network had reached the model requirements and could realize the independent emotion response to the external stimuli.
4.3. Correcting DAT Emotion Response Vectors
4.3.1. Personality Correction of Emotion
A widely accepted personality theory is the Big Five personality factor theory proposed by the psychologist Goldberg [
29]. The theory divides people’s personalities into five categories, as shown in
Table 5.
The statistical analysis fitting method proposed by Mehrabiana [
30] was used to obtain the correlation between the DAT emotion dimension and the different personality traits in this paper as follows:
The average score of each human dimension obtained by the Big Five personality scale is taken as the reference point for each dimension. The position of the reference point is taken as the neutral point, and the part beyond the neutral point is taken as the factor affecting DAT emotion. The emotion response vectors after personality correction are as follows:
where
is the emotion response vectors corrected by the Big Five personality factor;
is the corrected value of the Big Five personality factor in the three dimensions of D, A, and T;
,
,
,
, and
are the average scores in the five dimensions obtained from the Big Five personality scale, which are 0.70, 0.73, 0.61, 0.60, and 0.60 respectively.
,
,
,
, and
can be used as the neutral level of robot personality.
4.3.2. Mood Correction of Emotion
According to the discrete octagonal PAD space proposed by Mehrabian [
31], the mood structure model of octagonal DAT space could be established by using the discrete octagonal method in this paper, as shown in
Table 6.
If a person is in a happy mood at this time, the negative emotion response will weaken, and the positive emotion response will strengthen under the same external stimuli. In the k-th interaction, the correction of mood to emotion is as follows:
where
is the emotion response vectors corrected by the personality and mood;
is the current mood state of the robot;
is the emotion response vectors corrected by personality; and
is the influence coefficient,
.
With the generation and accumulation of emotions, the mood state will also change. After the mood vectors are corrected by the mood state, the mood state also affects the mood in turn. The mood update process is as follows:
where
is the mood value of the next moment;
and
are the influence weights of the updating mood.
4.4. Classification of DAT Emotion Response Vectors
4.4.1. Obtaining the Classification Sample Set
In the real human–human interaction scene as shown in
Figure 9, there were eight emotions (happy, angry, anxiety, love, sad, relaxed, excited, hate) on the tablet computer. The values of emotion classification labels were 1 to 8, corresponding to the eight emotions. The standard values are shown in
Table 3. Before the emotion changes caused by the external stimuli were measured by the emotion measurement method based on the behavioral response, the testee needed to select the emotions on the tablet computer that may arise in the real interaction scene. The DAT emotion vectors
e0 were used as the input samples
sinput, and these emotions selected on the tablet computer were used as the output samples
soutput. Whether each emotion appeared or not was represented by 0 or 1. If there was a certain emotion, the value was 1. If there was no such emotion, the value was 0.
where
,
, and
are the values of the original DAT emotion vectors
e0 in the three dimensions of D, A, and T, respectively; j is the number of samples in the original sample set, j = 1–132; i is the emotion classification label, i = 1–8;
is the output sample of emotion classification; and
is the output classification label,
= 0–8.
4.4.2. Extension of the Feature Set
It is necessary to use the original DAT values of the eight emotions to mine information contained in the original sample and make full use of information in the original sample. In this paper, the original three-dimensional DAT emotion values, the absolute values of the difference between the original DAT emotion vectors and original DAT vectors, the distance between the original DAT emotion values and standard DAT values, the angle between the original DAT emotion vectors and standard DAT vectors, and the emotion category corresponding to the standard DAT vectors were combined. The feature set can be expanded from the original four-dimensional to nine-dimensional to form a new sample set. The new sample set can be defined as follows:
where
is the j-th original three-dimensional DAT emotion vector;
is the DAT standard emotion vector corresponding to the i-th basic emotion, and the corresponding values of each dimension are
,
, and
.
4.4.3. Selection of the Feature Set
After the feature set is expanded, there may be redundant or irrelevant features for classification. Therefore, the information gain rate is used to select the extended feature set and optimize the classification feature set. Before calculating the information gain rate, the dichotomy method [
32] is used to discretize the characteristics of the five dimensions
,
,
,
, and
. After discretization, the information gain rate of each dimension in the feature set can be calculated. Then the information gain rates are arranged in descending order, and the number of features is increased in order to form a new feature subset. These feature subsets are used to train the classifier, and the relationship curve between the classification accuracy and number of features in the feature set can be obtained. The features that promote the classification accuracy curve are selected to form a new feature subset. The input sample formed by this feature subset can be used as the final classification sample to train the classifier.
4.4.4. Classification of Emotion Response Vectors
In this paper, the random forest algorithm [
33] was selected to classify the emotion response vectors based on the motion indexes in this paper. The input of the random forest algorithm was the optimized input sample obtained after feature selection, and the output was the corresponding category label. After training, the classifier could be used to classify emotion response vectors based on the motion indexes.
The 132 groups of interactive action samples could be expanded to 1056 groups of interactive action samples based on Equation (10). The information gain rates of each dimension in the feature set were calculated based on the method in “
Section 4.4.3”. The information gain rates of each feature are shown in
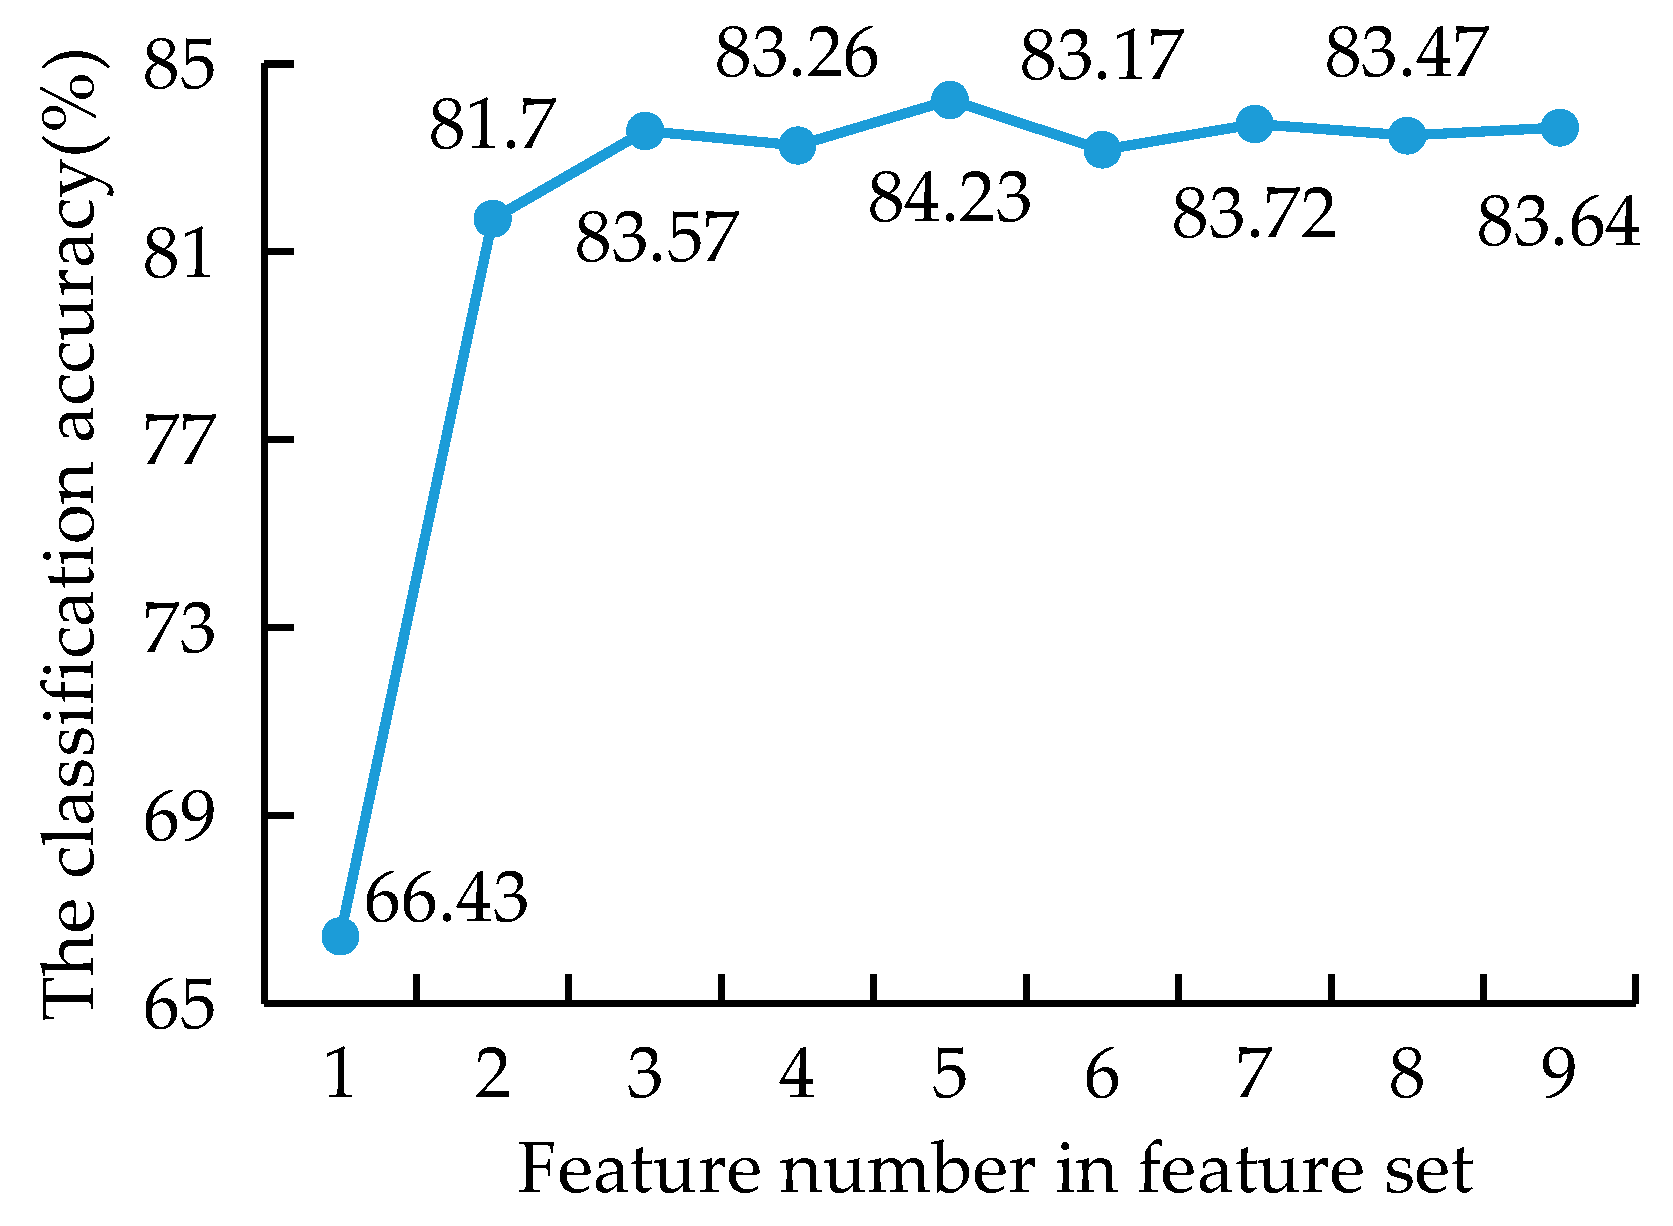
Table 7, and the information gain rates were arranged in descending order. The classification accuracy of different feature subsets is shown in
Figure 11.
As shown in
Table 7, the features that made the classification accuracy curve increase were selected to form a new feature subset, that is, the features corresponding to the number 1, 2, 3, 5, and 7 were selected. The input sample at this time was as follows:
The input of the random forest algorithm were the five-dimensional input samples obtained after feature selection, and the output was the corresponding category label. It was determined that the number of random trees was 600. From 1056 samples, 1000 samples were randomly selected to train the random forest, and the other samples were used as test samples to test the classification performance of the random forest classifier to obtain its classification accuracy. After testing, the classification accuracy of random forest classifier was stable at 85.7%.
5. Robot Emotion Expression Based on Motion Behavior
Most of the emotion models in DAT emotion space are abstract models that cannot be directly applied to robot motion planning. The emotion model proposed in this paper can be expressed quantitatively. The mathematical expression
E of the emotion model can be expressed quantitatively by the emotion state and motion indexes, which can be expressed in the matrix form as follows:
The matrix
E is defined as the emotion matrix, which is used to describe the different emotions expressed by the robot. Matrix
E represents the robot’s emotion intensity corresponding to the i-th emotion. When
, the emotion vector
e that can represent a certain emotion is obtained by simplifying the emotion matrix (
E).
Moreover, a calculation method of emotion intensity suitable for the emotion spaces based on the motion indexes is proposed in this paper. At some point, a specific emotion’s transient intensity can be defined as follows:
where
is the emotion intensity corresponding to
;
is the standard emotion vector corresponding to
after classification; and
is the cosine of the angle between
and
. A specific emotion’s intensity during the whole motion can also be calculated.
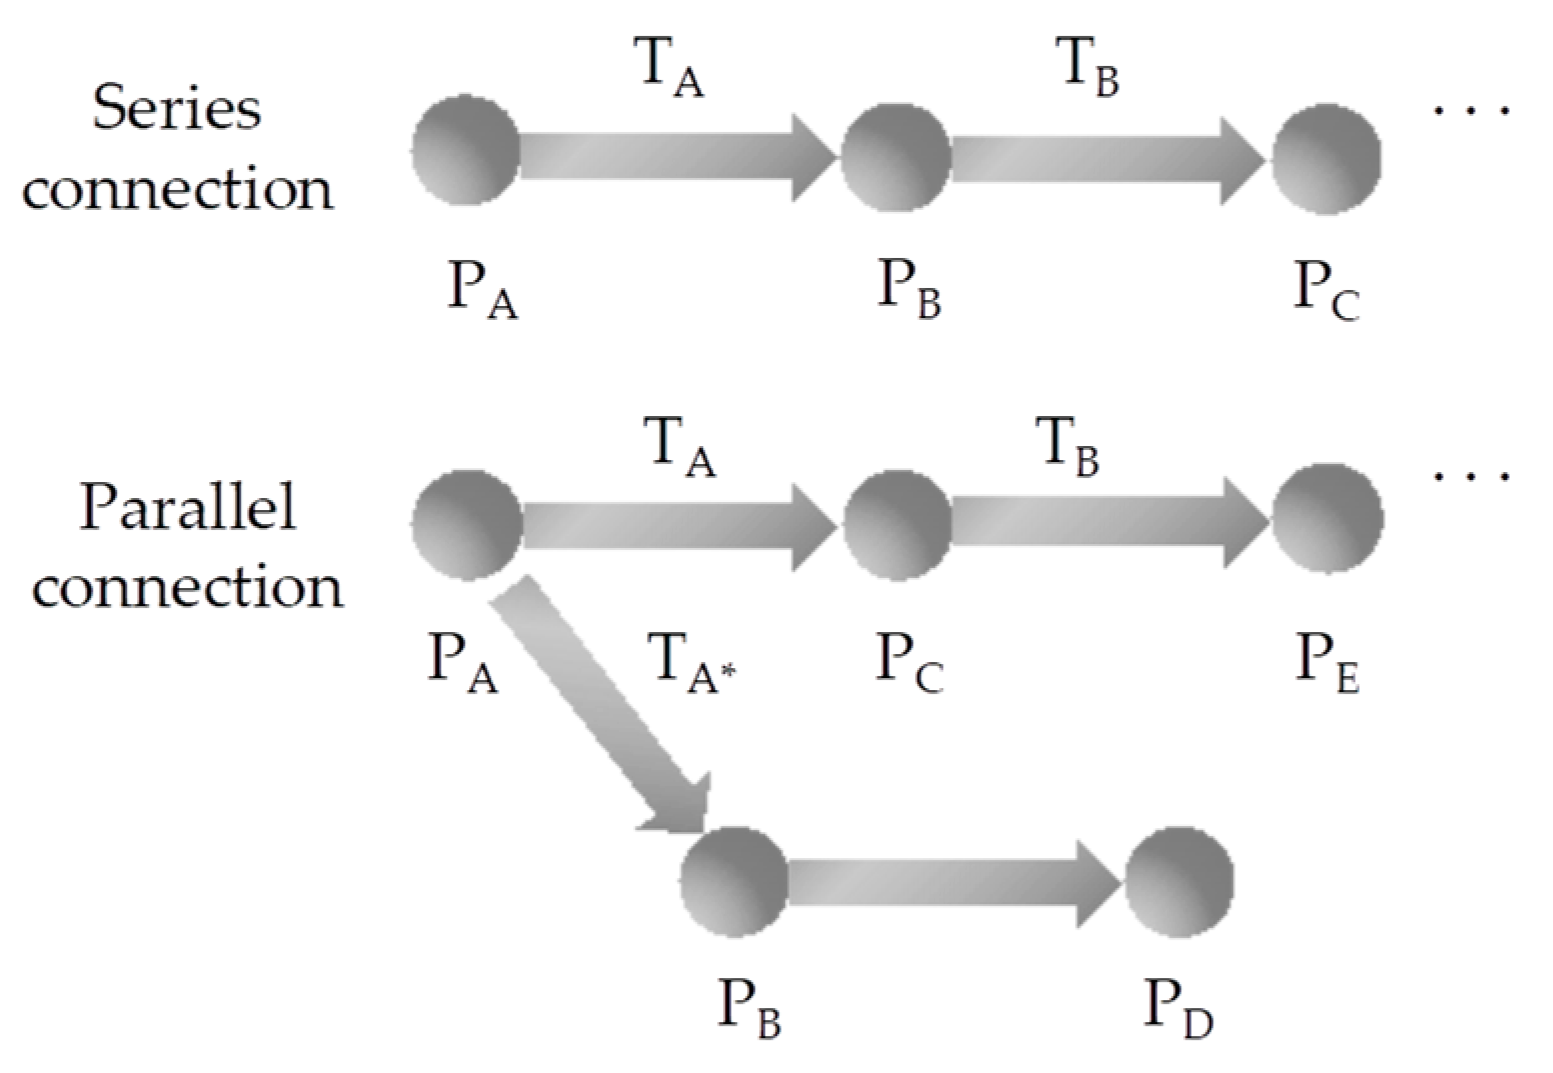
The motion primitives are important as a bridge establishing a connection between joint space and emotion space. In this paper, a novel motion primitive with emotions is constructed by using the concept of action semantics, as shown in
Figure 12. The motion primitives can form more colorful actions through emotion modification. By adding the higher-order semanteme, more abundant connotations (different emotions such as sad, happy, and so on) can be expressed by the primitives.
In
Figure 10, the different motion primitives are represented by the black circles, the motion index T is represented by the arrows, and the values of T are represented by the arrow length. Whether the structure is series or parallel is determined by the body parts’ numbers during motion. The new motion primitives influenced by the motion indexes can describe the behaviors of the robot. Furthermore, different emotions can be expressed by the new motion primitives. The motion primitives with emotions are expressed as follows:
can be defined as the matrix form for the convenience of calculation:
The whole motion process in a single emotion state can be expressed as follows:
where n represents the emotion motion primitives’ number, and the symbol “→” represents the sequence of different emotion motion primitives, and it does not represent any algebraic operation.
The whole motion process in the multi-emotion state can be represented as follows:
where
,
, and
represent different emotions, respectively.
It should be noted that the expression of
is independent of the connection form (series or parallel). At the same time, different model structures of various parts (such as body, leg, and so on) will result in a specific calculation expression of
. The robotic arm was taken as an example in this paper. In order to generate the joint trajectories which can be considered the standard behavior of robotic arms in this paper, the Gradient Projection Method (GPM) with the following equation was adopted [
34]:
where
is the joint velocity, and
is the end-effector velocity. According to different motion primitives, joint space dimensions are different. The joint trajectory is obtained by the inverse kinematics solution method instead of the motion primitive, and thus the joint trajectory converted by the motion primitive is continuous.
represents the Jacobian matrix.
represents the Jacobian matrix’s Moore–Penrose generalized inverse.
I represents the identity matrix.
represents a real scalar coefficient. H represents the minimum total potential energy index, which can be considered as the objective function.
represents the gradient vector of the objective function.
is the mass of the main arm.
is the mass of the forearm [
16].
is the mass of the human. g is the acceleration of gravity.
is the height of the main arm’s center of mass.
is the height of the forearm’s center of mass.
is the stiffness coefficient of the torsion spring.
is the swivel angle of the elbow.
is a function of acceleration
, which is expressed as follows:
Then Equation (20) can be expressed as follows:
It must be noted that the motion index D will affect the end operation accuracy of the manipulator, so the value of D should meet the parabolic distribution. At the beginning and end of the motion, its value tends to be close to 1, and it is taken according to different emotional states at the peak. For a single emotion,
can be expressed as follows:
6. Human–Robot Interaction Experiments
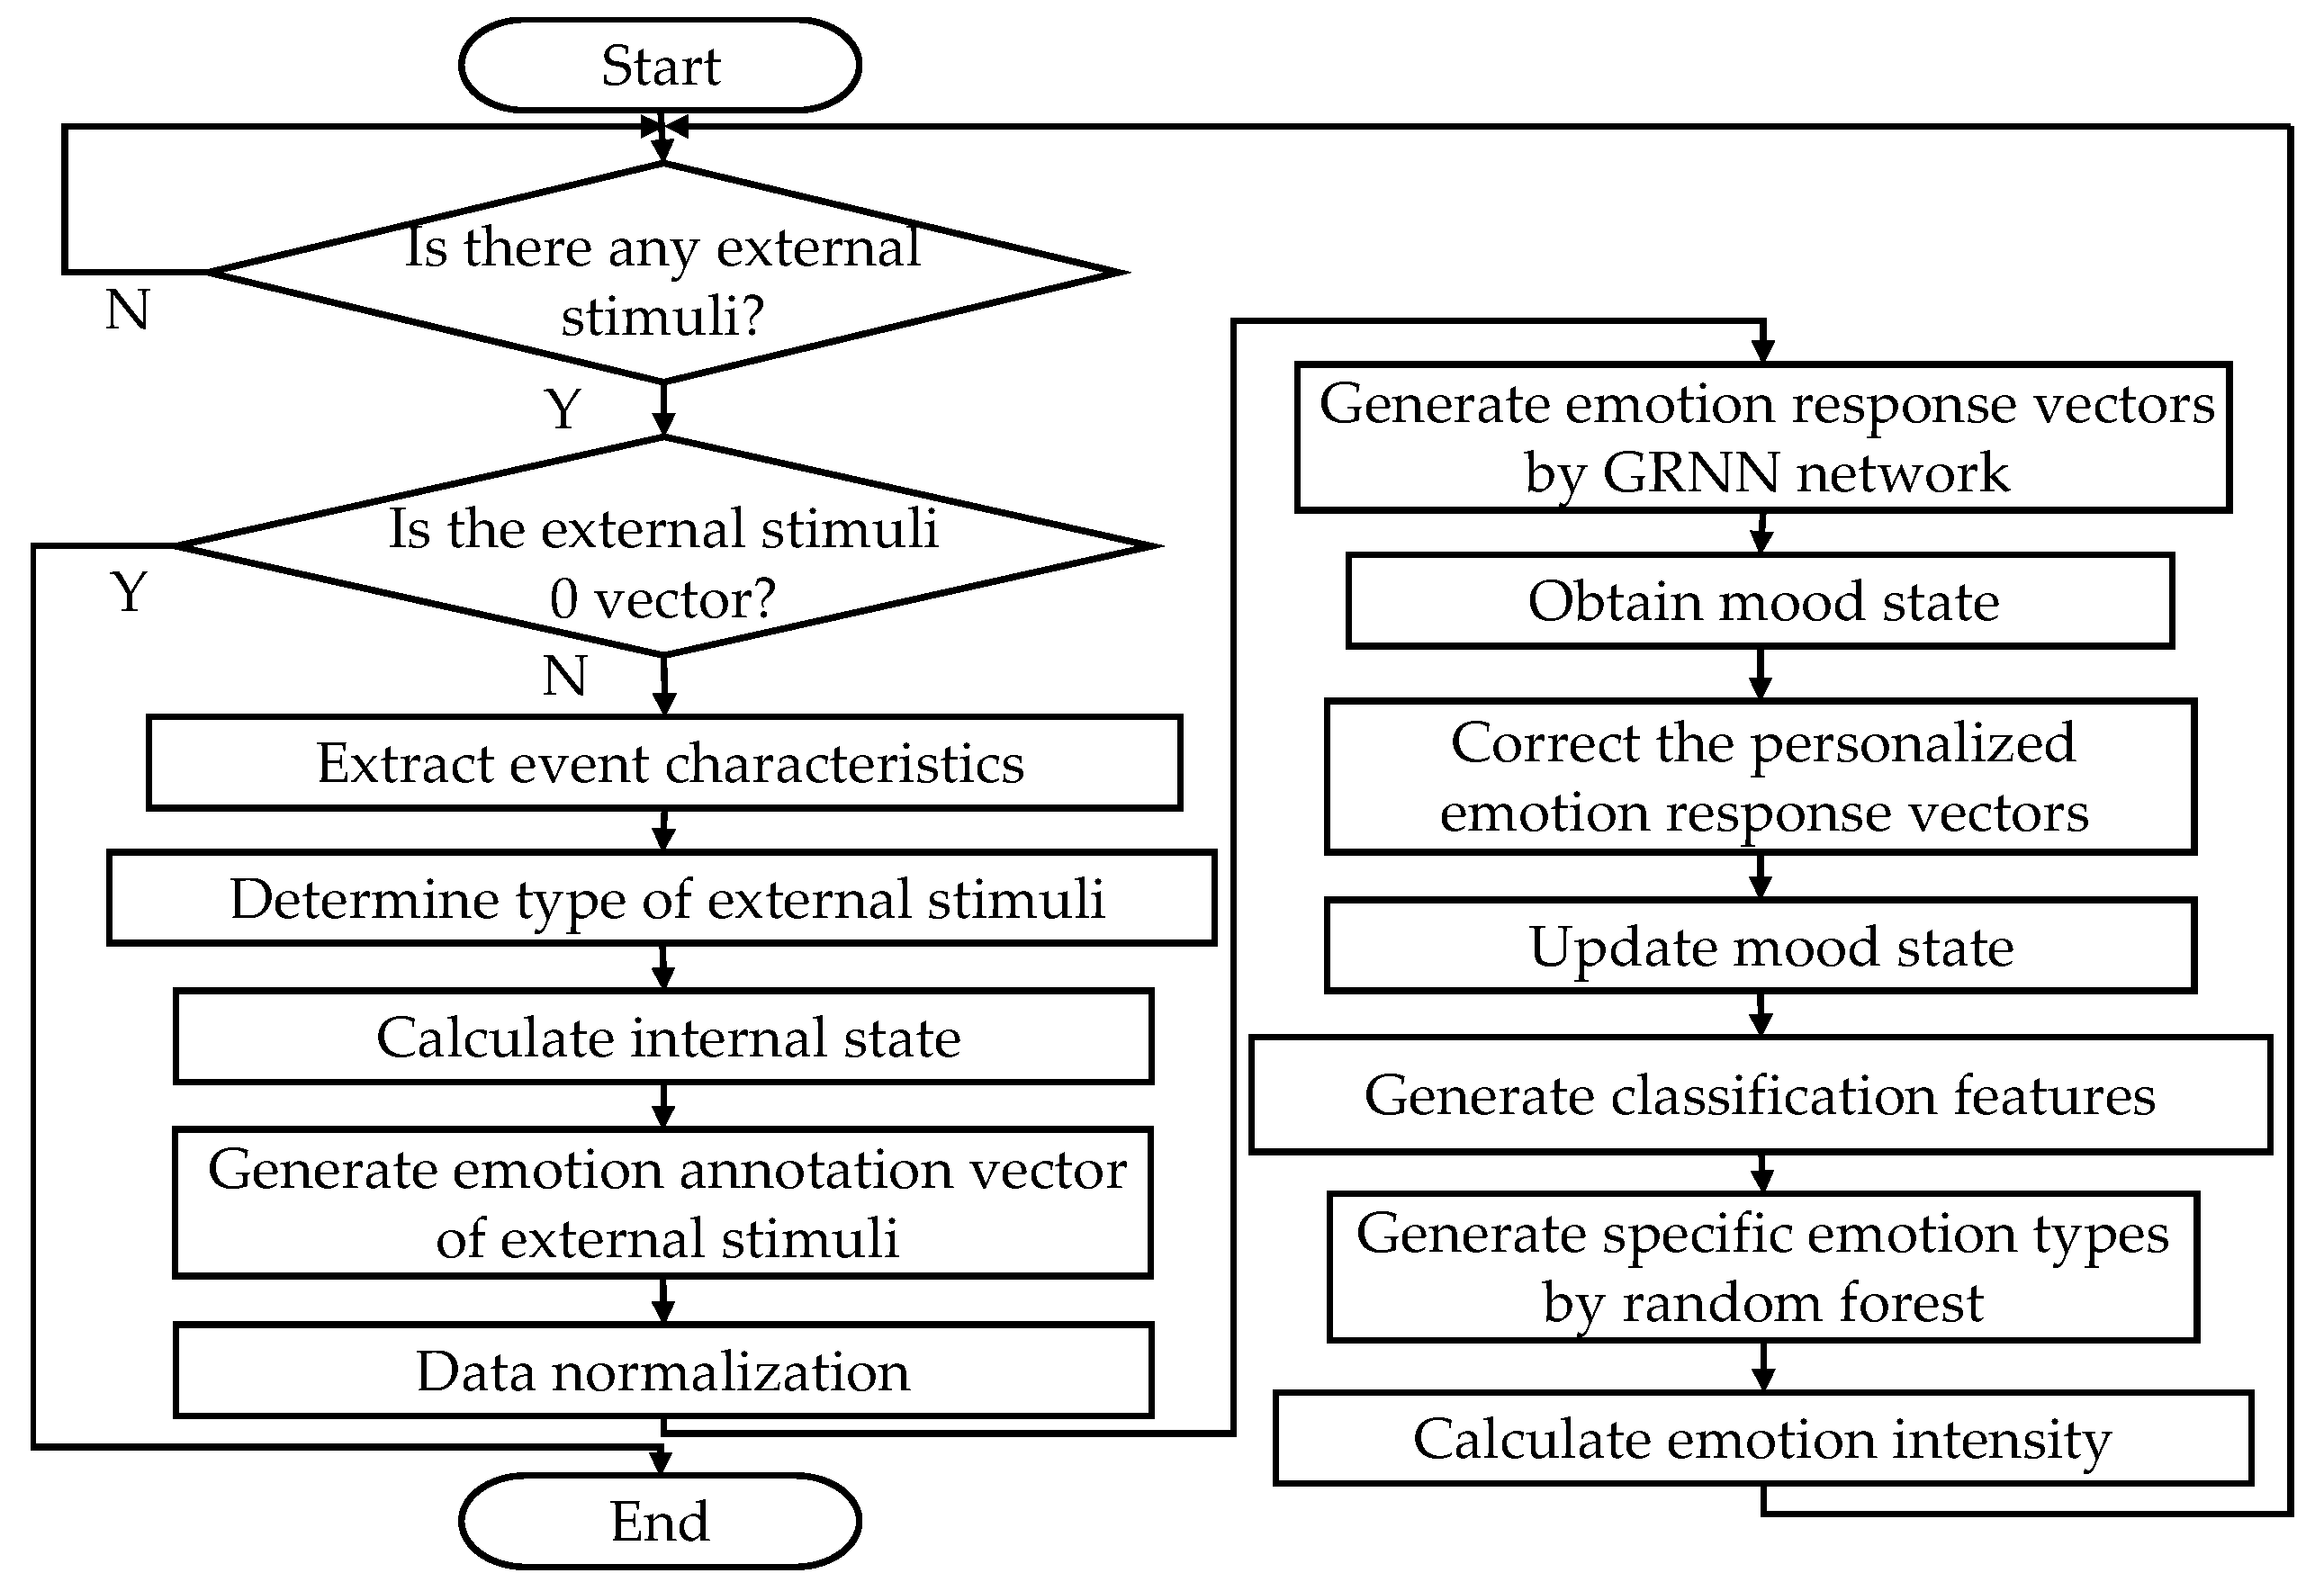
6.1. Calculation of the Artificial Emotion Model in Human–Robot Interaction Experiments
The calculation flow chart of the artificial emotion calculation model is shown in
Figure 13. In order to simulate external stimuli, the type and intensity of external emotion stimuli are manually input directly into the calculation process of the artificial emotion model.
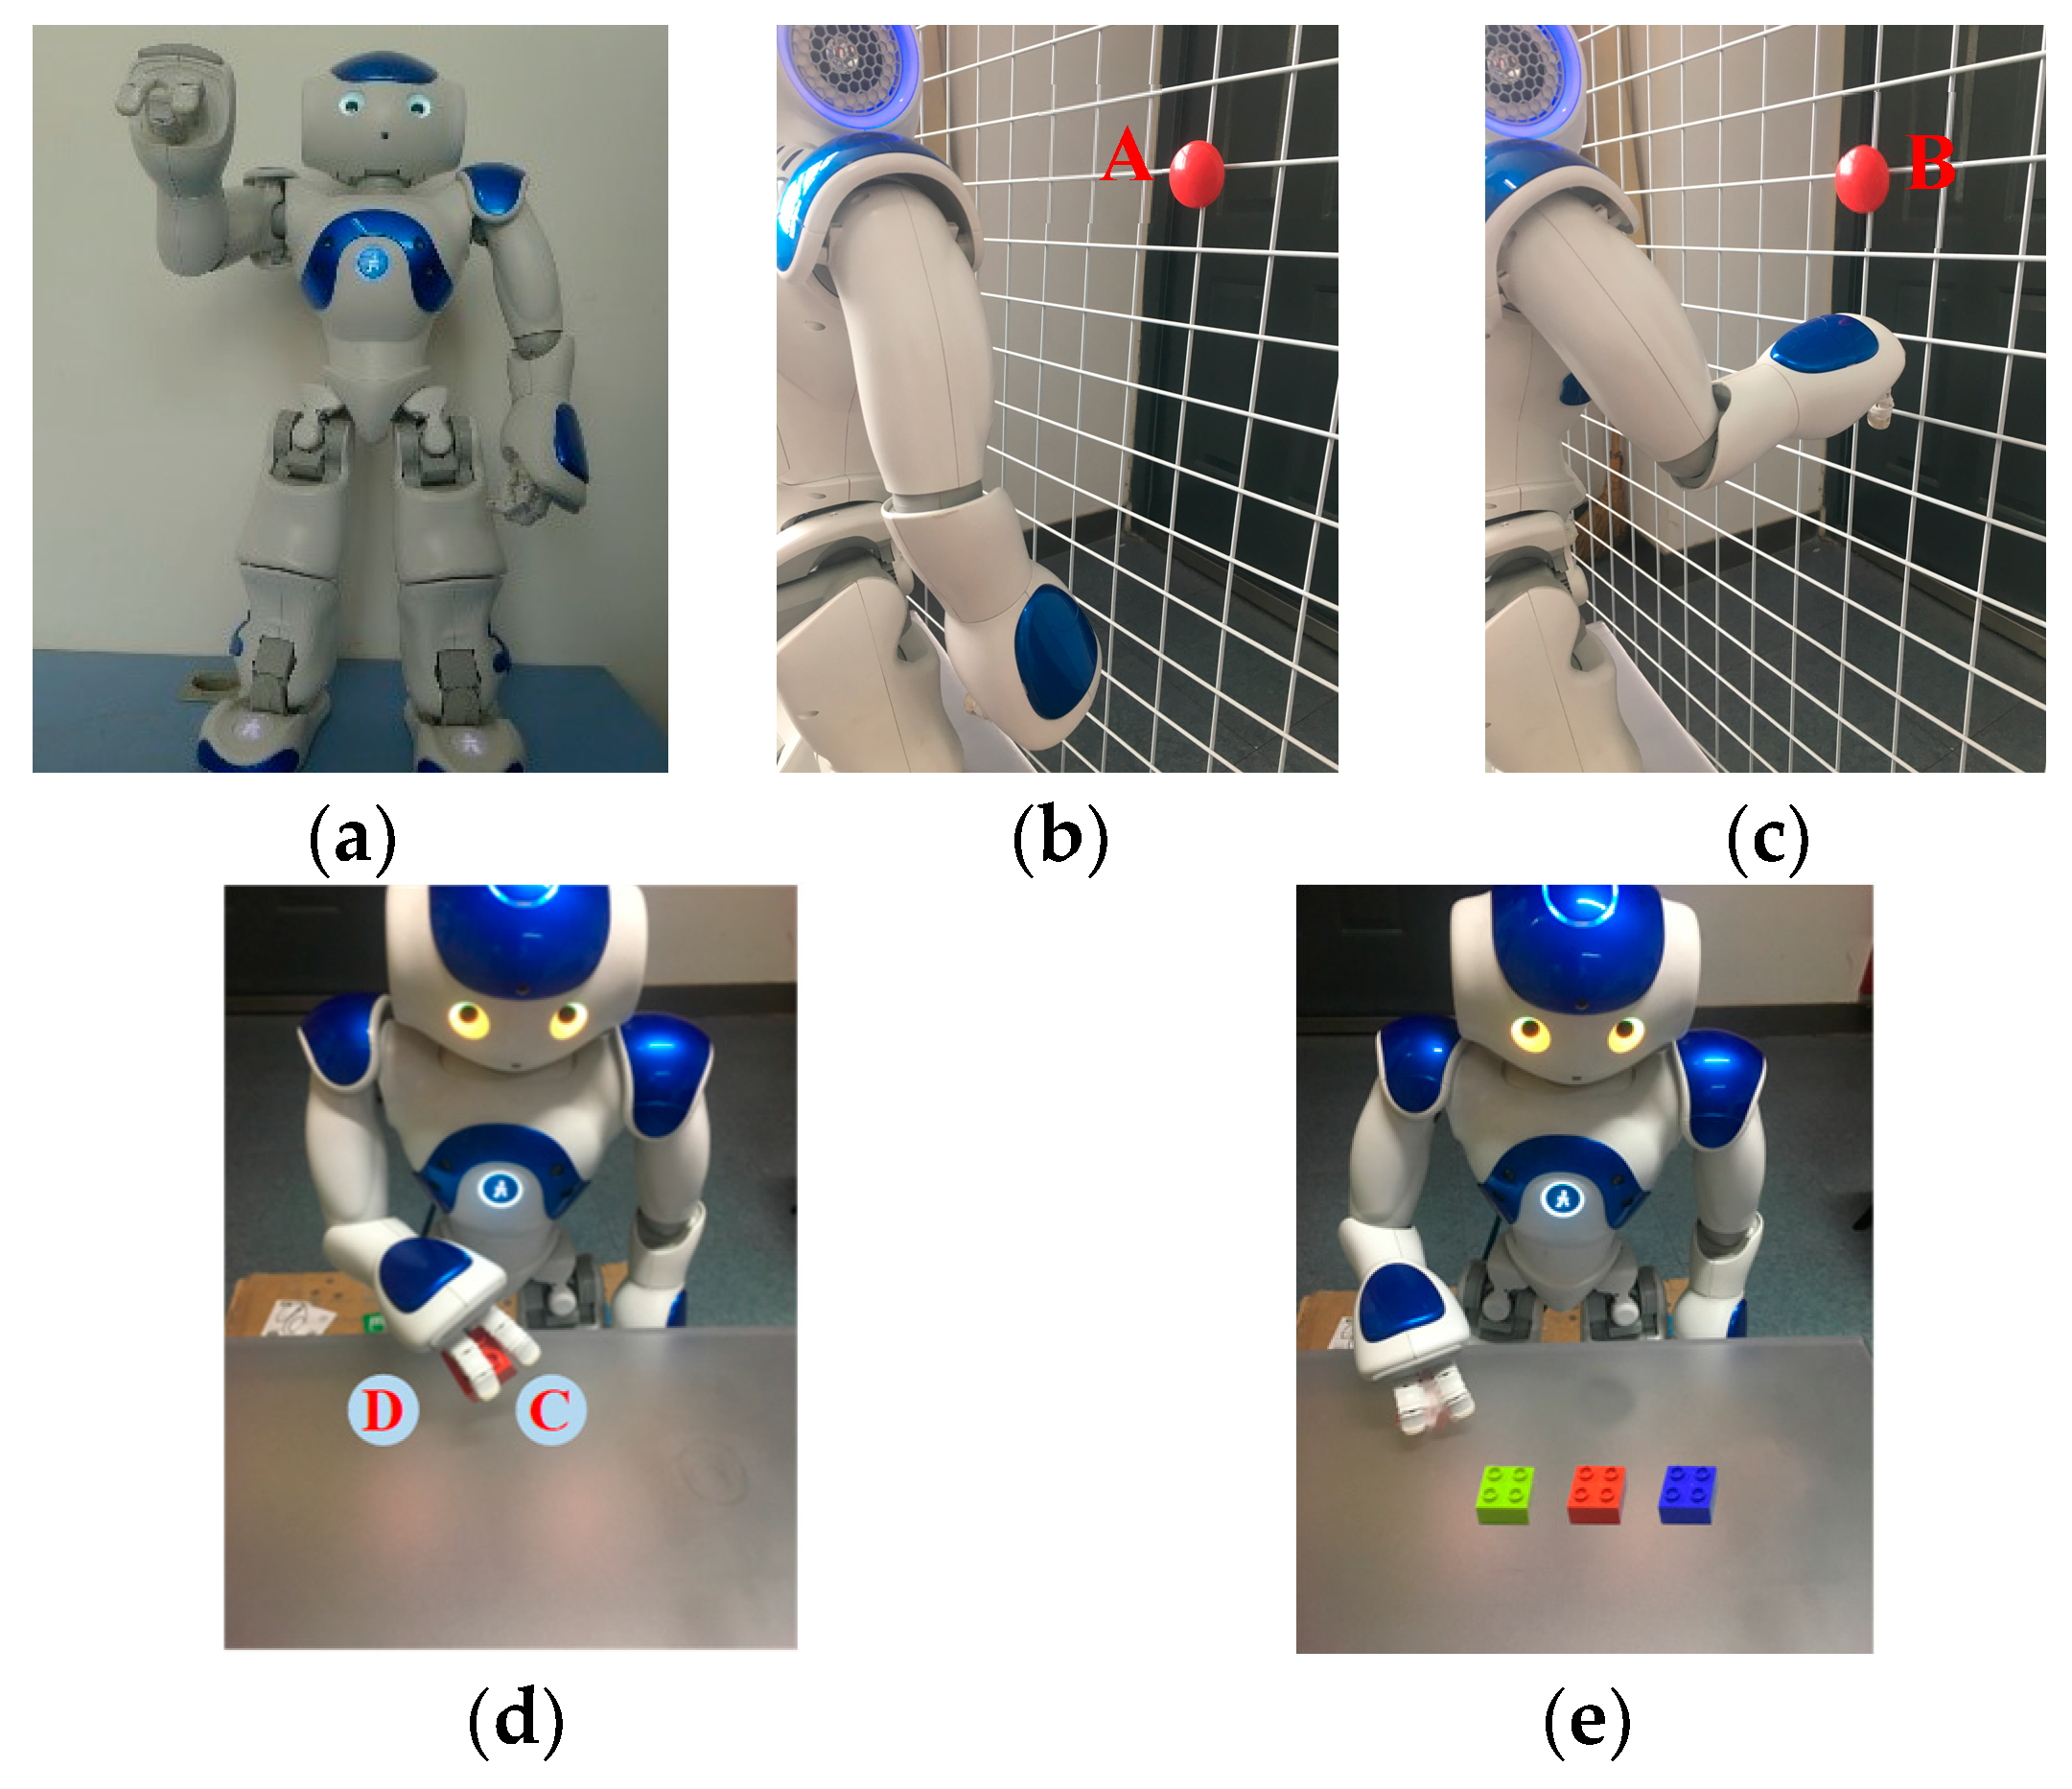
In the calculation process of the artificial emotion model, the initial personality factors of the robot were set to be neutral. Furthermore, the initial mood state was set to be [0.1, 0, 0]
T, that is, it can basically be considered that its mood state was neutral. Representative external stimuli events were selected for five human–robot interaction experiments, as shown in
Figure 14. Among them, the 1st interaction was a greeting, that is, experimenters greeted the robot; The 2th and 4th interactions were task types, that is, experimenters assigned tasks to the robot; the 3th and 5th interactions were praise/criticism types, that is, after evaluating the work completed by the robot, the robot was required to complete a task.
6.2. Calculation Results in Human–Robot Interaction Experiments
The external stimuli labeling vectors composed of the intensity of the external stimuli types and the calculated internal state of the robot are shown in
Table 8. After detecting external stimuli, the GRNN network method was used to generate the DAT emotion response vectors. The DAT emotion response vectors after personality and mood correction are shown in
Table 8. The modified DAT emotional response vectors were classified, and their emotion intensity could be calculated, as shown in
Table 9.
6.3. Calculation Results Discuss
As shown in
Figure 14, the whole human–robot interaction experiments explanation process was as follows:
- (1)
In the first interaction, the experimenter greeted the robot very enthusiastically (with a degree of enthusiasm of 0.8). At this time, the motion primitive involved was SREPWP (reaching), and the robot had a love emotion, but its corresponding emotion intensity was weak;
- (2)
In the second interaction, the experimenter asked the robot to complete a simple task. The robot completed the reaching point motion of point A, and the motion primitive involved was SREPRWP (reaching and withdrawing). At this time, the robot was stimulated by the task type for the first time, its fatigue degree was 0, and the robot was willing to accept the task. Therefore, the emotion generated by the robot was excited;
- (3)
In the third interaction, the robot was praised at a general level. The experimenter asked the robot to complete a simple task. The robot completed the reaching point motion of point B, and the motion primitive involved was SREPRWP (reaching and withdrawing). At this time, the emotion generated by the robot was rather happy;
- (4)
In the fourth interaction, the experimenter asked the robot to complete a difficult task. The initial position of the robot arm was in a naturally sagging state. The robot grabbed the building block at point C, put it at point D, and returned to the naturally sagging state. The motion primitives involved were SREPWP (reaching), SREPRWP (reaching and withdrawing), and SREPRWPR (grasping and releasing). At this time, the emotions generated by the robot were excited and anxiety;
- (5)
In the fifth interaction, the robot was severely criticized by the experimenter. The robot was asked to complete a relatively difficult task. Three building blocks were initially arranged in a blue–red–green line, and the robot rearranged the building blocks in a red–green–blue line. The motion primitives involved were SREPWP (reaching), SREPRWP (reaching and withdrawing), and SREPRWPR (grasping and releasing). At this time, the fatigue level of the robot was already very high (three consecutive tasks had been performed, including long-term high-difficulty tasks). Therefore, the emotion generated by the robot was hate.
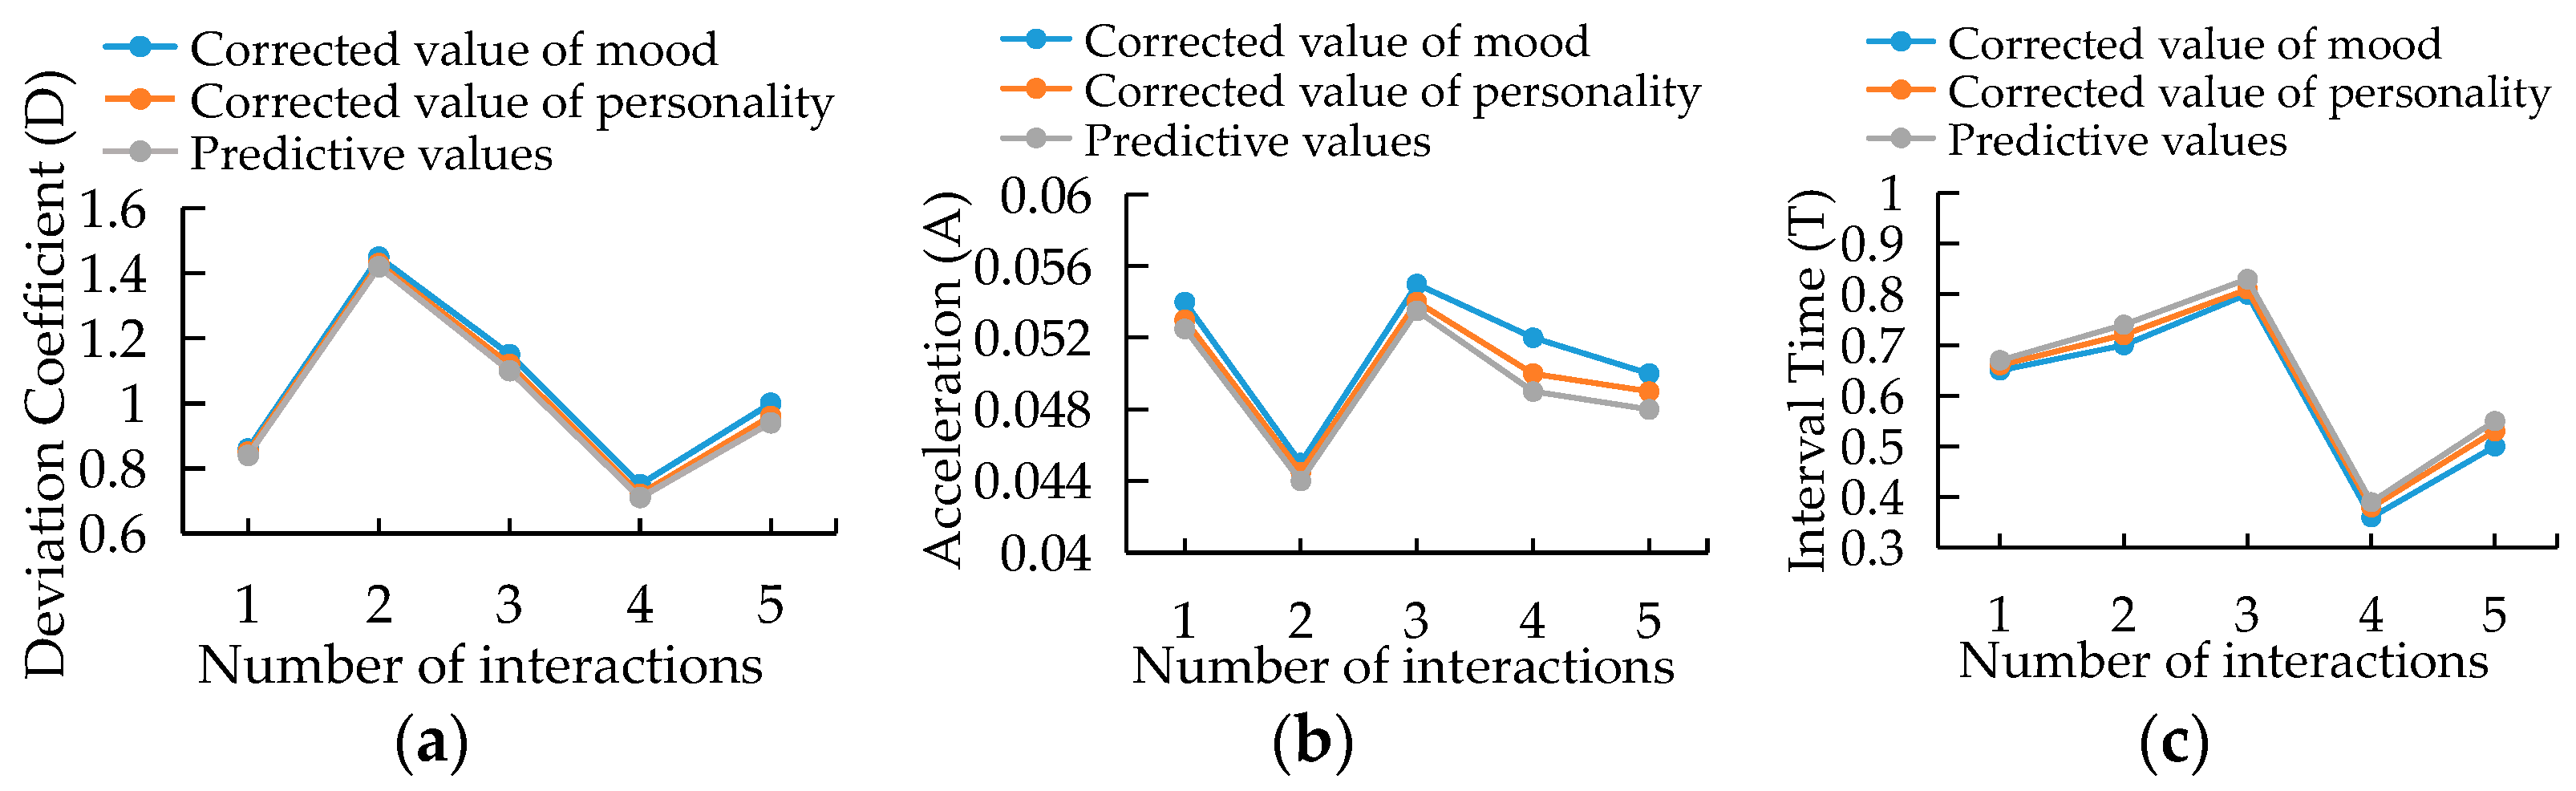
In order to investigate the influence of personality and mood on robot emotion response, the personality factors of the robot were set to 0.80 for extraversion, 0.83 for agreeableness, 0.72 for conscientiousness, 0.62 for emotional stability, and 0.7 for sophistication. Except for neuroticism, the initial personality factors were higher than the neutral level, that is, robots showed positive qualities. The initial mood state was still set to be neutral. The influence of the positive personality and mood on DAT emotion response vectors in the three dimensions is shown in
Figure 15.
It can be seen from
Figure 15 that the curves of interval time (T) were significantly higher than the predicted curve under the influence of personality, and the curves of deviation degree (D) and acceleration (A) were lower than the predicted curve under the influence of personality. That is, the robot’s experience of positive emotion was enhanced, and the experience of negative emotion was weakened, which is consistent with the robot’s personality positioning. The simulation results of negative personality were similar to this.
6.4. Human–Robot Interaction Experiment Method
In order to verify the effectiveness of emotion expression of robots based on the motion behaviors of robot. A total of 40 experimenters (N = 40) were invited to participate in the above five human–robot interaction experiments, ranging in age from 20 to 30 years, with an average age of 24.7 (SD = 1.56). In order to minimize the influence of experimenters’ familiarity with robots on the experiment results as much as possible, the 40 experimenters were divided into two groups according to the experimenters’ familiarity with robots: the group familiar with robots and the group unfamiliar with robots. In the group familiar with robots, the experimenters were relevant laboratory members and some volunteers who were currently involved in robot research. In the group unfamiliar with robots, the experimenters were students who had no special interest in robots and had never had contact with robots. In the experiments, three parameters were set to evaluate the emotion expression method: emotion recognition rate, emotion recognition time, and the Godspeed questionnaire used to evaluate people’s overall cognition of robots. People’s perceptions of robots could be evaluated by using the Godspeed questionnaire [
35]. The Godspeed questionnaire is based on five concepts of human–robot interaction: anthropomorphism, animacy, likeability, perceived intelligence, and perceived safety. Anthropomorphism is used to describe the attributes of human-like, such as naturalness, life, consciousness, and so on. Animacy is used to describe the attributes of life, such as organic, lively, lifelike, and so on. Likeability is used to describe positive impressions other people might have, such as pleasant, nice, friendly, and so on. Perceived intelligence is mainly used to describe the expected capabilities of robots, such as knowledgeable, competent, sensible, and so on. Perceived safety is mainly used to describe the comfort of people when interacting with robots, such as relaxed, quiescent, calm, and so on. These five aspects were divided into grades from 1 to 5. The emotion expression method based on the motion behaviors of robot was verified by these three parameters (emotion recognition rate, emotion recognition time, and Godspeed questionnaire).
In the experiments, all the experimenters were informed in advance how the experiment would be conducted. The robot showed emotions (love, excited, happy, anxiety, hate) generated in the above five human–robot interactions to the 40 experimenters in turn. The experimenters and the robot NAO were on either side of a desk. There was a questionnaire, a pen, and a tablet computer on the desk. There were eight buttons on the tablet computer, and each button represented an emotion state. When the emotion expressed by the humanoid robot NAO was recognized by the experimenter, the corresponding button in the tablet was pressed to record the recognition time. Although the experimenters were not informed that the recognition time was used as one of the evaluation parameters, the experimenters were still required to complete the evaluation answer as soon as possible. In the experiments, the humanoid robot NAO served as a platform for emotion display, and the motion behaviors of the humanoid robot NAO could be compiled offline through its own software.
6.5. Experiments Results
In this paper, a two-way ANOVA analysis [
36] using the SPSS statistical package (SPSS Inc., Chicago, IL, USA) was used to analyze all the experiment results (emotion recognition rate, emotion recognition time, and Godspeed questionnaire). The emotions (love, excited, happy, anxiety, hate) were defined as the within-experimenter factors, and familiarity (familiar, unfamiliar) was defined as the between-experimenter factors. The two-way ANOVA analysis of the emotion recognition rate using the SPSS statistical package was taken as an example. In this paper, six hypotheses needed to be satisfied to judge the influence of independent variables (emotion type and familiarity) on dependent variables (emotion recognition rate).
Hypothesis 1 (H1). The dependent variable is a continuous variable.
Hypothesis 2 (H2). There are two independent variables, and the two independent variables are categorical variables.
Hypothesis 3 (H3). The dependent variable has independent observations.
Hypothesis 4 (H4). There are no significant outliers in any classification.
Hypothesis 5 (H5). The residuals in any classification are approximately a normal distribution.
Hypothesis 6 (H6). Any classification has equal variance.
The influence of independent variables (emotion type and familiarity) on dependent variables (emotion recognition rate) was studied in this paper, which could be judged to meet H1, H2, and H3. The residuals were required to test H4, H5, and H6.
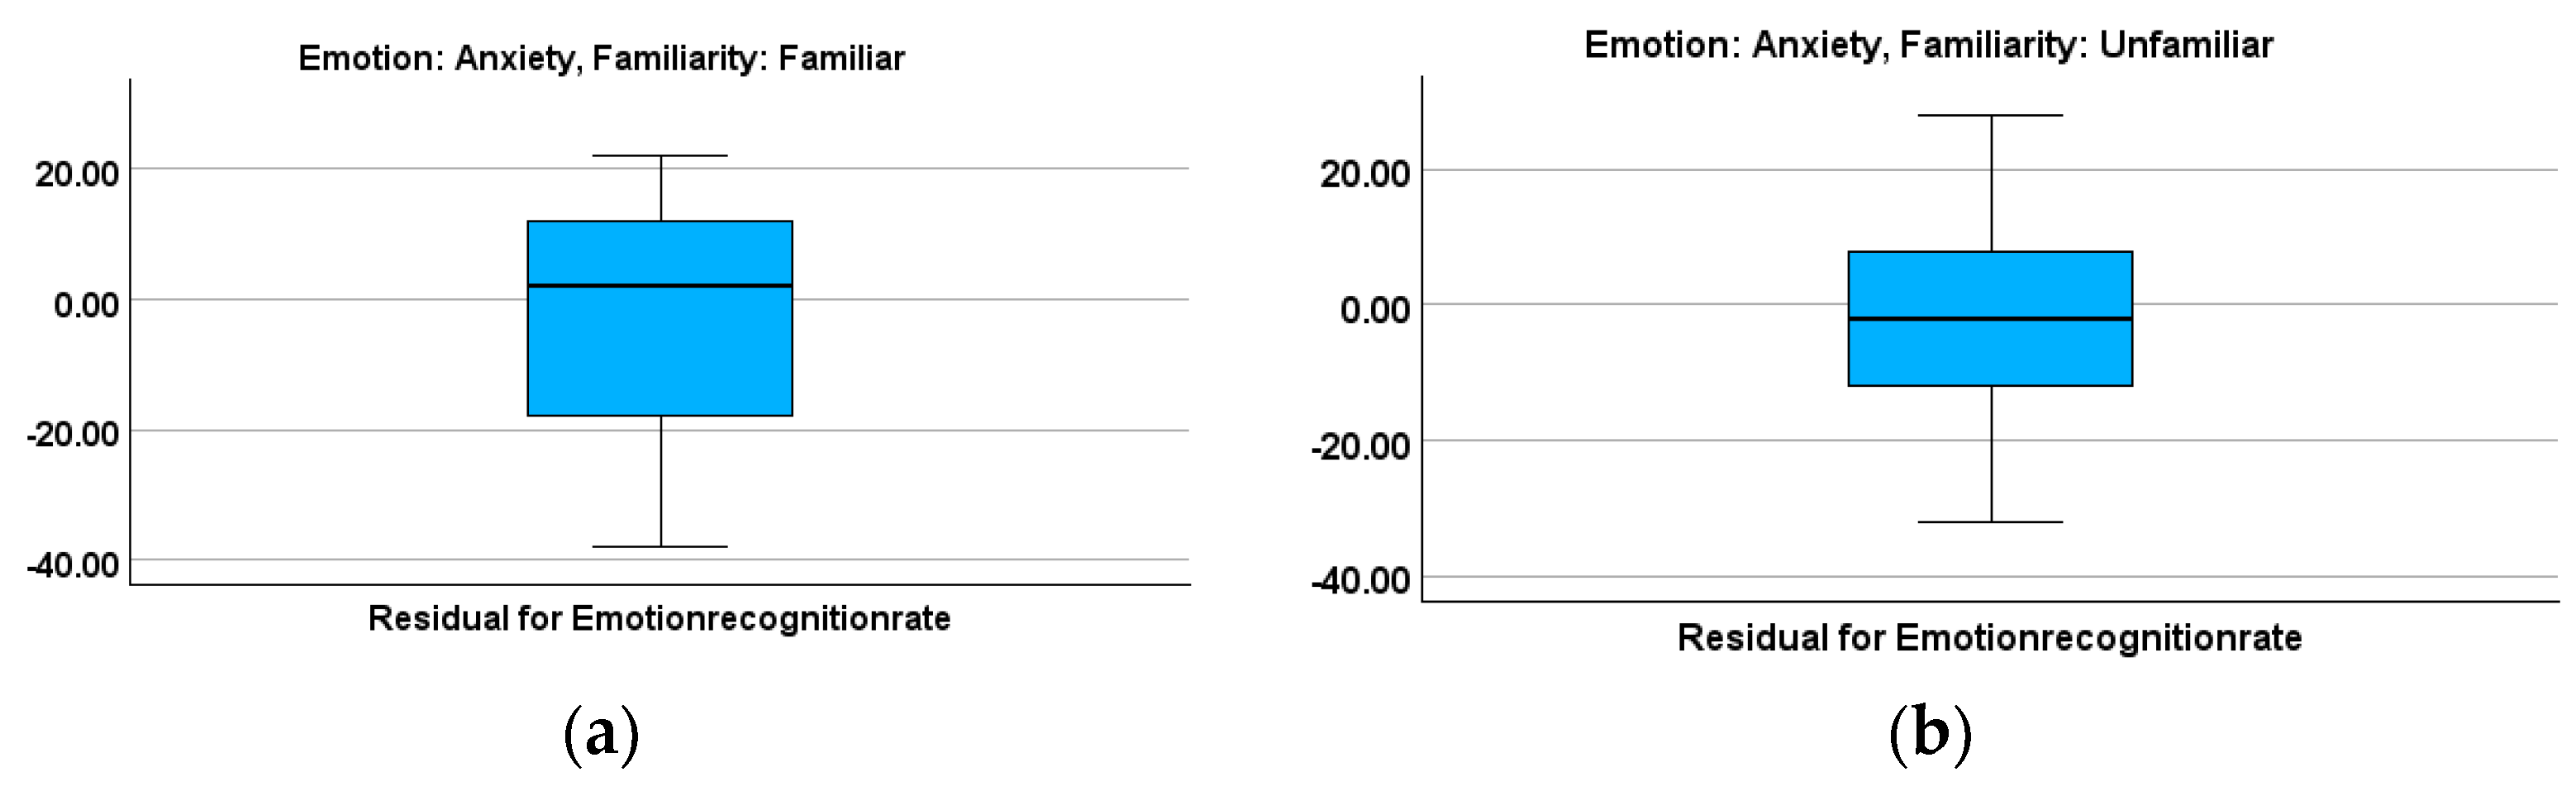
For
H4, the SPSS test results were represented by a total of 10 boxplots. The boxplot of anxiety and familiar and the boxplot of anxiety and unfamiliar were taken as examples to show the test results, as shown in
Figure 16. It can be seen from
Figure 16 that there were no abnormal values, and the other eight boxplots had no abnormal values, which proved that the research data met
H4.
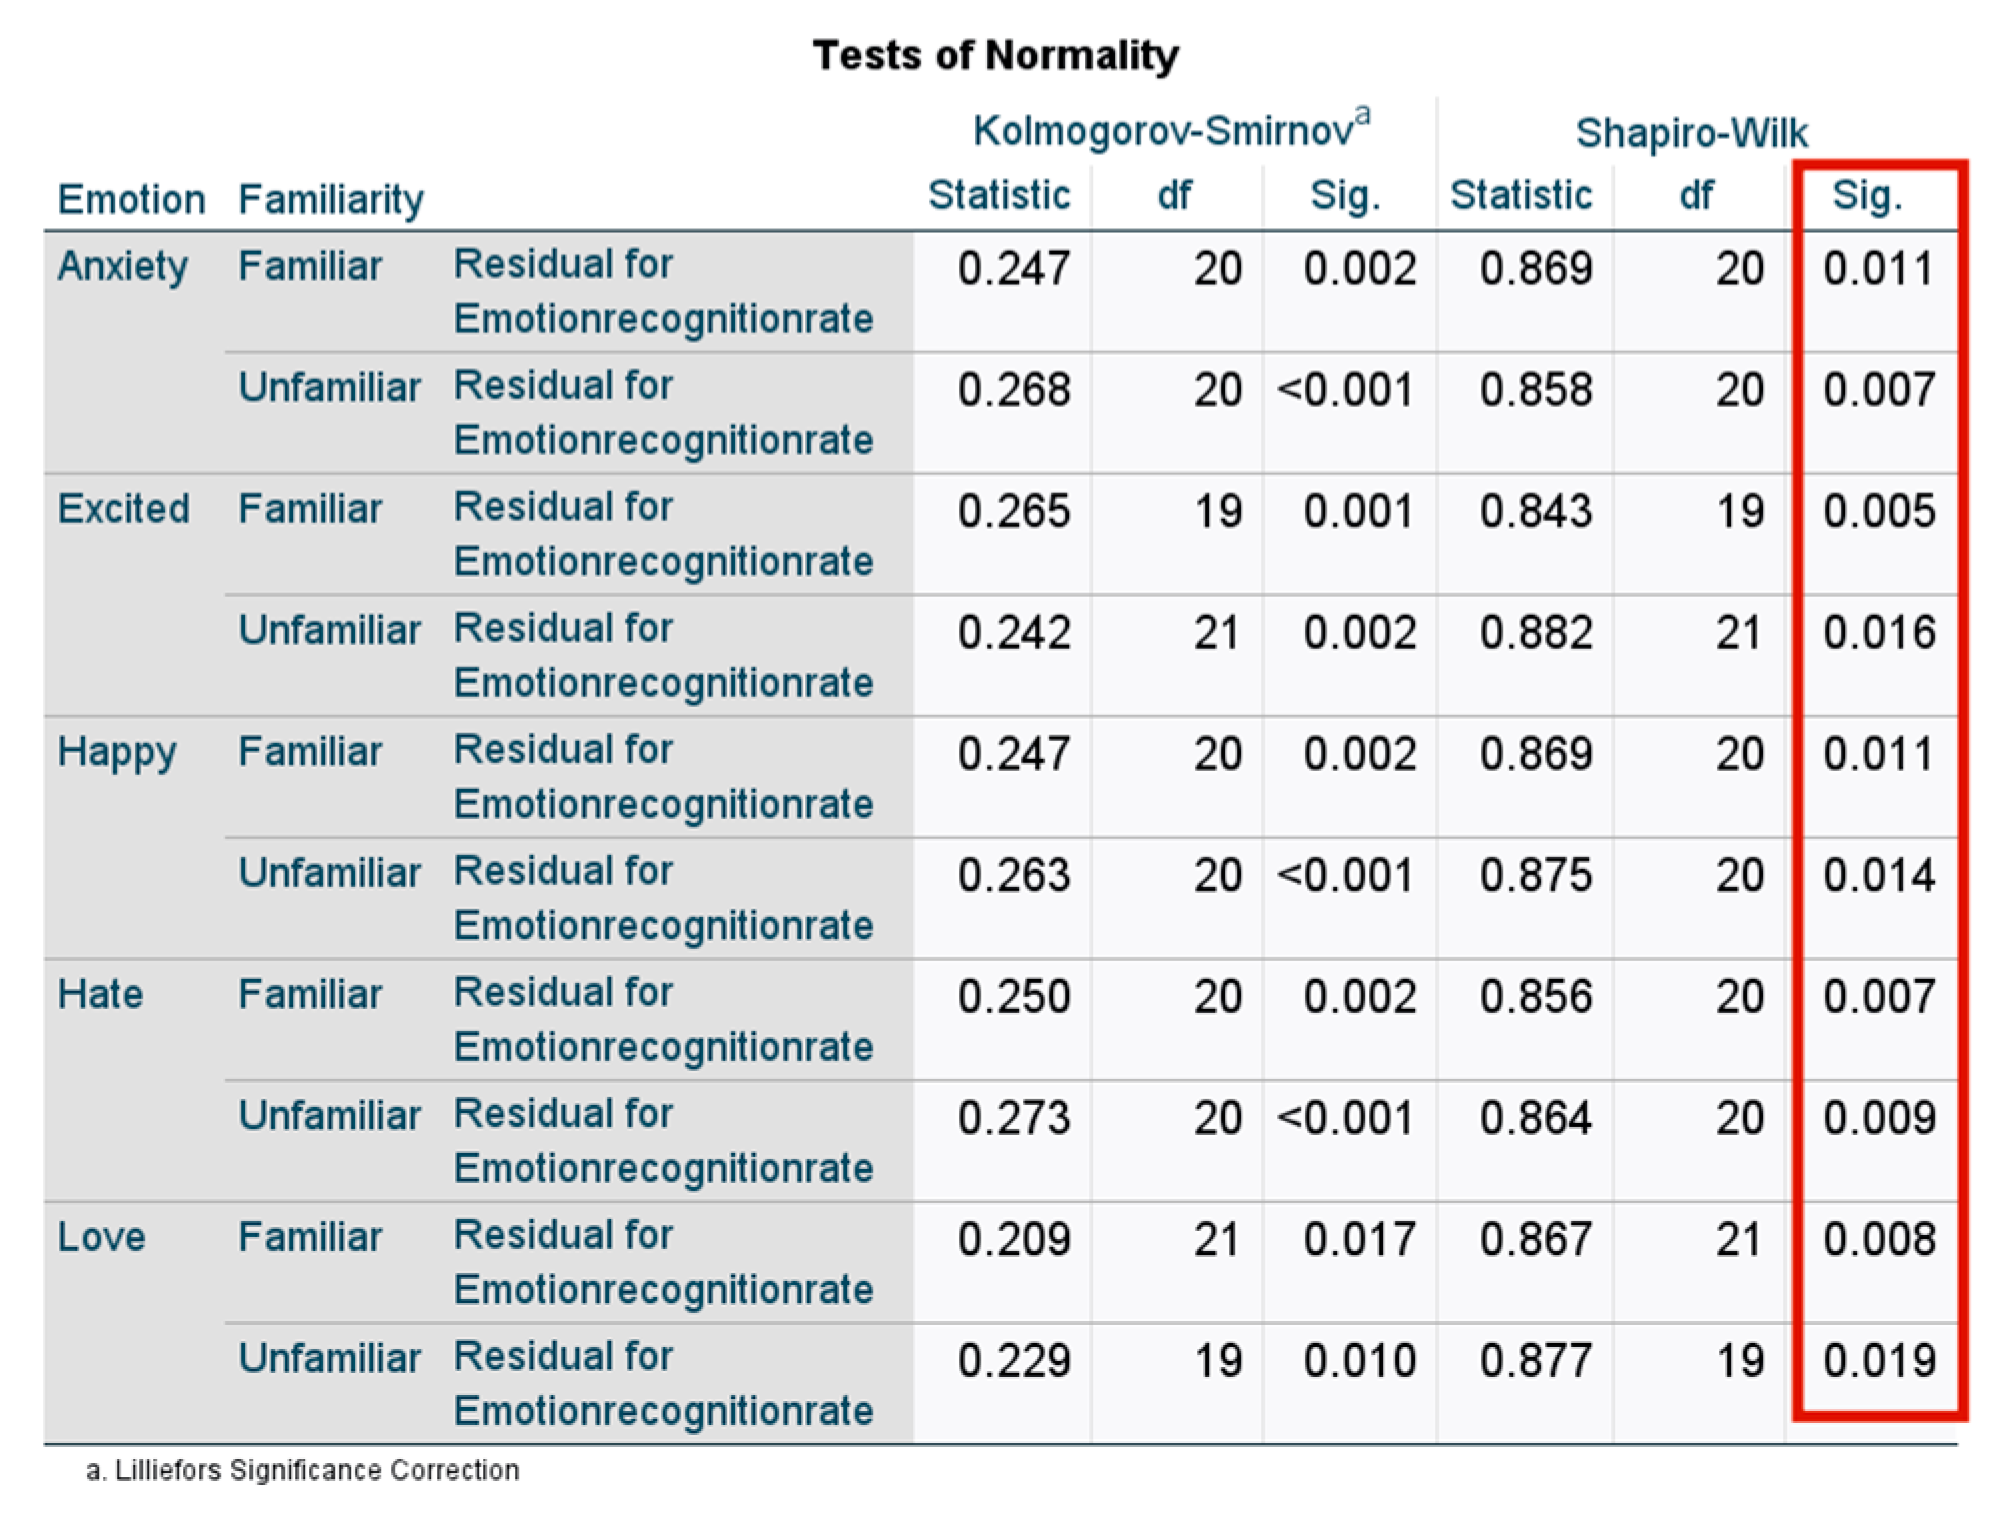
For
H5, the Shapiro–Wilk test was used to test the normality of data; the test results are shown in
Figure 17. It can be seen from
Figure 17 that the P value of each group was greater than 0.05, that is, the residual in any classification was approximately a normal distribution, which proved that the research data met
H5.
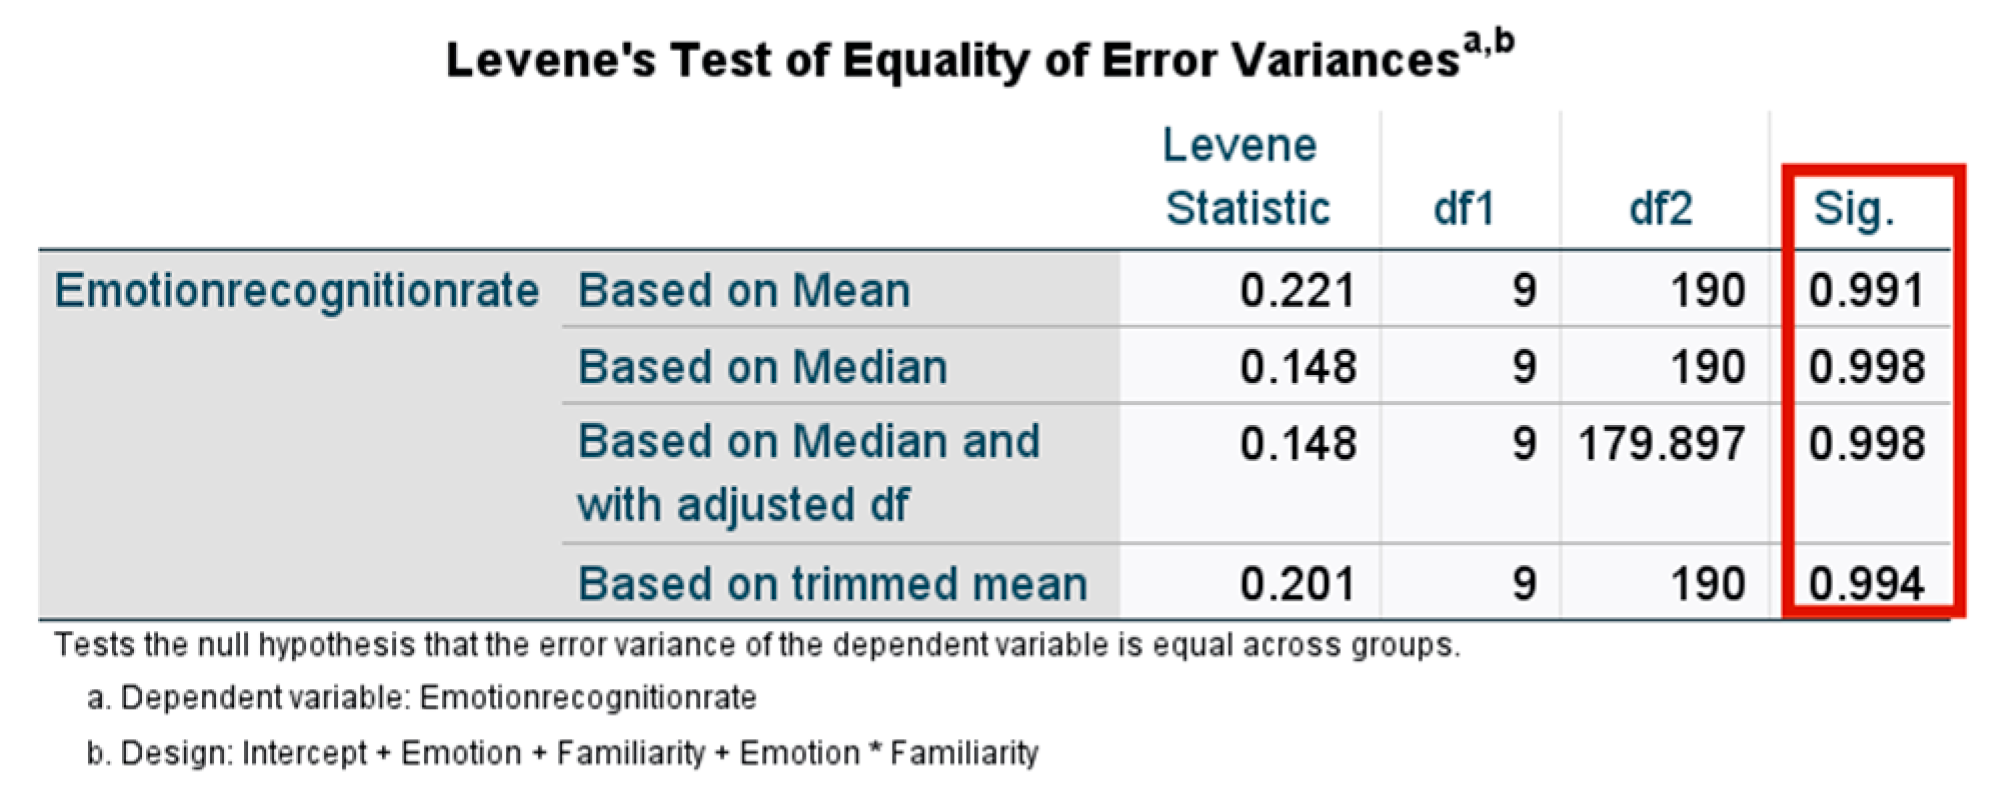
For
H6, the Levene variance homogeneity test was used to test the hypothesis that any classification has equal variance; the test results are shown in
Figure 18. It can be seen from
Figure 18 that the
p value was greater than 0.05, that is, any classification had equal variance, which proved that the research data met
H6.
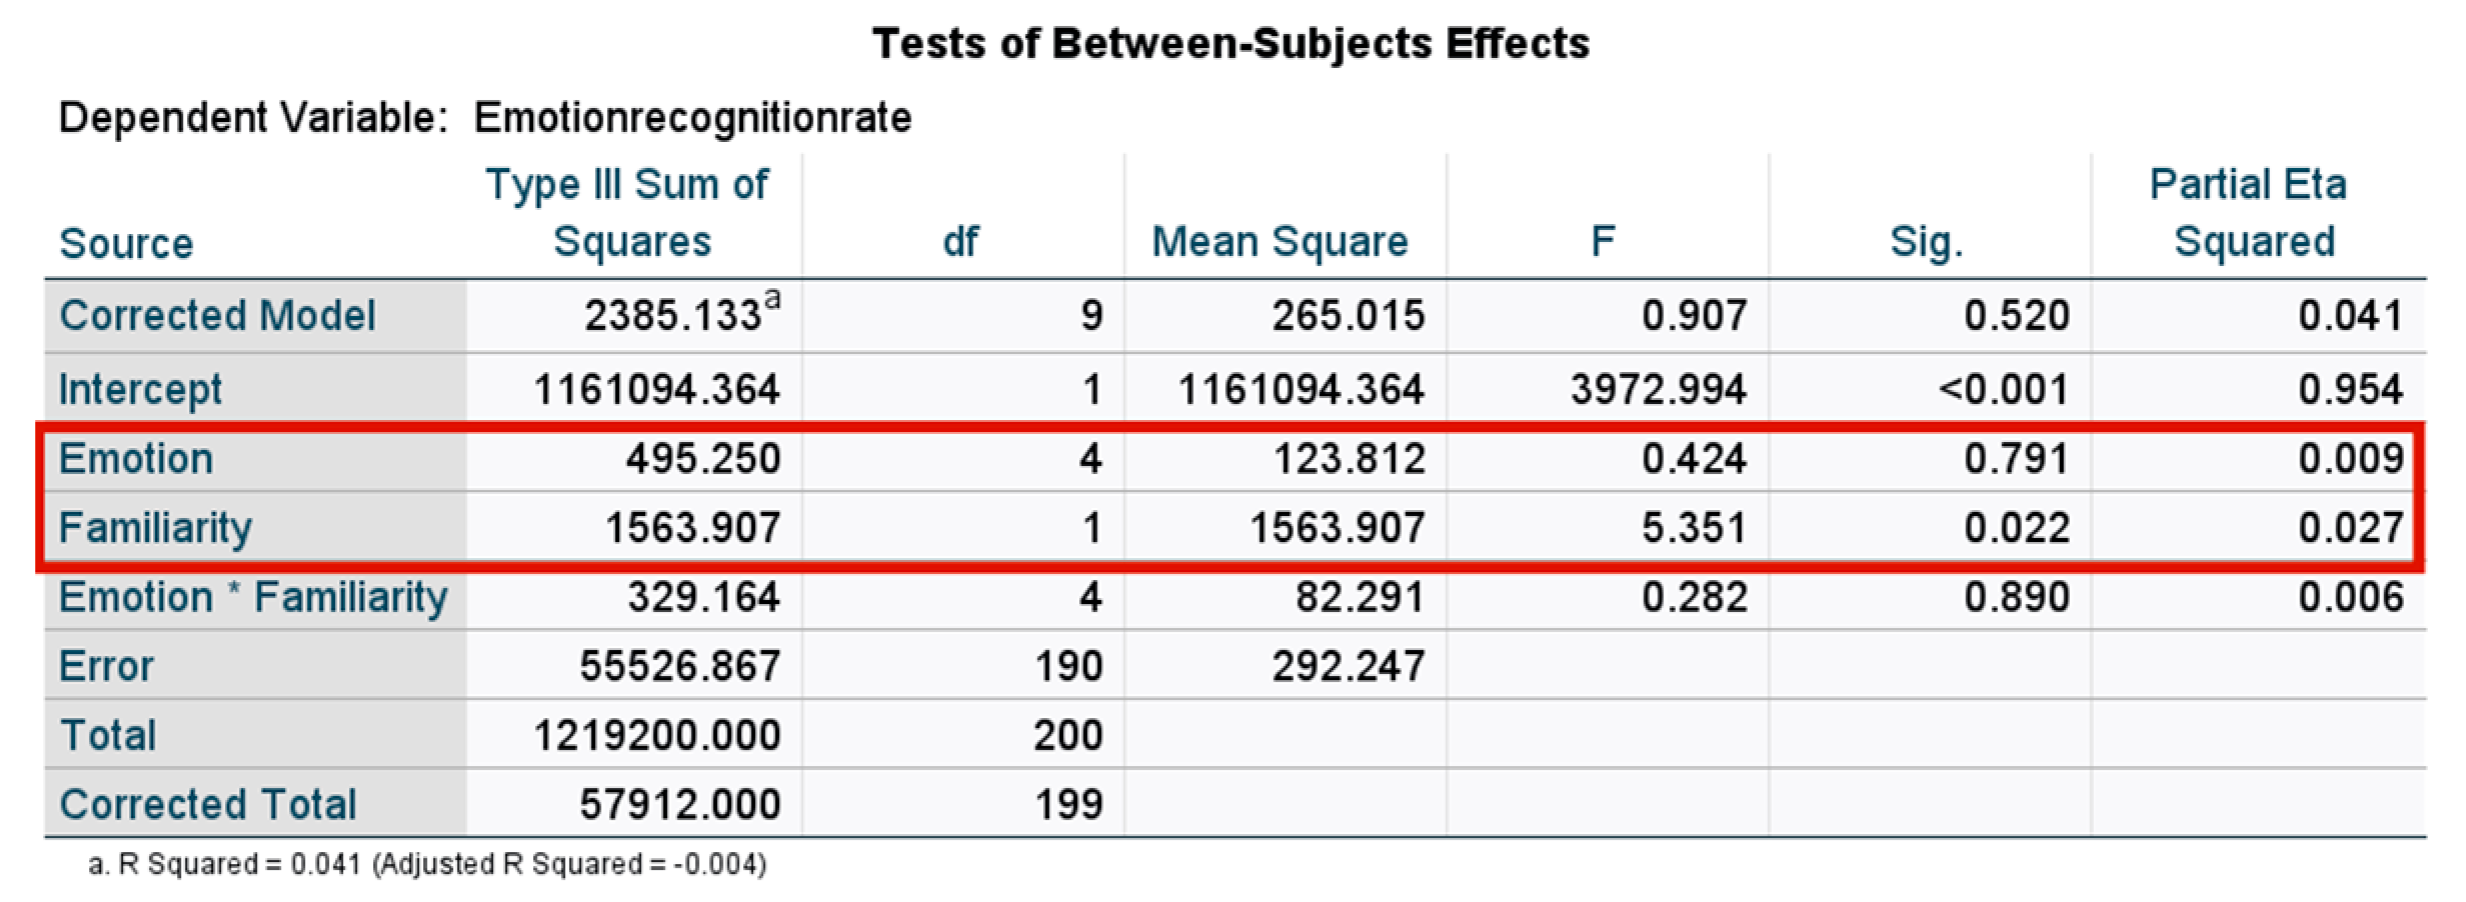
The results of the analysis of main effect is shown in
Figure 19. It can be seen from
Figure 19 that the emotion’s value of
p was 0.791 > 0.05, which indicates the recognition rate was not influenced by the kinds of emotions expressed by the robot, and the familiarity’s value of
p was 0.022 > 0.05, which indicates that the experimenters recognized that the emotion expressed by the robot was not influenced by familiarity.
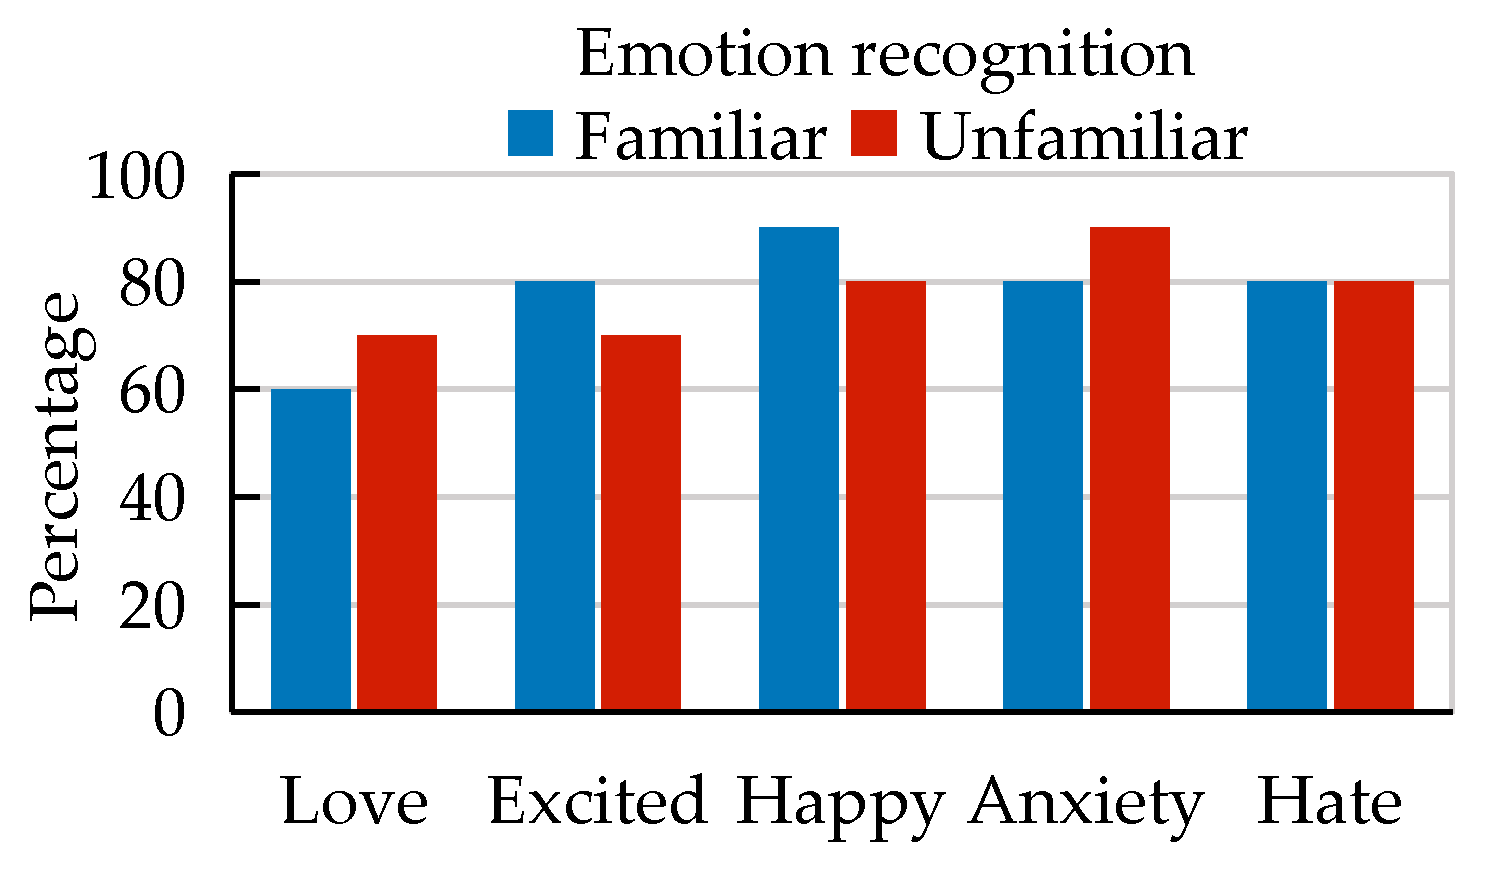
6.5.1. Emotion Recognition Rate
The results of the emotion recognition rate are presented in
Figure 20. As shown in
Figure 20, experimenters recognized the emotion expressed by the robot was not influenced by familiarity (
p > 0.05). At the same time, the recognition rate was not influenced by the kinds of emotions expressed by the robot (
p > 0.05).
6.5.2. Emotion Recognition Time
The results of the recognition time are presented in
Table 10. As shown in
Table 10, the type of emotion was the primary factor influencing recognition time (
p < 0.05). At the same time, there was no significant statistical difference in recognition time between the familiar group and the unfamiliar group. The results concluded that the high recognition time of the love emotion was caused by the low recognition rate of the love emotion.
6.5.3. Godspeed Questionnaire
In this paper, the reliability of the Godspeed questionnaire was tested: anthropomorphism (Cronbach’s = 0.84), animacy (Cronbach’s = 0.86), likeability (Cronbach’s = 0.80), perceived intelligence (Cronbach’s = 0.84), and perceived safety (Cronbach’s = 0.81). The results showed that the questionnaire had good reliability according to these values of reliability.
The anthropomorphism scores are presented in
Figure 21. As shown in
Figure 21, the type of the emotion had a certain influence on the anthropomorphism score (
p < 0.05). The scores of the three emotions of love, excited, and hate in the unfamiliar group were higher than those in the familiar group, while the scores of the two emotions of happy and anxiety were opposite. Both the familiar group and unfamiliar group had higher scores in the emotion of happy.
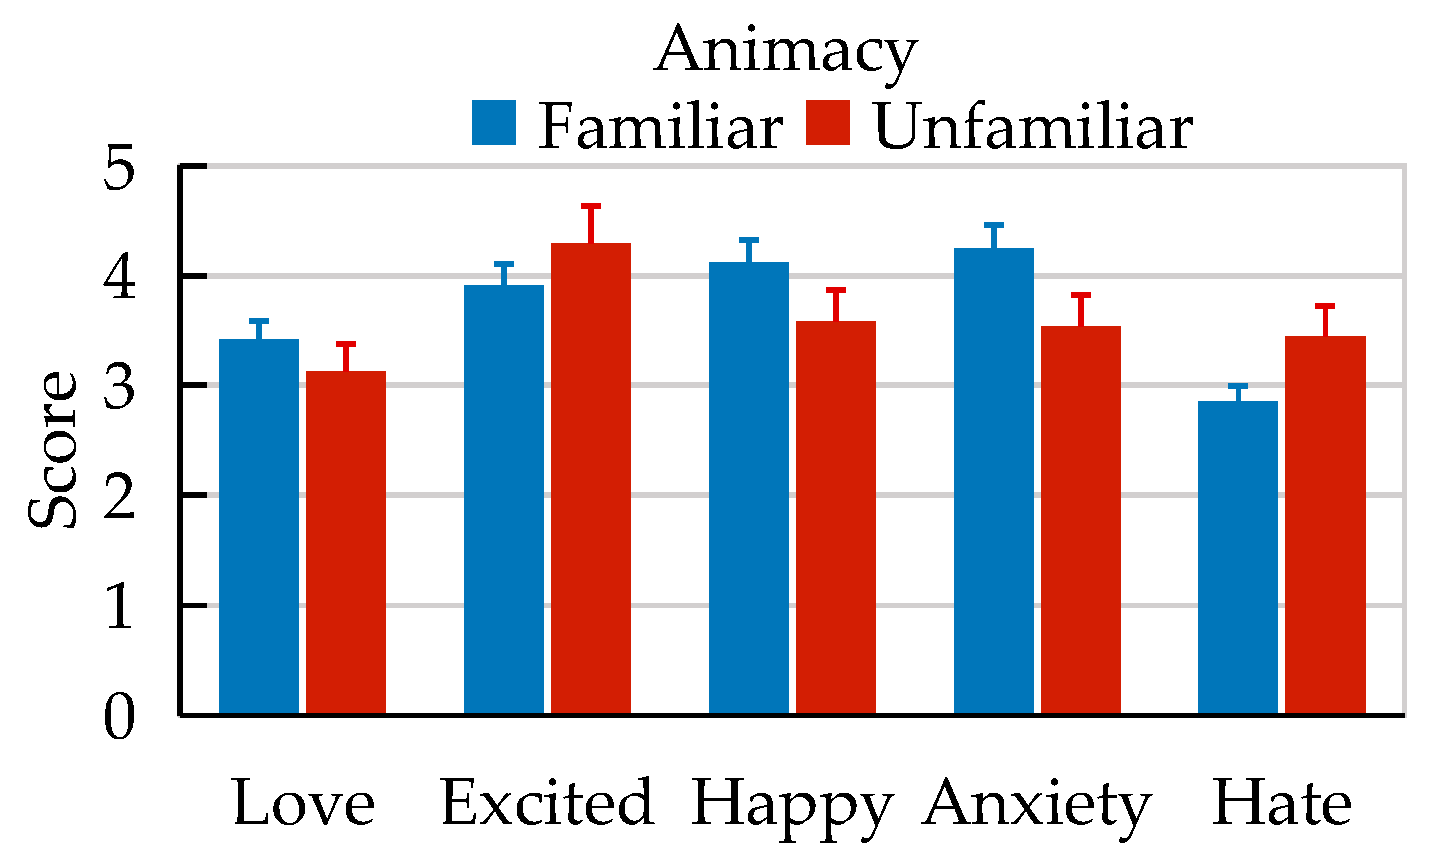
The animacy scores are presented in
Figure 22. As shown in
Figure 22, the type of emotion also had certain influence on the animacy scores (
p < 0.05). Both the familiar group and unfamiliar group had higher scores in the emotions of excited, happy, and anxiety.
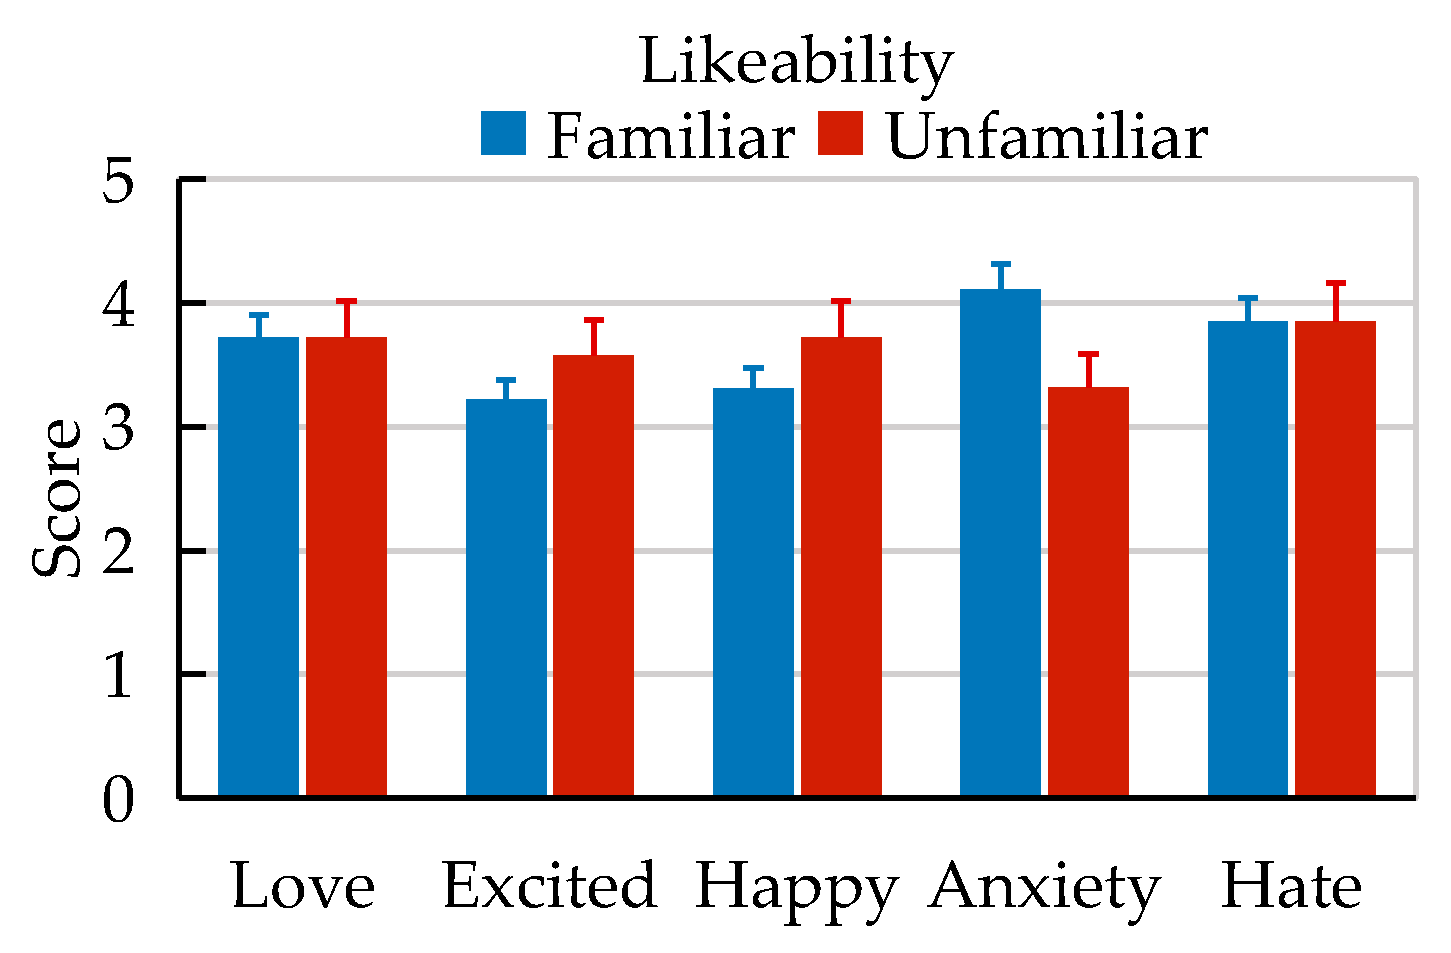
The likeability scores are presented in
Figure 23. As shown in
Figure 23, compared with the familiar group, the unfamiliar group had higher scores in the emotions of excited and happy.
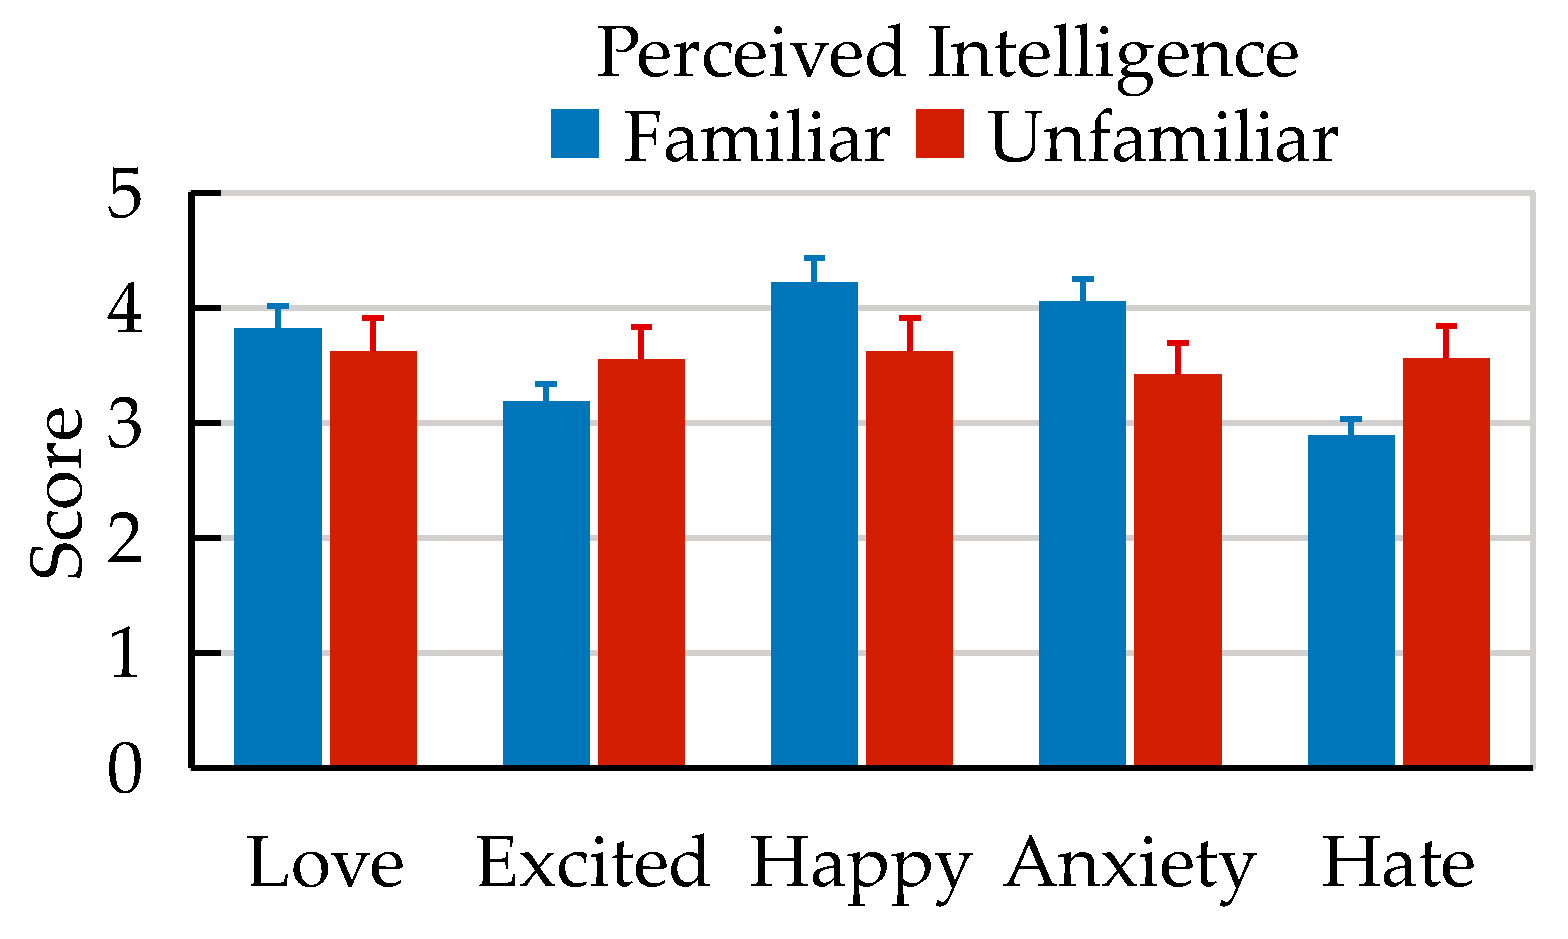
The intelligence scores are presented in
Figure 24. As shown in
Figure 24, compared with the unfamiliar group, the familiar group had higher scores in the emotions of love, happy, and anxiety. Familiarity with the robots had a certain effect on scores (
p < 0.05), while the type of emotion had no influence on scores (
p > 0.05).
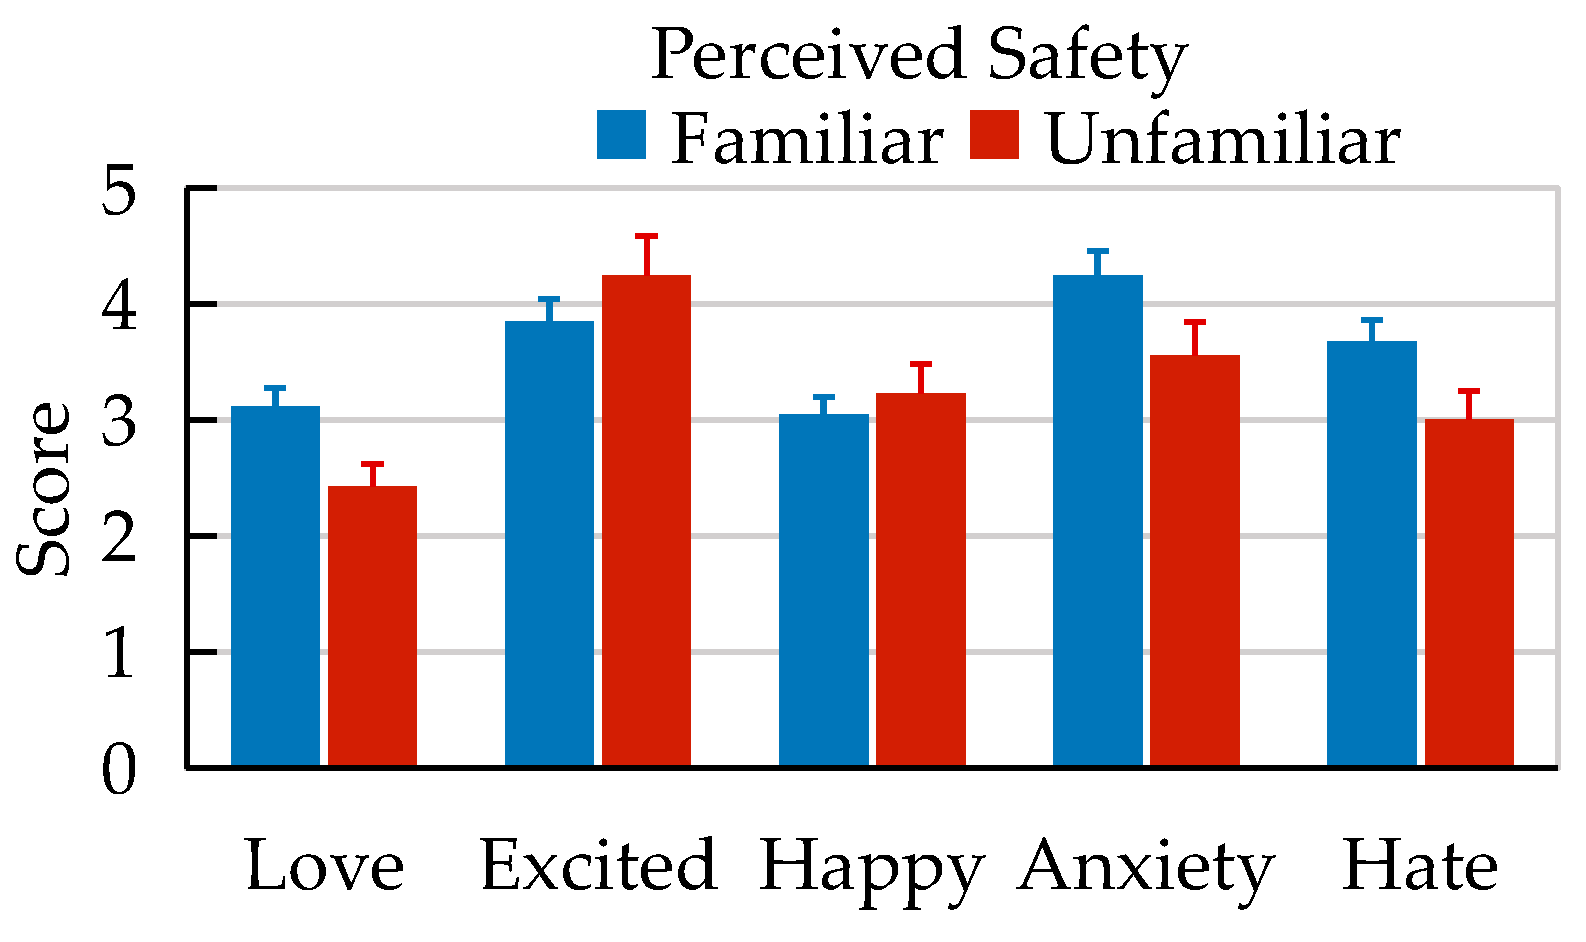
The safety scores are presented in
Figure 25. As shown in
Figure 25, the type of emotion had a certain influence on the safety scores (
p < 0.05). Both the familiar group and unfamiliar group thought that the robot had the highest safety score in the emotion of excited.
6.6. Experiment Result Discuss
The human–robot interaction experiments were mainly applied to verify whether robots can express emotions (happy, hate, and so on) in the process of motion. It can be seen from the emotion recognition rate in the
Figure 20 that the robot emotion expression method based on the motion behavior proposed in this paper could obtain better emotion recognition results. Among them, the love pattern achieved 65%, the excited pattern achieved 75%, the happy pattern achieved 84%, the anxiety pattern achieved 86%, the hate pattern achieved 79%, and overall pattern emotion recognition achieved 78%. At the same time, it can be seen from the emotion recognition rate in
Figure 18 that the experimenters’ familiarity with the robots did not affect the experimenters’ emotion recognition of robots. This showed that whether or not the experimenters were familiar with the robots, they could still well identify the emotions expressed by the robots. The five human–robot interaction experiments were mainly used to explore the influence of positive emotions such as love, excited, and happy and negative emotions such as anxiety and hate on the people’s cognition of the robots. The results showed that the motion behaviors of the robot did not have a great impact on people’s cognition of the robots, but the emotions expressed by the robots had an impact on people’s cognition of the robots. Among the Godspeed’s variables, only perceived intelligence was affected by experimenters’ familiarity with the robots (
p < 0.05), and the same time, all the Godspeed variables were affected by the emotions. In addition, most of the experimenters believed that when the robot expressed a positive emotion such as love, excited, or happy, the experimenters would feel safe and comfortable. These results could provide help for us to design robot behaviors in human–robot interactions.
7. Conclusions
A system for integrating an emotion expression model into the behaviors of robots is proposed in this paper. An artificial emotion expression method that accords with human emotion, can deal with external stimuli, and has the capability of emotion decision-making was proposed based on the motion behaviors of robots. The novel artificial emotion expression method based on the behaviors of robots is different from the traditional speech, face, and gesture emotion expression method. Compared with speech expression, this method does not require a sensitive sensing system. Compared with face expression, this method does not require the robot to have a fine structure. Compared with gesture expression, this method is more universal in the motion type and range. The novel artificial emotion expression method based on the behaviors of the robot can be directly and quantitatively applied to robot motion planning, so that the robot can express a variety of emotions in the process of motion.
(1) A DAT three-dimensional emotion space was established based on the motion indexes (deviation coefficient, acceleration, and interval time). Then an artificial emotion expression model considering personality and mood was established based on the DAT three-dimensional emotion space, and an effective method of annotating external stimuli was proposed. A generalized regression network was trained based on the emotion response samples, with a fitting error of 0.1 (±0.03). An autonomous and personalized emotion response to external stimuli was achieved.
(2) The original emotion classification sample was split and expanded, and the sample feature set was effectively selected according to the information gain rate theory. After removing the redundant irrelevant features in the emotion classification samples, the random forest classifier was trained to realize the emotion classification, and the classification accuracy was more than 85%.
(3) Robots could generate corresponding emotions according to external stimuli and perform emotion expression in the five human–robot interaction experiments, the human–robot emotion interaction could be achieved, and the effectiveness of the artificial emotion model could be verified.
This paper introduced an artificial emotion expression method based on the behaviors of a robot by taking robotic arms as an example. The artificial emotion expression method based on the motion behavior of the robot proposed in this paper can be applied to other parts of the humanoid robot (such as head, torso, legs, and so on). Through the emotion expression experiments, it was found that when the robot presented positive emotions, most of the experimenters were happy to interact with the robot. When the robot presented negative emotions, only a few people were willing to interact with the robot. Therefore, like the human–human interaction, the emotion expression of robots can affect the behavior of interactors.
8. Recommendations and Future Work
(1) In the emotion expression of robots, an artificial emotion expression method, which can deal with external stimuli and has the ability of emotion decision-making, was proposed based on the motion behaviors of robots to make the robots express rich and colorful emotions through motion behaviors. In the future, the motion characteristics of the human body under different emotions can be extracted by the visual system, so that the robot can recognize the emotions expressed by motion behaviors of human. The integration of emotional expression, emotional recognition, and emotional influence can be realized in human–robot emotion interactions.
(2) Moreover, the face recognition function of robots can be added, and the associative memory function can be considered in the artificial emotion model, so that the robot can judge the familiarity of the interactions.
(3) In order to obtain human-like emotion responses, the artificial emotion model established in this paper requires the machine learning algorithm to learn human emotion samples. However, when using the emotion measurement method based on the behavioral response in the human–human interaction to collect emotional samples, the more emotion samples collected, the more accurate the human-like emotion responses will be. It is difficult to collect a large number of emotion samples. In the future, artificial intelligence algorithms such as the reinforcement learning algorithm can be used to enable robots to learn autonomously and in real-time human–robot interaction.
Author Contributions
Conceptualization, L.L. and Z.Z.; methodology, L.L.; software, L.L.; validation, L.L.; formal analysis, L.L.; investigation, L.L.; resources, Z.Z.; data curation, L.L.; writing—original draft preparation, L.L.; writing—review and editing, Z.Z.; visualization, L.L.; supervision, Z.Z.; project administration, Z.Z.; funding acquisition, Z.Z. All authors have read and agreed to the published version of the manuscript.
Funding
This work was supported by National Natural Science Foundation of China (Grant No. 12002032).
Data Availability Statement
Not applicable.
Acknowledgments
The authors thank Yuan Wei for guidance in terms of topic selection.
Conflicts of Interest
The authors declare no conflict of interest. The funders had no role in the design of the study; in the collection, analyses, or interpretation of data; in the writing of the manuscript; or in the decision to publish the results.
References
- Menne, I.M.; Schwab, F. Faces of emotion: Investigating emotional facial expressions towards a robot. Int. J. Soc. Robot. 2018, 10, 199–209. [Google Scholar] [CrossRef]
- Kim, Y.; Provost, E.M. Emotion recognition during speech using dynamics of multiple regions of the face. ACM Trans. Multimed. Comput. Commun. Appl. 2015, 12, 1–23. [Google Scholar] [CrossRef]
- Kucherenko, T.; Hasegawa, D.; Kaneko, N.; Henter, G.E.; Kjellström, H. Moving fast and slow: Analysis of representations and post-processing in speech-driven automatic gesture generation. Int. J. Hum.-Comput. Interact. 2021, 37, 1300–1316. [Google Scholar] [CrossRef]
- Ekman, P.; Friesen, W.V. Constants across cultures in the face and emotion. J. Personal. Soc. Psychol. 1971, 17, 124–129. [Google Scholar] [CrossRef]
- De Gelder, B. Towards the neurobiology of emotional body language. Nat. Rev. Neurosci. 2006, 7, 242–249. [Google Scholar] [CrossRef] [PubMed]
- Witkower, Z.; Tracy, J.L. Bodily communication of emotion: Evidence for extrafacial behavioral expressions and available coding systems. Emot. Rev. 2019, 11, 184–193. [Google Scholar] [CrossRef]
- Keer, M.; van den Putte, B.; Neijens, P. The role of affect and cognition in health decision making. Br. J. Soc. Psychol. 2010, 49, 143–153. [Google Scholar] [CrossRef]
- Loewenstein, G.; Lerner, J.S. The role of affect in decision making. Handb. Affect. Sci. 2003, 3, 619–642. [Google Scholar]
- Miwa, H.; Itoh, K.; Matsumoto, M.; Zecca, M.; Takanobu, H.; Rocella, S.; Carrozza, M.C.; Dario, P.; Takanishi, A. Effective emotional expressions with expression humanoid robot we-4rii: Integration of humanoid robot hand rch-1. In Proceedings of the 2004 IEEE/RSJ International Conference on Intelligent Robots and Systems (IROS), Sendai, Japan, 28 September–2 October 2004; pp. 2203–2208. [Google Scholar]
- Hauser, K. Recognition, prediction, and planning for assistedteleoperation of freeform tasks. Auton Robot 2013, 35, 241–254. [Google Scholar] [CrossRef]
- Pollick, F.E.; Paterson, H.M.; Bruderlin, A.; Sanford, A.J. Perceiving affect from arm movement. Cognition 2001, 82, B51–B61. [Google Scholar] [CrossRef]
- Camurri, A.; Lagerlöf, I.; Volpe, G. Recognizing emotion from dance movement: Comparison of spectator recognition and automated techniques. Int. J. Hum.-Comput. Stud. 2003, 59, 213–225. [Google Scholar] [CrossRef]
- Wallbott, H.G. Bodily expression of emotion. Eur. J. Soc. Psychol. 1998, 28, 879–896. [Google Scholar] [CrossRef]
- Nayak, V.; Turk, M. Emotional Expression in Virtual Agents Through Body Language. In Advances in Visual Computing; Springer: Berlin/Heidelberg, Germany, 2005; Volume 3804, pp. 313–320. [Google Scholar]
- Sial, S.B.; Sial, M.B.; Ayaz, Y.; Shah, S.I.A.; Zivanovic, A. Interaction of robot with humans by communicating simulated emotional states through expressive movements. Intell. Serv. Robot. 2016, 3, 231–255. [Google Scholar] [CrossRef]
- Wei, Y.; Zhao, J. Designing robot behavior in human robot interaction based on emotion expression. Ind. Robot Int. J. 2016, 43, 380–389. [Google Scholar] [CrossRef]
- Picard, R.W. Affective Computing; MIT Press: Cambridge, MA, USA, 2000. [Google Scholar]
- Van Kesteren, A.J.; op den Akker, R.; Poel, M.; Nijholt, A. Simulation of emotions of agents in virtual environments using neural networks. Learn. Behave Intern. Knowl. 2000, 18, 137–147. [Google Scholar]
- Samani, H.A.; Saadatian, E. A multidisciplinary artificial intelligence model of an affective robot. Int. J. Adv. Robot. Syst. 2012, 1, 6. [Google Scholar] [CrossRef]
- Broekens, J.; Jacobs, E.; Jonker, C.M. A reinforcement learning model of joy, distress, hope and fear. Connect. Sci. 2015, 3, 215–233. [Google Scholar] [CrossRef]
- Gómez, P.; Ríos-Insua, D. An Affective Model for a non-Expensive Utility-based Decision Agent. IEEE Trans. Affect. Comput. 2017, 99, 1. [Google Scholar]
- Zhao, J.; Xie, B.; Song, C. Generating human-like movements for robotic arms. Mech. Mach. Theory 2014, 81, 107–128. [Google Scholar] [CrossRef]
- Zacharias, F.; Schlette, C.; Schmidt, F.; Borst, C.; Rossmann, J.; Hirzinger, G. Making planned paths look more human-like in humanoid robot manipulation planning. In Proceedings of the 2011 IEEE International Conference on Robotics and Automation, Shanghai, China, 9–13 May 2011; pp. 1192–1198. [Google Scholar]
- Plutchik, R. A general psychoevolutionary theory of emotion. Theor. Emot. 1980, 1, 3–33. [Google Scholar]
- Zhu, T.; Xia, Z.; Dong, J.; Zhao, Q. A sociable human-robot interaction scheme based on body emotion analysis. Int. J. Control Autom. Syst. 2019, 17, 474–485. [Google Scholar] [CrossRef]
- Inthiam, J.; Hayashi, E.; Jitviriya, W.; Mowshowitz, A. Mood Estimation for human-robot interaction based on facial and bodily expression using a Hidden Markov Model. In Proceedings of the 2019 IEEE/SICE International Symposium on System Integration (SII), Paris, France, 14–16 January 2019; pp. 352–356. [Google Scholar]
- Henderi, H.; Wahyuningsih, T.; Rahwanto, E. Comparison of Min-Max normalization and Z-Score Normalization in the K-nearest neighbor (kNN) Algorithm to Test the Accuracy of Types of Breast Cancer. Int. J. Inform. Inf. Syst. 2021, 1, 13–20. [Google Scholar] [CrossRef]
- Bendu, H.; Deepak, B.B.V.L.; Murugan, S. Application of GRNN for the prediction of performance and exhaust emissions in HCCI engine using ethanol. Energy Convers. Manag. 2016, 122, 165–173. [Google Scholar] [CrossRef]
- Şahin, F.; Karadağ, H.; Tuncer, B. Big five personality traits, entrepreneurial self-efficacy and entrepreneurial intention: A configurational approach. Int. J. Entrep. Behav. Res. 2019, 25, 1188–1211. [Google Scholar] [CrossRef]
- Mehrabian, A.; de Wetter, R. Experimental test of an emotion-based approach to fitting brand names to products. J. Appl. Psychol. 1987, 72, 125. [Google Scholar] [CrossRef]
- Ranjgar, B.; Azar, M.K.; Sadeghi-Niaraki, A.; Choi, S.M. A novel method for emotion extraction from paintings based on Luscher’s psychological color test: Case study Iranian-Islamic paintings. IEEE Access 2019, 7, 120857–120871. [Google Scholar] [CrossRef]
- Boultif, A.; Louër, D. Powder pattern indexing with the dichotomy method. J. Appl. Crystallogr. 2004, 37, 724–731. [Google Scholar] [CrossRef]
- Arshad, J.; Ashraf, M.A.; Asim, H.M.; Rasool, N.; Jaffery, M.H.; Bhatti, S.I. Multi-Mode Electric Wheelchair with Health Monitoring and Posture Detection Using Machine Learning Techniques. Electronics 2023, 12, 1132. [Google Scholar] [CrossRef]
- Zhao, J.; Wei, Y. A novel algorithm of human-like motion planning for robotic arms. Int. J. Hum. Robot. 2017, 14, 1650023. [Google Scholar] [CrossRef]
- Robla-Gómez, S.; Becerra, V.M.; Llata, J.R.; Gonzalez-Sarabia, E.; Torre-Ferrero, C.; Perez-Oria, J. Working together: A review on safe human-robot collaboration in industrial environments. IEEE Access 2017, 5, 26754–26773. [Google Scholar] [CrossRef]
- Assaad, H.I.; Hou, Y.; Zhou, L.; Carroll, R.J.; Wu, G. Rapid publication-ready MS-Word tables for two-way ANOVA. SpringerPlus 2015, 4, 33. [Google Scholar] [CrossRef] [PubMed]
Figure 1.
The traditional emotion expression method: speech-based expression, face-based expression, and gesture: (a) speech; (b) face; (c) gesture.
Figure 1.
The traditional emotion expression method: speech-based expression, face-based expression, and gesture: (a) speech; (b) face; (c) gesture.
Figure 2.
Skeleton-tree model: (a) human body; (b) arm tree.
Figure 2.
Skeleton-tree model: (a) human body; (b) arm tree.
Figure 3.
The attributes of the shoulder, elbow, and wrist joints.
Figure 3.
The attributes of the shoulder, elbow, and wrist joints.
Figure 4.
Mapping of the robot between the joint and task space.
Figure 4.
Mapping of the robot between the joint and task space.
Figure 5.
Designing robot behaviors based on the motion primitives.
Figure 5.
Designing robot behaviors based on the motion primitives.
Figure 6.
DAT emotion dimension space.
Figure 6.
DAT emotion dimension space.
Figure 7.
The emotion annotation process of external stimuli.
Figure 7.
The emotion annotation process of external stimuli.
Figure 9.
GRNN network topology for the generation of emotion response vectors.
Figure 9.
GRNN network topology for the generation of emotion response vectors.
Figure 10.
The average fitting errors of the GRNN network in each dimension of DAT.
Figure 10.
The average fitting errors of the GRNN network in each dimension of DAT.
Figure 11.
Relationship between classification accuracy and feature number in the feature set.
Figure 11.
Relationship between classification accuracy and feature number in the feature set.
Figure 12.
The connection diagram of MP based on emotions.
Figure 12.
The connection diagram of MP based on emotions.
Figure 13.
The calculation flow chart of the artificial emotion calculation model.
Figure 13.
The calculation flow chart of the artificial emotion calculation model.
Figure 14.
The five human–robot interaction experiments: (a) the 1st interaction; (b) the 2nd interaction; (c) the 3rd interaction; (d) the 4th interaction; (e) the 5th interaction.
Figure 14.
The five human–robot interaction experiments: (a) the 1st interaction; (b) the 2nd interaction; (c) the 3rd interaction; (d) the 4th interaction; (e) the 5th interaction.
Figure 15.
The influence of positive personality and mood on emotion response: (a) The changes of deviation degree (D) in the process of interaction; (b) the changes of acceleration (A) in the process of interaction; (c) the changes of interval time (T) in the process of interaction.
Figure 15.
The influence of positive personality and mood on emotion response: (a) The changes of deviation degree (D) in the process of interaction; (b) the changes of acceleration (A) in the process of interaction; (c) the changes of interval time (T) in the process of interaction.
Figure 16.
Boxplot of anxiety and familiar (a); boxplot of anxiety and unfamiliar (b).
Figure 16.
Boxplot of anxiety and familiar (a); boxplot of anxiety and unfamiliar (b).
Figure 17.
The results of the Shapiro–Wilk test.
Figure 17.
The results of the Shapiro–Wilk test.
Figure 18.
The results of the Levene variance homogeneity test.
Figure 18.
The results of the Levene variance homogeneity test.
Figure 19.
The resulting ANOVA table of two-way ANOVA analysis of emotion recognition rate.
Figure 19.
The resulting ANOVA table of two-way ANOVA analysis of emotion recognition rate.
Figure 20.
The emotion recognition rate.
Figure 20.
The emotion recognition rate.
Figure 21.
Anthropomorphism score.
Figure 21.
Anthropomorphism score.
Figure 22.
Animacy score.
Figure 22.
Animacy score.
Figure 23.
Likeability score.
Figure 23.
Likeability score.
Figure 24.
Perceived intelligence score.
Figure 24.
Perceived intelligence score.
Figure 25.
Perceived safety score.
Figure 25.
Perceived safety score.
Table 1.
Motion primitives.
Table 1.
Motion primitives.
| Node | Motion Primitives | DOF | Type |
|---|
| S | SREPWP | 3 | Motion |
| E | ERWP | 1 | Motion |
| S + E | SREPRWP | 4 | Motion |
| S + W | SREPWPR | 6 | Motion |
| S | SRWP | 3 | Motion |
| S + W | SRWPR | 6 | Motion |
| E + W | ERWPR | 4 | Motion |
| S + W + E | SREPRWPR | 7 | Motion |
| S | SREPWR | 3 | Function |
| W | WR | 3 | Function |
Table 2.
Indexes extracted from the characteristics of arm motion.
Table 2.
Indexes extracted from the characteristics of arm motion.
| Index | Definition | Range |
|---|
| D | Deviation Coefficient | 0–1.5 |
| A | Acceleration | 0–0.1 (m/s2) |
| T | Interval Time | 0–1.2 (s) |
Table 3.
Indexes extracted from motion characteristics (arm).
Table 3.
Indexes extracted from motion characteristics (arm).
| Field | Emotions | Deviation
Coefficient D | Acceleration A | Interval Time T |
|---|
| E1 | (D+, A+, T+) | Happy | 1.15 | 0.055 | 0.9 |
| E2 | (D+, A+, T−) | Angry | 1.30 | 0.090 | 0.2 |
| E3 | (D−, A+, T−) | Anxiety | 0.65 | 0.075 | 0.4 |
| E4 | (D−, A+, T+) | Love | 0.85 | 0.055 | 0.7 |
| E5 | (D−, A−, T+) | Sad | 0.75 | 0.030 | 1.0 |
| E6 | (D−, A−, T−) | Relaxed | 0.95 | 0.040 | 0.2 |
| E7 | (D+, A−, T−) | Excited | 1.45 | 0.075 | 0.3 |
| E8 | (D+, A−, T+) | Hate | 1.15 | 0.025 | 0.7 |
Table 4.
The standardized interactive actions sample data of the sixth experimenter.
Table 4.
The standardized interactive actions sample data of the sixth experimenter.
| Action Number | Event Annotation Vectors | D | A | T |
|---|
| 1 | (−1 0 0.75) | 1.05 | 0.055 | 0.9 |
| 2 | (−1 0.50 0.25) | 1.30 | 0.090 | 0.2 |
| 3 | (0 1 0.25) | 0.65 | 0.075 | 0.4 |
| 4 | (1 0.75 0.50), (0 0.75 0.25) | 0.85 | 0.055 | 0.7 |
| 5 | (1 0.25 −0.50), (0 0.60 0.25) | 0.75 | 0.030 | 1.0 |
| 6 | (0 0.50 −0.25) | 0.95 | 0.040 | 0.2 |
| 7 | (1 0.6 −0.25), (0 0.40 −0.25) | 1.45 | 0.075 | 0.7 |
| 8 | (1 0.40 0.50), (0 0.25 −0.25) | 1.15 | 0.025 | 0.3 |
| 9 | (0 0.25 −0.50) | 0.95 | 0.040 | 0.2 |
| 10 | (1 0.75 −0.50), (0 0.60 −0.50) | 1.45 | 0.075 | 0.7 |
| 11 | (1 0.50 0.50), (0 0 −0.50) | 1.15 | 0.025 | 0.3 |
Table 5.
Big Five personality factors table.
Table 5.
Big Five personality factors table.
| Big Five Personality Factor | Variable | Variable Explanation |
|---|
| Extraversion | Ex | Outgoing, Lively |
| Agreeableness | Ag | Gentle, Tolerance |
| Conscientiousness | Co | Reliable, Self-discipline |
| Emotional stability | St | Anxiety, Passive |
| Sophistication | So | Creative, Intelligent |
Table 6.
The mood structure model of octagonal DAT space.
Table 6.
The mood structure model of octagonal DAT space.
| Field | Mood |
|---|
| (D+, A+, T+) | Exuberant |
| (D+, A+, T−) | Bored |
| (D+, A−, T−) | Dependent |
| (D+, A−, T+) | Hostile |
| (D−, A−, T−) | Relaxed |
| (D−, A−, T+) | Anxious |
| (D−, A+, T−) | Disdainful |
| (D−, A+, T+) | Docile |
Table 7.
Information gain rate result of each feature.
Table 7.
Information gain rate result of each feature.
| Number | Feature | Information Gain Rate |
|---|
| 1 | | 0.268 |
| 2 | | 0.263 |
| 3 | | 0.236 |
| 4 | | 0.110 |
| 5 | | 0.112 |
| 6 | | 0.080 |
| 7 | | 0.056 |
| 8 | | 0.040 |
| 9 | | 0.039 |
Table 8.
External stimulus annotation vector and emotion response vector.
Table 8.
External stimulus annotation vector and emotion response vector.
| Number | External Stimulus Vectors | Modified Emotion Response Vectors |
|---|
| Types | Internal State | Intensity | D | A | T |
|---|
| 1 | −1 | 0 | 0.80 | 0.86 | 0.054 | 0.65 |
| 2 | 0 | 1.00 | 0.56 | 1.45 | 0.045 | 0.7 |
| | 1 | 0.50 | 0.57 | 1.15 | 0.055 | 0.8 |
| 3 | 0 | 0.75 | 0.86 | 0.85 | 0.053 | 0.72 |
| 4 | 0 | 0.65 | −0.84 | 0.75 | 0.052 | 0.36 |
| | 1 | 0.72 | −0.78 | 1 | 0.05 | 0.5 |
| 5 | 0 | 0.72 | 0.43 | 1.13 | 0.022 | 0.35 |
Table 9.
Emotion class and emotion intensity.
Table 9.
Emotion class and emotion intensity.
| Action Number | Emotion Type | Emotion Intensity |
|---|
| 1 | Love | 0.122 |
| 2 | Excited | 0.847 |
| 3 | Happy | 0.691 |
| 4 | Anxiety | 0.824 |
| 5 | Hate | 0.605 |
Table 10.
Emotion recognition time (M = mean, SD = standard deviation).
Table 10.
Emotion recognition time (M = mean, SD = standard deviation).
| Emotion | Emotion Recognition Time (s) |
|---|
| Familiar | Unfamiliar |
|---|
| Love | M = 14.28, SD = 3.02 | M = 15.13, SD = 2.60 |
| Excited | M = 11.33, SD = 2.62 | M = 10.26, SD = 2.83 |
| Happy | M = 11.28, SD = 2.15 | M = 10.22, SD = 2.14 |
| Anxiety | M = 10.85, SD = 2.18 | M = 10.01, SD = 1.98 |
| Hate | M = 8.18, SD = 1.56 | M = 10.19, SD = 1.84 |
| Disclaimer/Publisher’s Note: The statements, opinions and data contained in all publications are solely those of the individual author(s) and contributor(s) and not of MDPI and/or the editor(s). MDPI and/or the editor(s) disclaim responsibility for any injury to people or property resulting from any ideas, methods, instructions or products referred to in the content. |
© 2023 by the authors. Licensee MDPI, Basel, Switzerland. This article is an open access article distributed under the terms and conditions of the Creative Commons Attribution (CC BY) license (https://creativecommons.org/licenses/by/4.0/).


