
Dynamic Thermal Neutron Radiography for Filling Process Analysis and CFD Model Validation of Visco-Dampers


1
Department of Aeronautics and Naval Architecture, Faculty of Transportation Engineering and Vehicle Engineering, Budapest University of Technology and Economics, Műegyetem rkp. 3., H-1111 Budapest, Hungary
2
Engineering Calculations, Knorr-Bremse R&D Center Budapest, H-1119 Budapest, Hungary
3
Nuclear Analysis and Radiography Department, Centre for Energy Research, H-1121 Budapest, Hungary
*
Author to whom correspondence should be addressed.
Machines 2023, 11(4), 485; https://doi.org/10.3390/machines11040485
Submission received: 26 March 2023
/
Revised: 13 April 2023
/
Accepted: 15 April 2023
/
Published: 18 April 2023
(This article belongs to the Section Vehicle Engineering)
Abstract
:The visco-damper is a crucial engine accessory from an operation- as well as vehicle-safety point of view. The service life of this damping product is determined by the degradation of the silicone oil applied to it. The thermal and mechanical degradation of the oil starts not at the first operation of the damper, but at the manufacturing stage when the oil is filled into the damper’s gap at high pressure. Finite volume method-based computational fluid dynamic calculations provide an opportunity to optimize the filling process by minimizing the oil degradation. A three-dimensional, transient, non-Newtonian, multiphase, coupled fluid dynamic and heat transfer simulation model was developed to analyse the filling process and to investigate the effect of the slide bearing’s cut-off position on the filling process. Dynamic thermal neutron radiography was employed to visualize the filling of a test damper for model validation from viscous and fluid dynamic aspects. Distinct properties of neutrons compared to the more commonly applied X-rays were proven to be an effective tool for real-time monitoring of the silicone oil’s front propagation in the damper’s gap and for quantifying the characteristics of the filling process. Visual matching and comparison of propagation times and oil front velocity profiles were used to validate the simulation results.
1. Introduction
It is common knowledge that the vehicle industry will experience increased effectiveness, and numerous ground-breaking studies have been conducted in this area. Within this field, vibration damping technology plays an important role in the safe and long-term operation of every machine and structure operating with rotating or alternating components. In the automobile industry, high-performance, multicylinder, internal combustion engines (ICEs) have become strongly oscillating systems due to such design trends as reduction of engine size, reduction of engine speed, increased torque, and the usage of a relatively flexible crankshaft. The irregularly fluctuating gas forces and the inertia forces originating from the spinning and alternating components in the engine result in severe mechanical loads on the crankshaft in the form of transverse, axial, and torsional vibrations [1]. While the transverse and axial oscillations are absorbed by the supporting bearings, torsional vibrations remain undamped and tend to cause resonance vibration and fatigue damage to the crankshaft and each driven engine component.
To avoid these side effects and to extend the service life of ICEs, torsional vibration dampers (TVDs) are utilized. Several types of TVDs are currently available in the damping market such as frictional, rubber, spring, and viscous, in addition to a new type of TVD called a magnetorheological damper [2]. Viscous torsional vibration dampers (shortly visco-dampers) are claimed to be the simplest but most reliable of all with low maintenance costs. At the same time, they can effectively eliminate the vibrations on the crankshaft in every frequency range. The damping medium of visco-dampers is a thin film of high-viscosity silicone oil that absorbs and dampens the oscillations on the crankshaft while the oil layers are sheared and converts this excess mechanical energy into heat. Visco-dampers are primary damping devices used not only in heavy-duty and commercial vehicles, but also container-, tanker-, and cruise ships and large vessels, as well as sport and race cars along with airplanes driven by reciprocating engines with high-performance output. Apart from the vehicle industry applications, they have preferred engine-protecting characteristics for use also in the agriculture, mining, and military sectors.
The market of internal combustion engines was valued at 197,803.5 million USD in 2017 and is projected to reach 271,508.6 million USD in 2026, which means a 6.5% compound annual growth rate (CAGR) between 2018 and 2026 [3]. At the same time, the worldwide market for visco-dampers is predicted to grow at a CAGR of roughly 2.0% between 2019 and 2024, and according to a recent study, is expected to reach 2360 million USD in 2024 [4]. Because of these facts, visco-dampers have a significant basis in business and finance that requires continuous product developments and accurate lifetime estimation methods. Many articles deal with the vibration analysis of ICEs [5,6,7], with the thermal analysis [8,9,10] or the calculation of power dissipation and damping coefficient [11,12,13] of visco-dampers. However, there is no study focusing on the possibility of service life extension through filling process analysis and optimization in sufficient detail. For this purpose, there is an urgent need for an effective numerical calculation method that allows a deeper understanding of the thermal and viscous aspects of the visco-damper filling process and provides an engineering tool for the design and development of manufacturing processes as well as for service life extension right before selling the damping product.
The aims of the present article are (a) to provide an insight into the filling process of visco-dampers; (b) to develop an effective and reliable, non-destructive neutron imaging-based measurement technique for real-time tracking of the propagation of fluid front in a visco-damper geometry; and (c) to validate the three-dimensional, transient, multiphase, non-Newtonian, coupled fluid dynamic and heat transfer simulation model from viscous and fluid dynamic aspects. This latter is used for both filling process analysis and improvement based on the measurement outcome of the thermal neutron dynamic imaging. This paper evaluates the visual and quantitative comparison of the spatial oil spread formation, oil layer patterns, and fluid front velocity values between the measurement and the simulation results.
2. Materials and Methods
2.1. Structure and Damping Fluid of Visco-Dampers
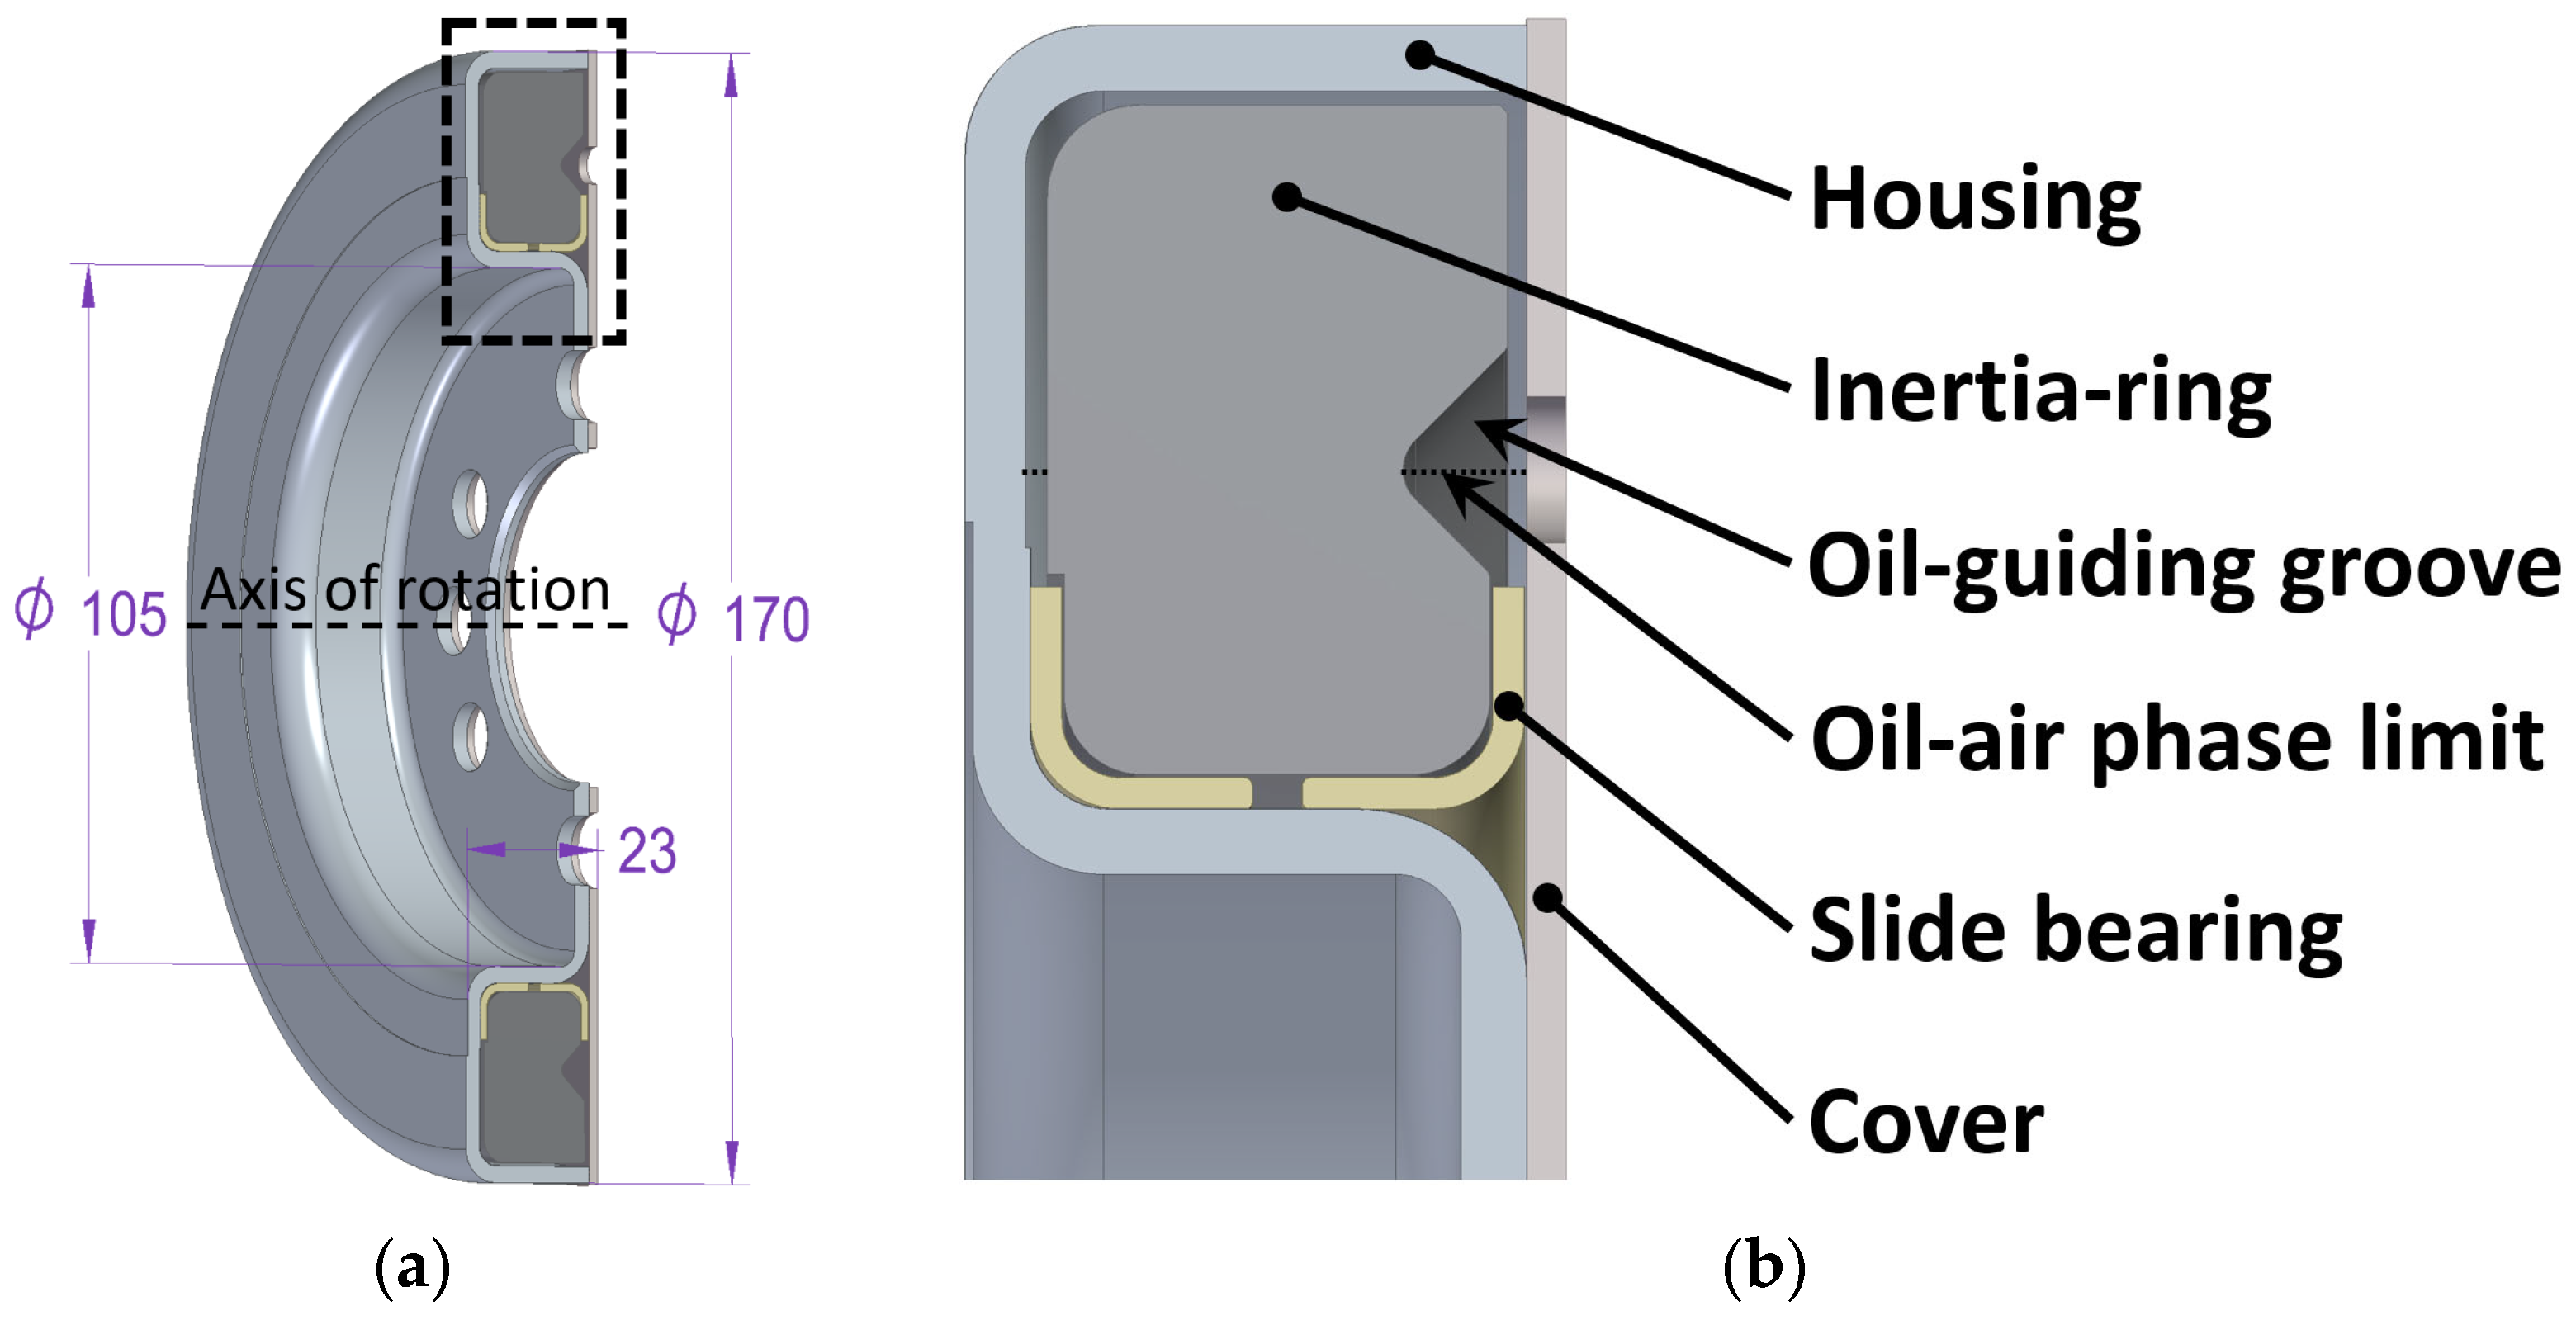
According to Figure 1, a visco-damper is a heavy cast steel ring (inertia ring) guided by a pair of plastic slide bearings set in a cast steel housing and mounted to the crankshaft or integrated into the flywheel of an ICE. The housing is closed by a cover made of steel plate that contains a filling hole. The hole is used to fill the cavity between the inertia ring and the housing with a high-viscosity damping fluid. The oil-guiding groove on the inertia ring enhances the oil’s spread during the filling process. While the damper is in rotation, the fluid is forced out to the outer radii of the gap, and a sharp phase limit (marked by the black dotted line in Figure 1b) is formed in the symmetry plane of the oil-guiding groove. Above this line, the gap is full of damping fluid, while below this line the slide bearings sit in the air. Since the housing is attached to the crankshaft of the ICE, in case of torsional vibrations occurring on the shaft, the housing begins in relative motion to the freely moving inertia ring, and the oscillation energy is absorbed through shearing and friction of the fluid layers and converted into heat that dissipates into the environment. During this damping process, the damping fluid is exposed to a significant amount of heat (thermal load), is under continuous shearing (mechanical load), and the materials of the surrounding solid components have an aging impact (chemical load) on the fluid’s lifetime.
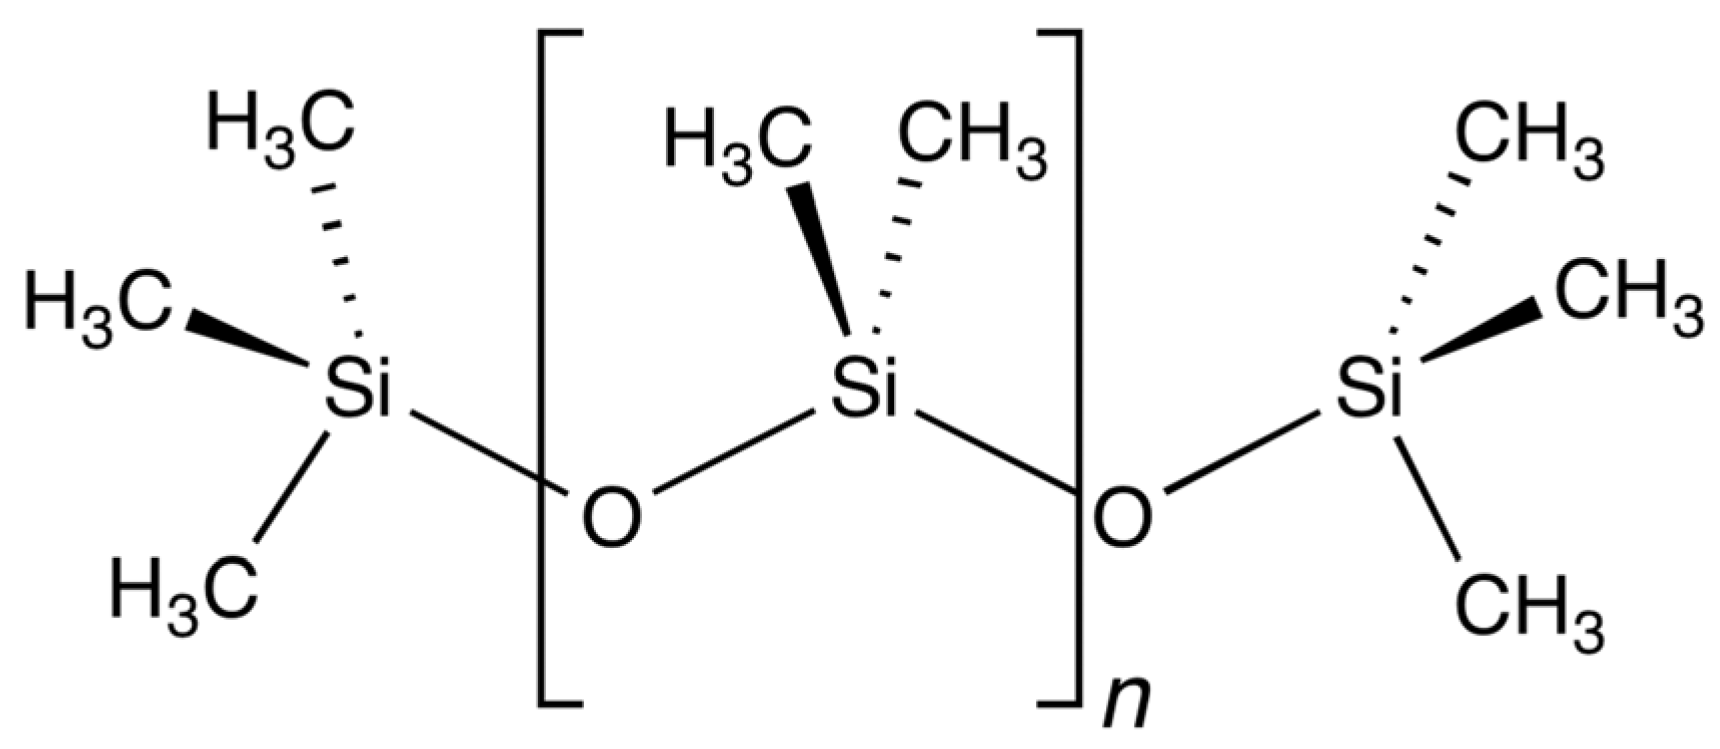
Silicone oil (polydimethylsiloxane or PDMS) used as a damping medium for visco-dampers is a liquid polymerized siloxane with organic side chains. Its chemical formula is (H3C)3[Si(CH3)2O]nSi(CH3)3, where n refers to the number of repeating monomer units, while its constitutional formula is presented in Figure 2. The current value of n determines the length of the molecular chain, and thus the molar mass and the viscosity of the oil (higher n results in higher molar mass and viscosity). Silicone oils are optically clear, pure, inert, odourless, non-toxic, and non-flammable fluids with excellent thermal resistance (high thermal stability), perfect insulation properties (low thermal conductivity), and anti-foaming and water-repellent behaviour (low surface tension and high hydrophobicity) which do not occur in the nature. Their viscosity spans a broad range from 0.0006 Pas to 1000 Pas, and their density varies widely ranging from 760 kg/m3 to 970 kg/m3. However, they exhibit lubricating qualities only between −60 °C and 200 °C while having a freezing point between −80 °C and −40 °C [14].
The filling of visco-dampers is the last step of the manufacturing process that takes place in full automation at a special filling station working with high-performance compressors (to generate vacuum), hydraulic pumps (to generate high loading pressure), and high-precision sensors (to control the filling process). To reduce the filling time per damper, high-viscosity silicone oils are usually heated up to make them more fluent. Due to shearing and friction, however, internal heat generation also occurs during the filling process. Considering the small sizes of the filling hole and the damper gap, moreover, the highly viscous (500–1000 Pas) and non-Newtonian (pseudoplastic) behaviour of the silicone oil, the filling process can take a long time while the oil layers close to the wall suffer from significant shearing and friction due to the high filling pressure of 10–30 bar. At the end of the filling process, when the required amount of oil is reached, the filling is stopped, and resting time is applied to let the oil spread in the damper gap and let the pressure be reduced to atmospheric level (1 bar). After the process is completed, a plug is welded into the filling hole to make the damper’s housing perfectly closed.
Apart from the temporary viscosity loss of the oil due to shearing and preheating, permanent degradation of the oil can occur if the maximum allowed temperature is exceeded during the filling process. As a consequence, the oil’s viscosity cannot be restored to its initial (factory) value and the necessary damping performance cannot be granted during the engine’s operation. Since the visco-damper’s service life is determined by the lifetime of the silicone oil, the filling process must be carried out with optimized conditions that minimize the degradation of the oil. Improvements to the filling process are necessary not only for extending the visco-dampers service life, but also for shortening the manufacturing time to enhance productivity.
The optimization of the filling process for a realistic visco-damper geometry must be performed in an accurate and efficient way, preferably by the application of numerical methods and advanced computational fluid dynamic (CFD) calculations. In order to achieve these optimization goals, the first step was developing a 3-dimensional, transient, multiphase, non-Newtonian coupled fluid dynamic and heat transfer simulation model and validating its accuracy from a viscous and fluid dynamic point of view by applying a properly established, visco-damper specific, non-destructive measurement method to observe a real filling process of real visco-damper geometry.
2.2. Filling Process Analysis by Neutron Radiography
2.2.1. Neutron Radiography
Neutron radiography (NR) is a non-destructive material testing method that provides the possibility to determine the existence, location, size, morphology, and, in some cases, even the chemical composition of structures and materials inside an object [15,16]. When X-ray imaging is impossible, NR imaging is the best choice for performing real-time measurements of dynamic processes involving relatively thick samples (some cm’s range), which usually have high attenuating power against X-rays and/or containing components invisible for X-rays.
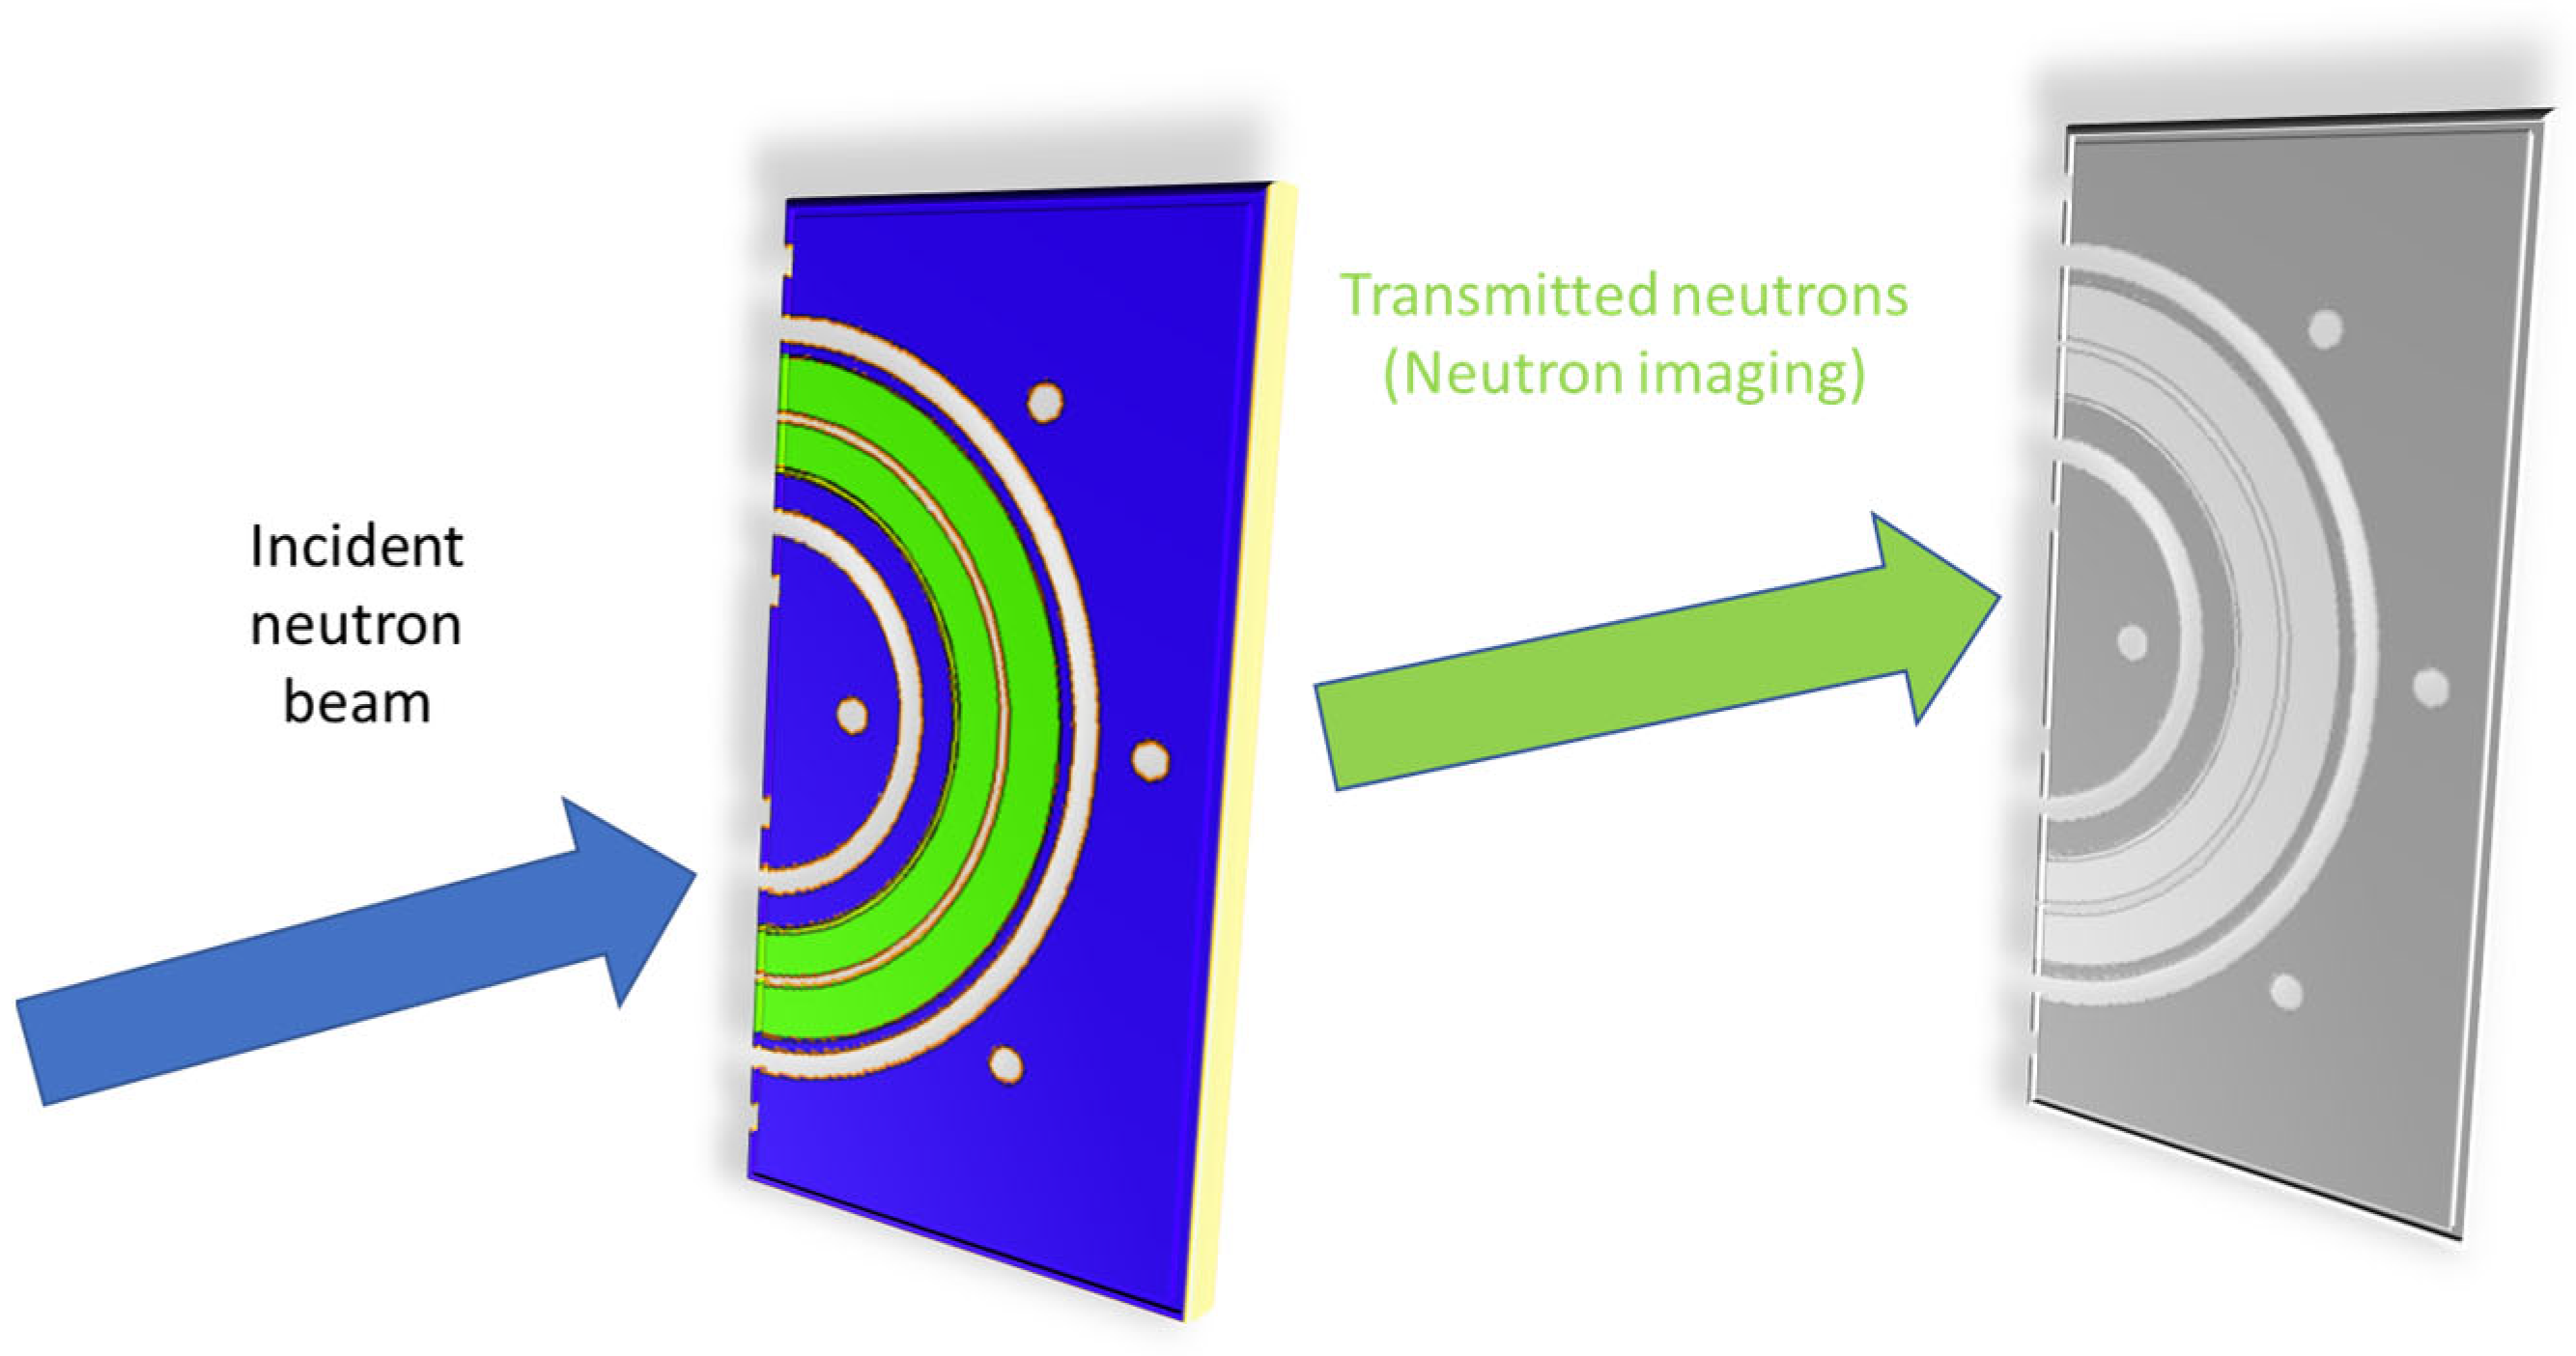
Neutron imaging is based on the transmission process, i.e., when a neutron beam penetrates an object, its intensity decreases; the beam is attenuated. Some of the neutrons are absorbed or scattered out of their straight flight path, and thus they do not reach the detector system. As a result, attenuation contrast is created, which maps (projects) the internal inhomogeneities and morphology of heterogeneous objects onto a screen as a shadow image (see Figure 3).
Although both neutrons and X-rays can produce shadow images, the fundamental physical interaction with the matter is different because neutrons interact with the atomic nucleus while X-rays interact with the electron shell of the atoms. Both NR and X-ray investigations are based on the quantification of the transmission, T, which is defined as the ratio of the transmitted beam intensity to the incident beam intensity, Equation (1) [15]. The transmission of a monoenergetic pencil beam is expressed by the Beer–Lamber law as presented by Equation (2) [15,16] with help of Equation (3) [15], where is the transmitted beam intensity, is the incident beam intensity, is the local linear attenuation coefficient, is the beam path, and is the material thickness. The attenuation coefficient can be calculated from macro- and microscopic quantities, where and is the absorption and scattering cross-section, respectively, is the atomic density of the investigated material, is the mass density, is the Avogadro’s number, and is the molar mass of the investigated material. The mass attenuation coefficient, , is defined as in Equation (4) [15], which makes it mass density-independent.
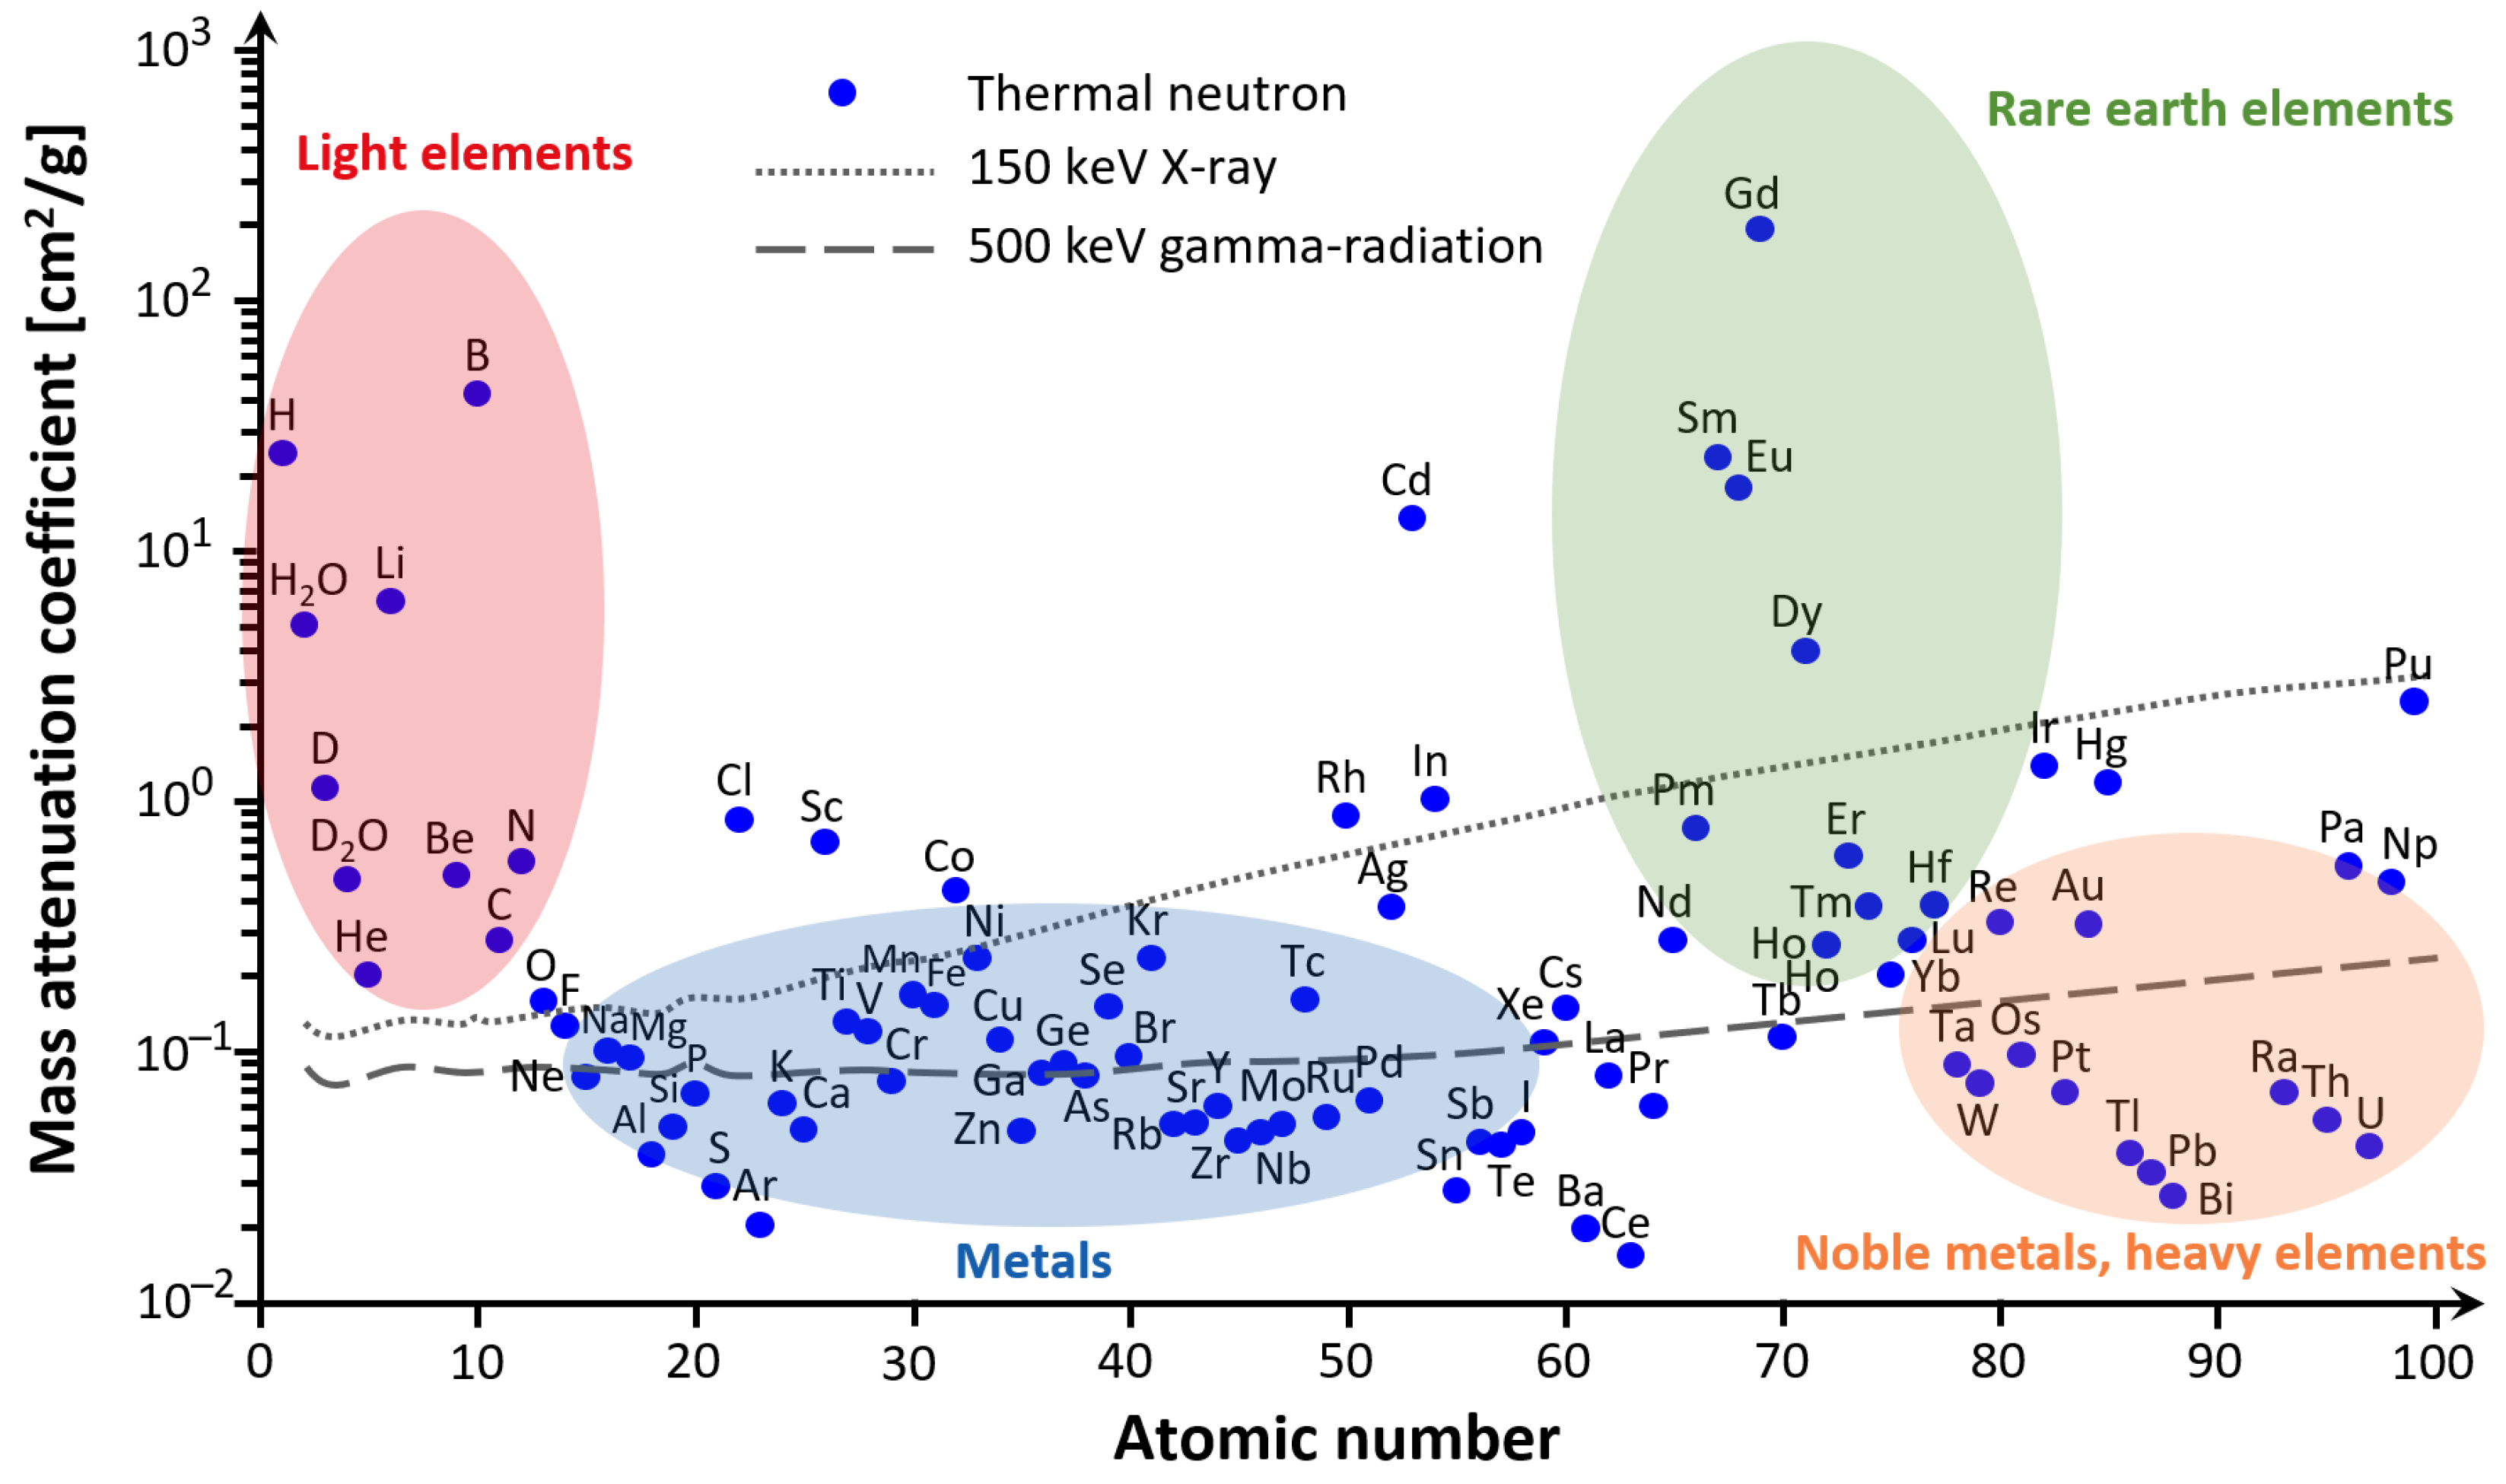
Mass attenuation coefficients of elements are shown in Figure 4 for thermal neutrons (dots), for 150 kV X-ray (dotted line), and for 500 keV gamma-radiation (dashed line). While X-ray values grow monotonically with the atomic number, neutron values reveal very considerable variances, sometimes even orders of magnitude, across neighbouring elements. In other words, X-rays are relatively insensitive to light elements (e.g., hydrogen, carbon), while heavier elements (e.g., gold, mercury, lead) are found to be difficult to penetrate. The neutrons have zero net charges, and thus they interact with the atomic nuclei and can suffer higher attenuation from light elements (e.g., hydrogen) than heavier elements (e.g., iron, aluminium). Because of this fact, neutron and X-ray imaging could complement each other and they could be used together for effective and detailed material analysis.
In neutron imaging, nowadays, usually, a scintillation screen is used as a converter in conjunction with a pixelized digital camera (CCD or sCMOS). By recording the transmitted beam intensity by the scintillator screen placed right behind the investigated object, a 2-dimensional grey-scale image is gained that can provide quantitative information about the sample thickness, inner structure (e.g., cracks, and voids), and material composition. Generally, darker areas of a shadow image mean less transmission and refer to a larger sample thickness and/or to the presence of elements with higher attenuation capability.
In practice, the internal structure of the object can be seen if the transmission of the sample falls between a minimum and a maximum value (generally 2% to 98%); from which the appropriate thickness ( and ) can be computed by Equations (5) and (6) [15].
NR has a wide application range both in scientific research topics, such as material science and archaeology, and in industrial problems related to fluid mechanics and material structure. Regarding the fluid mechanical application, the contrast between metallic (e.g., ICE and vehicle systems) and organic or liquid components (motor oil, fuel, water) can be well visualized, and the flow conditions can be revealed during operation. As for material structure-related application, the examination of homogeneity, continuity, internal stress distribution, and fatigue of the matter or the search for microcracks, inclusions, and voids would be unthinkable without NR analyses.
Apart from the versatile material testing opportunities offered by NR, there are two important drawbacks of this testing method which have a significant impact on the planning and conduction of NR measurements. On the one hand, neutron absorption may result in radioactivation. Thus, the irradiated sample may remain radioactive for longer times (even for weeks). On the other hand, the neutron imaging measurements must be made close to a neutron source, as free neutrons for scientific research are typically produced using a nuclear reactor or an accelerator-driven (spallation or compact accelerator-based) neutron source [15,16].
Thermal neutron dynamic imaging measurements have been on a test damper sample at the Budapest Neutron Centre, where the Budapest Research Reactor (BRR) has operated since 1959. BRR (operated by the Centre for Energy Research) is an excellent research institution in Hungary and one of the largest in Central Europe. BRR is a tank-type reactor of Soviet design and construction with 10 MW thermal power and operates with VVR-M2 type of nuclear fuel (LEU). The reactor is equipped with 16 stations, each optimized for a particular measurement task [17].
2.2.2. Development of a Thermal Neutron Dynamic Imaging Technique for Visco-Dampers
Considering the organic CH3 methyl groups of the silicone oil (see Figure 2) and the higher mass attenuation coefficient of hydrogen compared to the metals, NR imaging was chosen to be the best method to visualize the oil spread deep inside the metallic damper case during a filling process.
NR series on a test damper sample was chosen to focus on the effect of different bearing cut-off positions for better understanding the filling process, for tracking the silicone oil’s phase front propagation, and for quantifying the oil front velocities during the filling process. In the planning phase of the measurements, the following restrictions had to be taken into account and solved:
- #1.
- The filling process of visco-dampers requires relatively high filling pressure (10–30 bar) considering the high viscous behaviour of the silicone oil (1000 Pas at 25 °C in the case of Wacker AK 1,000,000 STAB silicone oil) to keep the filling time relatively short. Additionally, the filling process must have taken place in a concrete shielding bunker with a floor area of approximately 2.5 m × 4.5 m.
- #2.
- During the NR measurements, no one is allowed to stay in the bunker. Thus, the control of the filling system and the recording of the data (pressures, temperatures, time) must be solved remotely.
- #3.
- Clear, good quality, and self-explanatory NR images are required as the output of the measurements. Thus, the selection of proper damper materials, as well as considering their availability and economy, are crucial for the success.
- #4.
- As the filling process and the NR imaging must be repeated several times and the irradiated damper emits gamma-radiation, a cooling time is required to prepare the test damper again. The necessary time depends not only on the half-life of the induced radiation, but also the mass of the irradiated damper as well as the irradiation time, too.
- #5.
- The diameter of the neutron beam at the facility is 180 mm, i.e., the outer diameter of the test damper must be set to fit completely in the field of view.
- #6.
- The displacement of the test damper must be avoided during the measurements and before each measurement, the test damper must be reset in the same place and in the same (vertical) position.
- #7.
- During the neutron irradiation, no equipment is allowed within 300 mm of the beam. Furthermore, it is advisable to not place any additional objects between the beam source and the test damper as their shadow would hide the silicone oil’s front propagation on the image.
Material composition analysis has been conducted previously by an X-ray fluorescence spectrometer on the components of a real visco-damper (housing, cover, and inertia-ring) to determine their main and alloying elements and contaminations. The identified elements are collected in Table 1 to provide a firm basis for activation estimation using a tool developed specifically for such calculations [18]. Results show considerable activation of iron, manganese, copper, and cobalt isotopes with longer half-lives (from hours to years). As their dose rate levels would not decay significantly during the time frame of the experiments, different materials must be found for the test dampers.
It turned out from the composition analysis that a real visco-damper could not be used for the planned measurements. Additionally, based on Figure 4, the identified elements have relatively high mass attenuation coefficients compared to the usually applied material: aluminium. Because of these facts, AlMgSi0.5 (EN-AW6060) aluminium alloy was selected for the test damper’s component material as its elements have relatively short half-lives (from second to minutes) [19,20] and aluminium has one of the lowest mass attenuation coefficients among metals. Moreover, it is an affordable and common structural material with sufficient strength for the measurements and it allows high-quality NR images to fulfil Restriction #3.
As regards the design of the test damper sample, a real small-sized visco-damper with a 170 mm outer diameter was used with some small modifications to fulfil Restrictions #1 and #5. The geometrical characteristics in accordance with Figure 5 are the following:
- Grooves were created on the inner side of the housing for O-rings to seal the gap region and maintain the necessary inlet pressure for the oil.
- The inertia ring were rounded to make the removal of oil residues easier.
- Only the inner surfaces of the housing (gap and grooves) were milled from the square-shaped stock.
- The thickness of the cover was 3.5 mm and the minimum thickness of the housing was increased by 1.5 mm.
- A second hole was drilled on the cover for the oil outlet since creating a vacuum in the damper’s gap (similarly to a real filling process in the factory) close to an operating nuclear reactor would be very dangerous.
- Twelve bores were created both on the housing and on the cover for M8 bolt connections since the test damper must be disassembled and perfectly cleaned after each measurement.
Instead of steel bolts, polyether ether ketone (PEEK) bolts were used for assembling the cover to the housing. Thus, the activation of the bolts is avoided, and they can be reused right after the measurement by fulfilling Restriction #4.
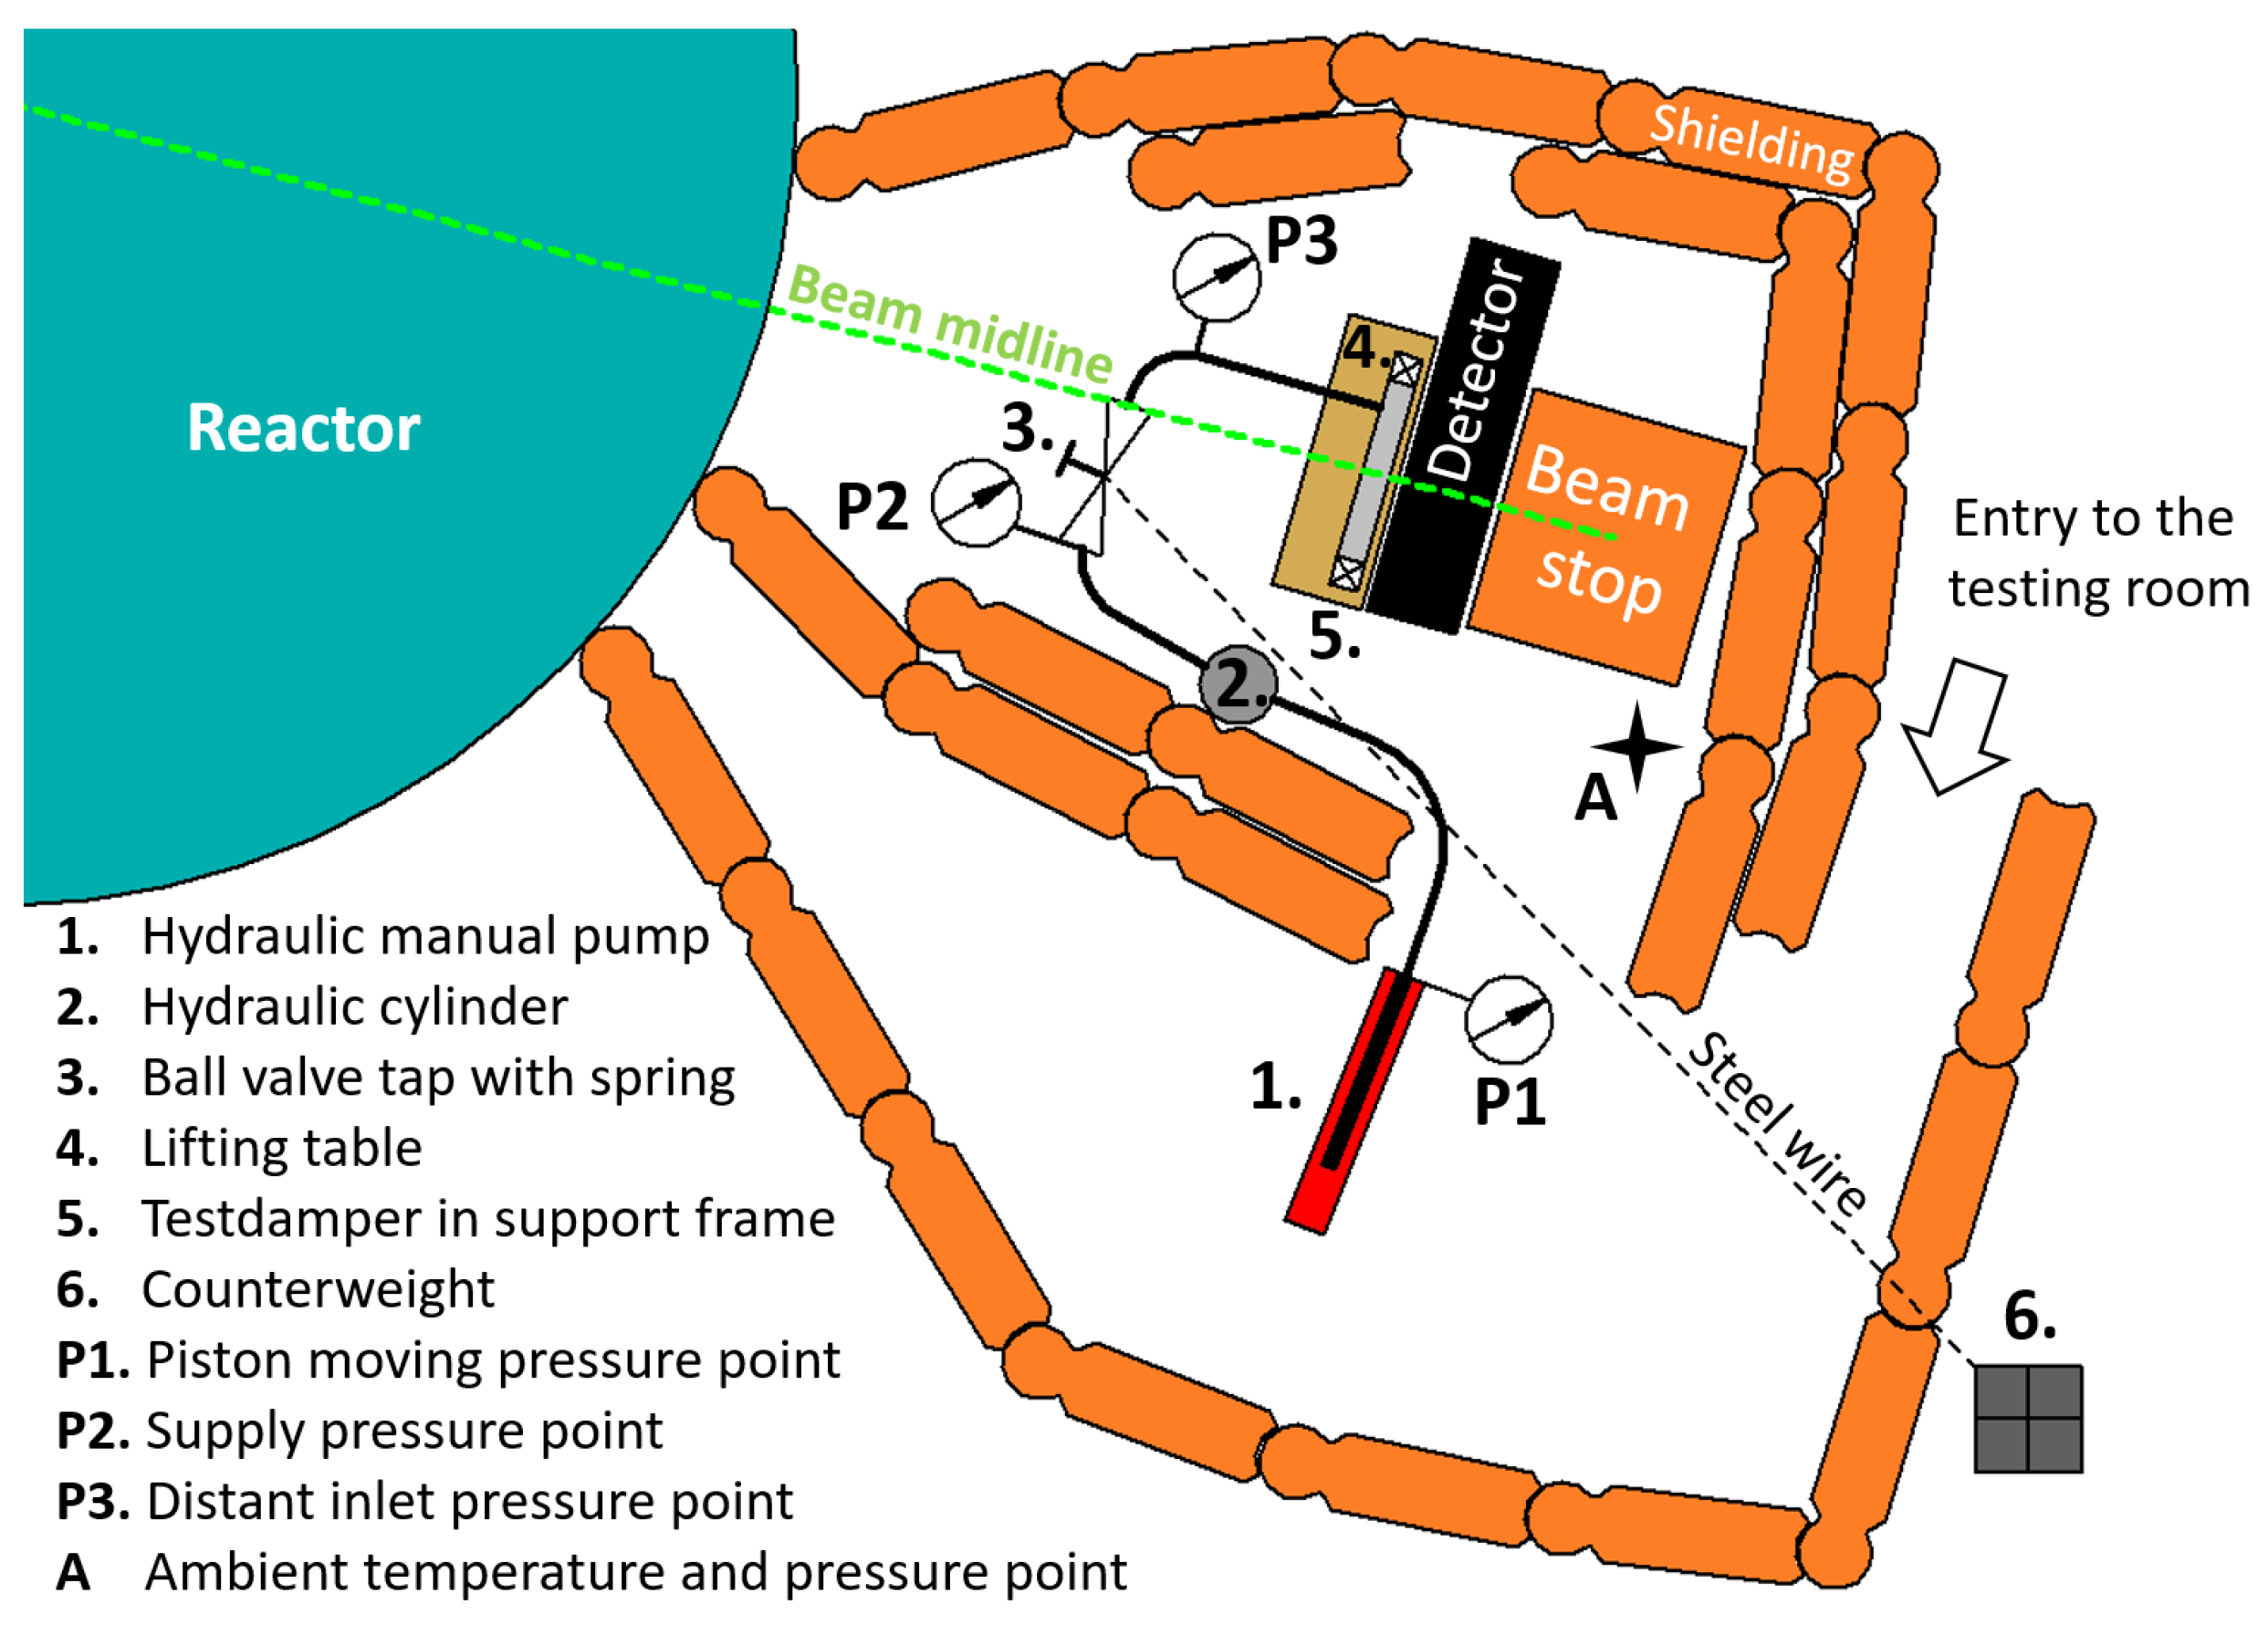
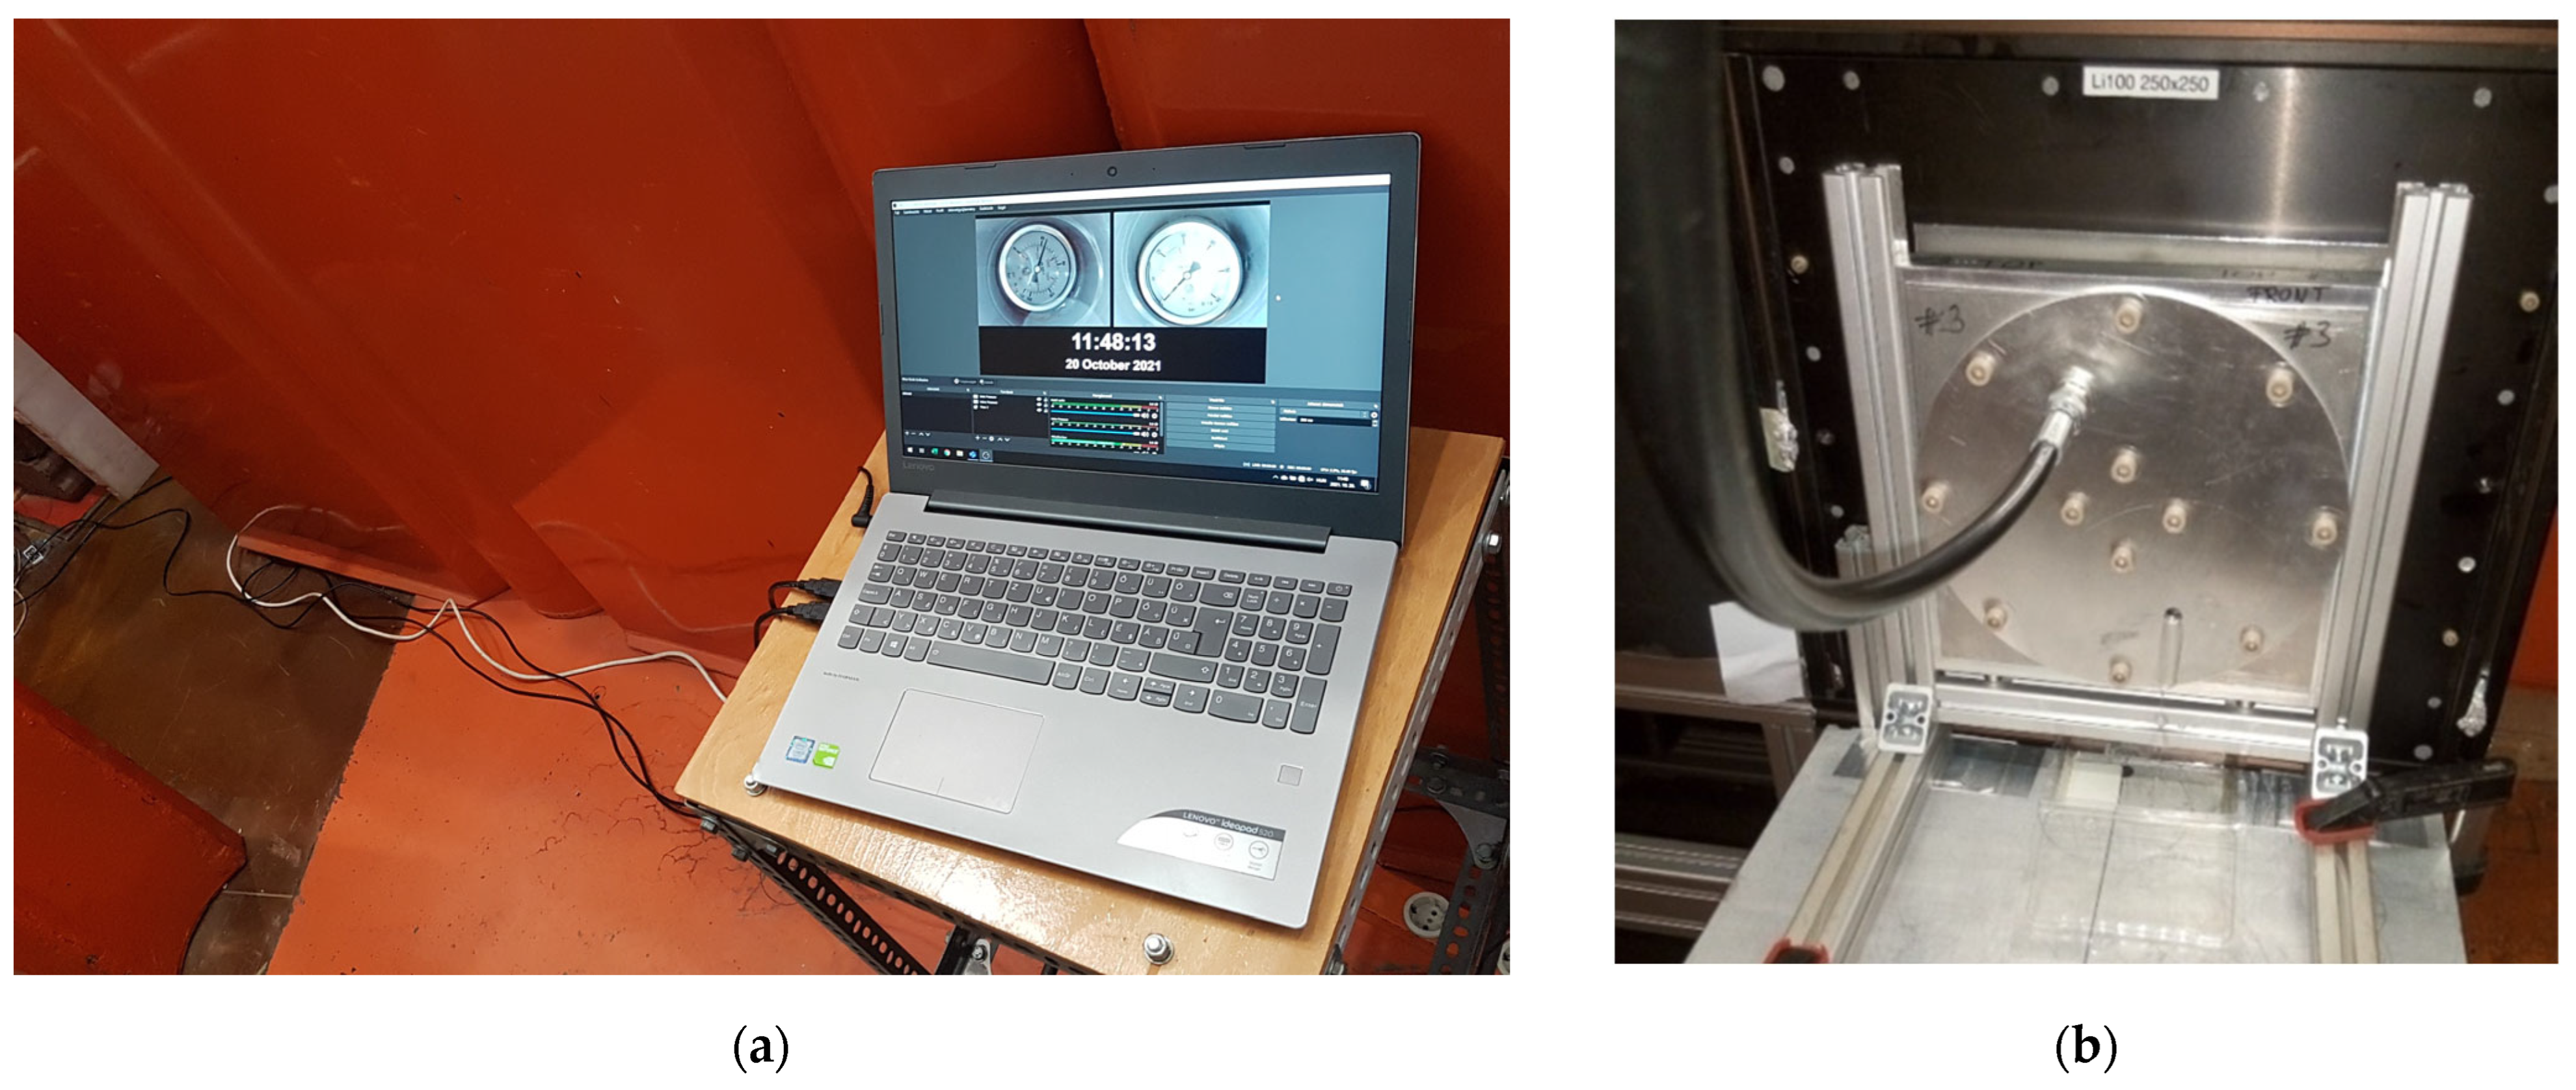
Figure 6 shows the arrangement of the bunker and the setup of the measurement system. A support frame (5.) made of AlMgSi0.5 has been designed for the test damper to hold it in a vertical position. A sample stage (4.) is used to move the test damper with its support frame into the midline of the neutron beam (see Figure 6) by fulfilling Restriction #6. A manual filling device has been used to generate sufficiently high inlet pressure at the inlet hole of the test damper. The hand-filling equipment consists of a vertically standing hydraulic cylinder (2.) with an inner diameter of 100 mm and a length of 600 mm to store the high viscosity silicone oil while its piston is moved by a HI-Force 700 bar hydraulic manual pump (1.). A 3-m-long high-pressure hydraulic hose was used to guide the silicone oil from the cylinder to the inlet bore of the damper as can be seen in Figure 7b. According to Figure 6, a high-pressure hydraulic ball valve tap (3.) was integrated into the hose and a support frame with a spring has been designed to keep the tap closed. The tap is connected to a counterweight (6.) of 10 kg by a 10 m long steel wire and the tap can be opened against the spring by moving the counterweight to remotely control the filling process and fulfil Restrictions #2 and #7. Considering the high level of radiation during and after the measurement in the testing room, Bourdon tube pressure gauges with castor oil damping were used to avoid malfunction and incorrect data records due to the radiation. The view of the pressure gauges together with the exact time were recorded by a high-resolution digital camera with built-in lights connected to a personal computer outside the testing room as shown in Figure 7a. Pressure gauges were installed on the hydraulic pump (P1), before the ball valve tap (P2) and at a distance of 500 mm from the inlet bore of the damper (P3) to record the hydraulic pressure, supply pressure, and the inlet pressure of the oil over time during the filling process by fulfilling Restriction #7. The neutron imaging was accomplished using a 100-µm thick LiF/ZnS scintillator screen (with a spatial resolution between 70–250 µm) as a converter in conjunction with a pixelized large area sCMOS digital camera (Andor Neo5.5). This type of camera utilizes state-of-the-art scientific imaging sensor technology for providing rapid frame rates, extremely low noise, a large field of view, a wide dynamic range, and high resolution. The ambient pressure and temperature values are recorded in point “A”.
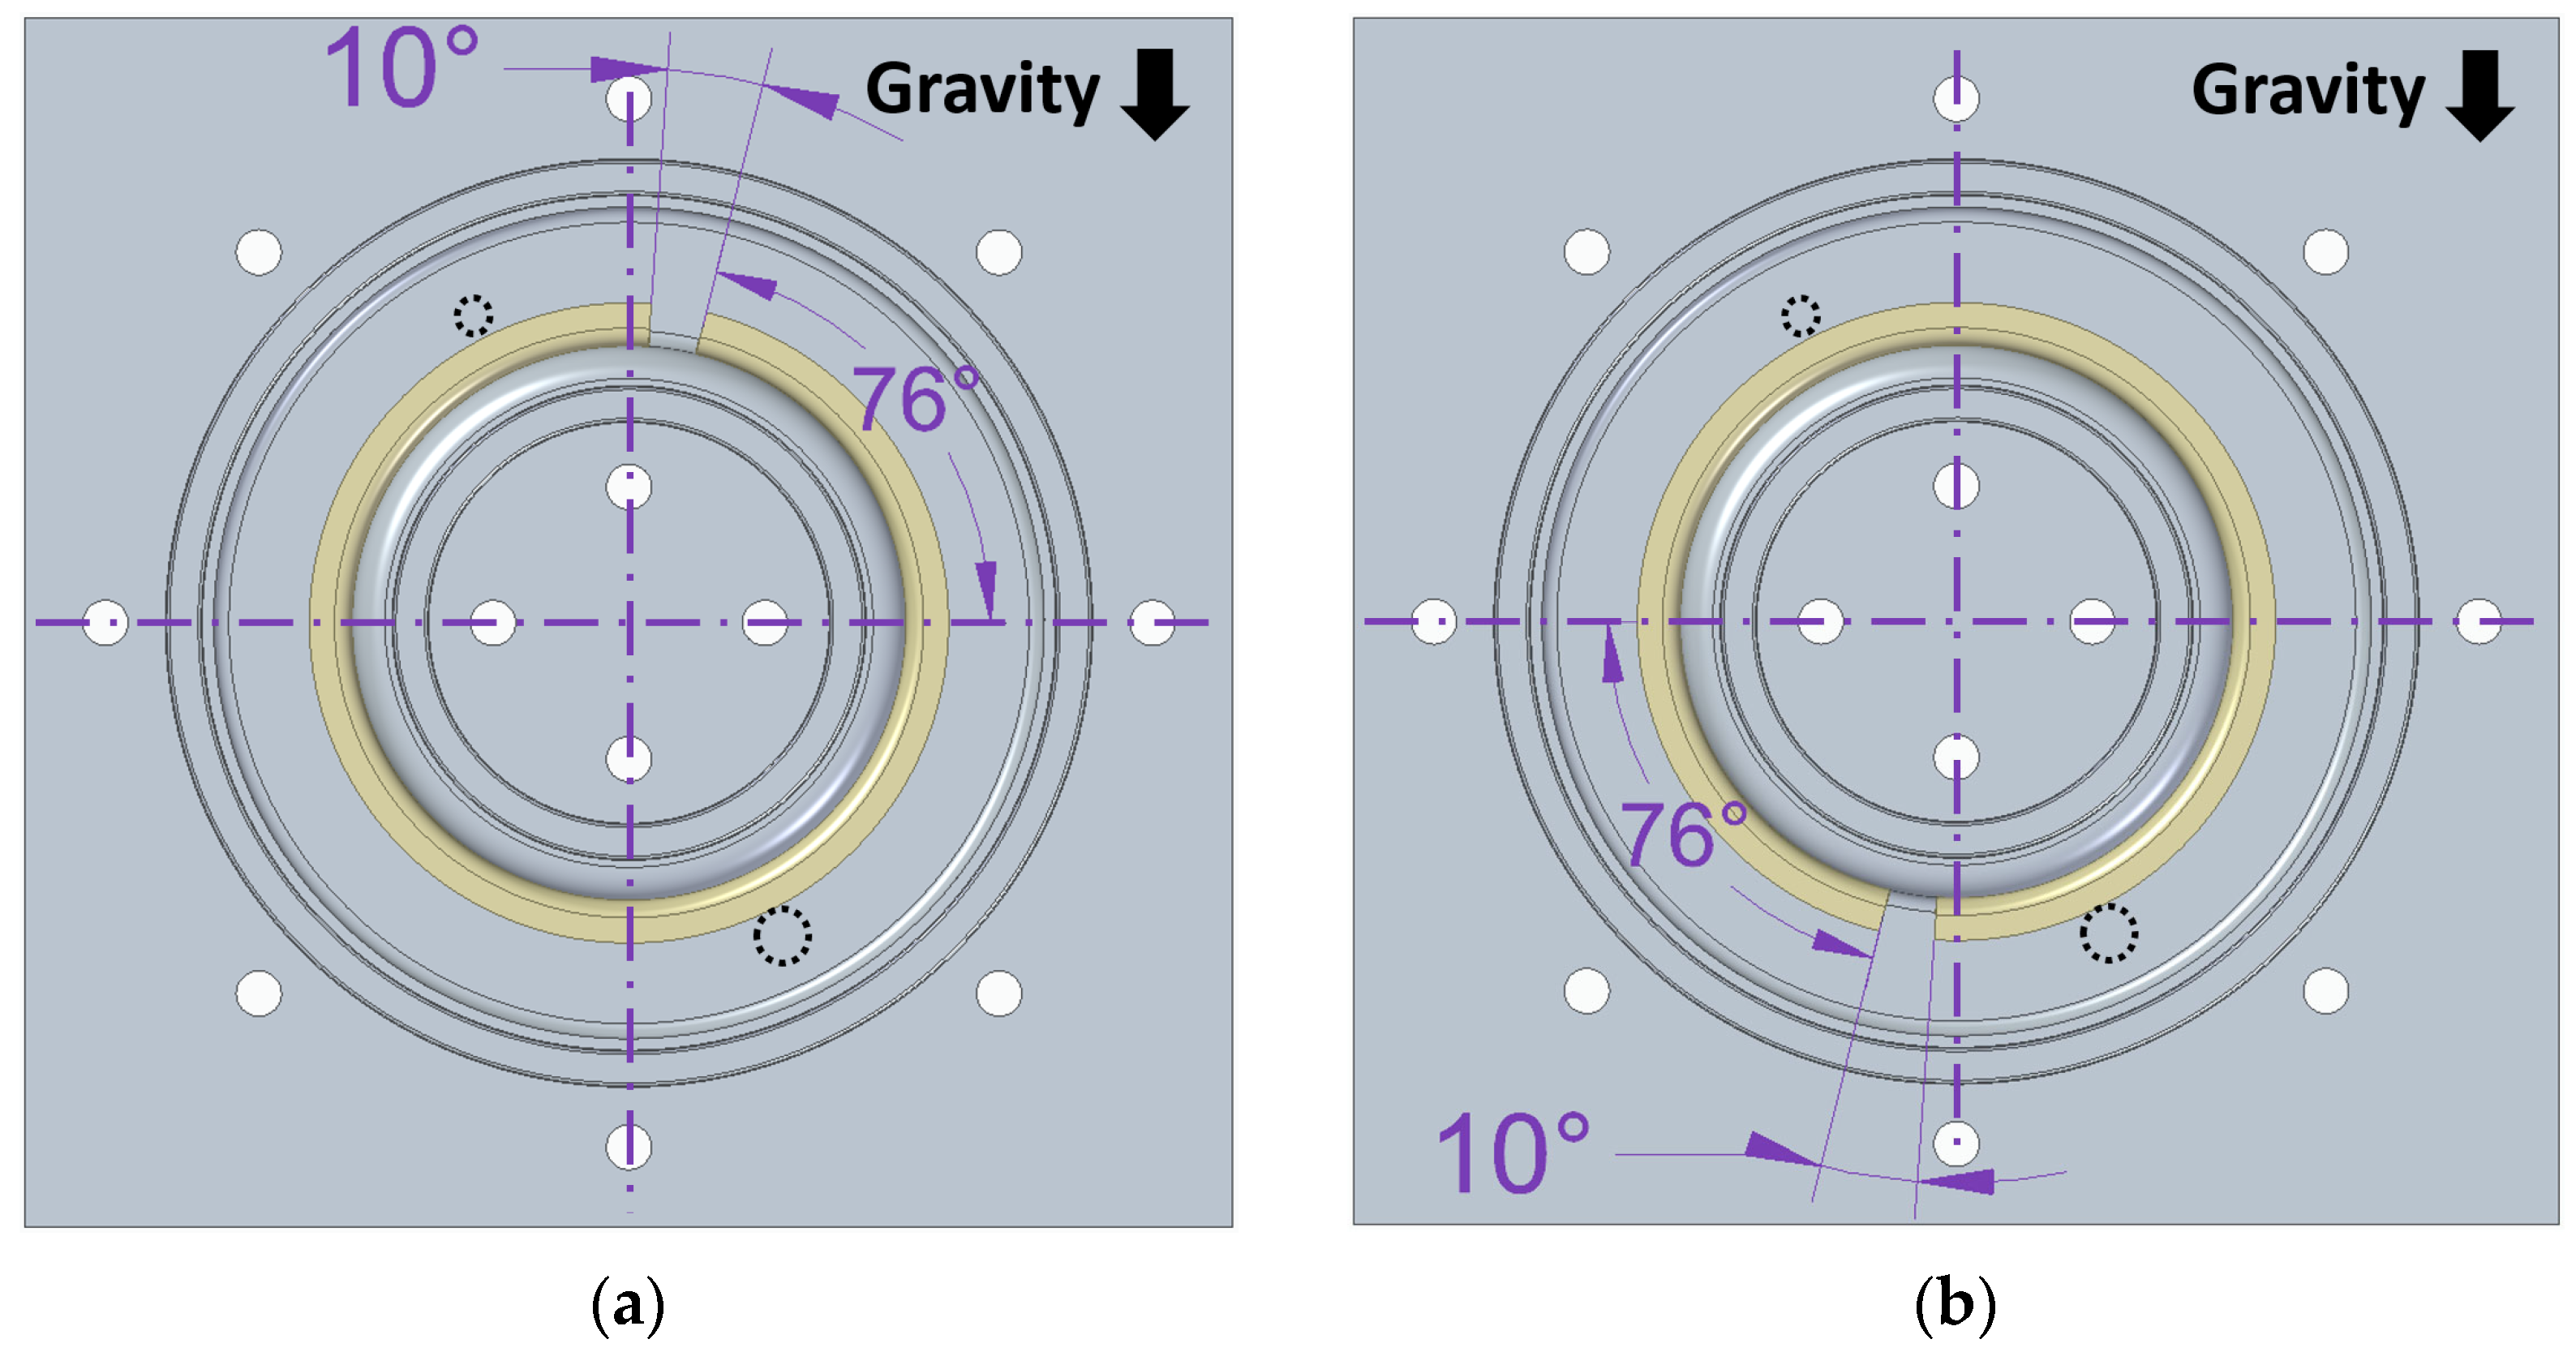
The filling process measurements were repeated four times with different slide-bearing cut-off positions shown in Figure 8. Wacker AK 1,000,000 STAB high viscosity silicone oil was used for the measurements at ambient temperature under resting conditions (brand new, unworn oil) with material properties collected in Table 2 based on the product brochure [14]. The main steps of each measurement are listed as follows:
- Assembling the test damper with a given bearing cut-off position and placing it into the support frame at a 30 mm distance from the scintillator screen.
- Connect the filling hose to the inlet hole.
- Pumping up the hydraulic manual pump to 500 bar (generating 90 bar supply pressure at the closed ball valve tap) and leaving the testing room.
- Initializing the measurement system remotely.
- Opening the neutron beam and recording “dry” images without silicone oil in the damper gap.
- By lifting the counterweight let the spring open the ball valve tap and start the filling process.
- Monitoring the oil spread in real-time in the 2-dimensional projections till the oil front reaches the outlet bore.
- Sinking the counterweight against the spring to close the ball valve tap and finish the filling process.
- Regularly check the radiation in the testing room and wait for a safe level (<20 µSv/h).
- Disconnect the filling hose from the test damper and remove it from the support frame.
- Disassembling the test damper and removing silicone oil from each component by using cleaning detergent dissolved in fresh water and paper-based wipes soaked in acetone.
2.2.3. Considerations for the Processing and Evaluation of Raw NR Images
The expectable filling time with the test damper falls between 390 s and 410 s, depending on the actual bearing cut-off position. During this time, the oil front moves on an arc of ca. 200 mm path length (measured on the test damper’s CAD model), which should be divided into sufficiently small sections by successive image acquisitions. To be able to obtain quantitative data from image processing as an input for CFD analysis, the distance travelled in one exposure time cannot be too long. In a path length increment, one will not get an exact spatial position, because it is a transition range, as the front moves even during the exposure. If such a range is sampled with fewer or more pixels along the direction of the movement, one will get poorer or more detailed spatial information, respectively. The goal of NR imaging is then to maximize the reachable signal-to-noise ratio (SNR) and minimize the blur while maintaining an acceptable spatial resolution and field of view. According to Nyquist’s sampling principle (where a pixel is the sampling unit), a change should be sampled at least twice the frequency of the change, e.g., 1.0 mm/2 = 0.5 mm sampling frequency.
The NR imaging results are calculated based on the grayscale values, which are in a linear relationship to the neutron intensity impinging on the screen. The higher the intensity in an effective pixel (i.e., in the screen area seen by a native camera pixel through the optical system), the larger the grayscale value belonging to that specific pixel. In terms of image resolution, 12-bit (212 = 4096) and 16-bit (216 = 65,536) bit depth were applied to measure the grayscale values with better and poorer time resolutions, respectively. Moreover, in addition to the native 1 × 1 pixel resolution, optimized pixel binning (2 × 2, 3 × 3) was also applied which helped to follow processes with better time resolution.
The visible light created by the scintillator screen is collected by the optics. In the case of the optical setup with the 50 mm focal length lens, the effective pixel sizes are 0.106 mm for 1 × 1 binning and 0.318 mm for 3 × 3 binning, which implies a 0.21 mm and a 0.63 mm best spatial resolution, respectively. Calculating for a worst-case scenario of 300 s loading time, a path increment is ca. 0.33 mm for a 0.5 s and ca. 0.04 mm for a 0.06 s exposure time. In preliminary tests, we proved that the 0.33 mm path increments can be followed by a 0.5 s exposure time using 16-bit images, which gave acceptable SNR. In the case of faster processes, using the 3 × 3 binning, one can achieve a frame rate of 1/0.06 s−1 for 12-bit images without considerable loss of SNR because signals are gathered from a nine times larger area but with nine times shorter exposure time. It follows that one can use setups up to 3 times binning if needed to keep the SNR because the spatial resolution will not deteriorate too much.
Independently from the optical system, the neutron beam characteristic (flux, divergence) and the scintillation screen properties (material, thickness) determine the reachable spatial and temporal resolution. The source-to-screen (4960 mm) and object-to-screen (30 mm) distances were set to provide the best achievable spatial resolution. For the used setups with the 100 µm thick LiF/ZnS scintillator screen, the best reachable spatial resolution is a combination of the geometric and screen inherent blurs, resulting in about 300 µm for a 1 × 1 binning, while for a 3 × 3 binning, it is around 600 µm. The exposure times (0.5 s and 0.06 s) were set to keep the SNR in an acceptable range.
The image processing and analysis were completed with the free FIJI v1.53 software [21]. The raw 2-dimensional images were cropped, noise filtered, and corrected for camera dark current and beam inhomogeneities (flat-field) before the evaluation. The members of the resulting image series were then binarized with thresholding using the Otsu method [21] to find out the exact pixel position of the oil front in time. The proper pixel size calibration made it possible to infer the time dependence of the real velocity in mm/s units.
During the binarization of the image series, the mean line of the inertia ring’s oil-guiding groove was used as a region of interest, where the velocity of the oil front and its time dependency were determined. The oil movements in the left and right arcs were followed separately. The support of the dampers kept them in the field of view without noticeable displacement. Therefore, the incremental changes in the region of interest areas were easily measurable, and by using the pixel-size-to-millimeter conversion factor, the velocity of the front was calculable.
2.3. Filing Process Analysis by Computational Fluid Dynamics
2.3.1. Computational Fluid Dynamics
The last ten years have seen a shift in the focus of product development toward technical modelling and simulation work, including CFD, which is becoming a vital component and a potent tool for design, development, and research as shown by [22,23].
CFD is based on the spatial discretisation of the investigated flow field and approximates the exact solution of the Navier–Stokes equation system in an iterative way to render the solution field [24]. Ansys Fluent 2021 R2 commercial software in Workbench environment was used for this work considering its highly robust solver, industry-leading accuracy, and superior modelling skills in Multiphysics. This market leading CFD software has been extensively validated across a broad range of applications, optimized for fast simulation time, and is able to unlock new potentials for everyday CFD challenges. Its working is based on the finite volume method and offers the usage of the volume of fluid (VOF) method which is an advection scheme. For mixtures and multiphase flows, VOF permits the tracking of the location and the form of a free surface or a fluid-fluid interface between two or more phases at any timestep. To do this, a fraction function, which is the integral of a fluid’s characteristic function in a mesh cell, is utilized. The derivative of the fractional function must be equal to zero, as presented in Equation (7) [25]. Here, is the time, is the fractional function (phase interface is situated where 0 ≤ ≤ 1; = 1 means the cell is full of a phase), is the fluid velocity, is an artificial force that “compresses” the region under consideration, and is the nabla operator.
2.3.2. A Transient, Multiphase, Non-Newtonian CFD Model for Visco-Dampers
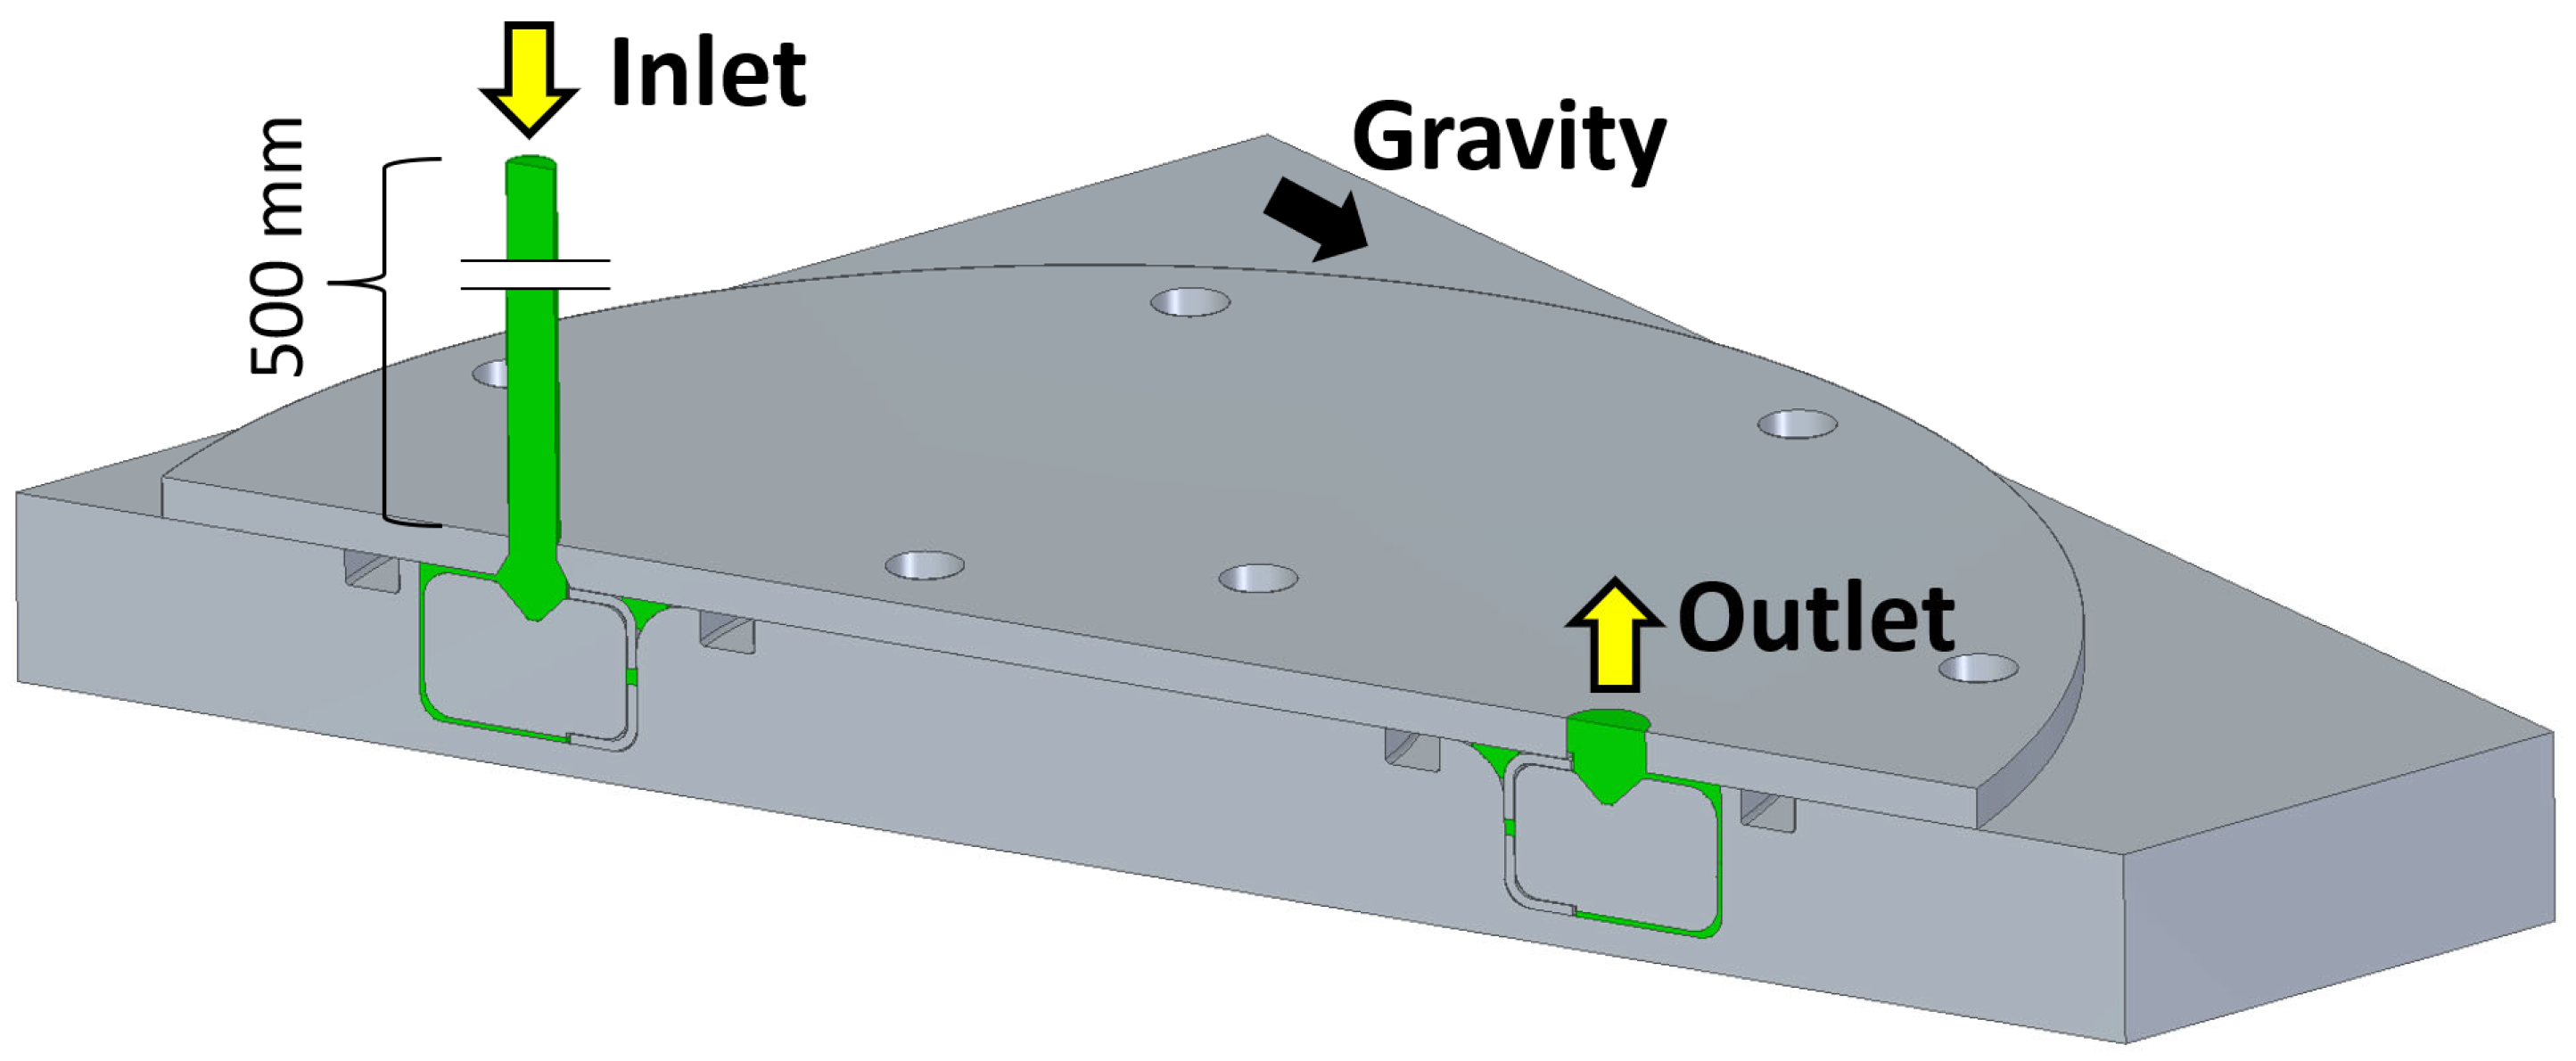
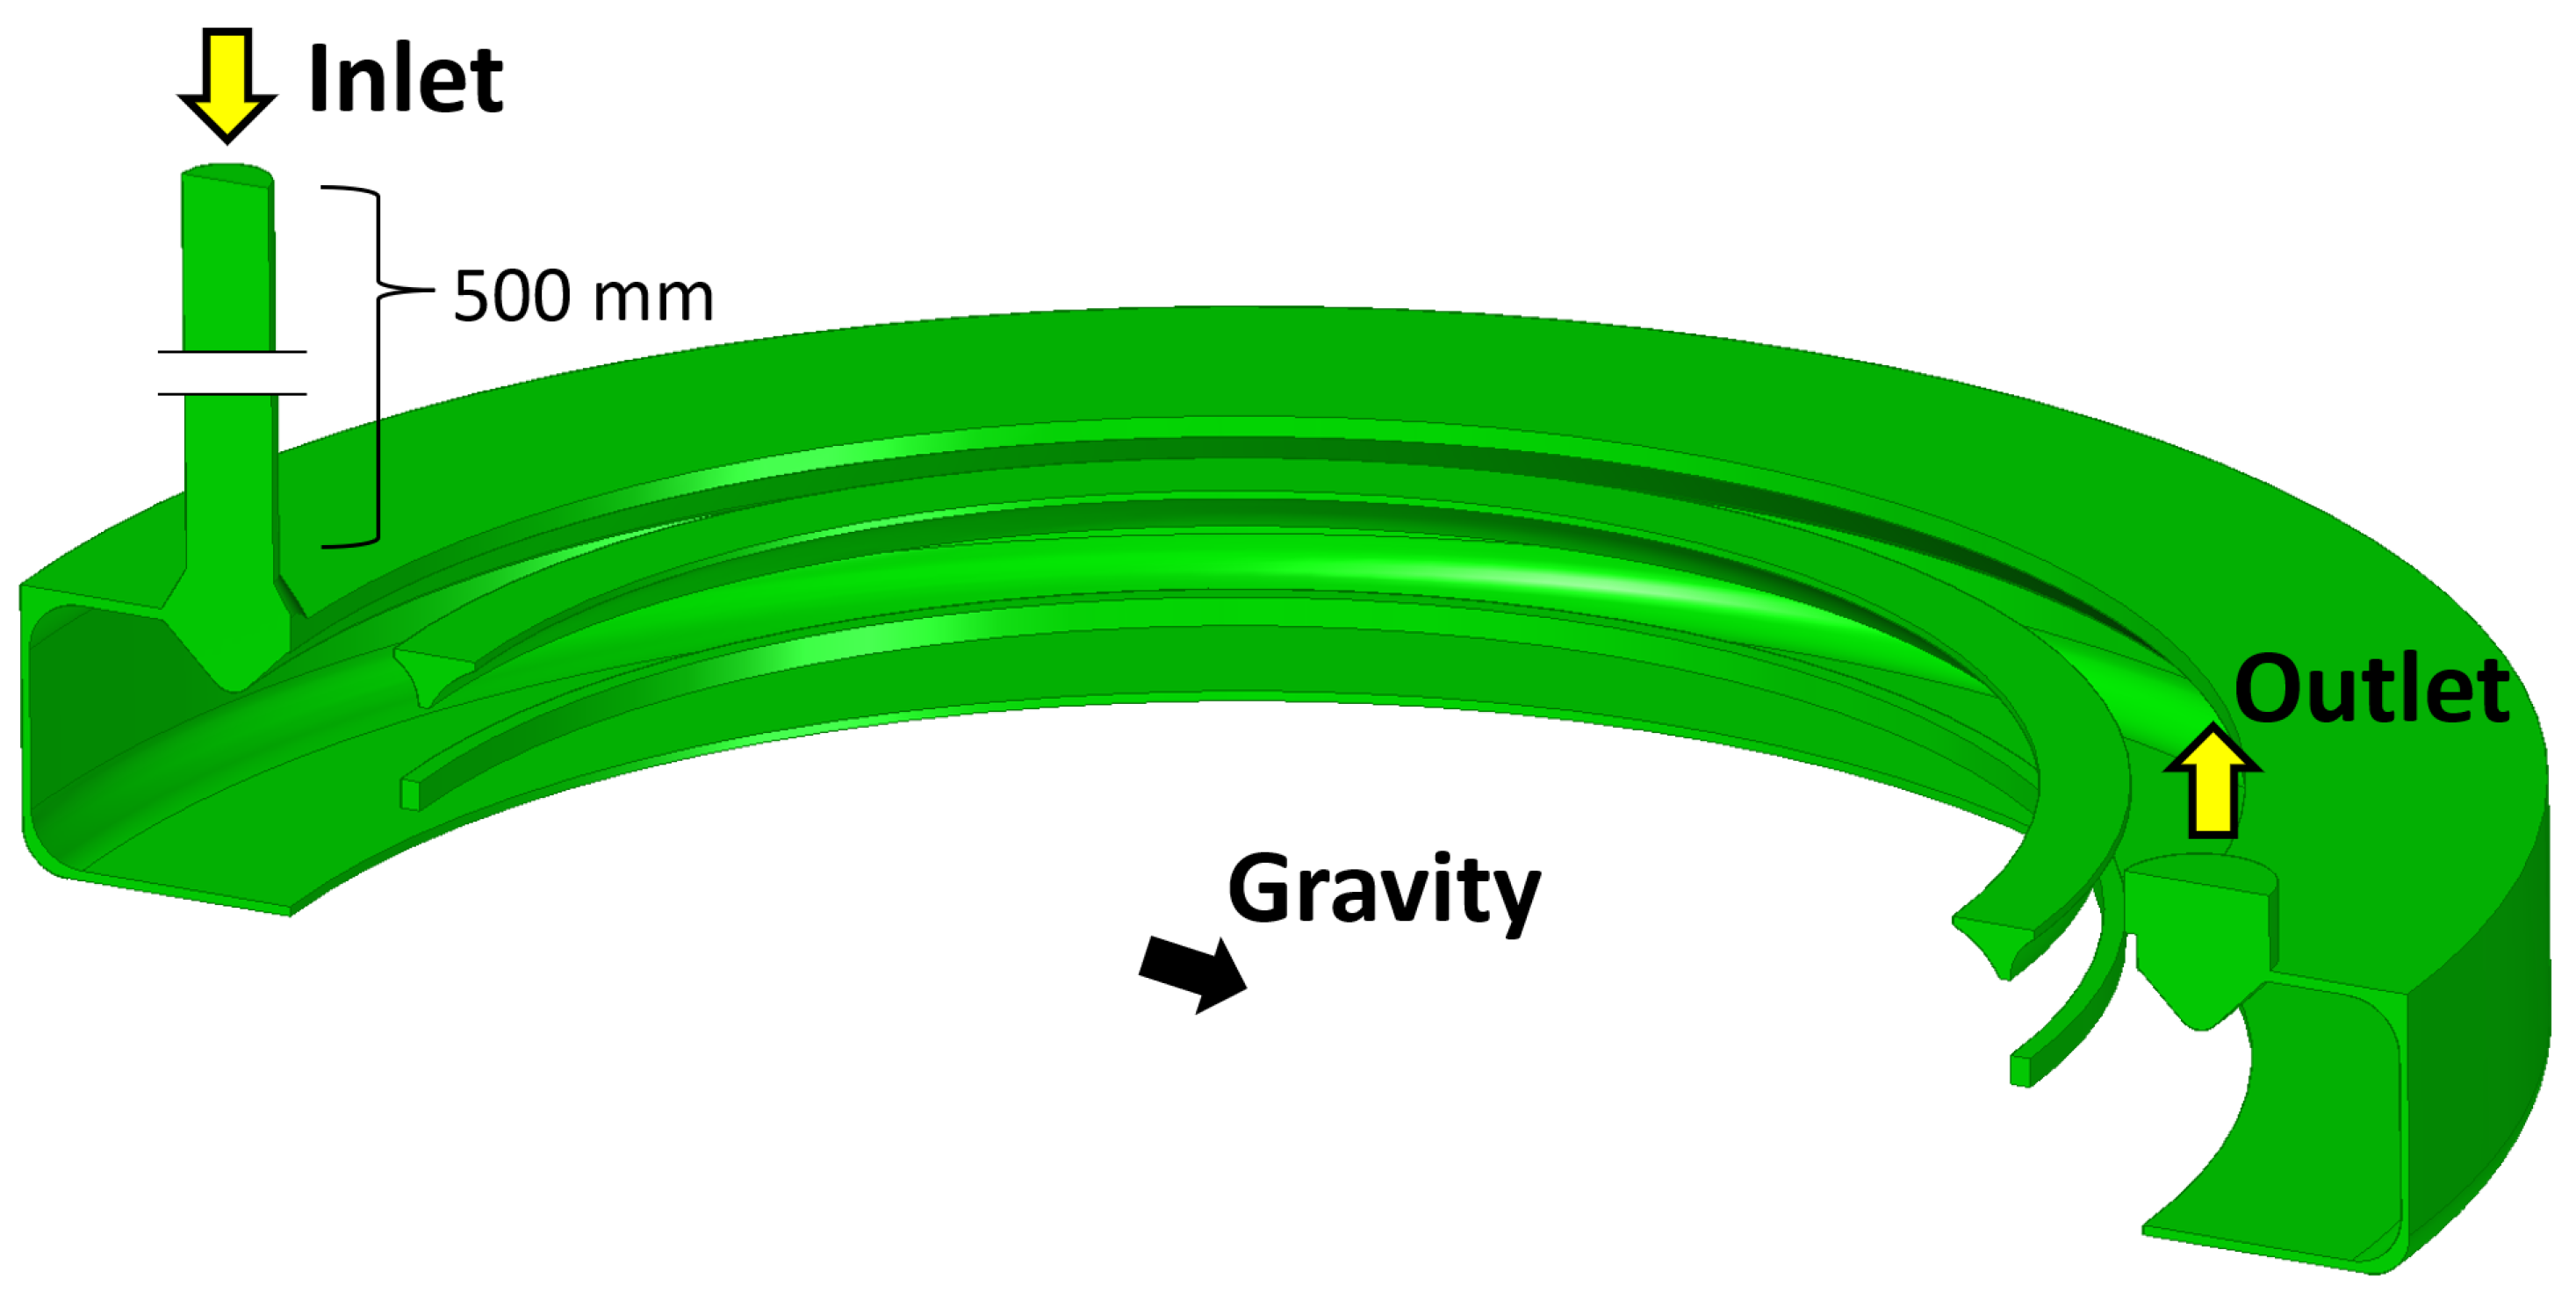
The computer-aided design (CAD) model of the test damper (see Figure 9) was used to create the flow field geometry of silicone oil and of air for the CFD calculations as shown in Figure 10. As mentioned in Section 2.2.2, the inlet pressure measuring point (P3) could not be installed right at the inlet hole of the test damper. Thus, a 500-mm-long inlet channel was added to the inlet boundary to implement the recorded distant inlet pressure curves (see Figure 11 and Figure 12). Moreover, the correct direction of gravity (constant 9.81 m/s2) was taken into account in the CFD model. The flow field is built up from polyhedron mesh elements, for enhancing the convergence and reducing the calculation time, and the numerical mesh contains 780,674 cells, 4,323,868 nodes, and 5,107,867 faces.
Each surface of the flow field geometry (except for the inlet and outlet) is defined as a wall with a general heat transfer coefficient value of constant 8 W/m2/K based on the recommendation of reference [26]. The wall adhesion for the silicone oil is considered as perfectly wetting (by a contact angle of constant 10°) based on a study [27], while the surface tension between silicone oil and air is set to a constant 0.0215 N/m based on the product catalogue [14]. At the beginning of the simulation, the temperature of the oil and of the air is set to 22.6 °C (as recorded in “A” point, see Section 3.1) and the flow field from the inlet hole to the outlet hole is filled with air considered as an ideal gas (between the inlet and the inlet bore is filled with silicone oil) while the reference pressure is set to 1 bar. At the outlet, a static pressure of −4200 Pa is applied (as recorded in “A” point, see Section 3.1) relative to the reference pressure.
As far as the silicone oil’s viscosity calculation is concerned, the temperature- and shear rate-dependent Carreau–Yasuda viscosity model was used and the temperature-dependent model parameters for Wacker AK 1,000,000 STAB silicone oil were adopted from a previous work [28] of the authors based on the measurement series of a detailed rheological analysis. The temperature-dependent density function, the thermal conductivity (constant 0.15 W/m/K), and the specific heat (constant 1550 J/kg/K) of the oil are adopted from the product catalogue [14] while the molar mass of the oil (constant 109,910.3 kg/kmol) is calculated from the constitutional formula of PDMS in Figure 2.
In terms of the applied models, VOF multiphase model was used to calculate the interface between oil and air phases with implicit volume fraction formulation, sharp-type interface modelling, and interfacial anti-diffusion. Implicit body force formulation was also applied. Laminar flow is expected in the oil phase with viscous heating. As for pressure-velocity coupling, the PISO scheme was used with second-order upwind equations for spatial discretization, and the volume fraction calculated by compressive-type equations.
Regarding the solver settings, the filling process was calculated for 500 s, divided into 5000 time-steps, where each time step is calculated by a 0.1 s time increment in 20 iterations. The residual target for mass, moment, and silicone oil’s volume fraction is set to 10−4 while for energy it is set to 10−6.
3. Results
3.1. Neutron Imaging Results and Recorded Data
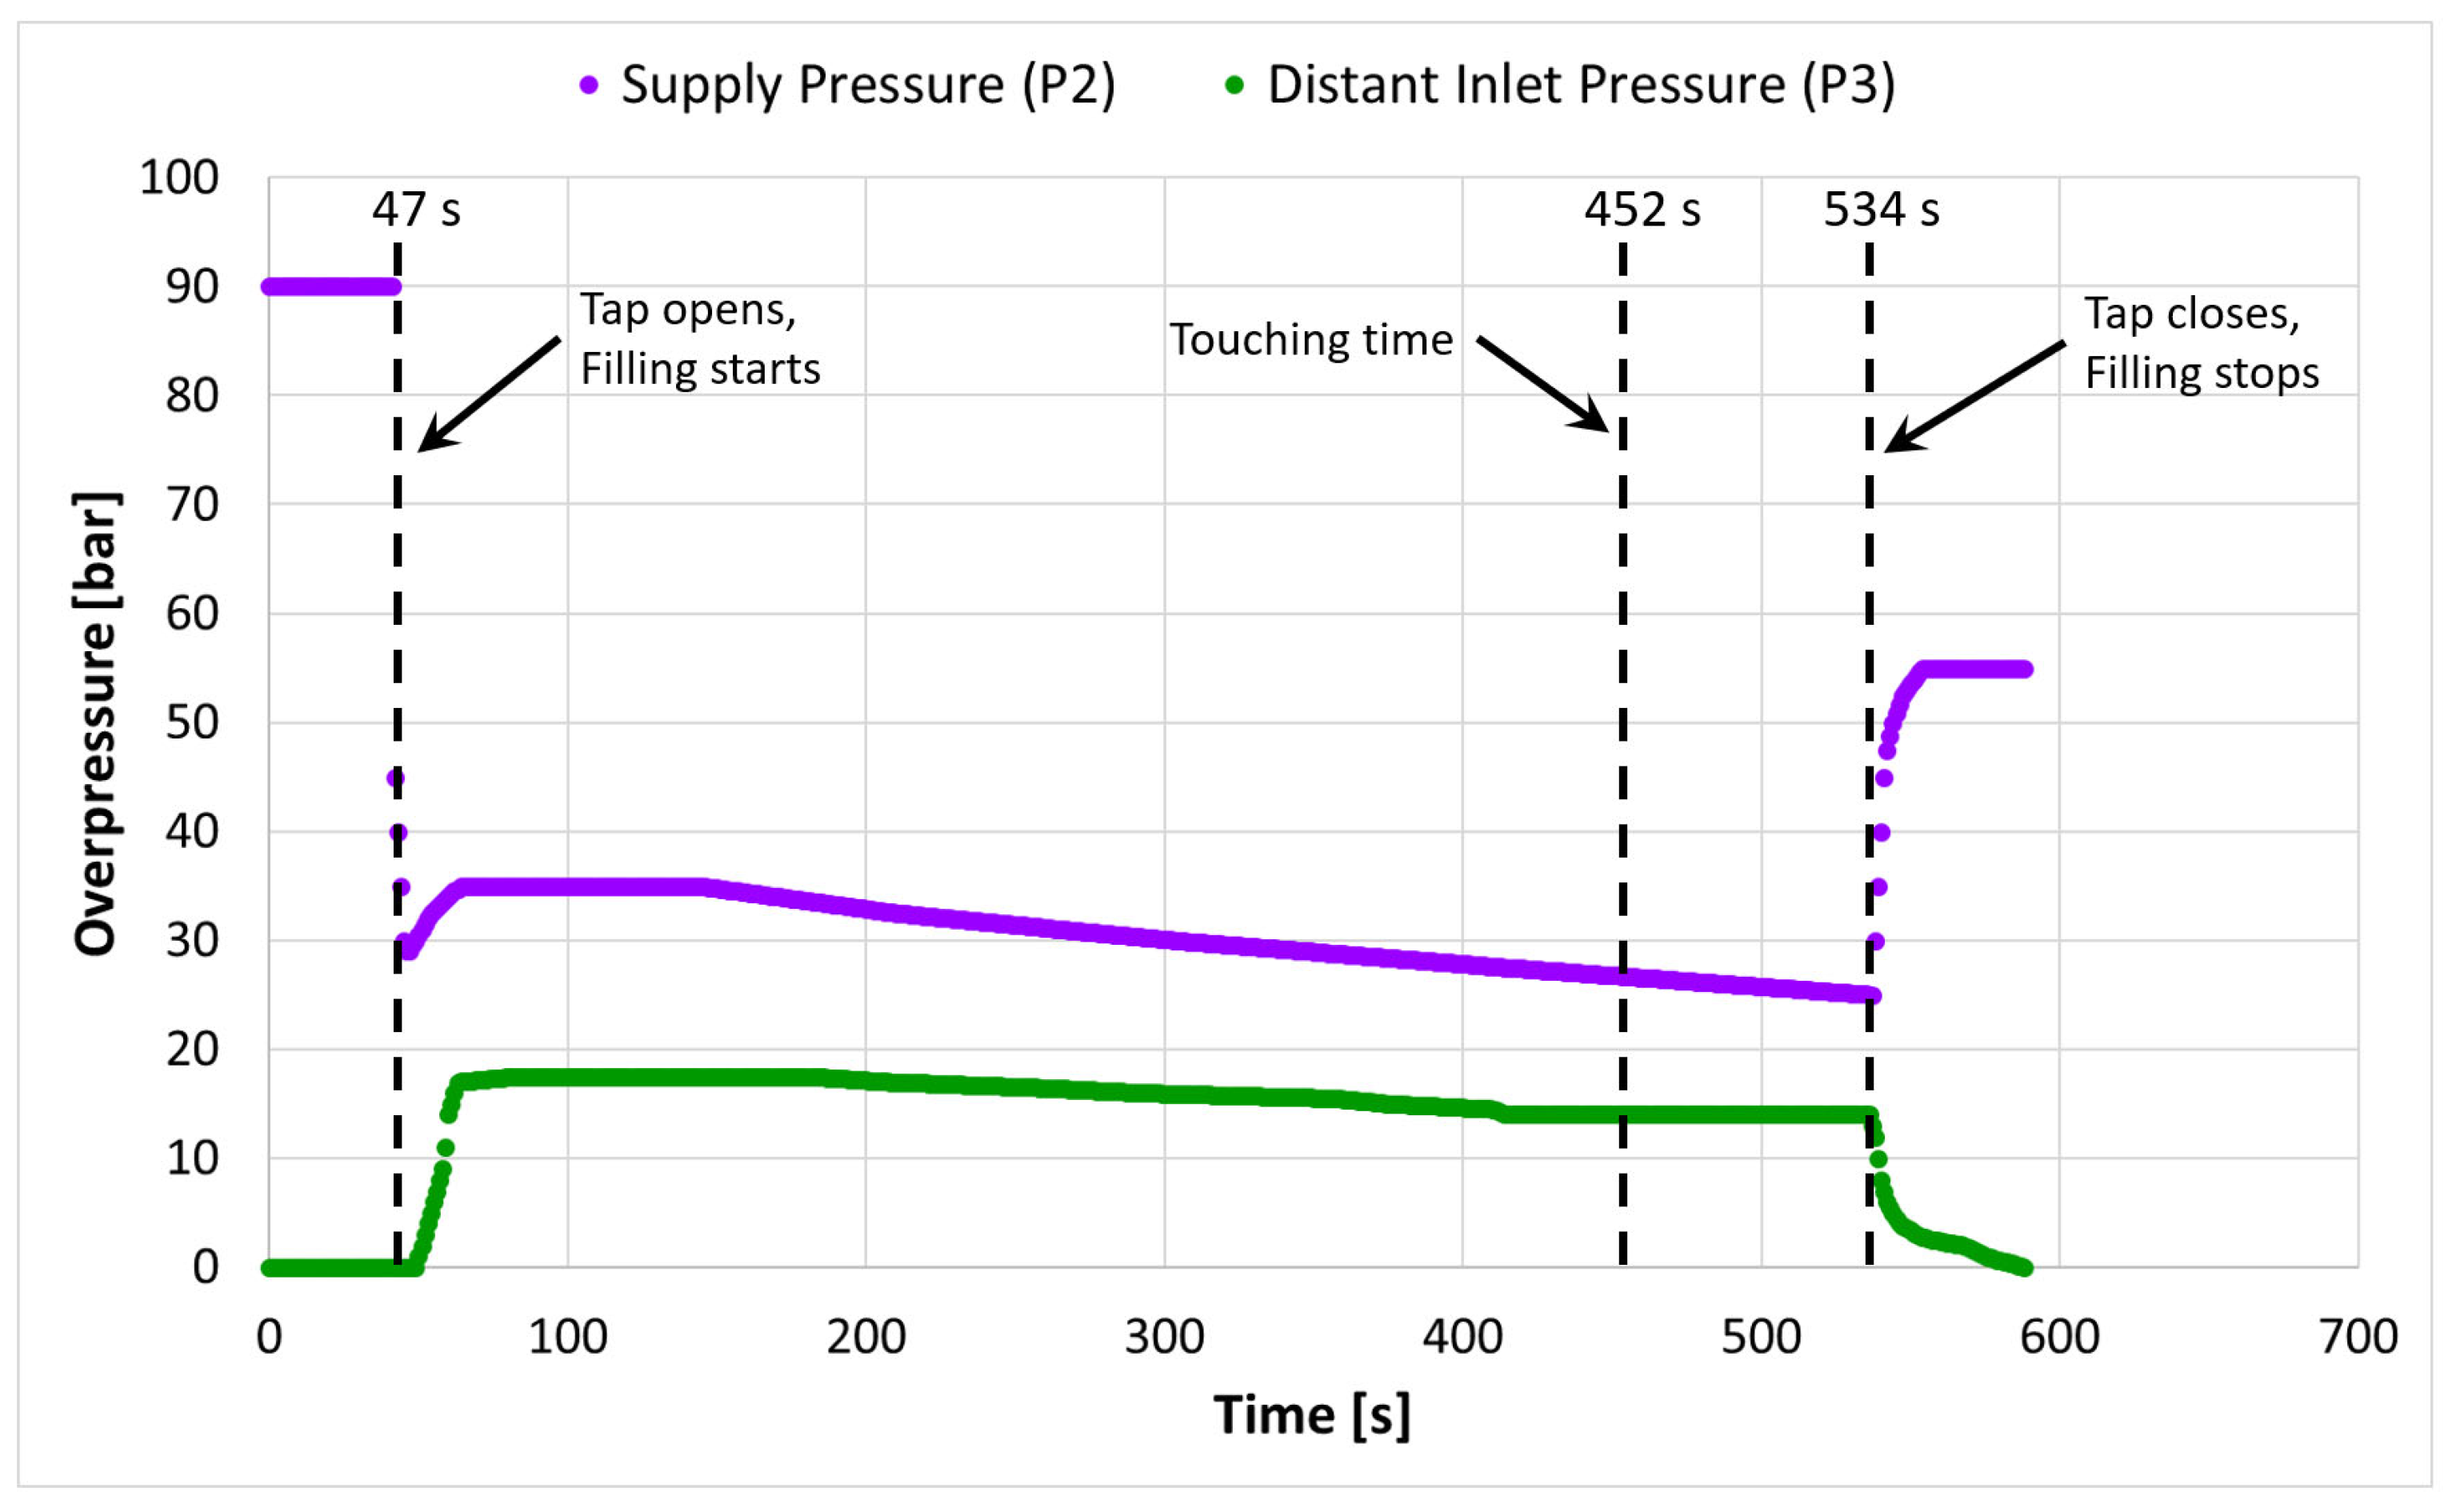
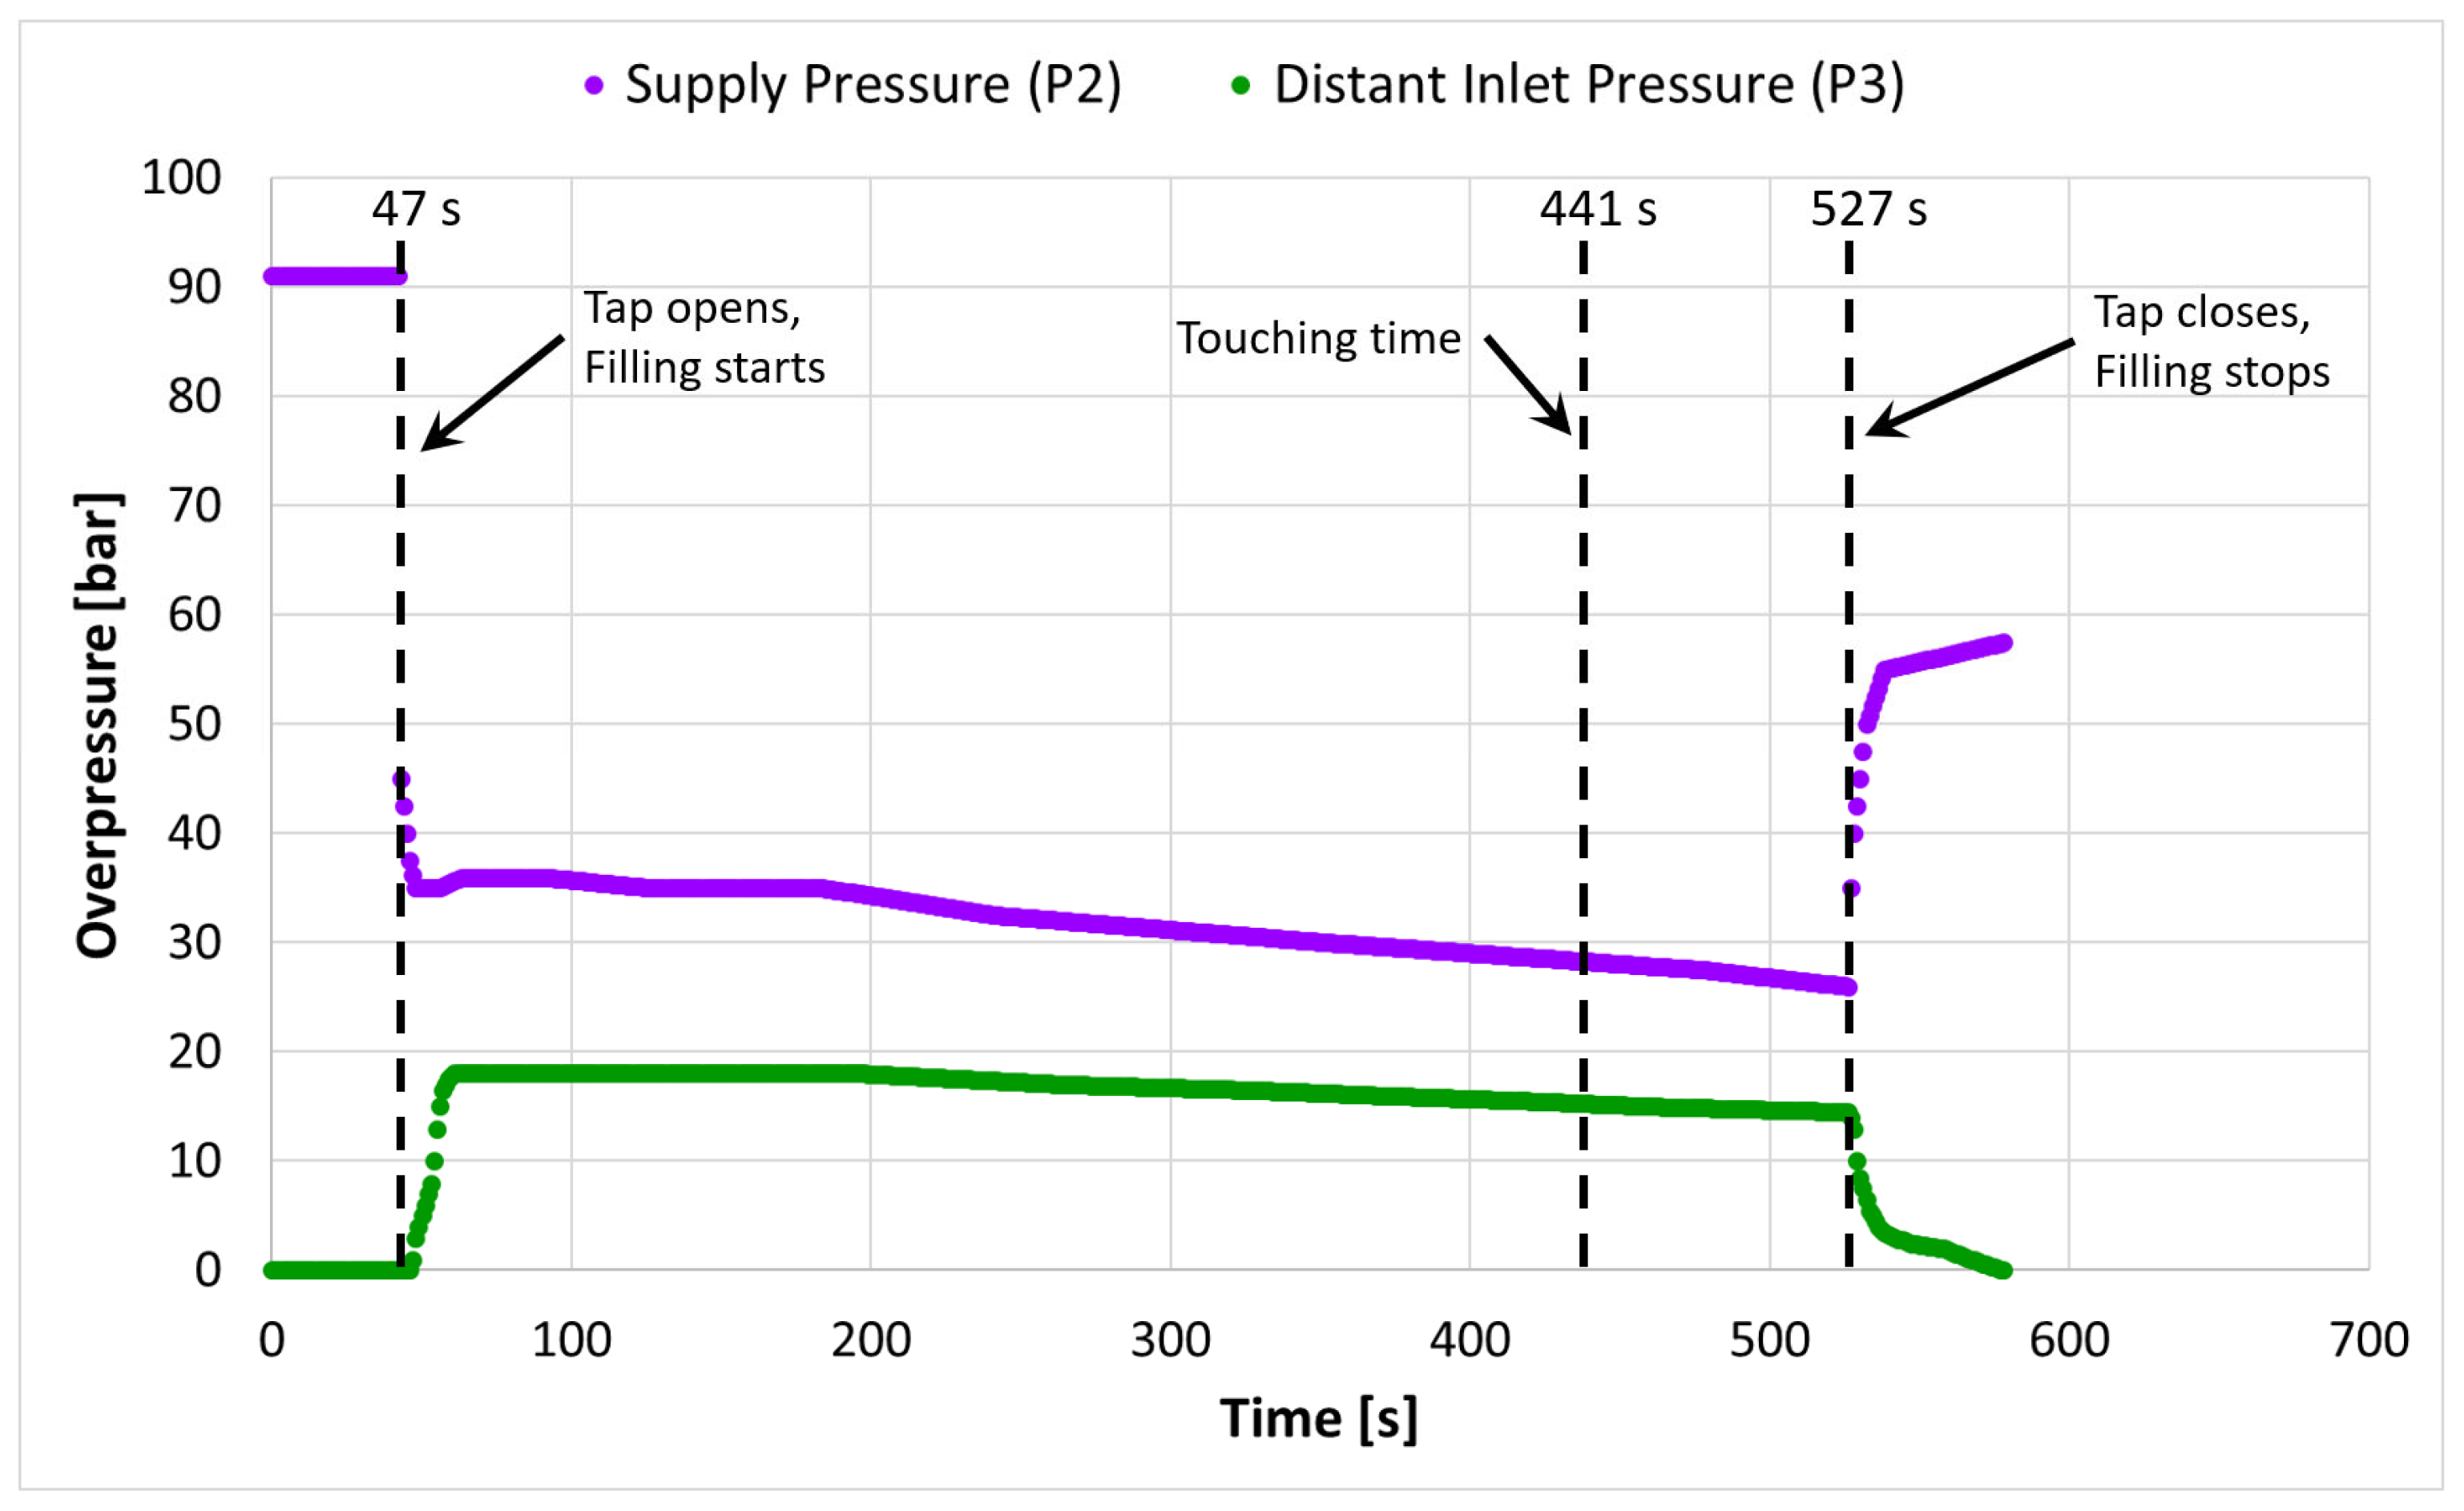
During the measurements, ambient pressure of 95,800 Pa and temperature of 22.6 °C were recorded at “A” point (see Figure 6), which will be used as input data for the CFD calculations. The ambient pressure in the bunker is kept below 100,000 Pa to prevent the uncontrolled release of harmful substances in the air to the environment. The hydraulic pump pressure in the P1 point was set to 500 bar before each measurement and similar pressure profiles were recorded during each measurement case in P2 and P3 points. Figure 11 shows the recorded supply pressure values (P2 point) and distant inlet pressure values (P3 point) of a “Top” case measurement, while Figure 12 presents the pressure profiles for a “Bottom” case. The black, vertical, dashed lines in the diagrams indicate three notable moments: the opening time, the touching time (the moment when the two oil arcs touch each other), and the closing time. Since the filling process has been investigated till the touching time, one can also calculate the propagation time for the “Top” case: 452 s − 47 s = 405 s, and for the “Bottom” case: 441 s − 47 s = 394 s. The slide-bearing cut-off position has a detectable impact on the filling process in form of a 405 s − 394 s = 11 s extra propagation time when the cut-off is in the “Top” position. The reason behind this extra propagation time will be revealed with help of the NR images.
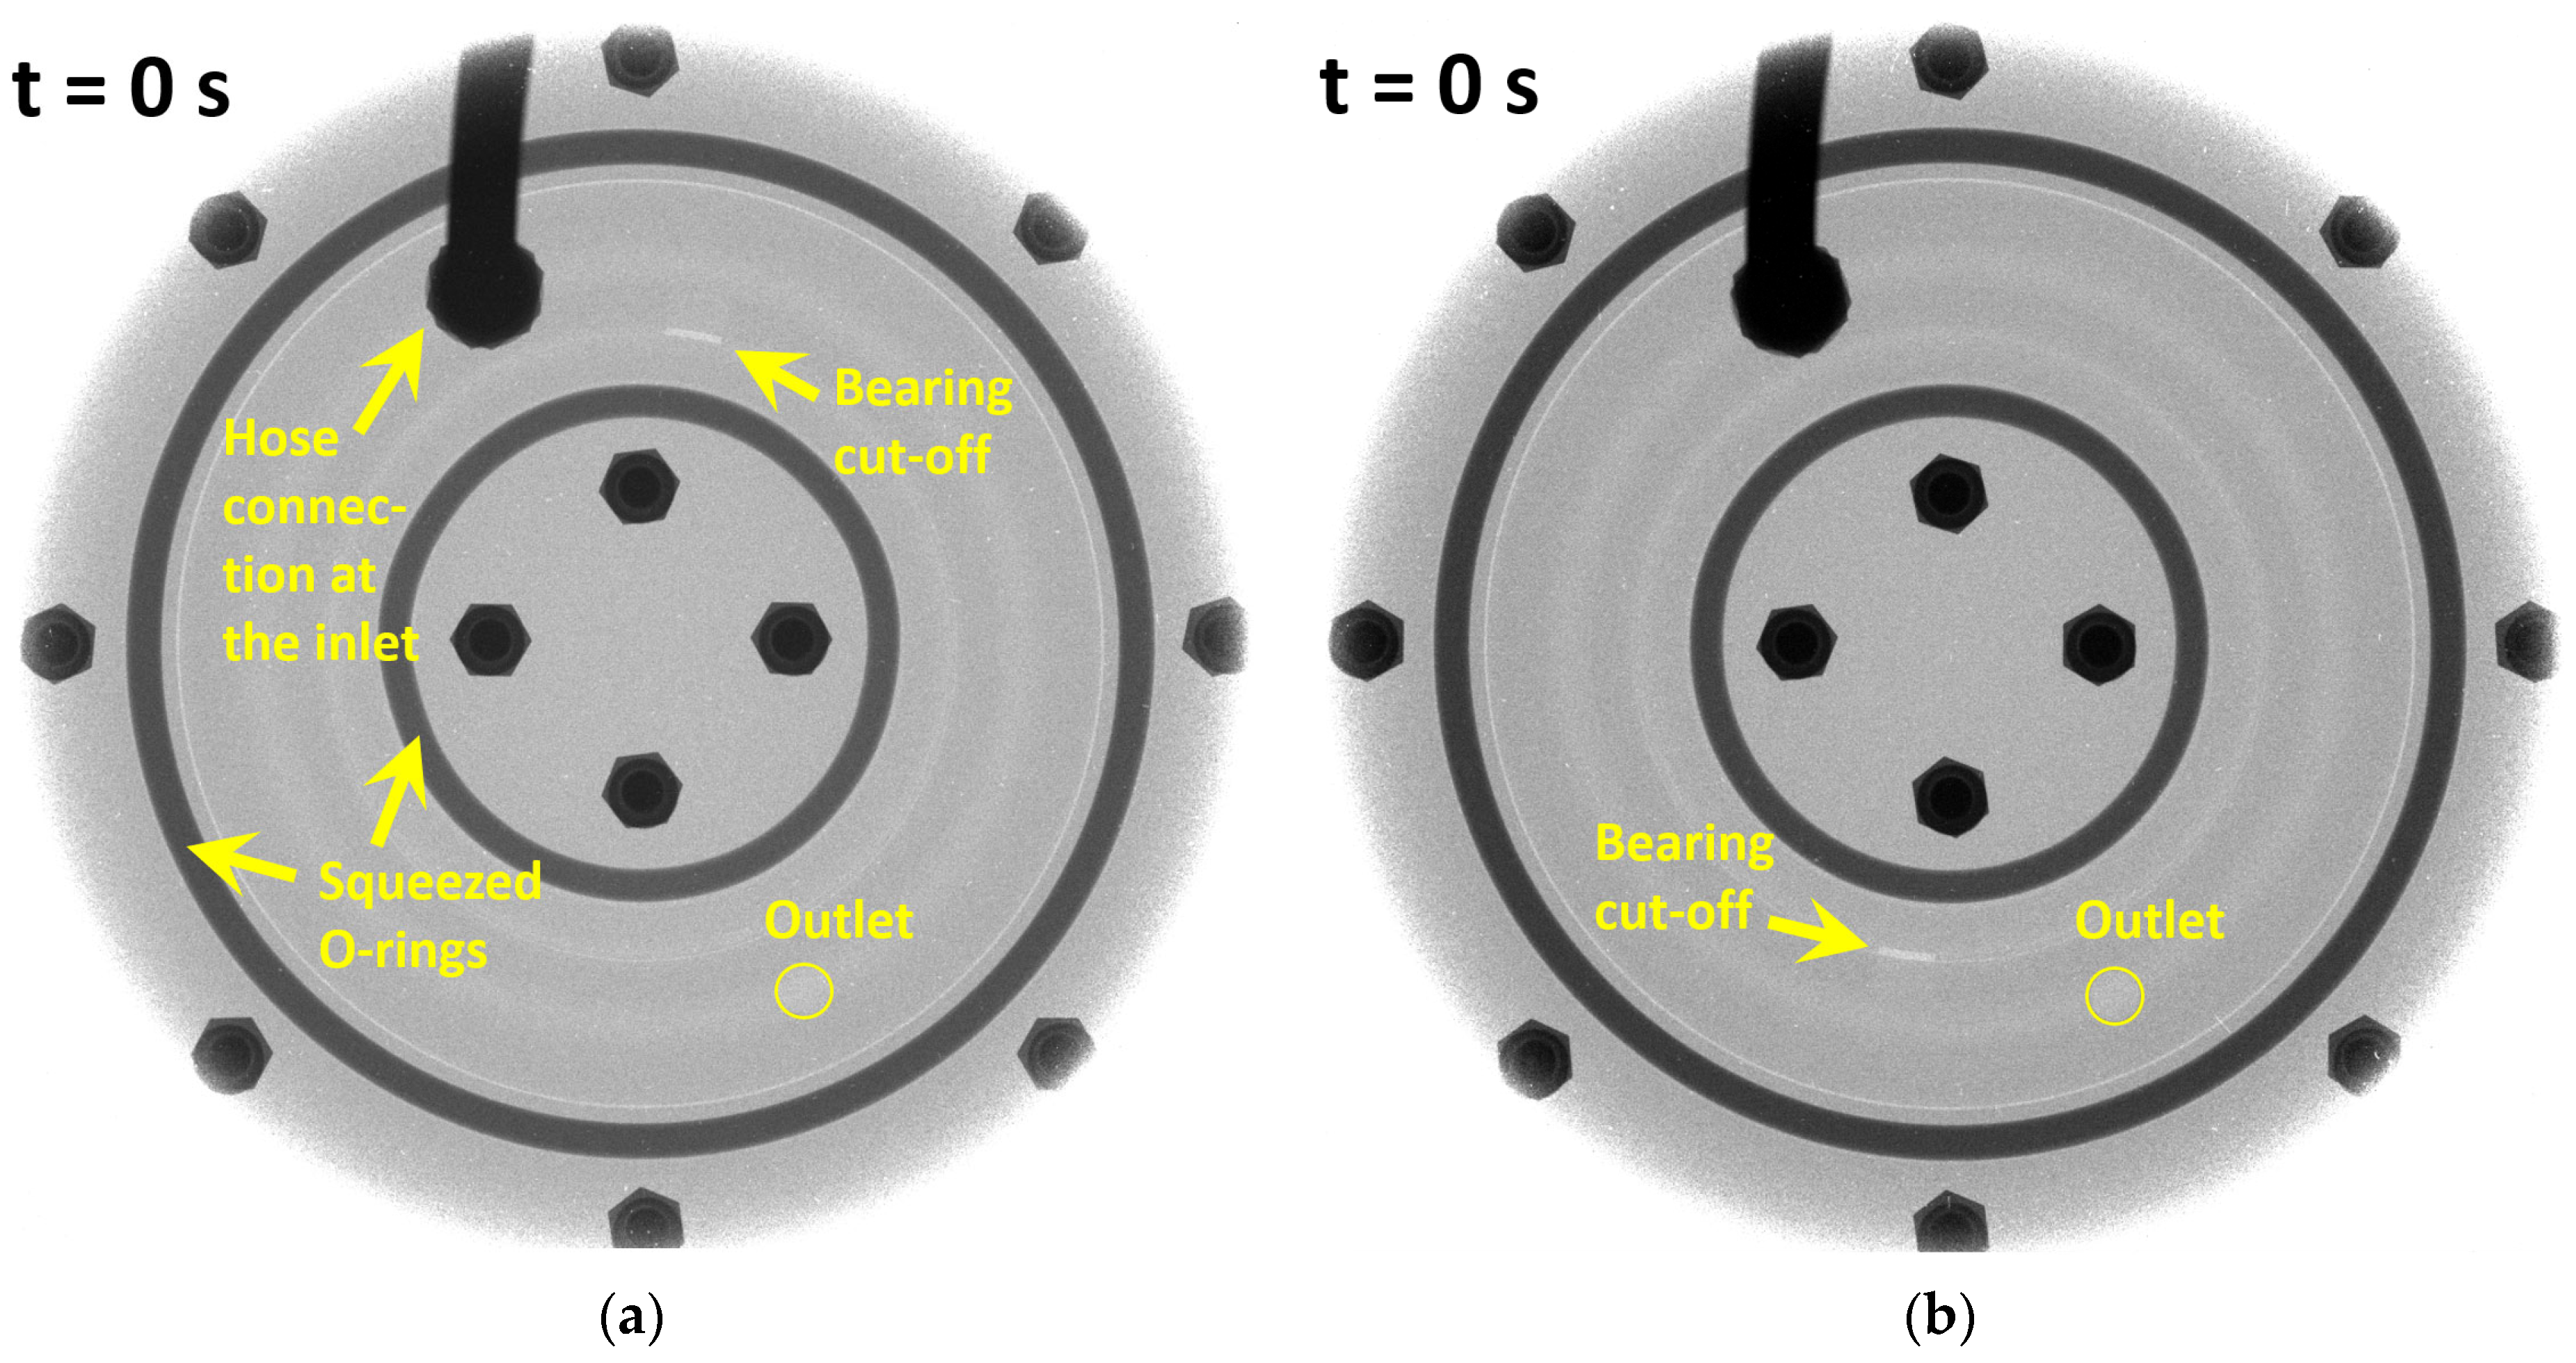
Figure 13 displays the initial images of the recorded filling process for both the “Top” and the “Bottom” cases, when no silicone oil has yet been filled into the damper gap, and these initial images are called “dry” images. One can easily identify the position of the bearing cut-off, the connected hose, and the squeezed o-rings (due to the high hydrocarbon content), as well as the PEEK bolts, while the outlet bore is marked by a yellow circle.
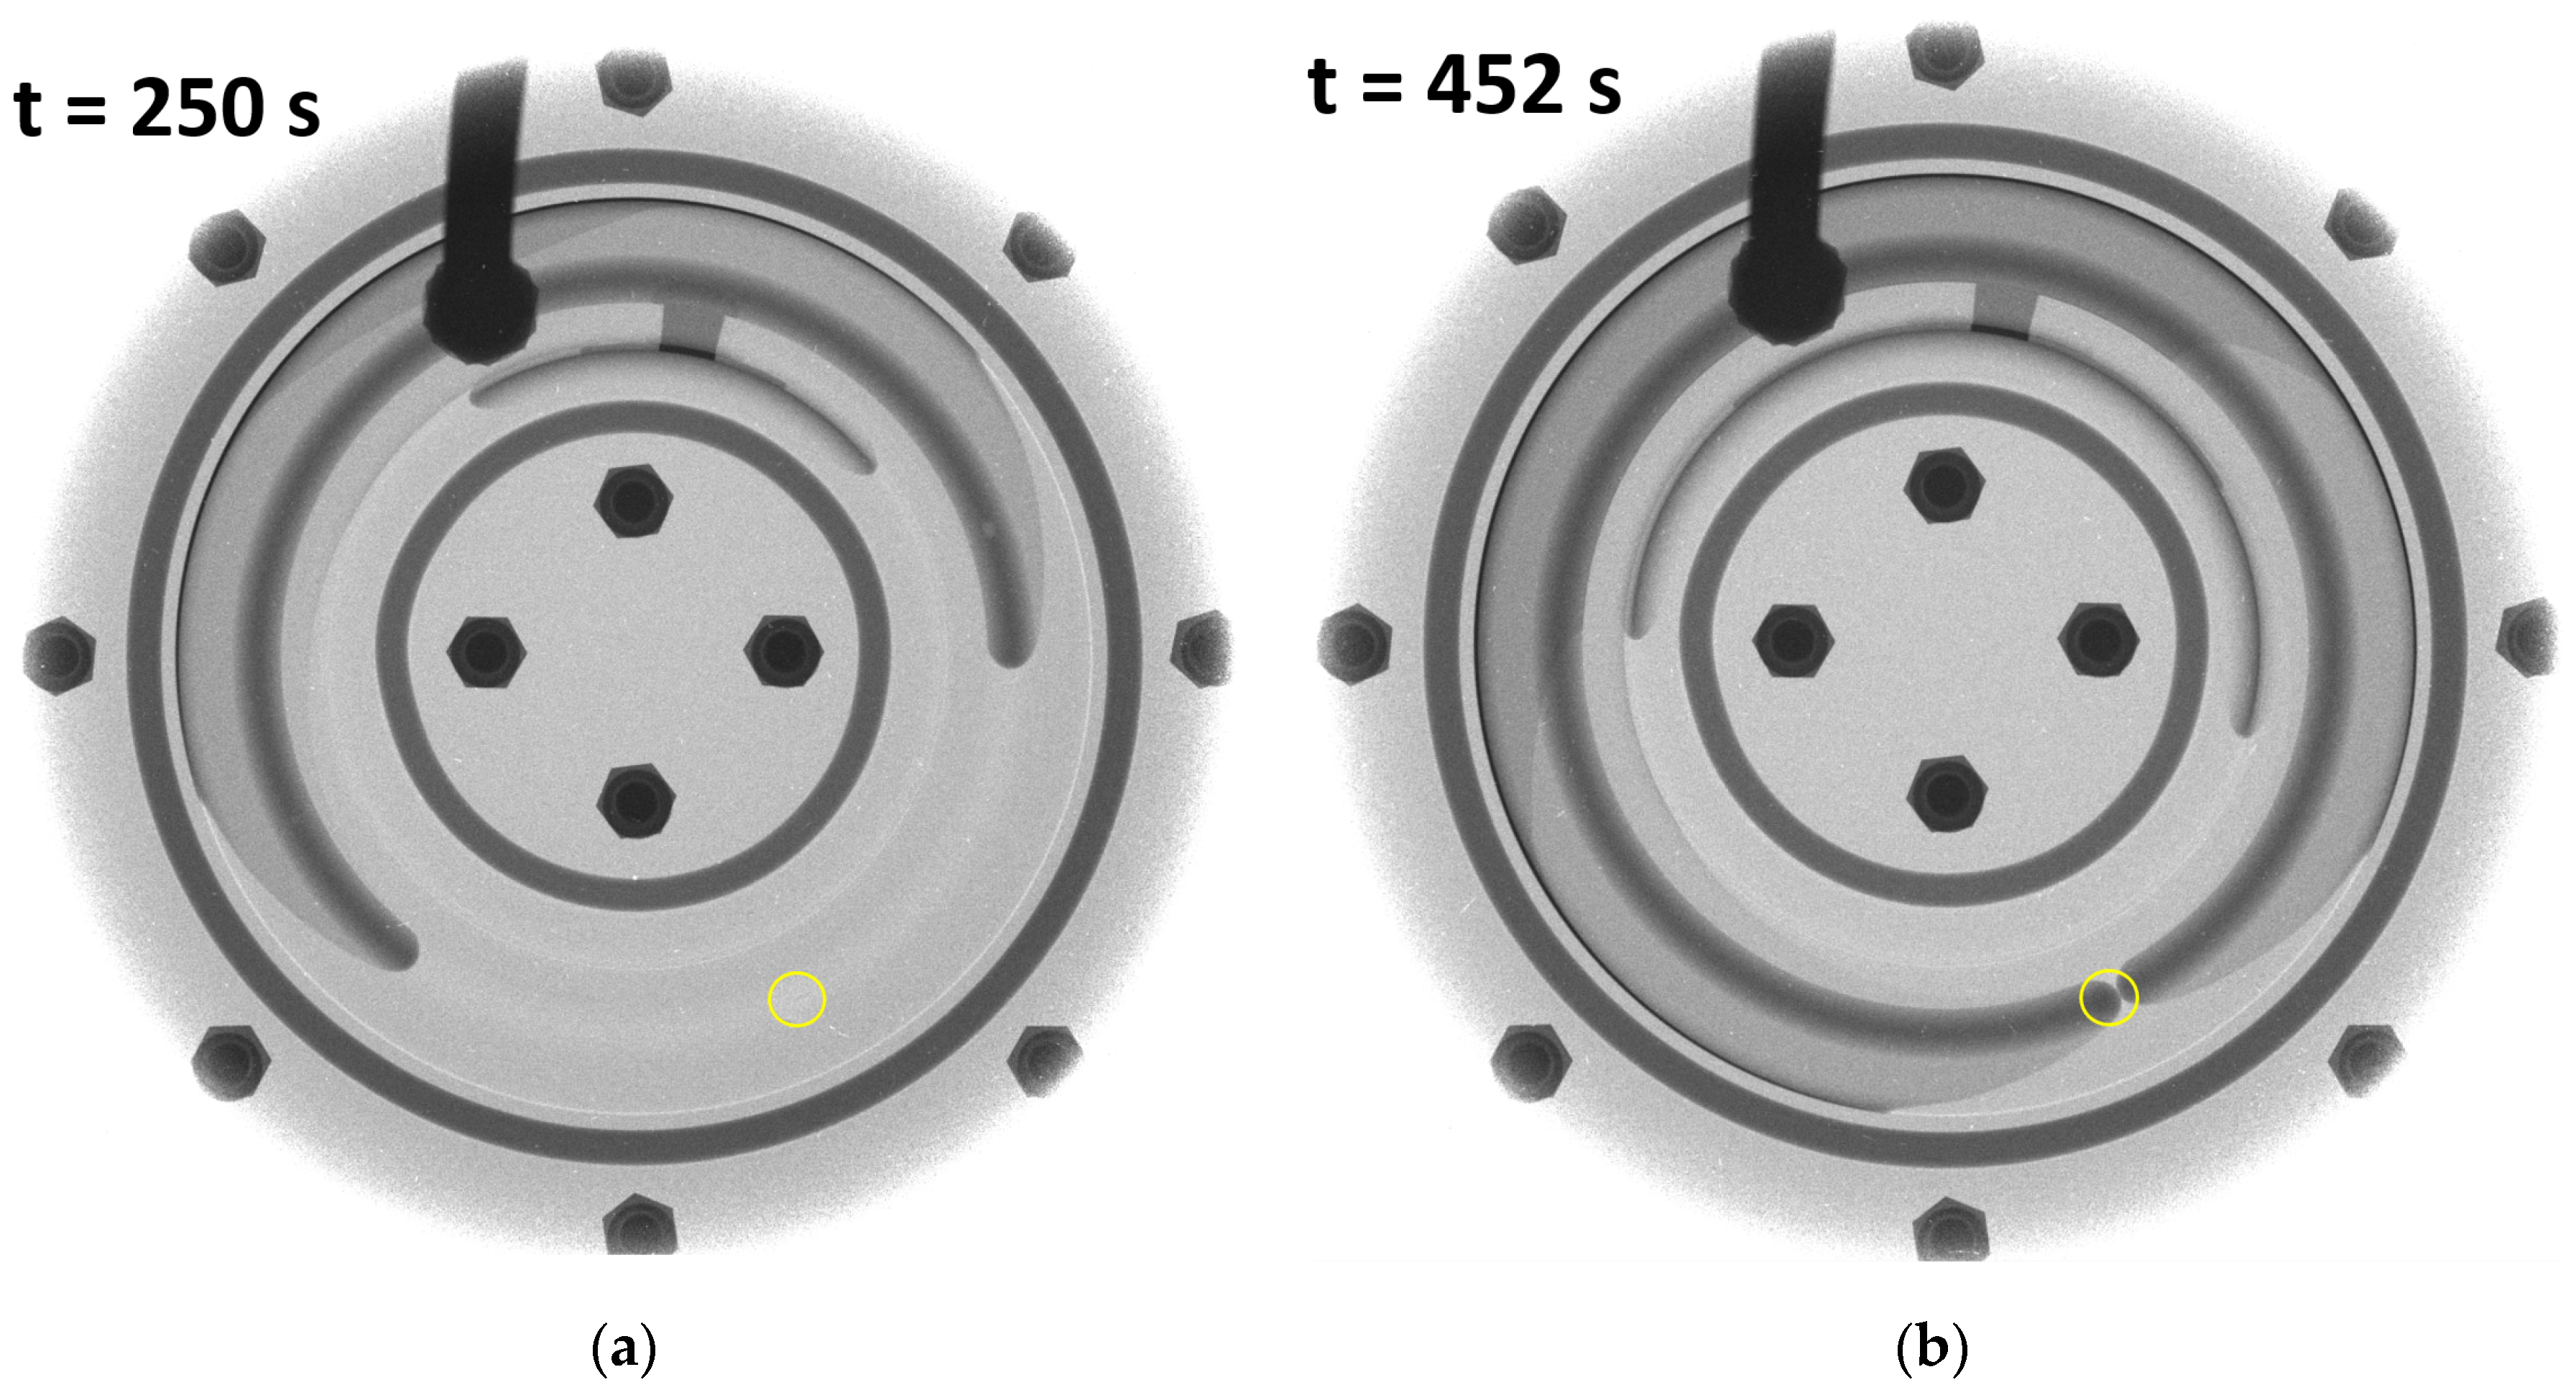
As far as the NR images of the filling process are concerned, two notable moments have been selected for presenting the NR results: Figure 14a and Figure 15a show the silicone oil distribution in the damper gap at half time measured between the opening time and the touching time, while Figure 14b and Figure 15b visualize the actual oil propagation at the touching time. The darker regions in the NR images refer to increased oil layer thickness that the neutron beam has to pass through. The reason behind this thickness increase can be explained by increased gap size (e.g., oil-guiding groove on the inertia ring’s surface) or by the oil layers which bypass the inertia ring and move behind it. If the bearing cut-off is in the top position, the cut-off taps the right-side oil arc and causes slightly slower oil front propagation compared to the left-side arc. As a result, less oil remains in the right-side arc and the left-side arc reaches first the outlet hole. If the bearing cut-off is in the bottom position, no tapping effect acts on the right-side arc but on the left-side arc of the oil. Thus, the right-side arc reaches first the outlet hole. See also the ratio difference of the covered area by the two arcs in the yellow circle at t = 452 s and t = 441 s in Figure 14 and Figure 15 for a deeper understanding.
The silicone oil’s front velocity profile over time, obtained from the evaluation of NR images, is presented together with the CFD-calculated oil front velocities in Section 4.
3.2. Numerical Calculation Results
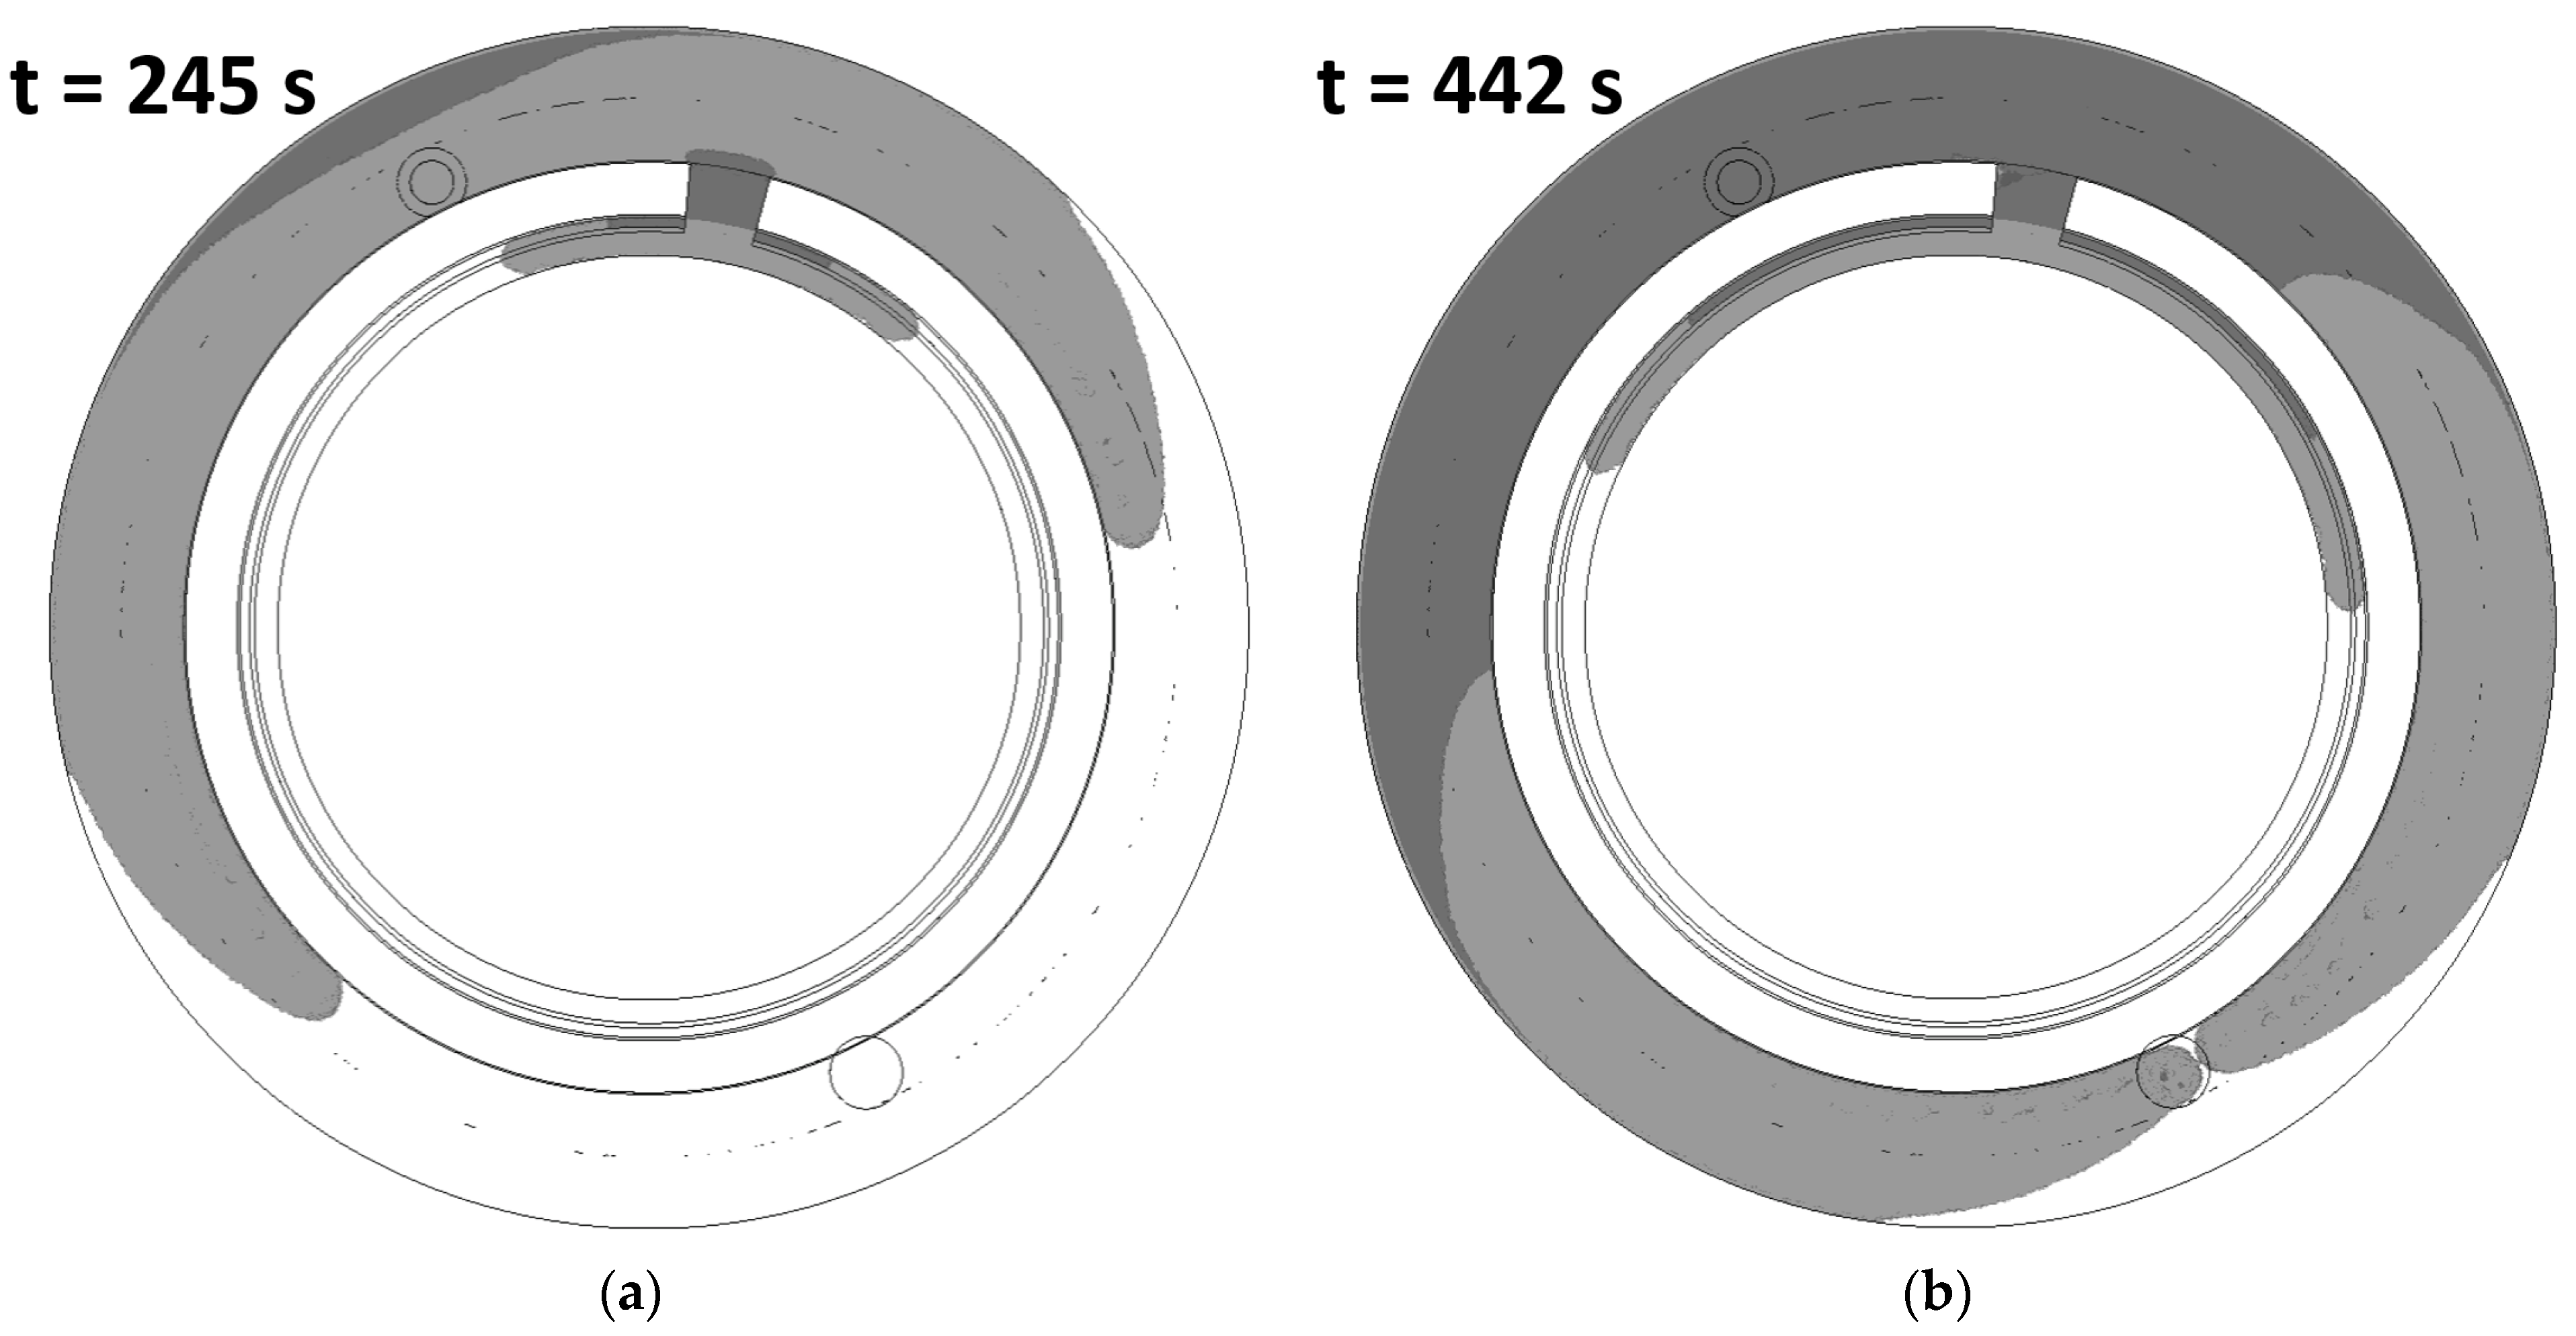
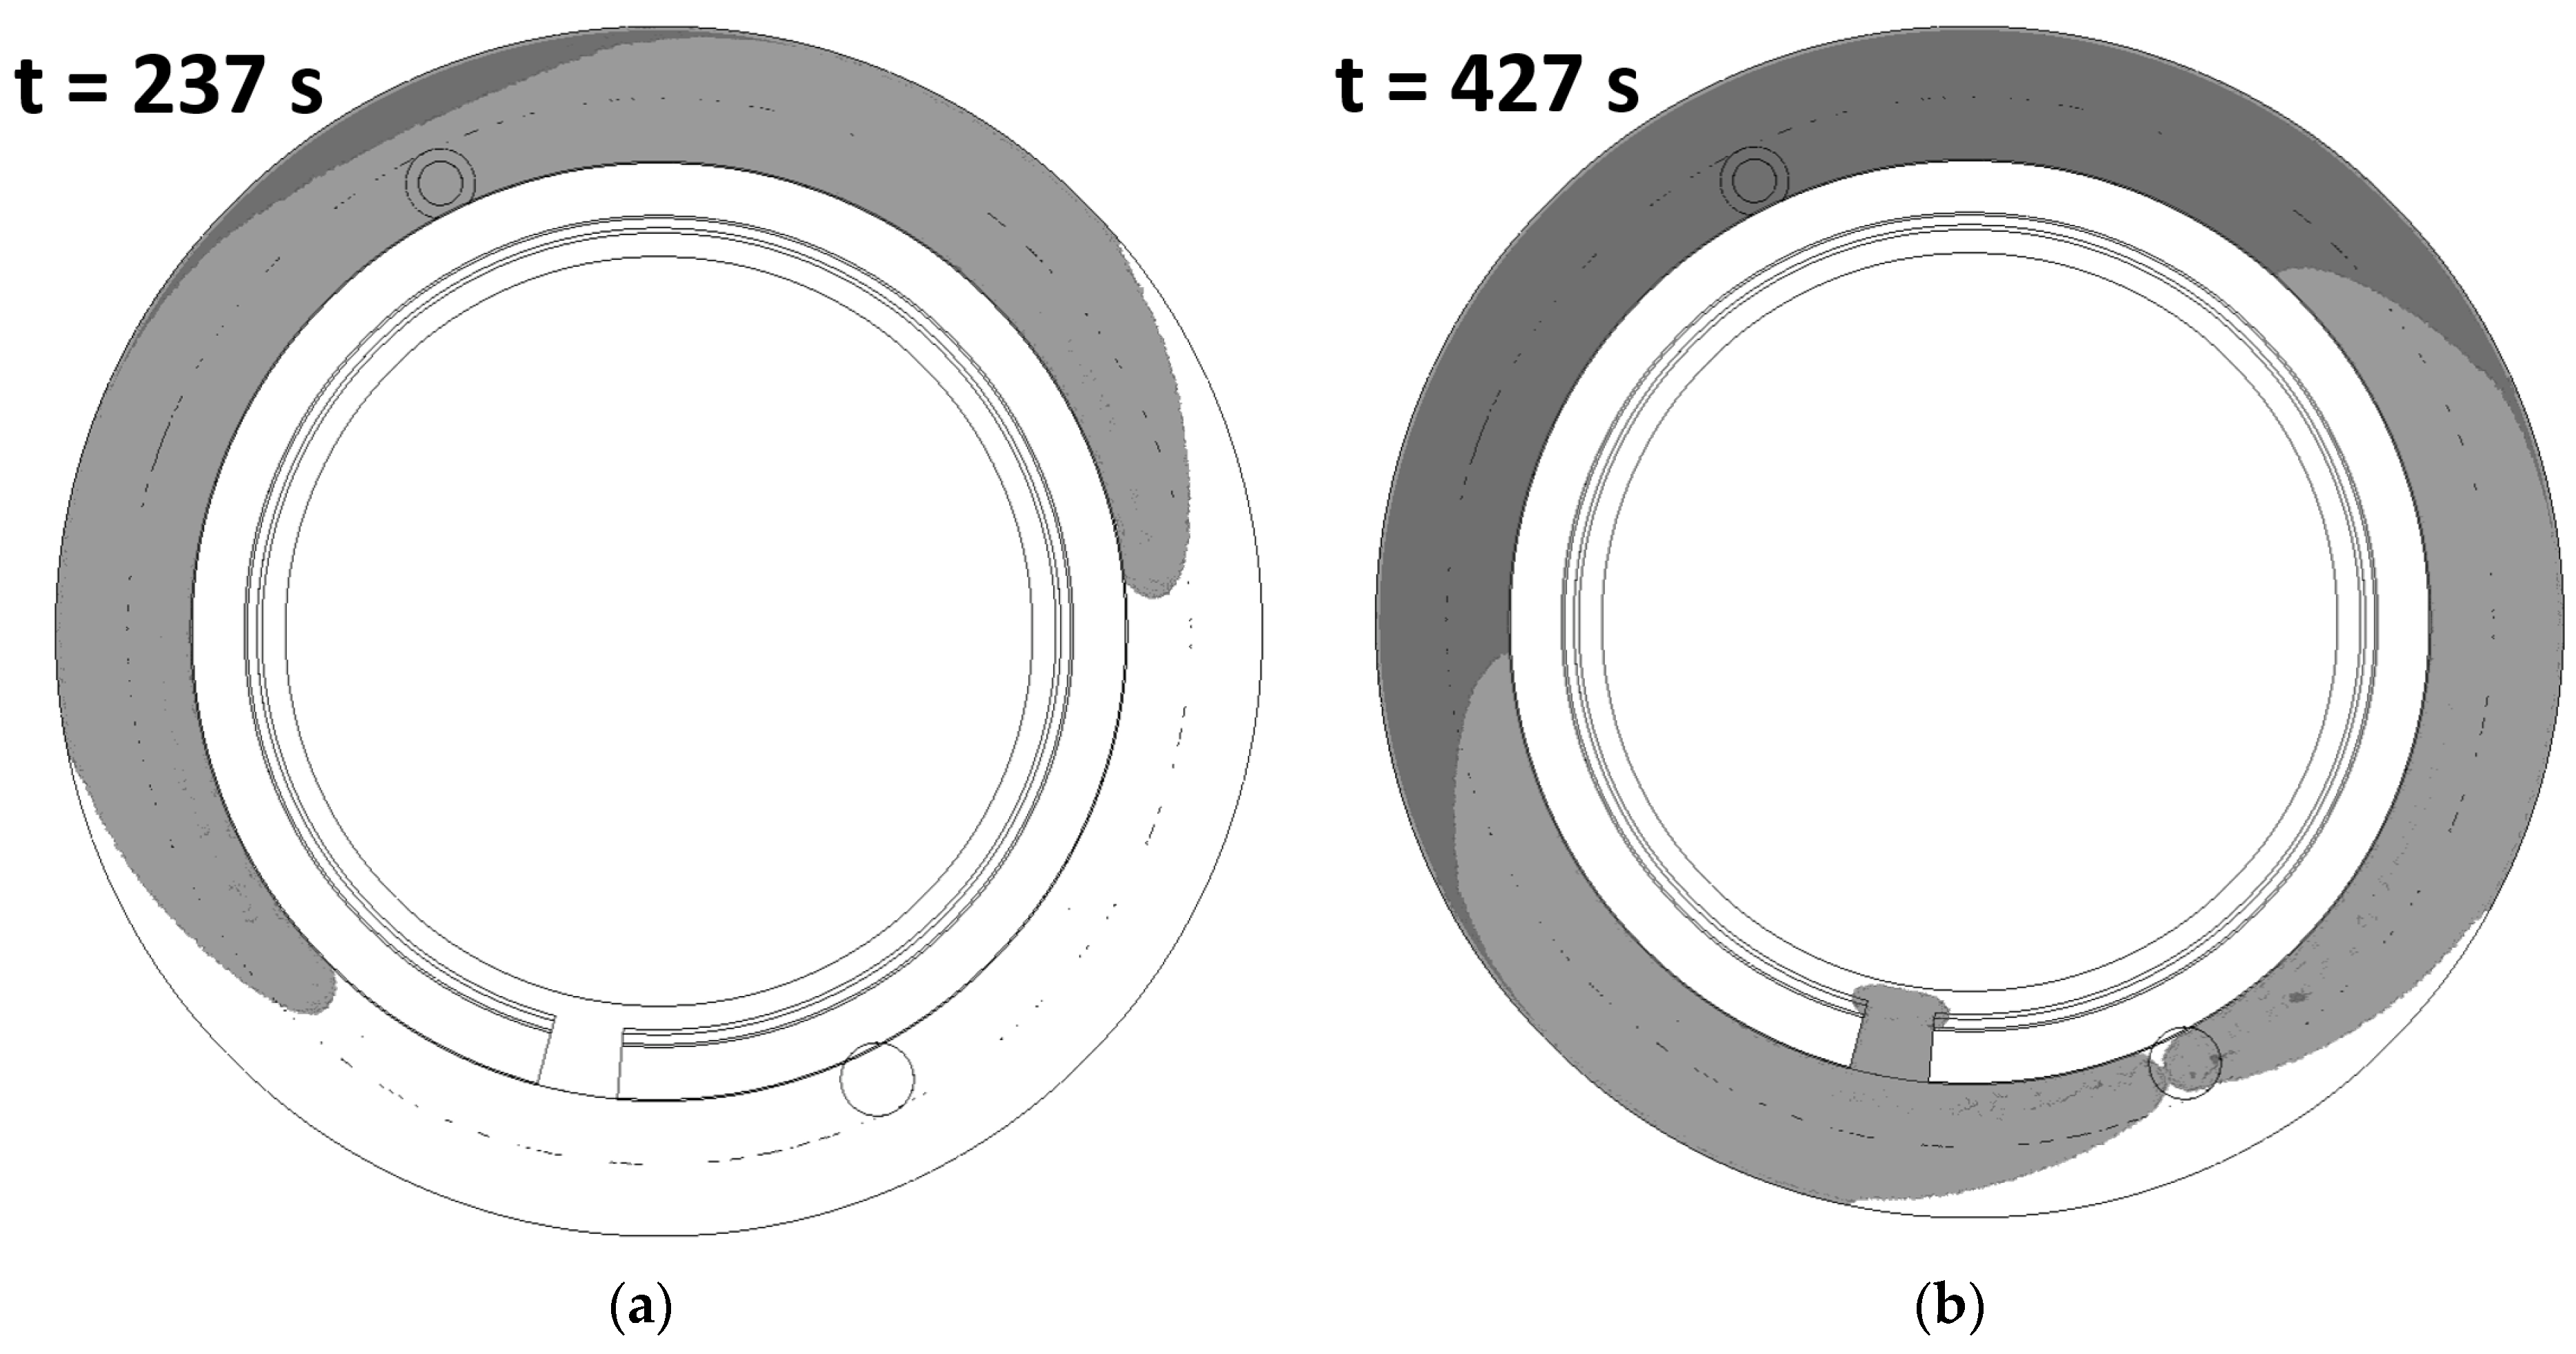
The spatial distribution of the silicone oil phase was rendered for two notable moments. Figure 16a and Figure 17a show the actual oil spread at half-time of the propagation while Figure 16b and Figure 17b show the oil distribution at the touching time. One can also calculate the propagation time (measured between the opening time and the touching time) for the “Top” case: 442 s − 47 s = 395 s and for the “Bottom” case: 427 s − 47 s = 380 s. The darker regions on the CFD images, similar to NR images, are caused by oil layers that bypass the inertia ring and move behind it. The tapping effect of bearing cut-off appears in the CFD results as well: in the “Top” case the left-side oil arc reaches the outlet hole first (see Figure 16b), while in the “Bottom” case the right-side oil arc reaches the outlet hole first (see Figure 17b). The extra propagation time for the “Top” case is found to be 395 s − 380 s = 15 s.
4. Discussion
By visually comparing Figure 14 with Figure 16 and Figure 15 with Figure 17, similar oil spread formation can be seen in the damper gap both at half times and at touching times. The correctness of the CFD calculation is also proven by the patterns of dark and light oil regions.
As far as the quantification of the CFD calculation’s correctness is concerned, propagation times and oil front velocities have been compared. There is a propagation time difference between the NR result and the CFD result of 405 s − 395 s = 10 s (2.47% relative difference) for the “Top” case and 394 s − 380 s = 14 s (3.55% relative difference) for the “Bottom” case. The oil front velocity both for the “Top” case (see Figure 18) and for the “Bottom” case (see Figure 19) was calculated from the NR images and plotted by light blue dots above 0 mm/s. The relatively large deviation of the NR-velocity values is explained in Section 2.2.3. A power-type curve was fitted on the NR-velocity values (marked by dark blue) and the fitting equation, with the R2 coefficient is given in the right upper corner of each velocity diagram. The CFD-velocity values of the oil front are exported from the CFD result files of each calculated second and plotted by red dots above 0 mm/s. The CFD calculation slightly overestimates the oil front velocity which results in shorter propagation times discussed above. In the “Top” case, the highest absolute difference between the NR-velocity values and the CFD-velocity values is 0.45 mm/s (at 52 s) while the average of the absolute differences is 0.083 mm/s (17.18% average relative difference). Regarding the “Bottom” case, the highest absolute difference between the NR-velocity values and the CFD-velocity values is 0.38 mm/s (at 52 s) while the average of the absolute differences is 0.082 mm/s (17.28% average relative difference).
The difference between the NR results and CFD results is influenced by the accuracy of
- The rheological measurement results used for viscosity model development;
- The developed viscosity model (and the regression of the model parameters);
- The NR measurement technique;
- The installed pressure gauges;
- The processing and evaluation of the raw NR images;
- The CFD calculation with the applied numerical mesh, models, methods, and the selected time-step size.
5. Conclusions
A real, small-sized visco-damper geometry has been used to investigate the filling process and to quantify the impact of the bearing cut-off position on the filling process length. A non-destructive material testing method with a neutron beam has been selected for this purpose and a modified test damper, made of AlMgSi0.5, was used during the thermal neutron dynamic radiography measurements to track the silicone oil’s front propagation in the damper gap. The measurement results have been also used to validate a transient CFD model from viscous and fluid dynamic aspects for calculating the filling process of visco-dampers in a more accurate and effective way.
It turned out from the measurements that the bearing cut-off position has a detectable impact on the length of the filling process of a visco-damper. The visual comparison of the spatial oil spread formation and oil layer patterns of NR results and CFD results show a good agreement for both the “Top” case and “Bottom” cases. In terms of propagation time, the highest relative difference between the NR results and the CFD results was found to be 3.5%. As regards oil front velocity, the highest average of the relative differences between the NR-velocity values and the CFD-velocity values was found to be 17.3%. Considering the comparison outcome of the measurement and the simulation, the newly validated three-dimensional, transient, non-Newtonian, multiphase, coupled fluid dynamic and heat transfer CFD model compiled in Ansys Fluent 2021 R2 software can be effectively used for further analyses of the filling process of visco-dampers with arbitrary damper-gap geometry.
The developed filling model is able to calculate the filling process of visco-dampers both from fluid dynamic and thermal aspects. However, thermal measurements are required as a next step of this research to prove the model’s thermal accuracy and reliability. After the thermal validation of the CFD model, the filling process must be numerically analysed under manufacturing conditions (no outlet hole, the pressure of the damper-gap is initialized for vacuum, constant oil inlet pressure, different direction of gravity) and the maximal allowable temperature rise in the silicone oil must be determined at different oil inlet temperatures and inlet pressures to avoid the permanent thermal degradation of the oil during the filling process due to self-heating. The presented transient filling model is also suitable for optimizing the filling process by modifying the geometry of the inlet hole or the oil-guiding groove.
Author Contributions
Conceptualization, M.V., Á.V. and Z.K.; methodology, M.V. and Z.K.; software, M.V. and Z.K.; validation, M.V.; formal analysis, M.V. and Z.K.; investigation, M.V., Á.V. and Z.K.; resources, Z.K. and L.S.; data curation, Z.K.; writing—original draft preparation, M.V.; writing—review & editing, Á.V., Z.K. and L.S.; visualization, M.V. and Z.K.; supervision, Á.V., Z.K. and L.S.; project administration, Á.V. and L.S.; funding acquisition, Á.V. All authors have read and agreed to the published version of the manuscript.
Funding
This research was funded by the Pro Progressio Foundation for University Education and Research and by the Knorr-Bremse R&D Center Budapest.
Data Availability Statement
The data presented in this study are available on request from the corresponding author. The data are not publicly available due to the information and data protection agreement of the funding corporation.
Acknowledgments
The authors would like to express their thanks to all members of the Nuclear Analysis and Radiography Department at the Centre for Energy Research for providing us the opportunity to carry out the measurements and for their continuous technical help. Special thanks to Knorr-Bremse CVS for its technical and financial support.
Conflicts of Interest
The authors declare no conflict of interest. The funders had no role in the design of the study; in the collection, analyses, or interpretation of data; in the writing of the manuscript; or in the decision to publish the results.
References
- Homik, W. Diagnostics, Maintenance and Regeneration of Torsional Vibration Dampers for Crankshafts of Ship Diesel Engines. Pol. Marit. Res. 2010, 17, 62–68. [Google Scholar] [CrossRef]
- Abouobaia, E.; Bhat, R.; Sedaghati, R. Hybrid Torsional Vibration Damper Incorporating Conventional Centrifugal Pendulum Vibration Absorber and Magnetorheological Damper. J. Intell. Mater. Syst. Struct. 2015, 1, 1–13. [Google Scholar] [CrossRef]
- Research and Markets. Global Reciprocating Engines Market Size, Market Share, Application Analysis, Regional Outlook, Growth Trends, Key Players, Competitive Strategies and Forecasts, 2018 to 2026; Research and Markets: Dublin, Ireland, 2018; Rep. ID: 4564310; Available online: https://www.researchandmarkets.com/reports/4564310/global-reciprocating-engines-market-size-market (accessed on 16 February 2023).
- Absolute Reports. Global Torsional Vibration Damper Market 2019 by Manufacturers, Regions, Type and Application, Forecast to 2024; Absolute Reports: Pune, India, 2019; Rep. SKU ID: GIR-13851137; Available online: https://www.absolutereports.com/global-torsional-vibration-damper-market-13851137 (accessed on 16 February 2023).
- Mendes, A.S.; Meirelles, P.S.; Zampieri, D.E. Analysis of Torsional Vibration in Internal Combustion Engines: Modelling and Experimental Validation. Proc. Inst. Mech. Eng. Part K J. Multi-Body Dyn. 2008, 222, 155–178. [Google Scholar] [CrossRef]
- Wojnar, G.; Homik, W. Reduction of the Amplitudes of Selected Components of the Frequency Spectrum of Momentary Velocity of the Crankshaft of the Internal Combustion Engine Piston Through the Use of Torsional Vibration Dampers. Vibroengineering Procedia 2015, 6, 83–86. Available online: https://www.extrica.com/article/16536 (accessed on 16 February 2023).
- Chiliński, B.; Zawisza, M. Analysis of Bending and Angular Vibration of the Crankshaft with a Torsional Vibrations Damper. J. Vibroengineering 2016, 18, 5353–5363. [Google Scholar] [CrossRef]
- Homik, W.; Mazurkow, A.; Woś, P. Application of a Thermo-Hydrodynamic Model of a Viscous Torsional Vibration Damper to Determining Its Operating Temperature in a Steady State. Materials 2021, 14, 5234. [Google Scholar] [CrossRef] [PubMed]
- Wang, M.; Zhou, R.; Xu, X. The Engine Silicone-Oil Damper Matching Calculation Method Based on the Heat Balance. Res. J. Appl. Sci. Eng. Technol. 2012, 4, 2773–2777. Available online: https://maxwellsci.com/print/rjaset/v4-2773-2777.pdf (accessed on 16 February 2023).
- Venczel, M.; Steidl, M.; Veress, Á. Design Modifications and Thermal Analysis of Visco-Dampers for Extending Silicone Oil Durability. Acta Polytech. Hung. 2021, 18, 27–46. [Google Scholar] [CrossRef]
- Píštěk, V.; Gorbunov, M.; Kučera, P.; Nozhenko, O. Comparison of Torsional Vibration Dampers in Terms of the Dissipated Power Amount. Vibroengineering Procedia 2018, 18, 68–72. [Google Scholar] [CrossRef]
- Navale, V.R.; Dhamejani, C.L. Analysis of Damping Coefficient for Viscous Damper. Int. J. Innov. Eng. Res. Technol. 2015, 2, 1–8. Available online: https://repo.ijiert.org/index.php/ijiert/article/view/516 (accessed on 16 February 2023).
- Kodama, T.; Honda, Y. A Study on the Modeling and Dynamic Characteristics of the Viscous Damper Silicone Fluid Using Vibration Control of Engine Crankshaft Systems. Int. J. Mech. Eng. Robot. Res. 2018, 7, 273–278. [Google Scholar] [CrossRef]
- Wacker-Chemie. Wacker Silicone Fluids AK. Product Brochure; Wacker-Chemie GmbH: Munich, Germany, 2002; Available online: https://www.behlke.com/pdf/wacker_silicone_oil.pdf (accessed on 16 February 2023).
- Anderson, I.S.; McGreevy, R.L.; Bilheux, H.Z. Neutron Imaging and Applications; Springer: New York, NY, USA, 2009. [Google Scholar]
- Chankow, N. Neutron Radiography. In Nondestructive Testing Methods and New Applications; Omar, M., Ed.; InTech: Rijeka, Croatia, 2012; Available online: http://www.intechopen.com/books/nondestructive-testing-methods-and-new-applications/neutron-radiography (accessed on 16 February 2023).
- Budapest Neutron Centre–60 Years of Research & Innovation. Available online: https://www.bnc.hu/BRR (accessed on 16 February 2023).
- Activation Calculator. Available online: https://webapps.frm2.tum.de/activation/ (accessed on 16 February 2023).
- Audi, G.; Kondev, F.G.; Wang, M.; Huang, W.J.; Naimi, S. The NUBASE2016 Evaluation of Nuclear Properties. Chin. Phys. C 2017, 41, 030001. [Google Scholar] [CrossRef]
- Kondev, F.G.; Wang, M.; Huang, W.J.; Naimi, S.; Audi, G. The NUBASE2020 Evaluation of Nuclear Physics Properties. Chin. Phys. C 2021, 45, 030001. [Google Scholar] [CrossRef]
- Schindelin, J.; Arganda-Carreras, I.; Frise, E.; Kaynig, V.; Longair, M.; Pietzsch, T.; Preibisch, S.; Rueden, C.; Saalfeld, S.; Schmid, B.; et al. Fiji: An Open-Source Platform for Biological-Image Analysis. Nat. Methods 2012, 9, 676–682. [Google Scholar] [CrossRef] [PubMed]
- Spodniak, M.; Főző, L.; Andoga, R.; Semrád, K.; Beneda, K. Methodology for the Water Injection System Design Based on Numerical Models. Acta Polytech. Hung. 2021, 18, 47–62. [Google Scholar] [CrossRef]
- Beneda, K. Numerical Simulation of MEMS-based Blade Load Distribution Control in Centrifugal Compressor Surge Suppression. AIP Conf. Proc. 2012, 1493, 116. [Google Scholar] [CrossRef]
- ESSS. Dinámica de Fluidos Computacional: ¿Que es? Available online: https://www.esss.co/es/blog/dinamica-de-fluidos-computacional-que-es/ (accessed on 15 March 2023).
- Thermopedia, Volume of Fluid Method. Available online: http://thermopedia.com/content/10120/ (accessed on 15 March 2023).
- Robert Bosch GmbH. Bosch Automotive Handbook, 11th ed.; Wiley: Berlin, Germany, 2022; Available online: https://www.amazon.com/Automotive-Handbook-Robert-Bosch-GmbH-dp-1119911907/dp/1119911907 (accessed on 16 February 2023).
- Wang, X.D.; Peng, X.F.; Wang, B.X. Effect of Solid Surface Properties on Dynamic Contact Angles. Heat Transf.-Asian Res. 2006, 351, 1–12. [Google Scholar] [CrossRef]
- Venczel, M.; Bognár, G.; Veress, Á. Temperature-Dependent Viscosity Model for Silicone Oil and Its Application in Viscous Dampers. Processes 2021, 9, 331. [Google Scholar] [CrossRef]
Figure 1.
Structure of a visco-damper. (a) Section view; (b) Detail view with the main components.

Figure 2.
The constitutional formula of PDMS.

Figure 3.
The attenuation contrast image of an object irradiated with a neutron beam.

Figure 4.
Mass attenuation coefficients of elements on a logarithmic scale for different radiations.
Figure 4.
Mass attenuation coefficients of elements on a logarithmic scale for different radiations.

Figure 5.
CAD model of the test damper. (a) Section view; (b) Detail view at the inlet hole.

Figure 6.
The layout of the neutron imaging setup at the RAD station of the Budapest Neutron Centre.
Figure 6.
The layout of the neutron imaging setup at the RAD station of the Budapest Neutron Centre.

Figure 7.
Details of the measurement setup. (a) View of the pressure gauges connected to a personal computer; (b) Test damper in a vertical measurement position, in front of the neutron imaging detector.
Figure 7.
Details of the measurement setup. (a) View of the pressure gauges connected to a personal computer; (b) Test damper in a vertical measurement position, in front of the neutron imaging detector.

Figure 8.
Definition of the investigated assembly cases. (a) Bearing cut-off in the top position; (b) Bearing cut-off in the bottom position.
Figure 8.
Definition of the investigated assembly cases. (a) Bearing cut-off in the top position; (b) Bearing cut-off in the bottom position.

Figure 9.
Generating the flow field from the test damper ’s CAD model in section view.

Figure 10.
Flow field geometry in section view.

Figure 11.
Supply pressure and distant inlet pressure profiles of a “Top” case measurement.

Figure 12.
Supply pressure and distant inlet pressure profiles of a “Bottom” case measurement.

Figure 13.
“Dry” images of the filling process. (a) Initial NR image of “Top” case; (b) Initial NR image of “Bottom” case.
Figure 13.
“Dry” images of the filling process. (a) Initial NR image of “Top” case; (b) Initial NR image of “Bottom” case.

Figure 14.
NR images of the filling process for the “Top” case. (a) NR image at half time of the filling process; (b) NR image at touching time of the filling process.
Figure 14.
NR images of the filling process for the “Top” case. (a) NR image at half time of the filling process; (b) NR image at touching time of the filling process.

Figure 15.
NR images of the filling process for the “Bottom” case. (a) NR image at half time of the filling process; (b) NR image at touching time of the filling process.
Figure 15.
NR images of the filling process for the “Bottom” case. (a) NR image at half time of the filling process; (b) NR image at touching time of the filling process.

Figure 16.
CFD result images of the filling process for “Top” case. (a) CFD result image at half time of the filling process; (b) CFD result image at touching time of the filling process.
Figure 16.
CFD result images of the filling process for “Top” case. (a) CFD result image at half time of the filling process; (b) CFD result image at touching time of the filling process.

Figure 17.
CFD images of the filling process for the “Bottom” case. (a) CFD result image at half time of the filling process; (b) CFD result image at touching time of the filling process.
Figure 17.
CFD images of the filling process for the “Bottom” case. (a) CFD result image at half time of the filling process; (b) CFD result image at touching time of the filling process.

Figure 18.
Oil front velocity comparison for “Top” case.

Figure 19.
Oil front velocity comparison for “Bottom” case.


Table 1.
Results of the X-ray fluorescence spectrometric analysis on a real visco-damper.
| Housing | Inertia-Ring | Cover | ||||
|---|---|---|---|---|---|---|
| Element | Mass Fraction [%] | Uncertainty [%] | Mass Fraction [%] | Uncertainty [%] | Mass Fraction [%] | Uncertainty [%] |
| Fe | 97 | ±0.2 | 96.9 | ±0.2 | 71.8 | ±0.2 |
| Mn | 0.68 | ±0.02 | 0.71 | ±0.02 | 1.21 | ±0.04 |
| Cr | 0.061 | ±0.007 | 0.072 | ±0.007 | 17.9 | ±0.1 |
| Ni | <0.016 | - | <0.016 | - | 8.23 | ±0.09 |
| Cu | 0.046 | ±0.007 | 0.041 | ±0.007 | 0.3 | ±0.02 |
| Pb | 0.063 | ±0.008 | 0.063 | ±0.008 | <0.02 | - |
| V | <0.05 | - | <0.05 | - | 0.08 | ±0.01 |
| Co | <0.17 | - | <0.17 | - | <0.14 | - |
| Mo | <0.005 | - | <0.005 | - | 0.119 | ±0.003 |
| Bi | 0.07 | ±0.005 | 0.069 | ±0.005 | 0.021 | ±0.002 |
Table 2.
Material properties of AK 1,000,000 STAB silicone oil used for measurements.
| Material Property | Value | Unit |
|---|---|---|
| Density at 25 °C | 970 | kg/m3 |
| Dynamic viscosity at 25 °C | 1000 | Pas |
| Surface tension at 25 °C | 0.0215 | N/m |
| Thermal conductivity | 0.15 | W/m/K |
| Specific heat capacity | 1550 | J/kg/K |
| Coefficient of thermal expansion at 0–150 °C | 0.00092 | 1/°C |
| Flash point | >320 | °C |
| Self-ignition temperature | 500 | °C |
| Pour point | −40 | °C |
| Refractive index at 25 °C and 100 Hz | 2.76 | - |
| Volatility | <1 | % |
Disclaimer/Publisher’s Note: The statements, opinions and data contained in all publications are solely those of the individual author(s) and contributor(s) and not of MDPI and/or the editor(s). MDPI and/or the editor(s) disclaim responsibility for any injury to people or property resulting from any ideas, methods, instructions or products referred to in the content. |
© 2023 by the authors. Licensee MDPI, Basel, Switzerland. This article is an open access article distributed under the terms and conditions of the Creative Commons Attribution (CC BY) license (https://creativecommons.org/licenses/by/4.0/).
Share and Cite
MDPI and ACS Style
Venczel, M.; Veress, Á.; Szentmiklósi, L.; Kis, Z. Dynamic Thermal Neutron Radiography for Filling Process Analysis and CFD Model Validation of Visco-Dampers. Machines 2023, 11, 485. https://doi.org/10.3390/machines11040485
AMA Style
Venczel M, Veress Á, Szentmiklósi L, Kis Z. Dynamic Thermal Neutron Radiography for Filling Process Analysis and CFD Model Validation of Visco-Dampers. Machines. 2023; 11(4):485. https://doi.org/10.3390/machines11040485
Chicago/Turabian StyleVenczel, Márk, Árpád Veress, László Szentmiklósi, and Zoltán Kis. 2023. "Dynamic Thermal Neutron Radiography for Filling Process Analysis and CFD Model Validation of Visco-Dampers" Machines 11, no. 4: 485. https://doi.org/10.3390/machines11040485
Note that from the first issue of 2016, this journal uses article numbers instead of page numbers. See further details here.