1. Introduction
Today, as machining industries rapidly grow, cutting oil contaminated by metal chip particles becomes an issue for production efficiency and the environment. The filters used in conventional cutting oil pumps are passive filtering equipment requiring periodic cleaning or replacement. Long-term use of a filter often leads to contamination or clogging, which makes the filter dysfunctional, and consequently, the performance of the pump degrades and its life is shortened. Therefore, an active filtration system should be developed to improve pump performance. Especially, the development of geometrical modeling designs of cyclone filters or separators is of great interest for its applications in automatic filtration and reduction of fluid loss. This study is to establish a CFD method to accurately simulate cyclone efficiency in removing dirty particles from medium-viscous cutting oil for recycling.
A cyclone is an active filtration device that uses centrifugal force to separate impurities from fluids. It is widely used in various industries such as central coolant filtration, steel rolling oil, wire drawing process, and semiconductor package sawing due to its advantages such as geometric simplicity, low cost, ease of operation, and high separation performance [
1,
2,
3]. As shown in
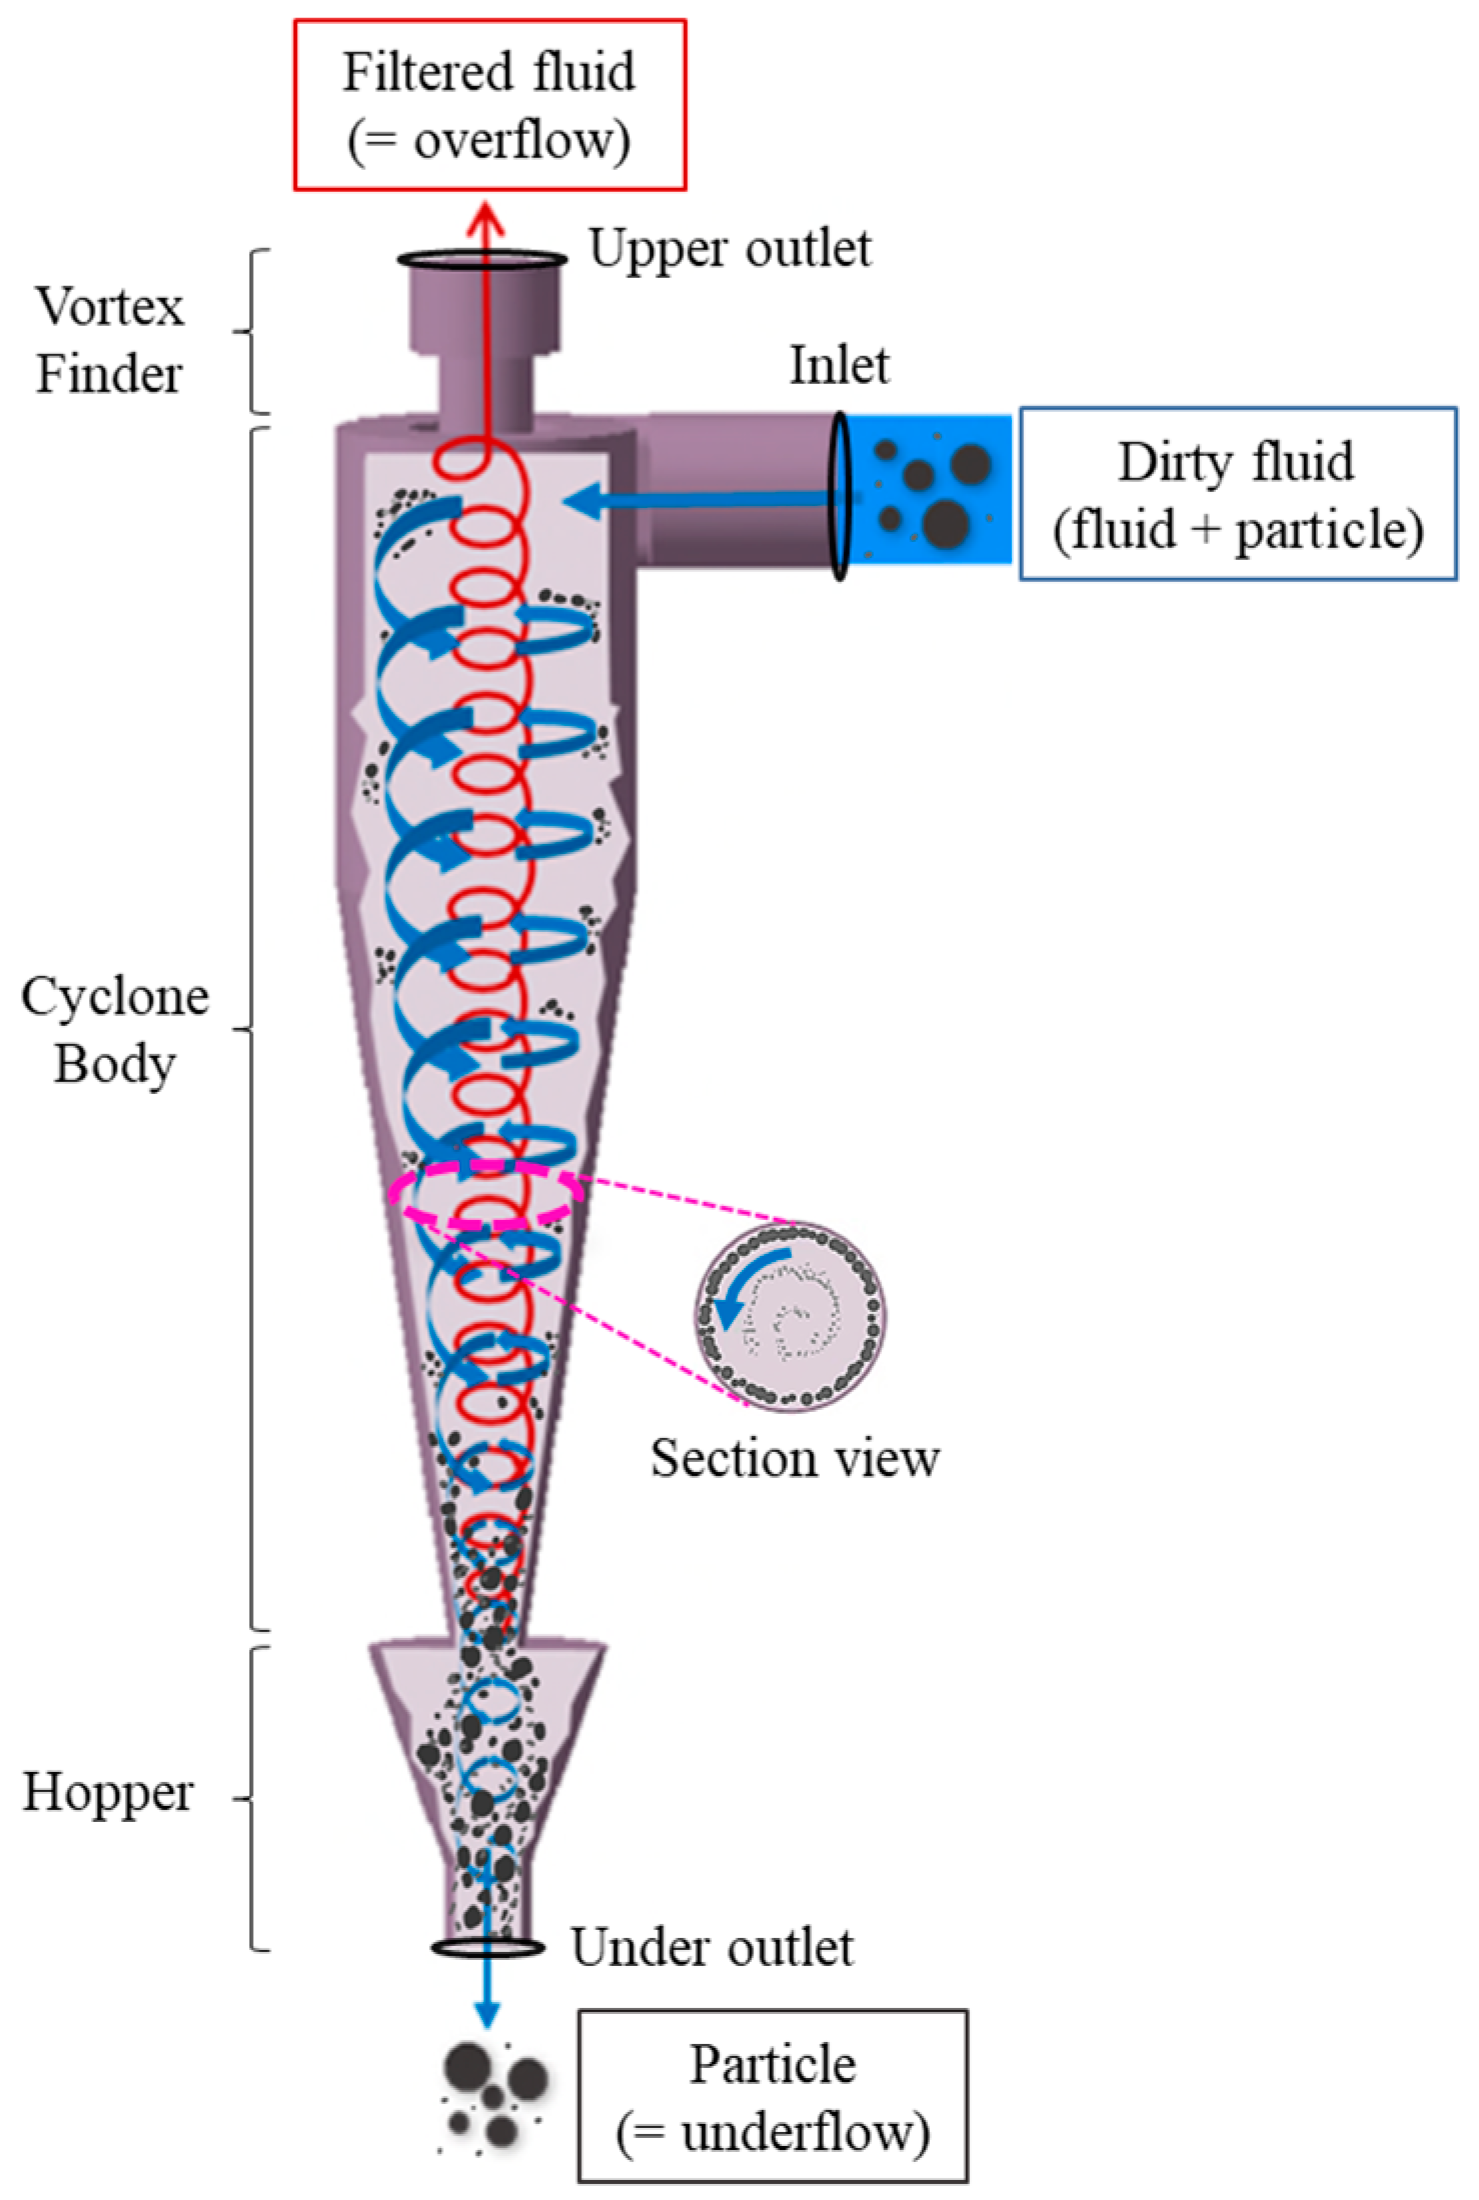
Figure 1, a centrifugal force is generated when dirty fluid containing particles and impurities flows into the inlet in a tangential direction. The injected fluid rotates spirally and flows downward due to the centrifugal force and gravity. The larger and denser particles are transported to the wall and collide with the inner walls. Particles that deviate from the fluid flow accumulate in the hopper, whereas the cleaned fluid rotates upward and is discharged through the upper outlet [
4].
Despite the simplicity of a cyclone, its internal vortex flow is highly complex due to the vortex [
5]. Therefore, detailed research is required to predict cyclone performance and flow patterns. Generally, numerical methods, such as CFD, are used to predict cyclone performance. This is advantageous since CFD is inexpensive and consumes less time compared to the experimental approach. Several studies have demonstrated the reliability of cyclone analysis using CFD [
6,
7,
8].
While much research has focused on gas–solid cyclones, in which a low-viscosity gas is injected [
9,
10], the performance characteristics of a liquid–solid cyclone injected with a low-viscosity liquid are being actively studied. Most liquid–solid cyclones use water as the liquid medium; numerical studies on cyclones using more viscous oils are limited [
11]. This study investigated the feasibility of a liquid–solid (using a medium-viscosity cutting oil and mostly metal particle impurities) cyclone design to replace the current pump filters for cutting oil.
Additionally, characterizing the cyclone performance depending on the shape is important due to changing the internal flow field [
12]. To improve the overall performance of the filter, research on the geometrical parameters, such as inlet and outlet shapes, length of the cone, and dimensions of the vortex finder, is being actively conducted [
13,
14,
15,
16]. However, research on the hopper shape is limited, as many studies conducted without hoppers matched the experimental results [
17,
18]. However, the actual particles collected in the hopper are influenced by the overflow, resulting in re-entrainment of the particles into the cyclone body during the operation. Since the re-entrainment of the particles was not considered, the particle separation efficiency may be overestimated compared to the actual value without a hopper. Hence, research involving hoppers should be conducted to improve the accuracy of the analysis [
19].
This study used CFD to analyze liquid–solid cyclones using medium-viscosity cutting oil and the numerical results were verified through a quantitative comparison with the experimental results. Three models were analyzed through a validated method to evaluate the influence of the change in shape on the particle separation efficiency while focusing on the velocity distribution.
2. Governing Equations of the Multiphase CFD Model
2.1. Navier Stokes Equation
The Navier–Stokes equation describes the behavior of a continuous phase. The change in volume of the cutting oil under pressure is not significant, hence it can be assumed to be an incompressible fluid with a constant density. For an incompressible fluid, the momentum equations are given in [
20].
where
is the instantaneous velocity of the fluid,
the average velocity of the fluid,
the fluctuating component of the velocity,
the position,
the average pressure of the fluid,
the fluid density,
the absolute dynamic viscosity of the fluid, and
the Reynolds stress tensor.
2.2. Turbulence Model
Since the precision of CFD results depends on the selected turbulence model, it is necessary to determine a suitable turbulence model [
21]. Complex internal flows with extreme turbulence and anisotropy characteristics occur in the cyclone separators. The Reynolds stress model (RSM) is considered to be a turbulence model suitable for cyclones with anisotropic characteristics, and its accuracy has been demonstrated [
22,
23]. In this model, the term
, as the Reynolds stress tensor, is calculated using the transport equation. Equation (4) describes the transport equation for the RSM.
where
is the turbulence diffusion,
the stress production,
the pressure strain,
the dissipation term, and
the rotation production.
2.3. Discrete Phase Model
The discrete phase model (DPM) was used to calculate the motion of the dispersed phase (particle) individually. DPM can be applied when the dispersed phase has a low volume fraction (10–12%). In this case, the dynamic interaction is assumed to be a one-way coupling, in which the fluid affects the particles and the particles do not significantly affect the physical properties of the fluid. Additionally, the influence of particle–particle collisions and particle collisions with the cyclone wall on the momentum transfer of the mixture was neglected. Equation (5) describes the momentum equation of the particles [
24].
where
is the velocity of the particles,
the drag force per unit mass,
the density of the particles,
the gravitational acceleration, and
corresponds to the additional forces acting on the particles.
3. Numerical Approach to Multiphase Flow Cyclone
3.1. Cyclone CFD Model
To investigate the effects of hopper length and diameter on cyclone performance, a step-by-step extension of the length and shape change was conducted. Model 1 is for CFD verification, and Model 2 and Model 3 added sockets for hopper length extension and shape change at the bottom of the hopper, respectively. The increased length in Model 2 was selected based on the aspect ratio used in a previous study [
19]. In contrast to previous studies where the diameter of the hopper was modified, this study presented Model 3 which abruptly reduced the hopper’s cross-sectional area to mimic the shape of an hourglass.
Figure 2 shows the numerical model used to study the performance characteristics according to the geometrical change of the cyclone hopper.
Table 1 presents the dimensions of each model.
3.2. Grid Generation
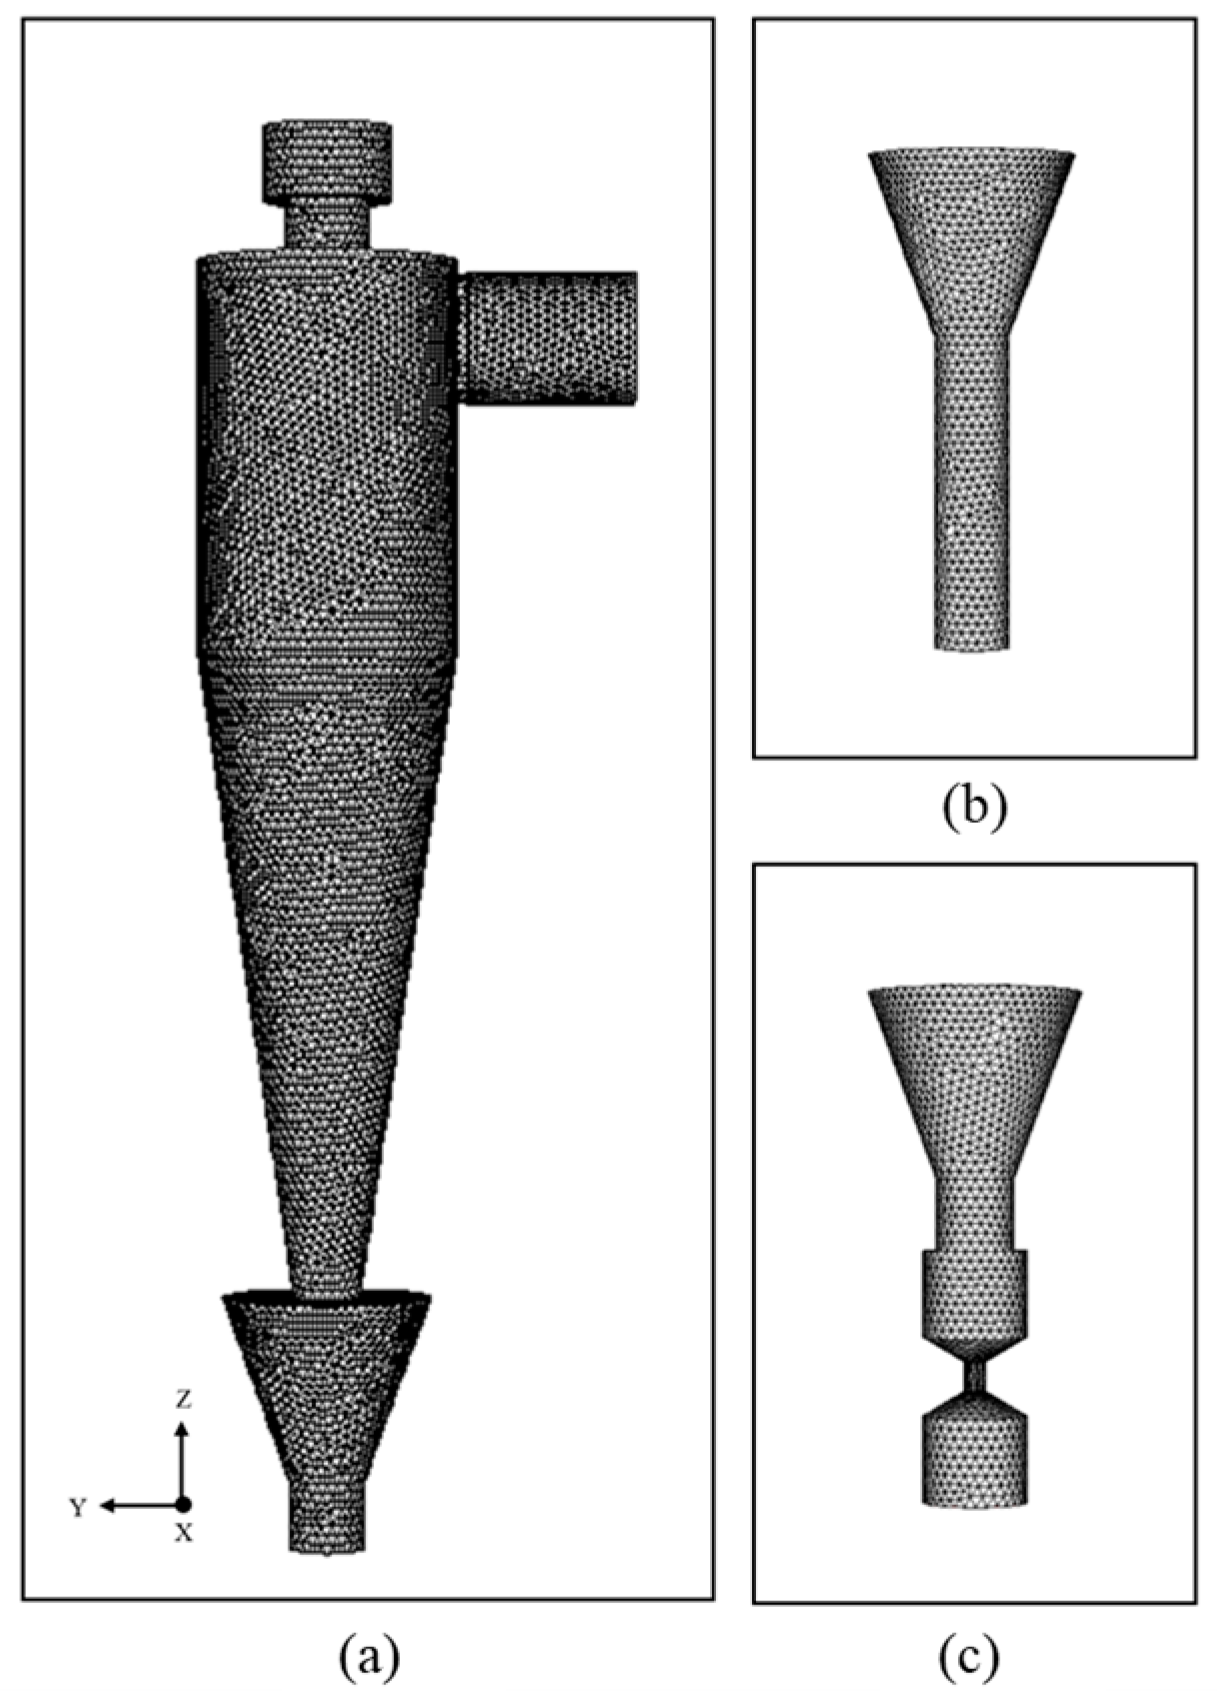
Figure 3 shows the mesh structure of the generated fluid domain. The analysis mesh consisted of tetrahedral cells [
25]; ANSYS meshing was used for the preprocessing of the mesh generation. ANSYS 19.2 Fluent (Ansys Korea, Seoul, Republic of Korea) was used as a solver. The generated mesh quality is an important factor that affects the accuracy and convergence of the analysis results. Here, the mesh quality was evaluated based on the aspect ratio (AR), orthogonal quality (OQ), and skewness (S). The aspect ratio represents the vertical and horizontal ratios between the elements; furthermore, an increase in this value indicates a decrease in quality. Skewness determines the mesh quality through the slope against the ideal element (equilateral triangle). It is evaluated in the range of zero to one, and the closer the value is to zero, the better the mesh quality. The orthogonal quality represents the extent of the closeness between the angle made by the adjacent element faces and the optimal angle. It is evaluated in the range of zero to one, and the closer it is to one, the more appropriate the mesh [
26].
Table 2 lists the number of elements and mesh quality used in each cyclone model. The mesh independence has been similarly verified in the previous study [
11]. Since the mesh quality used in the analysis is important, it can be confirmed that the same quality was applied to all the three models used in the analysis.
3.3. Boundary Conditions and Numerical Settings
In this study, liquids and solids were injected into the cyclone; hence, a multiphase model was used to calculate the flow of the two different phases. DPM was used to calculate the motion of the dispersed phase, while RSM was used to analyze the effect of turbulence in the cyclone’s internal flow. Here, the behavior of the particles is determined based on the fluid flow.
Cutting oil mixed with aluminum particles (density: 2719 kg/m
3) was used as the injection fluid (density: 998.2 kg/m
3, viscosity: 2.7 cSt). For the boundary conditions, the inlet velocity of the fluid was 2.15 m/s and the outlet pressure in the atmospheric conditions was 1 atm, which was applied equally to each model. The Reynolds number of the continuous phase used in the simulation was 5.9 × 10
4. To confirm the performance of the cyclone filter according to particle size, particles of various sizes (10, 15, 20, and 25 µm) were mixed and then injected. The volume fraction of the dispersed phase was considered to be 5% (case 1), and 0.5% (case 2) of the total. Case 1 verified the numerical method of the liquid–solid cyclones and Case 2 compared the cyclone performance according to the change in shape. As the wall roughness directly influences the filter efficiency, an equal value of 3.2 µm was used in the experiment.
Table 3 lists the boundary conditions used for the analysis.
The overall cyclone performance was analyzed using a steady-state CFD model. Pressure–velocity coupling was used as a discretization scheme; the semi-implicit method for pressure-linked equations (SIMPLE) was applied as an algorithm; pressure staggering option (PRESTO!) was chosen as the pressure interpolation scheme; and a first-order upwind scheme was selected for the RSM. Finally, others were used as second-order upwind schemes. The simulations were assumed to have reached convergence when the residuals were less than 10−3 and the main variables (inlet pressure and outlet flow rate) had a constant value for a period of time. While solving, as the first step, the initial conditions were considered only for the fluid flow. As the second step, particle tracking of various sizes was performed based on the fluid flow.
4. Results and Validation
4.1. Experiment Set Up
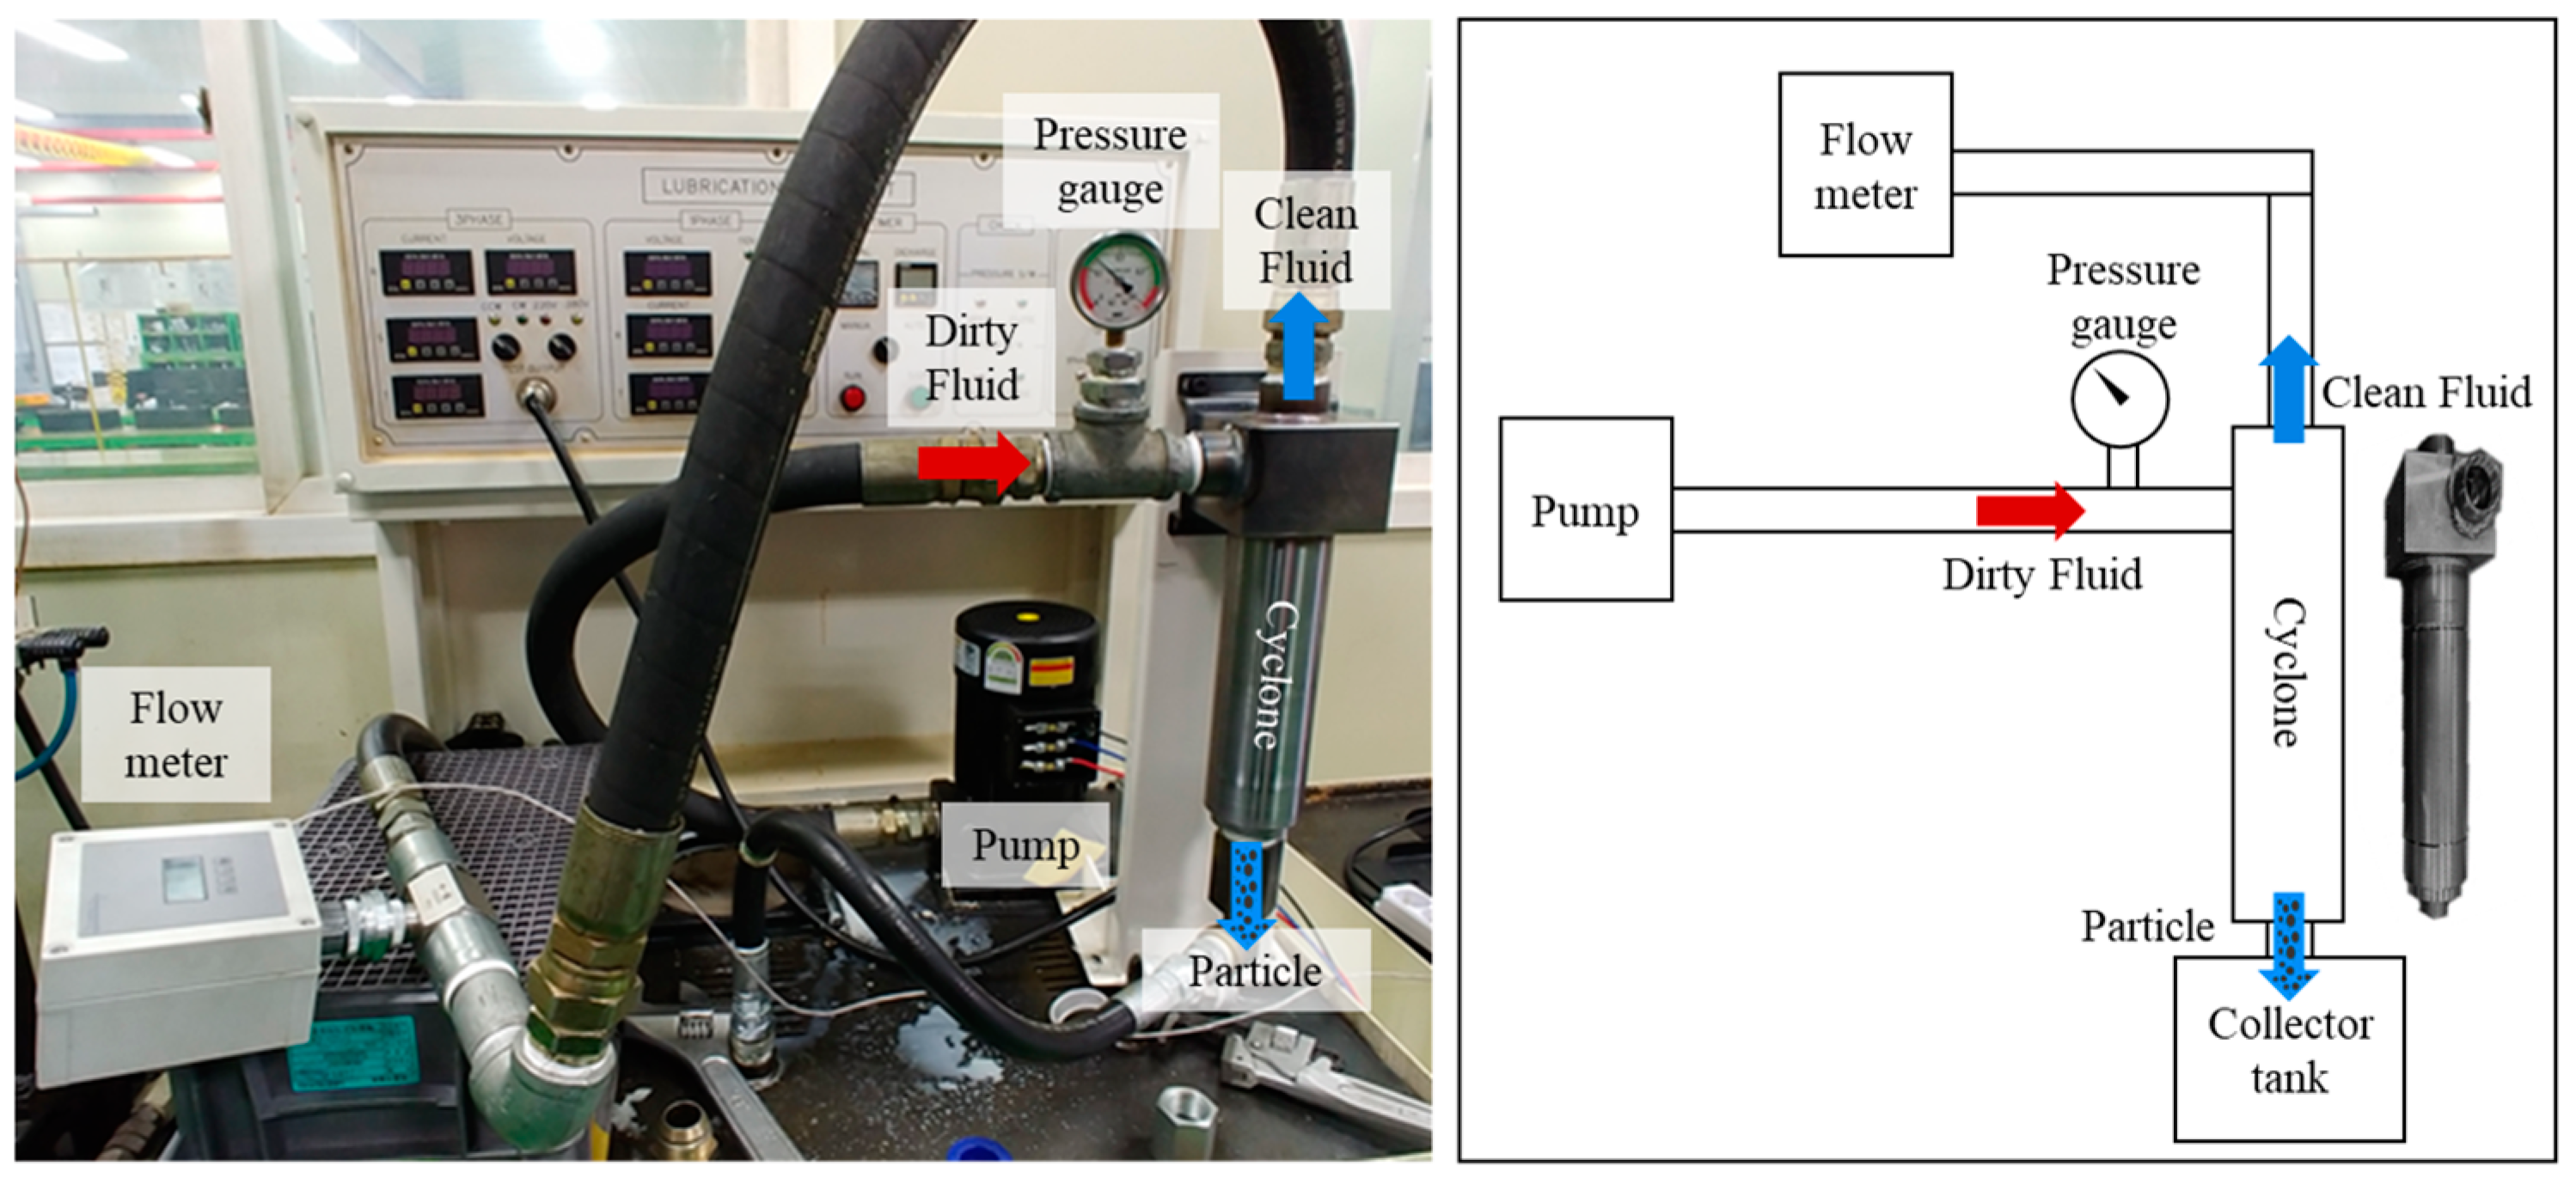
The CFD numerical method used in this study for liquid–solid cyclones was experimentally verified. The experimental equipment comprised a pump, pressure gauge, flow meter, cyclone body, and collector tank. The dirty fluid was supplied while maintaining a pump pressure of 1.8–1.9 bar and the flow rate discharged to the upper outlet for a certain time was measured. In this case, the accuracy of the numerical method was verified using the flow rate discharged from the upper outlet. Additionally, the particle separation efficiency of the experimental model was evaluated by measuring the number of particles contained per volume of discharged fluid, and the filter function of the other models that changed the geometry was predicted.
Figure 4 shows the composition of the experimental equipment.
4.2. Simulation Results and Discussion
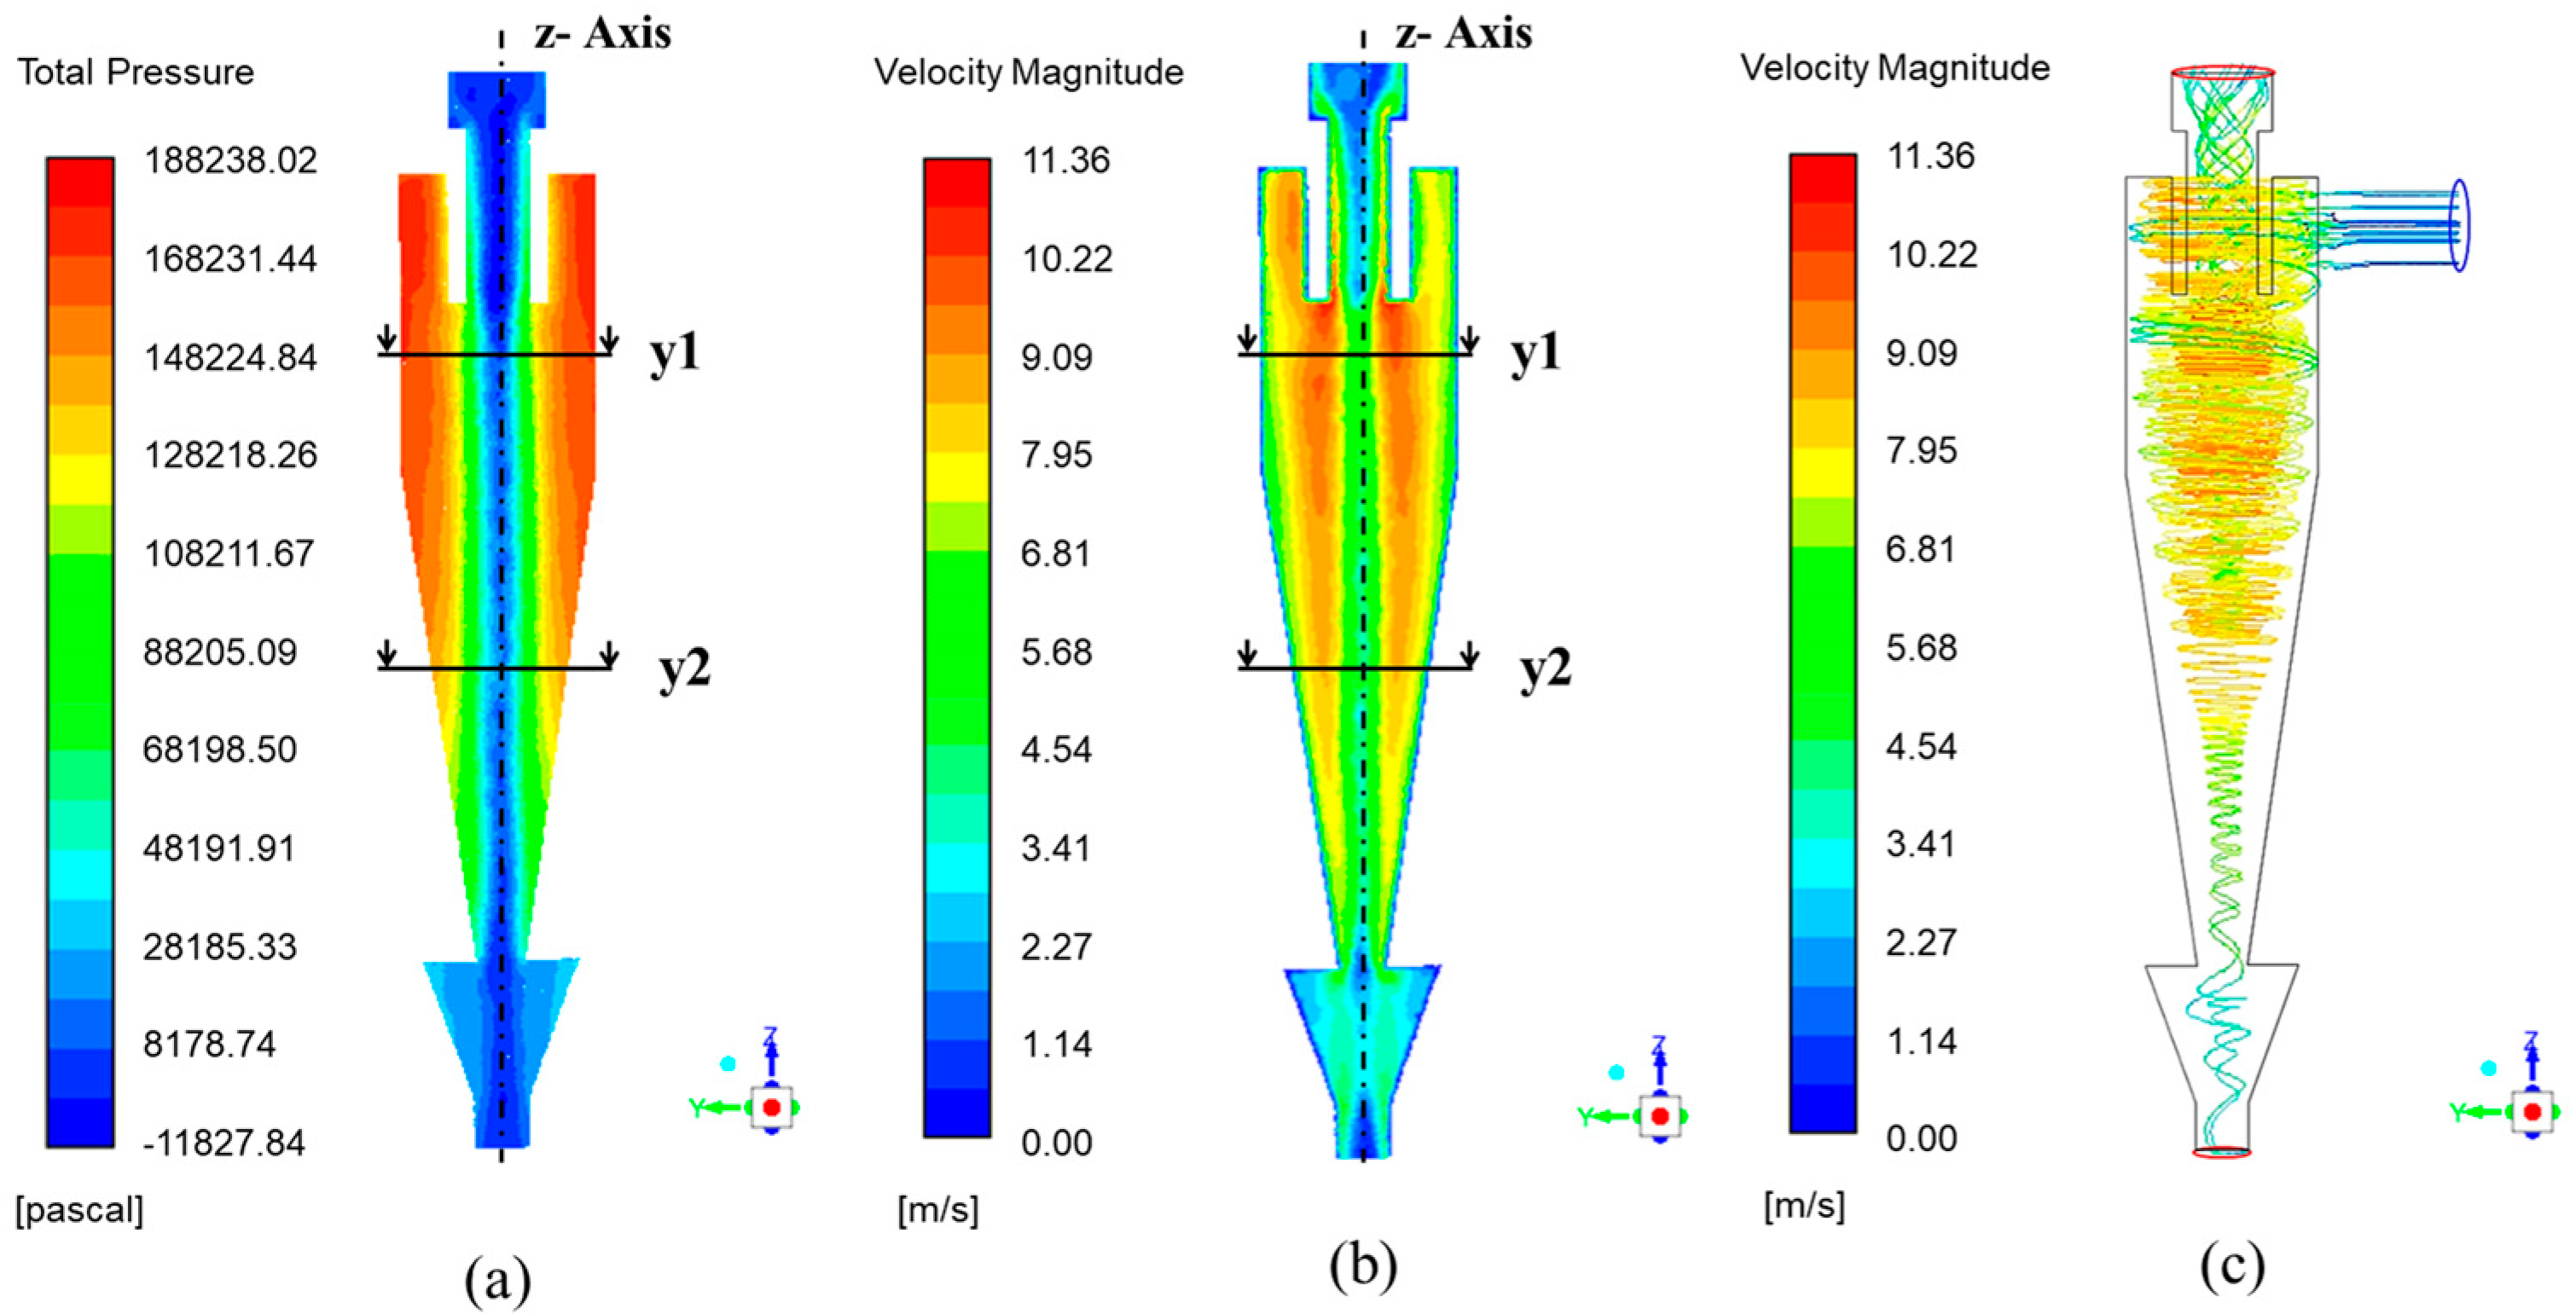
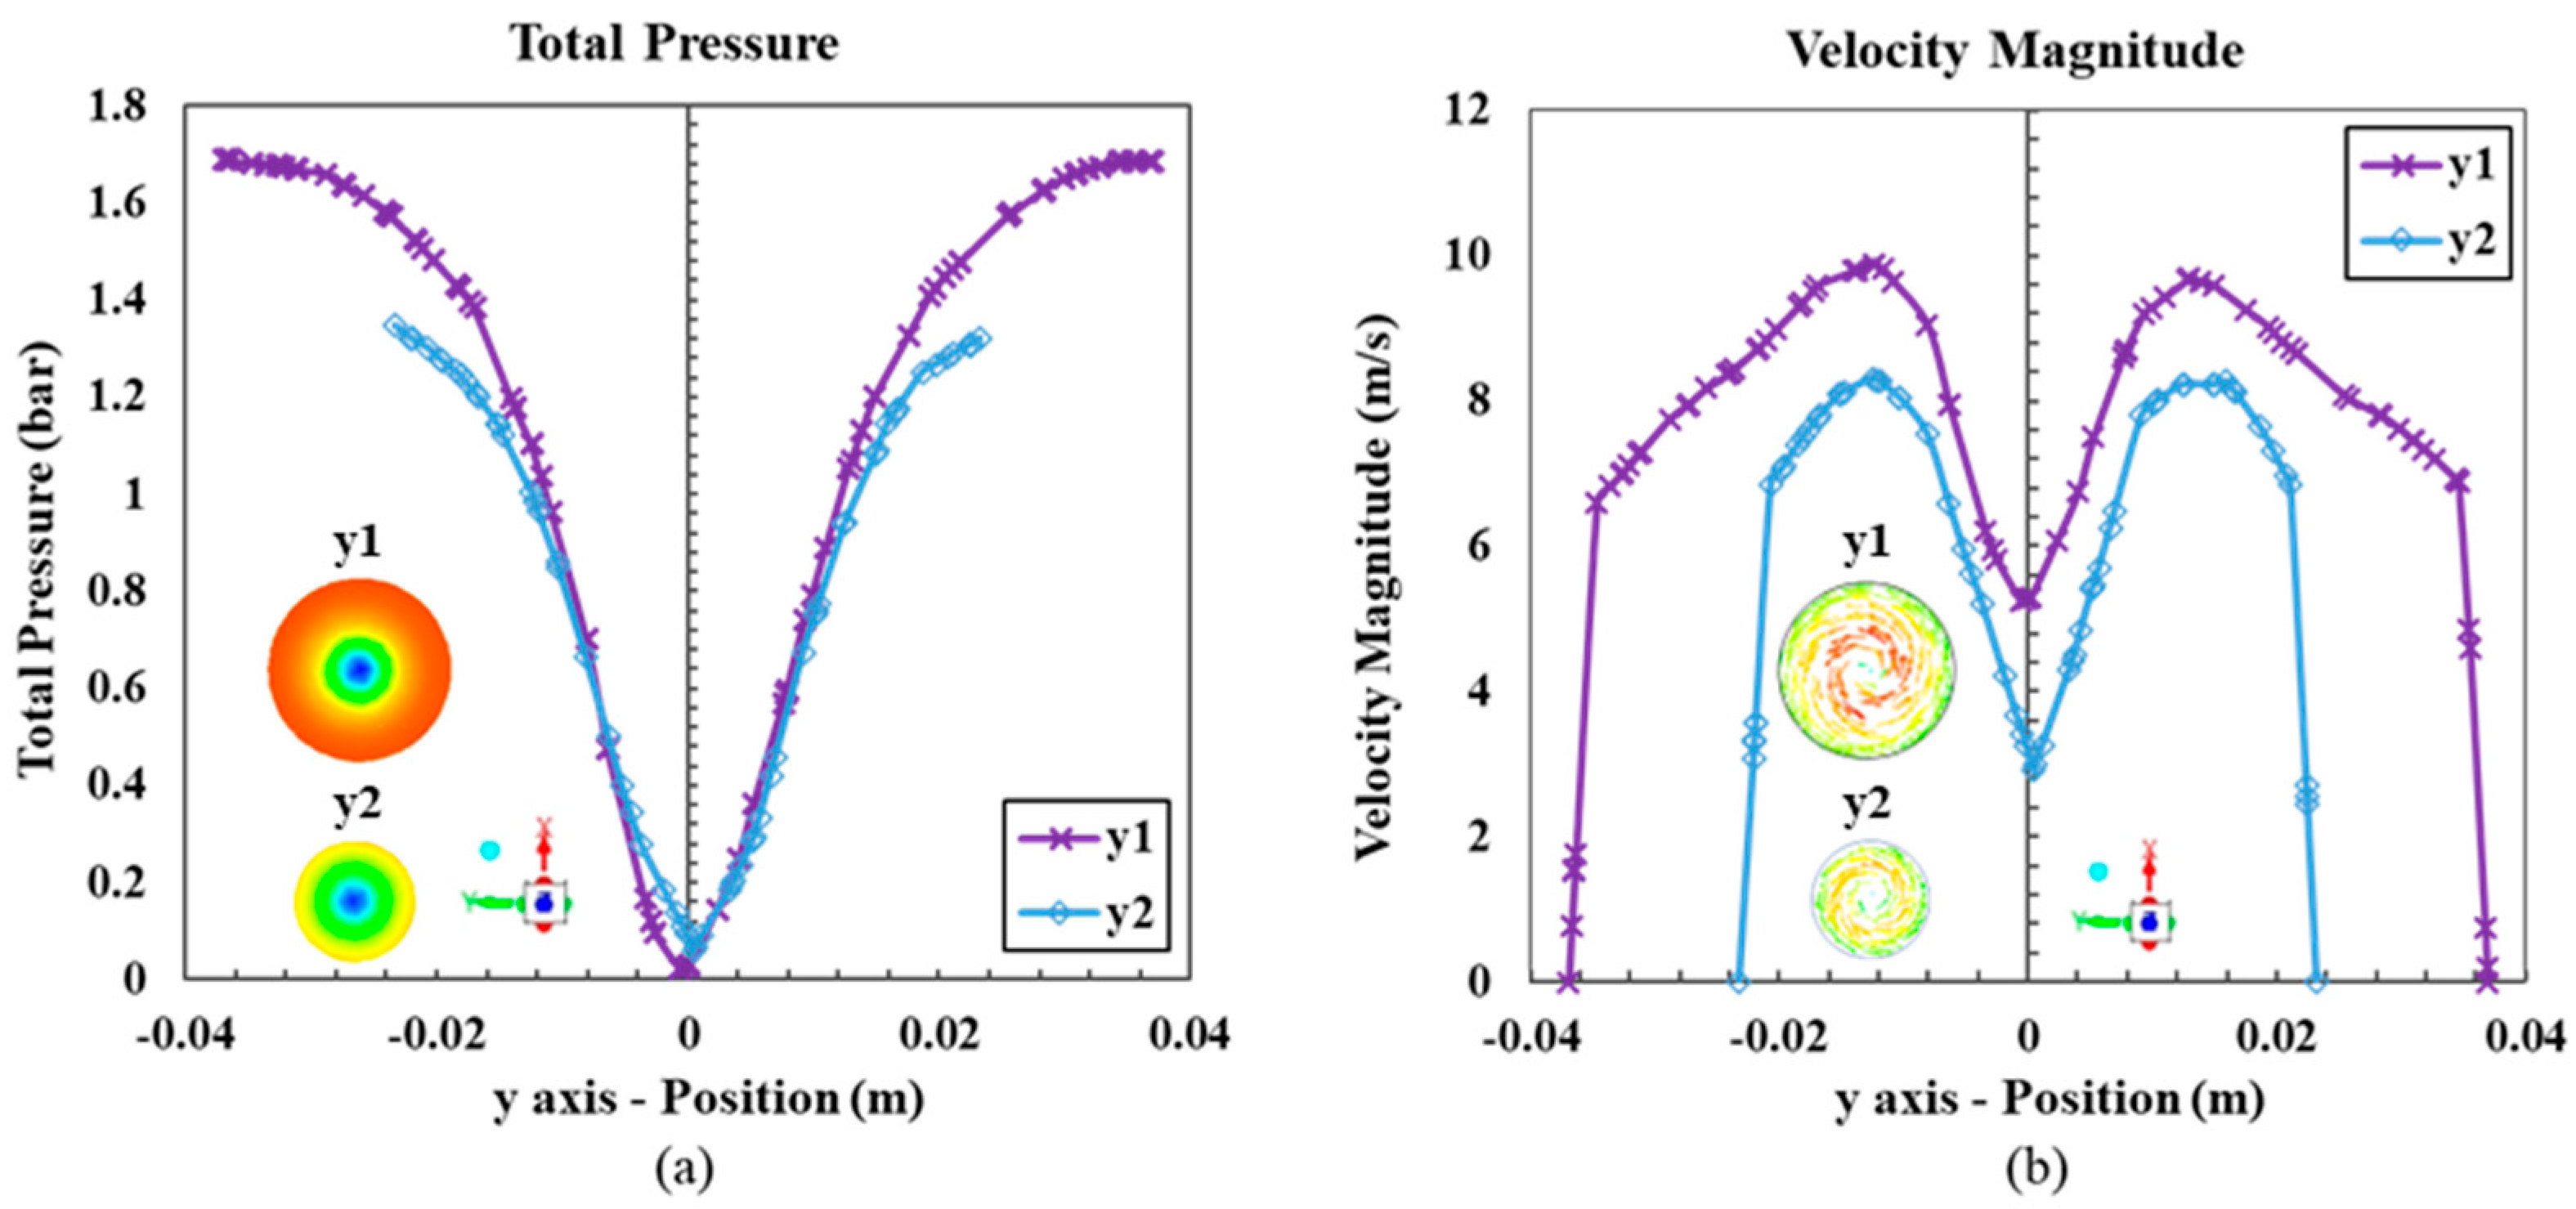
Figure 5 and
Figure 6 show the contour and profile of the total pressure and velocity distribution when 5% particles are injected, respectively. In
Figure 6, the profile represents the value of the cross-sectional centre of the cylinder (y1) and conical (y2) in the cyclone. The pressure had a minimum value at the centre, which increased in the radial direction. The velocity distribution represents the velocity values of the external and internal vortices, and the boundary between the two vortices is distinguished, where the velocity is maximized as shown in the cross-sectional profile in
Figure 6b. The maximum value of this velocity was caused by the rotation of the external and internal vortices in the same direction. This was confirmed to be similar to the pressure and velocity distributions of general cyclones [
27].
4.3. Comparison of CFD and Experiment
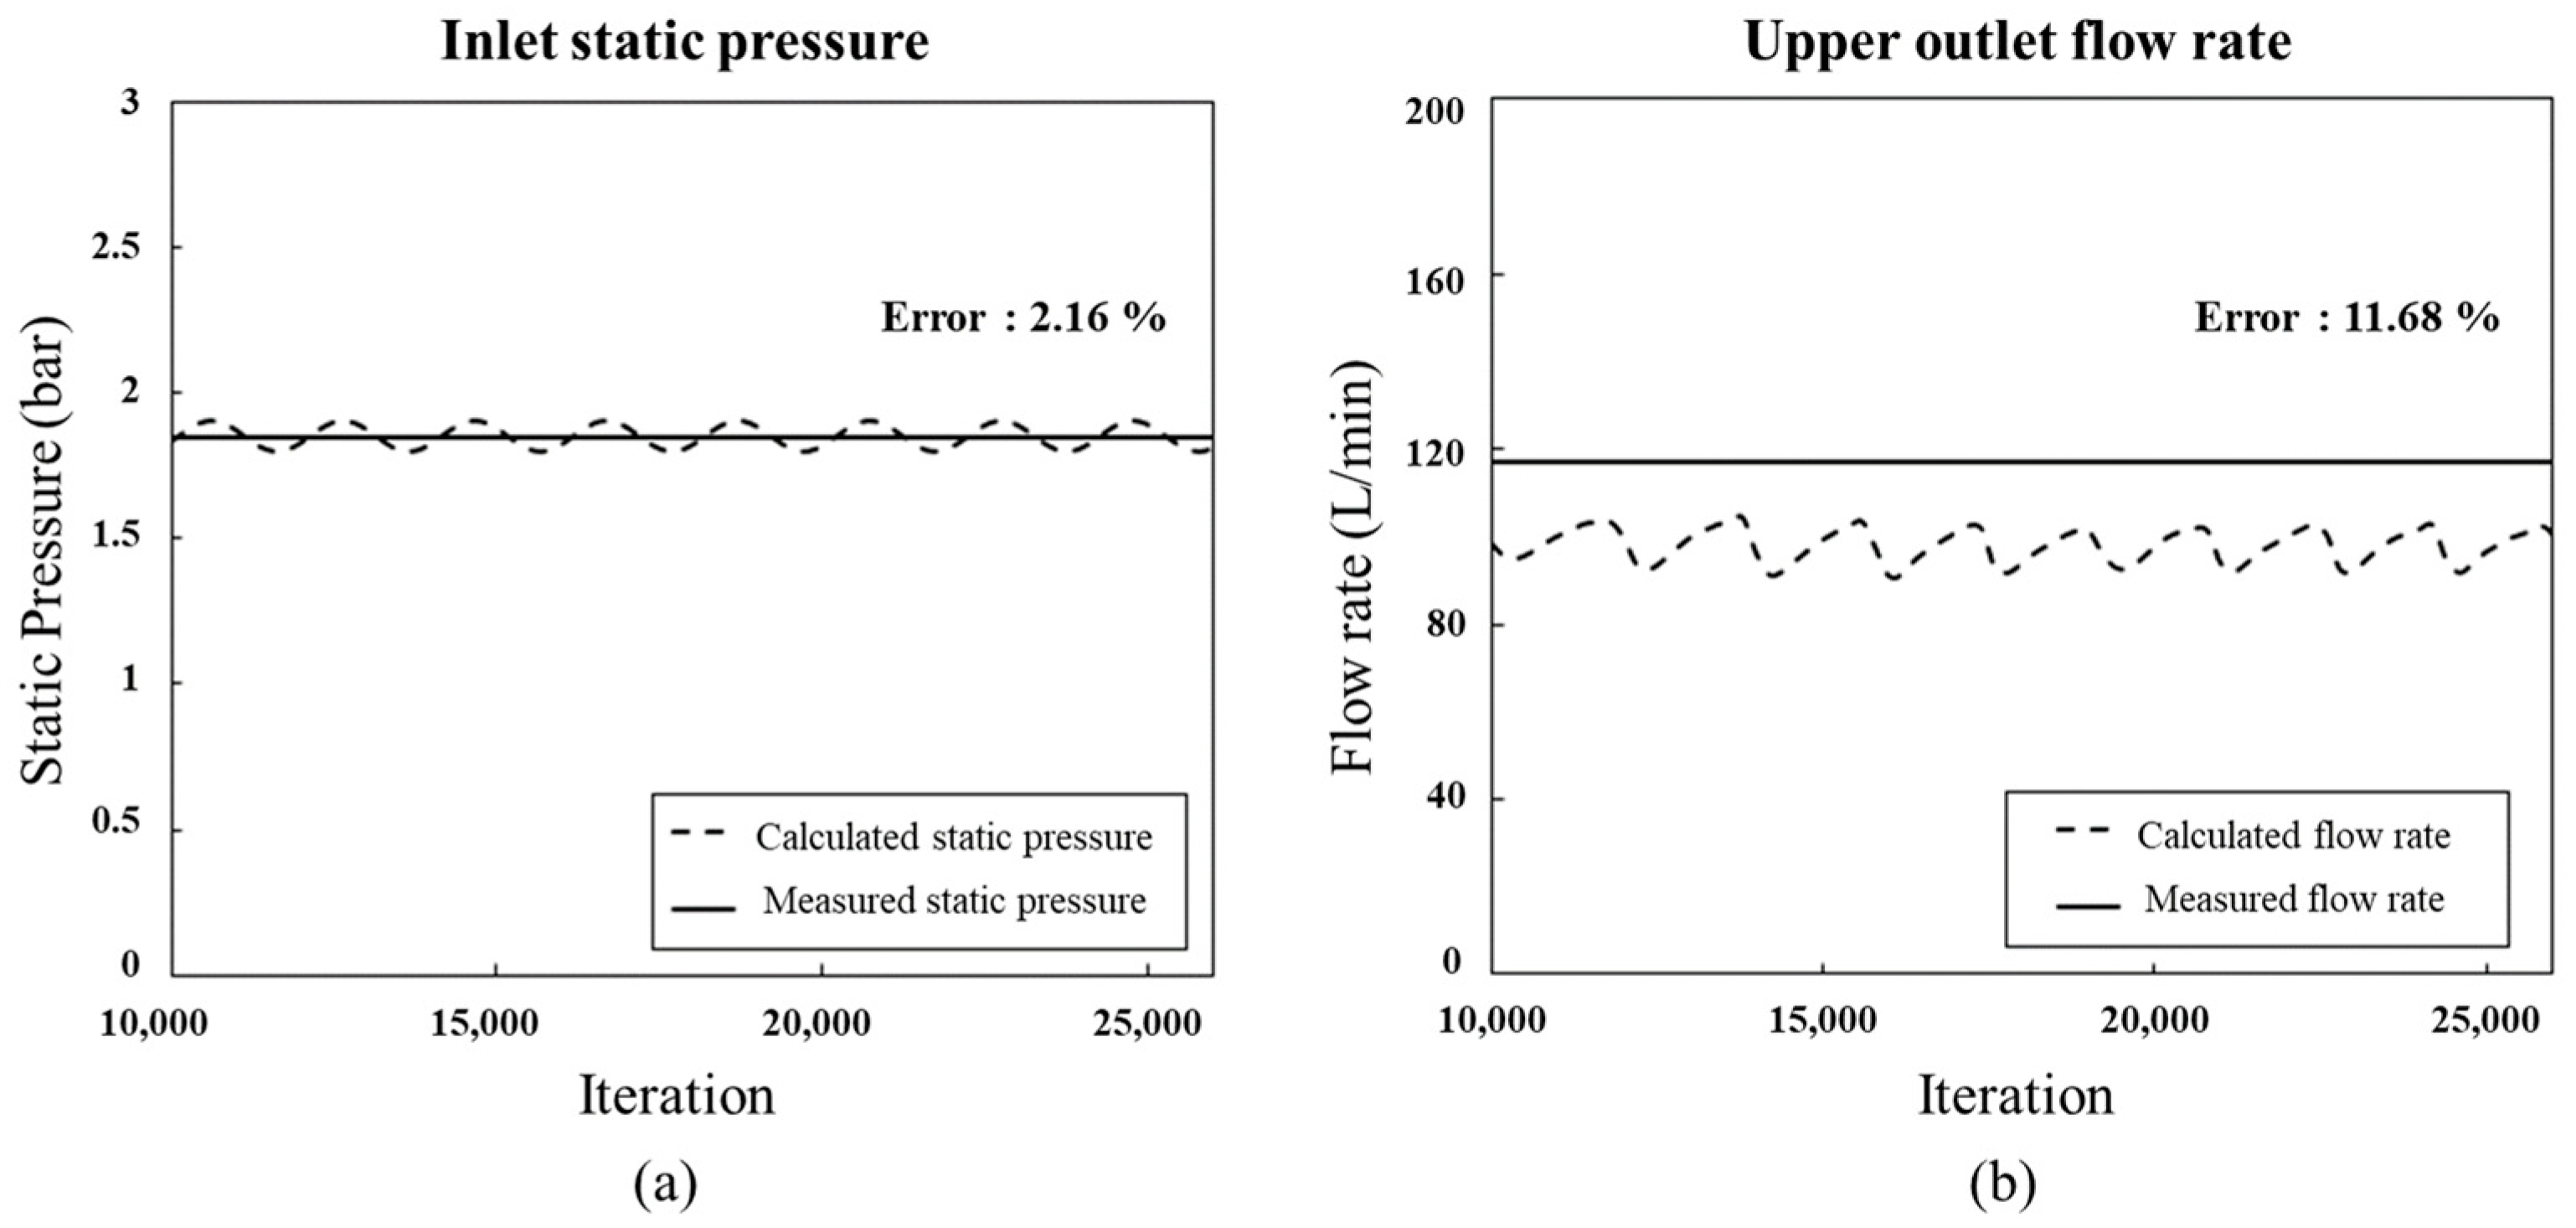
Figure 7 shows a comparison between the values measured in the experiment and those calculated by the CFD numerical method. The average inflow pressure was numerically found to be 1.89 bar, consistent with the experimental value. When a pressure of 1.89 bar is applied, a discharge flow rate of 98.27 L/min is generated at the upper outlet, which is a 12% deviation from the experimental value. The errors are thought to be the result of variables that were not considered in the analysis, such as the ratio, shape, and collision of particles in the experiment. Overall, the numerical and experimental results are fairly consistent, and the analysis method for the liquid–solid cyclone using medium-viscosity oil is verified.
Table 4 lists the average values obtained from the experiments and the CFD analysis.
5. Analysis of Comparative Study Results
The performance of the cyclone filter was determined by the tangential and axial velocities. The tangential velocity is the dominant velocity component in a cyclone and affects the centrifugal force required to separate particles from the fluid. As the tangential velocity increased, the centrifugal force also increased, thereby improving the separation efficiency. The axial velocity is important for the particles to move to the collection tank. As the axial velocity of the flow into the lower part of the hopper increased, the filter performance improved by preventing the re-entrainment of particles due to the internal vortex [
28].
5.1. Tangential Velocity
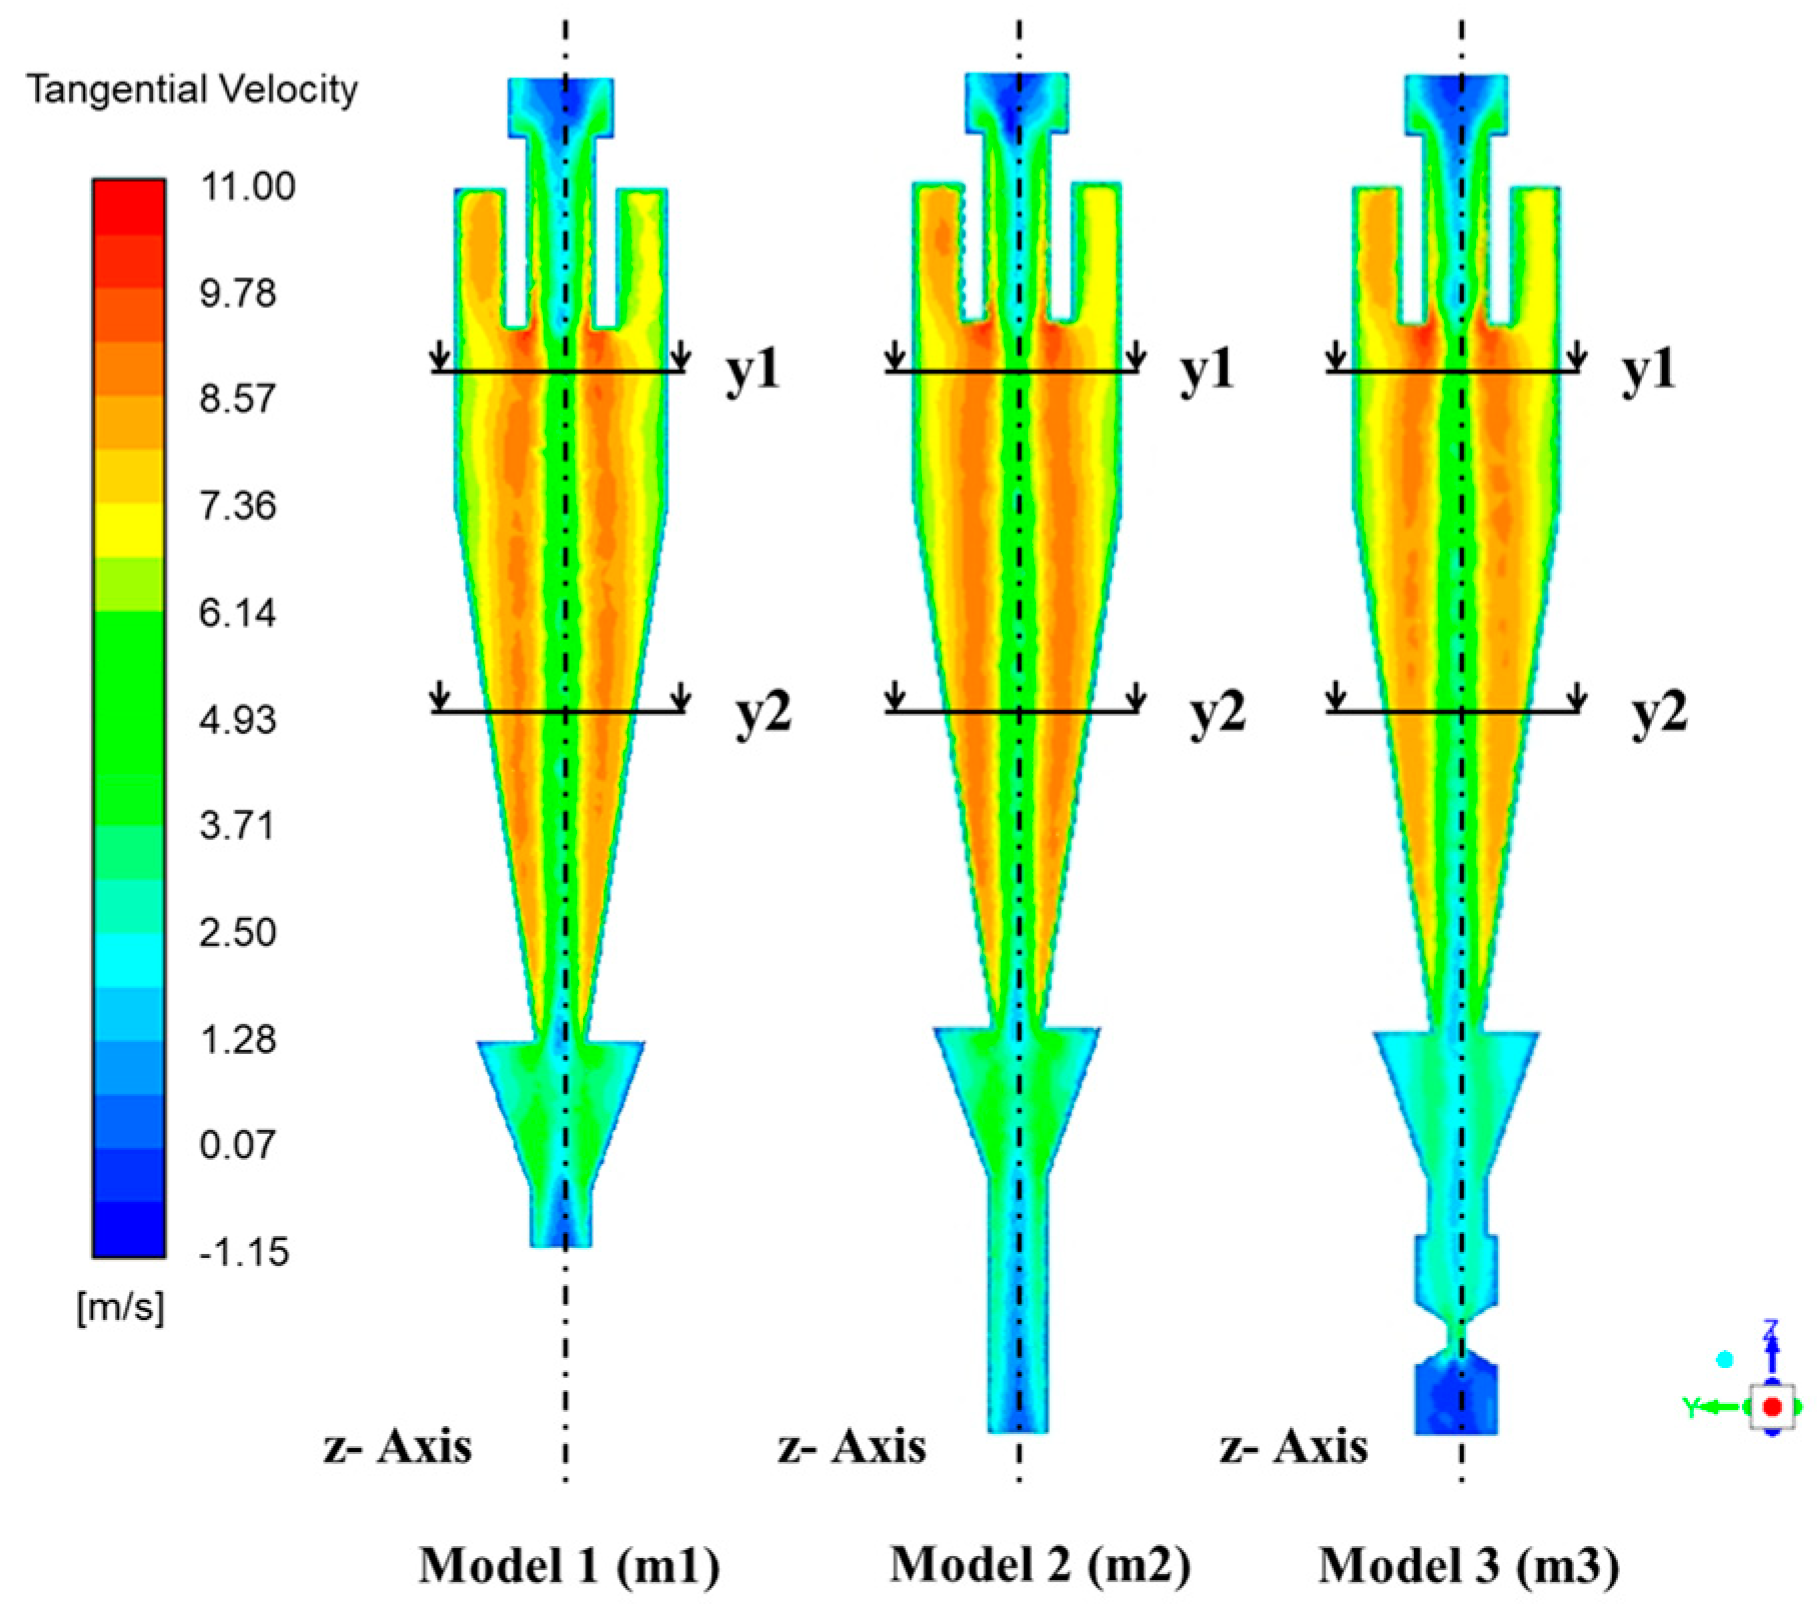
Figure 8 and
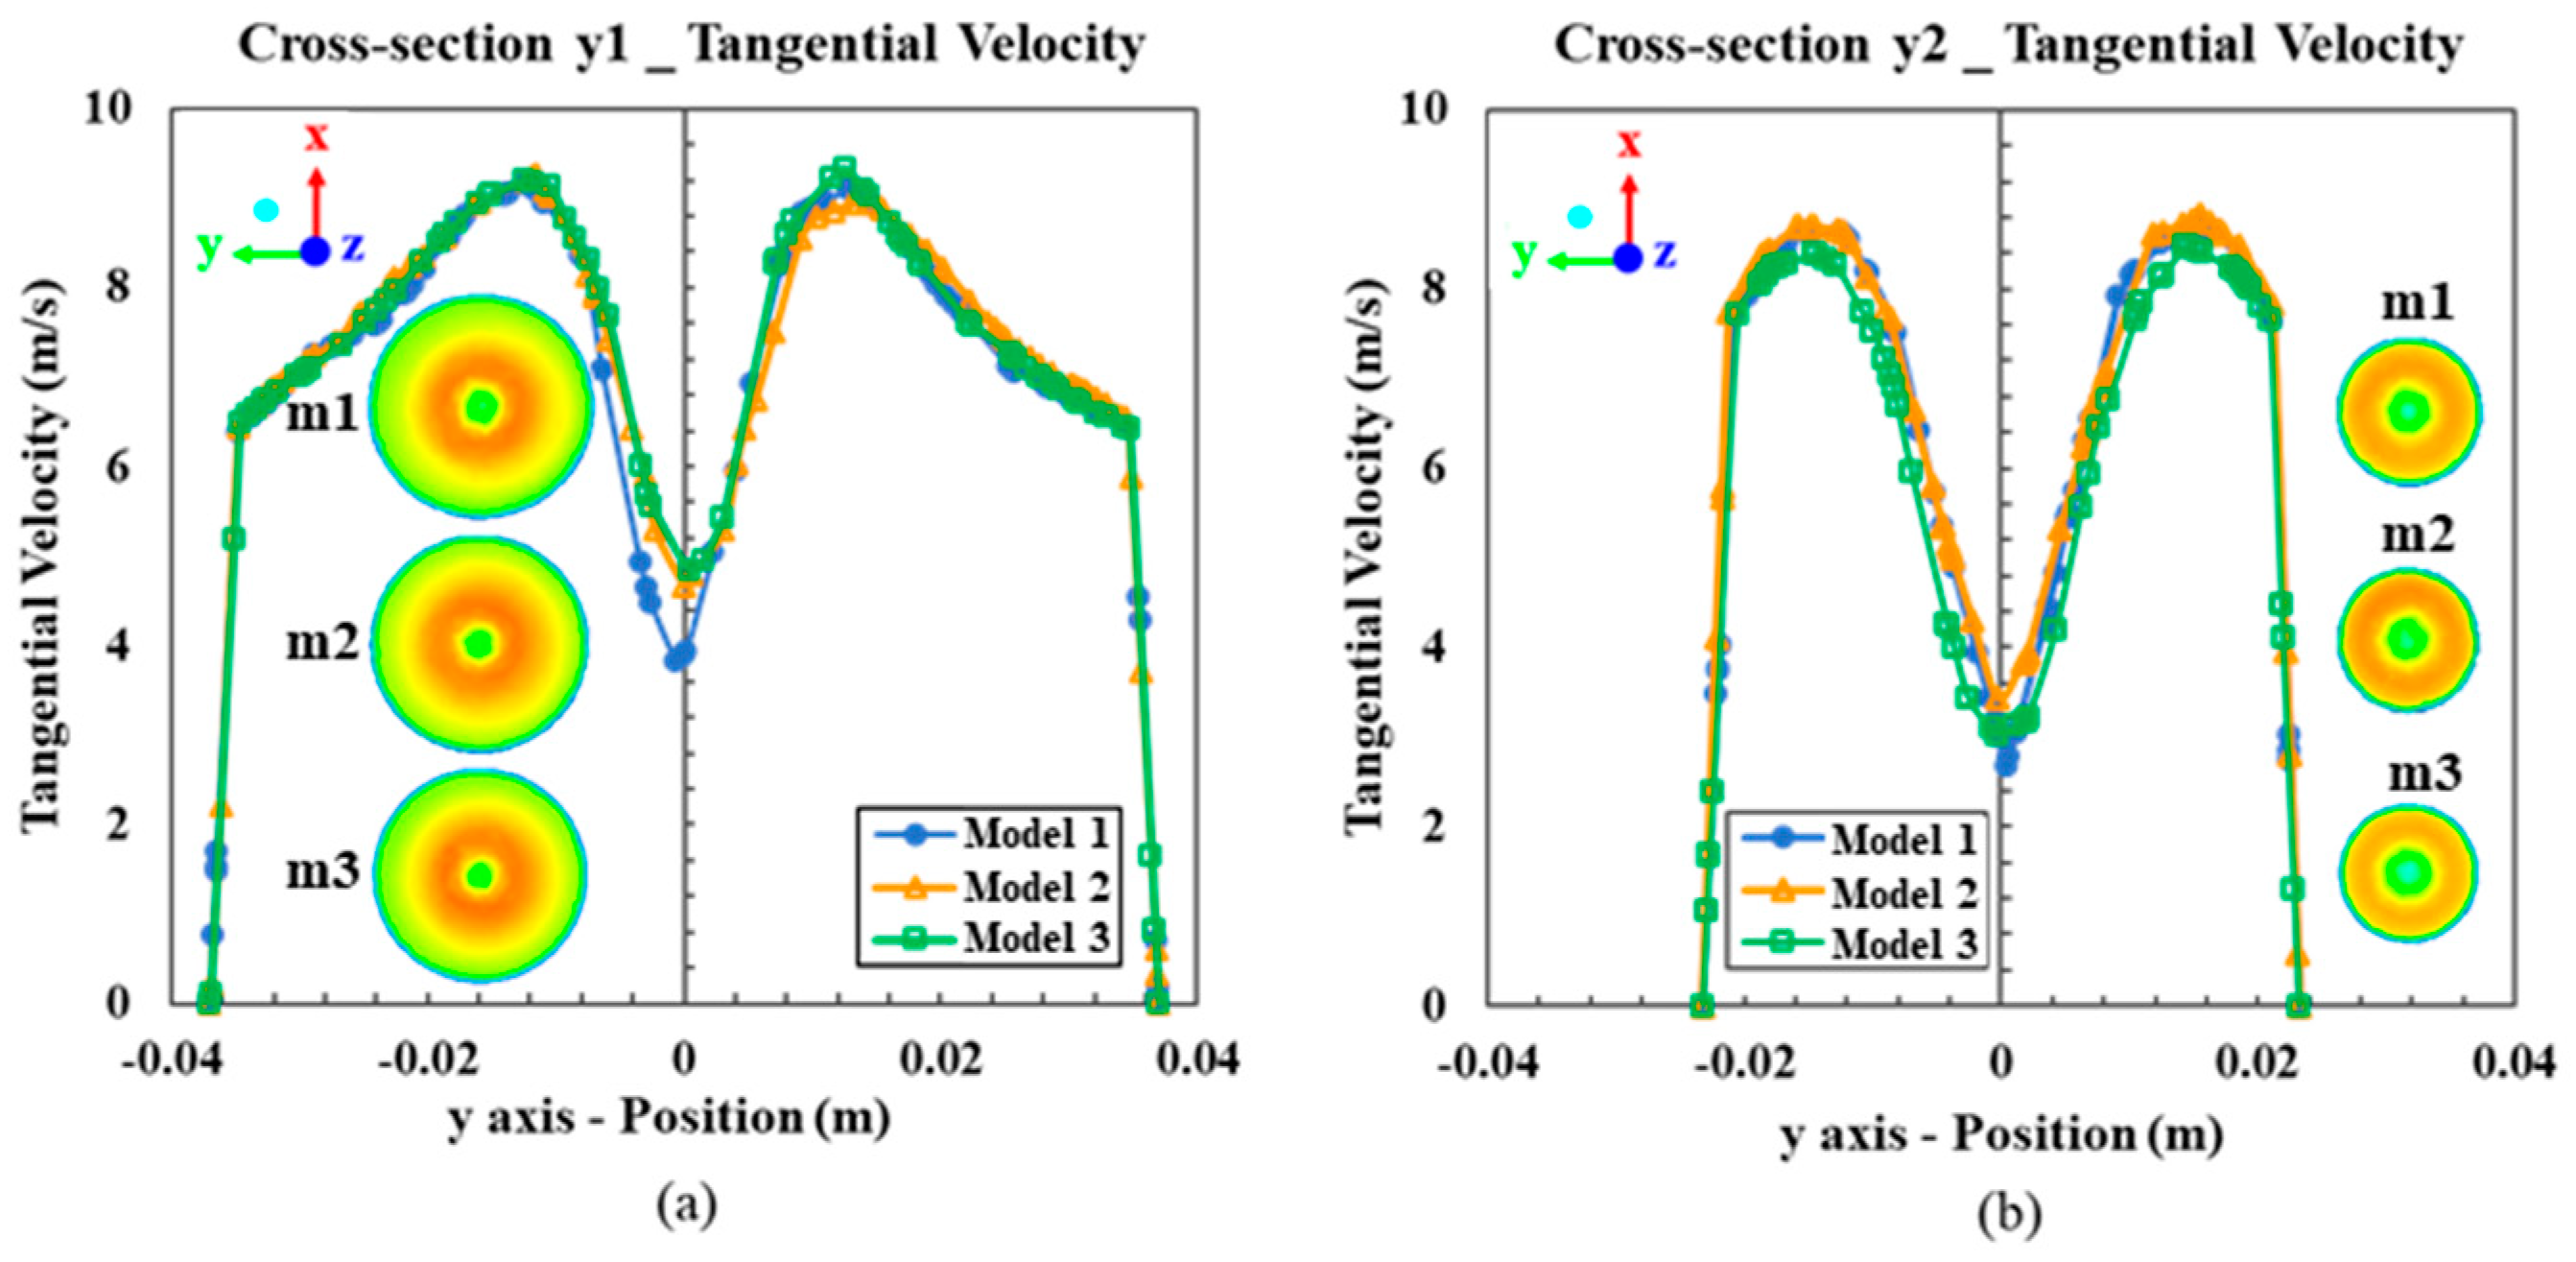
Figure 9 show the contour and profile of the tangential velocity for each model, respectively. The tangential velocity profile has an inverted-W trend in the hydrocyclone [
29]. The analysis found that the maximum values of the tangential velocity were almost identical in the three models. This confirms the previous research findings that dust outlet geometry has minimal effect on tangential velocity [
19]. The applied centrifugal force was expected to be similar since the influence of the shape of the lower hopper on the tangential velocity was insignificant. Thus, it can be concluded that tangential velocity does not significantly affect the performance of the cyclone filter.
5.2. Axial Velocity
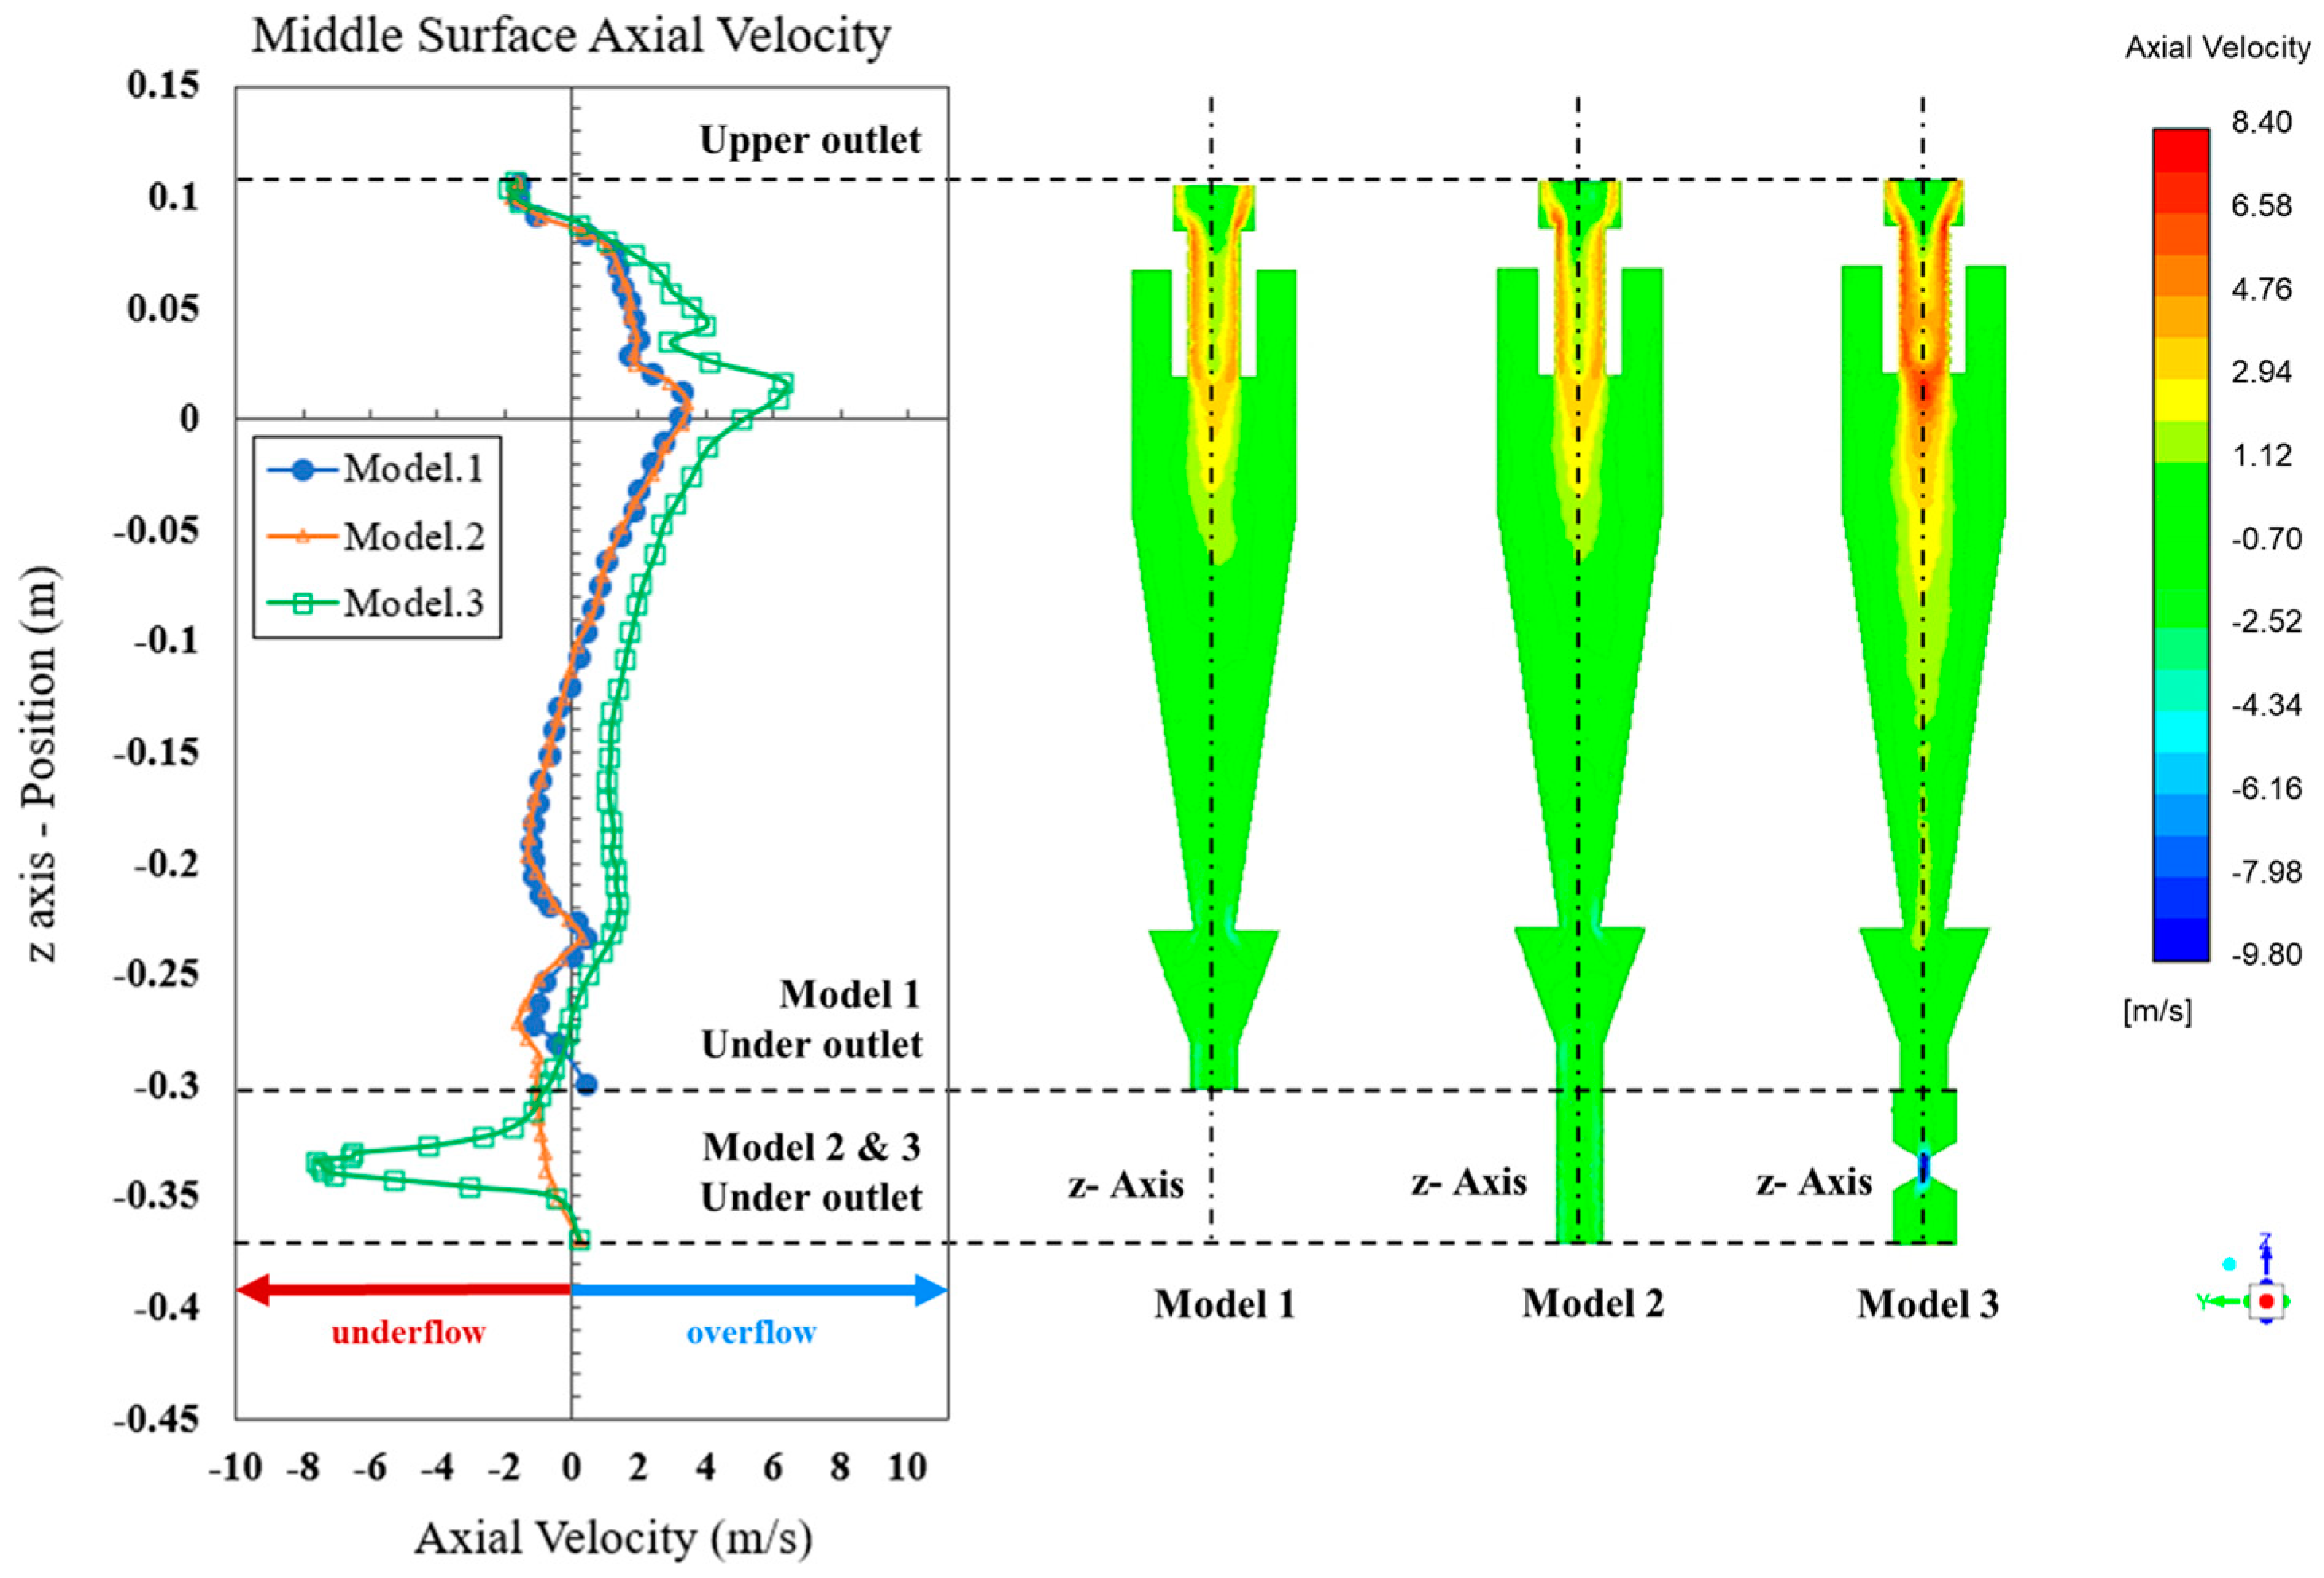
Elsayed and Lacor reported that the axial velocity varies with the shape of the hopper, and there is a significant difference in the center [
19].
Figure 10 shows the contour and profile of the axial velocity for each model. The profile represents the average value in the central region, where the difference in axial velocity was observed. Here, the
x-axis of the axial velocity indicated the discharge velocity, which was positive and negative in the upward and downward directions, respectively. Comparing the axial velocities of Model 1 and Model 2, no significant difference was found. However, the axial velocity increased significantly in Model 3, which contained a socket of hourglass geometry. This increase was caused by the sudden concentration of the overflow due to the decrease in the cross-sectional area. In previous studies, a rapid expansion of the downward flow was observed by increasing the diameter of the hopper, while in this study, an increase in the upward flow due to a decrease in the cross-sectional area was observed. Overall trends were consistent with previous studies. Therefore, it can be concluded that axial velocity is influenced by the geometrical shape of the lower hopper and was more affected by the diameter than the length.
5.3. Cyclone Performance
The performance of the cyclone was evaluated based on the discharge flow rate from the upper outlet and the filter functions.
Table 5 shows a comparison of the discharge flow rate of each model, and
Figure 11 shows a comparison of the cyclone filter performance according to the particle size. The discharged flow rates in Model 1 and Model 2 were similar and increased in Model 3. The discharge flow rate was influenced by the velocity, with the axial velocity significantly affecting the discharge rate. The tangential velocity did not change much across the three models and therefore did not influence the discharge flow rate. The separation efficiency was obtained by calculating the ratio of the trapped (at outlet) and released (from inlet) particles according to the particle tracking method [
30].
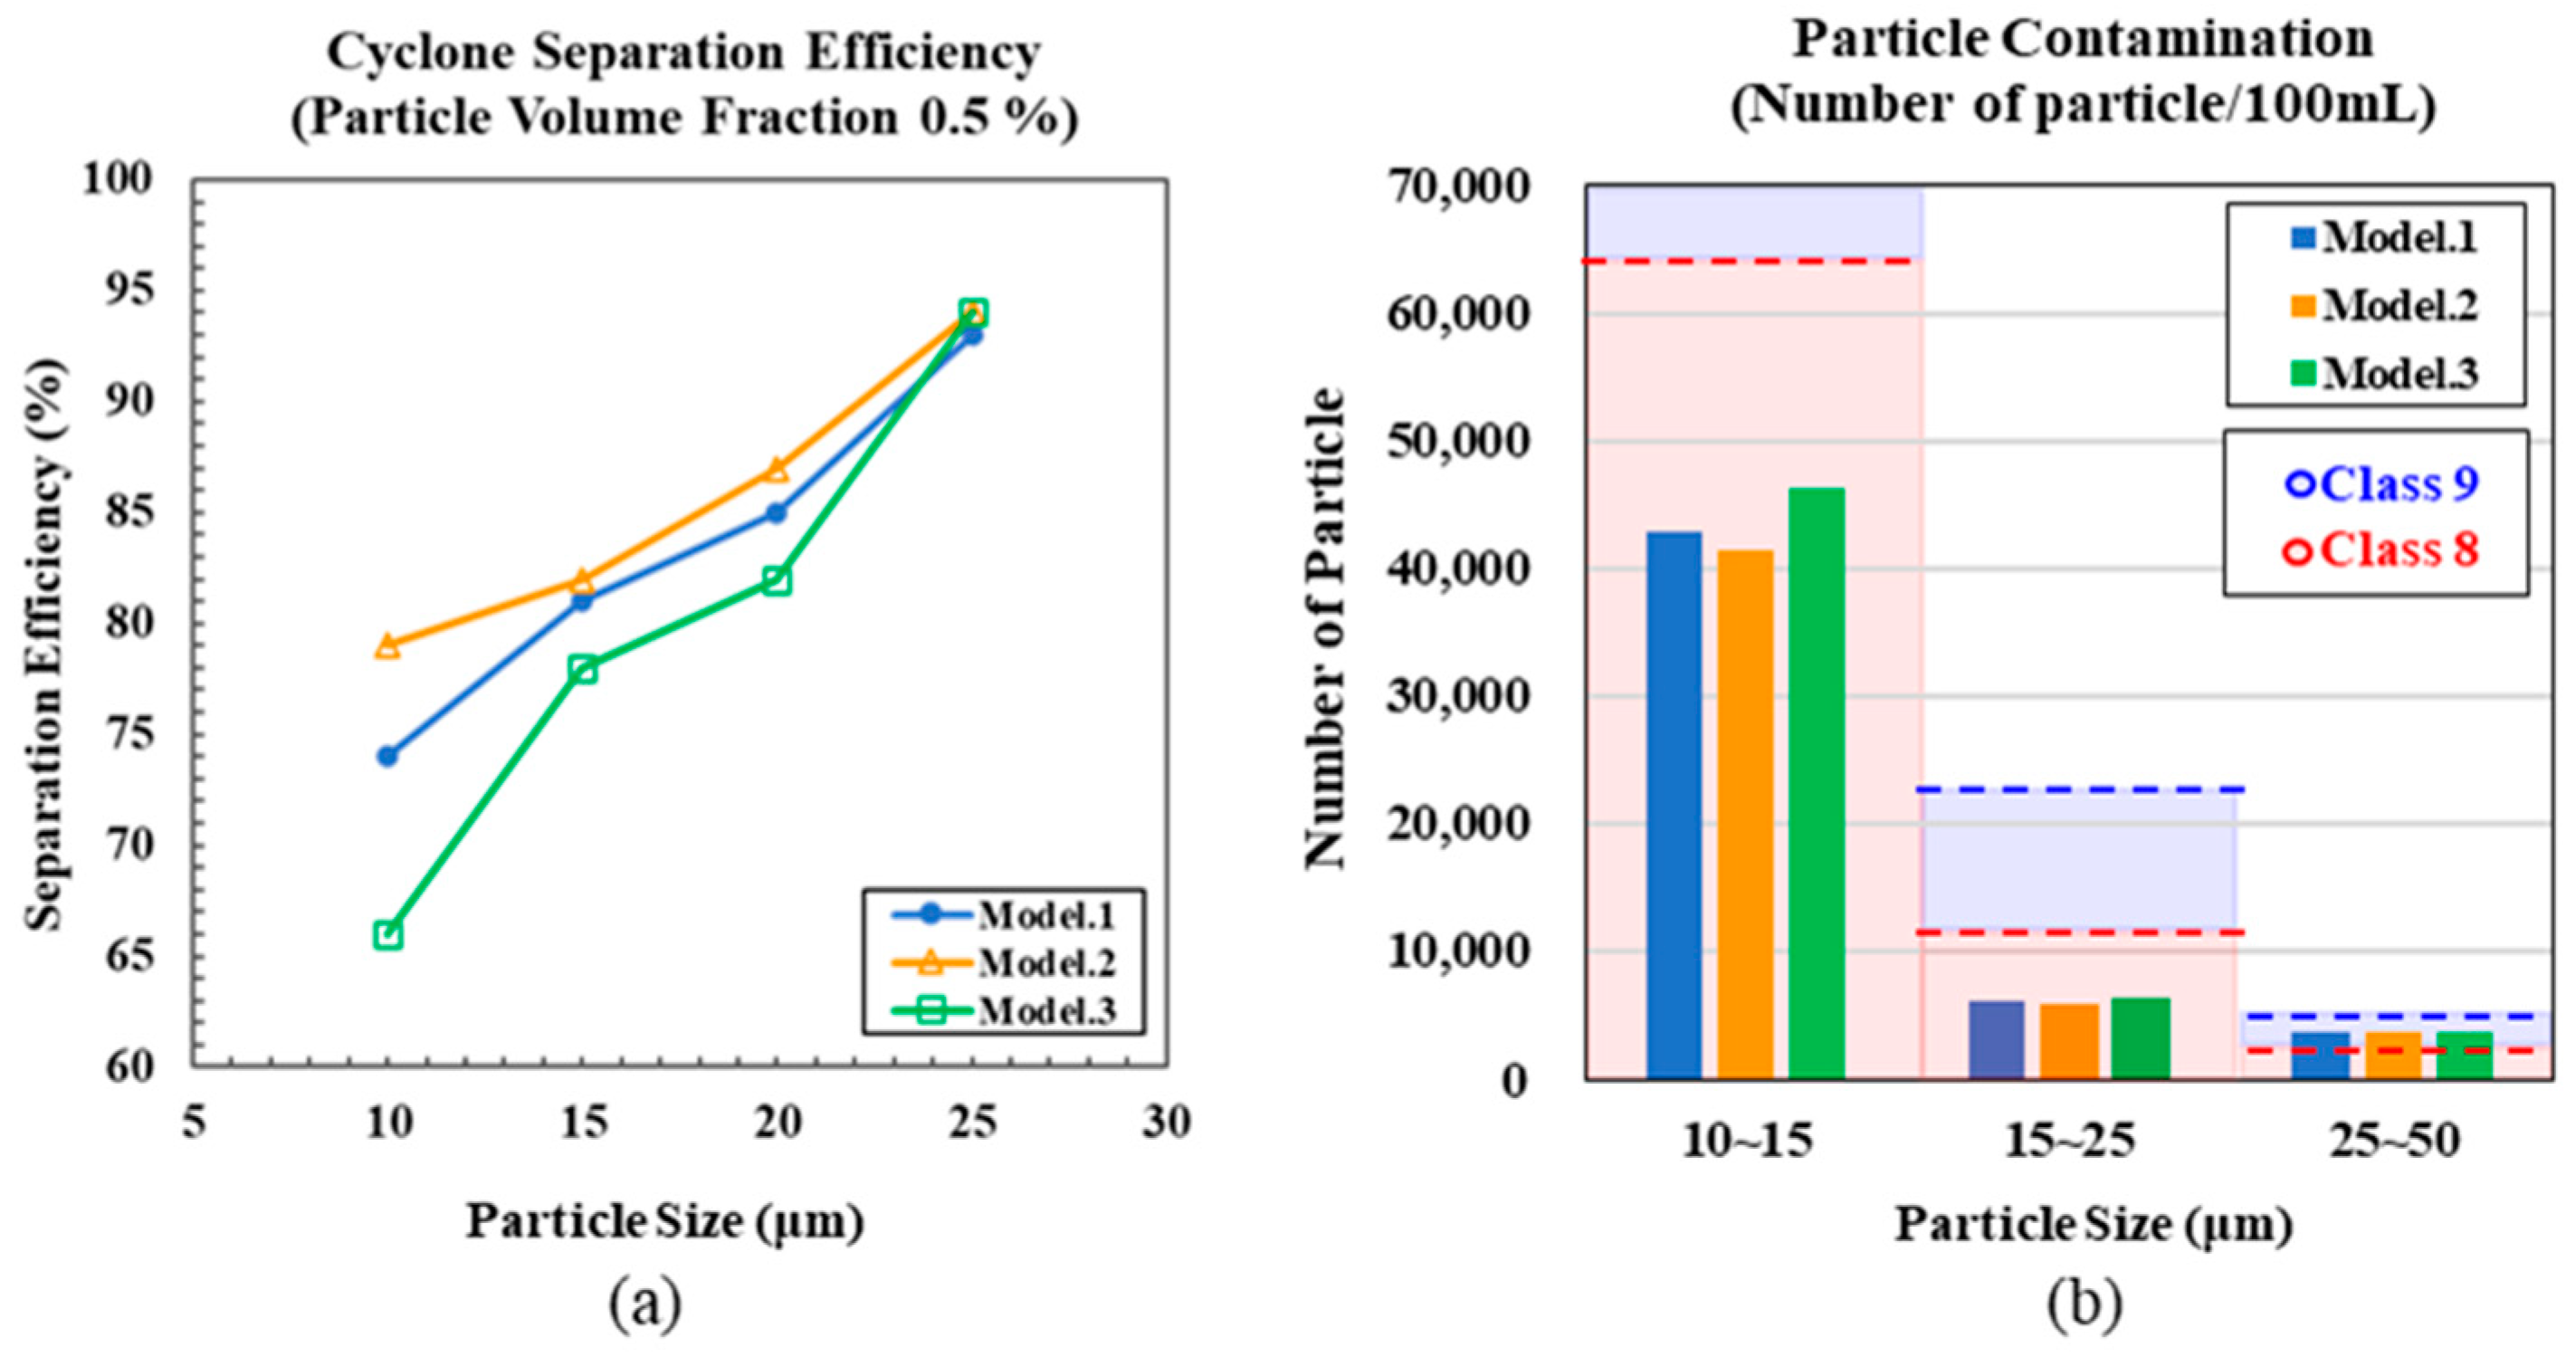
As shown in
Figure 11a, compared to Model 1, the overall particle separation efficiency of the cyclone increased in Model 2 and decreased in Model 3. As the particle size decreased, the functional efficiency of the filter decreased, and the difference between the models increased. Compared to the base model (Model 1), the extended length model (Model 2) increased the discharge velocity from the bottom of the hopper, thereby preventing the re-entrainment of the particles. Model 3 had the same length as Model 2; however, due to an abrupt decrease in the cross-sectional area, the axial velocity of the internal vortex increased, and particles with smaller inertia were discharged with the fluid by the upward flow before reaching the hopper bottom, resulting in a decrease in the filter function. For the 25μm particles, the effect of velocity was less significant due to their larger inertia, and the particle separation efficiency was similar across the three models.
Figure 11b shows the predicted number of particles in the discharged 100 mL of fluid based on the experimental model (Model 1). Particle contamination was evaluated based on a criterion stipulated by the NAS (National Aerospace Standard) 1638 [
31]. NAS classification is based on the size and number of particles contained in 100 mL of fluid and follows a template—class #: particle size (µm): number of particles. In particular, class eight: 5–15: 64,000, 15–25: 11,400, 25–50: 2025; and class nine: 5–15: 28,000, 15–25: 22,800, 25–50: 4050. In the three models, the particle sizes within 25 µm were included in the class eight range, but the number of particles with a size of 25–50 µm exceeded the class eight range and were included within class nine. Therefore, the three models were equally represented as class nine, and all the models were suitable to be used as filters since the target value of particle contamination in the newly designed was less than class 10. In the case of a conventional filter, the efficiency of particle separation was noticed as class 10: 5–15: 128,000, 15–25: 22,800, 25–50: 4050.
6. Conclusions
The passive filter of the conventional pump may be replaced with a cyclone filter, which is an active filtration device. The inner flow of the cyclone changed according to its shape, and it is important to characterize the cyclone’s performance according to the geometric parameters.
This study verified the numerical method of a liquid–solid cyclone using medium-viscosity oil by comparing the flow rate discharged to the upper outlet of the experiment and simulation. In addition, after changing the shape of the lower hopper, a simulation was performed using a verified method to predict the particle separation efficiency according to the geometry. Since the efficiency of particle separation is mainly affected by the fluid flow patterns, this research focused on the velocity distribution.
As a result, it was confirmed that the shape change of the hopper barely affected the tangential velocity and only affected the axial velocity. Comparing Model 1 and Model 2, the discharged flow rates were similar. However, since the overall filter performance in Model 2 was increased, it can be said to be a more suitable model for filtering fine particles. In contrast, the discharged flow rate of Model 3 was 1.37 times that of Model 1; however, it was not suitable for filtering fine particles because the filter performance degraded with the decrease in particle size.
This study established a numerical method for cyclones using oil with medium viscosity and showed that the shape of the hopper affects particle separation efficiency. In the future, geometric optimization of the cyclone should be performed according to the particle size to be used for the application at hand.
Author Contributions
Conceptualization, J.B.K.; data curation, Y.R.K.; formal analysis, Y.R.K.; validation, J.B.K.; investigation, J.B.K. and Y.R.K.; writing—original draft preparation, Y.R.K.; writing—review and editing, J.B.K. All authors have read and agreed to the published version of the manuscript.
Funding
This study was supported by a research grant from Chosun University, 2019.
Data Availability Statement
Data sharing is not applicable to this article.
Conflicts of Interest
The authors declare no conflict of interest.
Nomenclature
| Instantaneous velocity of fluid. |
| Average velocity of fluid. |
| Fluctuating component of velocity. |
| Spatial position. |
| Average pressure of fluid. |
| Fluid density. |
| Fluid absolute dynamic viscosity. |
| Reynolds stress tensor. |
| Turbulence diffusion. |
| Stress production. |
| Pressure strain. |
| Dissipation term. |
| Rotation production. |
| Velocity of particles. |
| Drag force. |
| Density of particles. |
| Gravitational acceleration |
| Corresponds to the additional forces. |
References
- Park, D.; Go, J.S. Design of Cyclone Separator Critical Diameter Model Based on Machine Learning and CFD. Processes 2020, 8, 1521. [Google Scholar] [CrossRef]
- Shukla, S.K.; Shukla, P.; Ghosh, P. The effect of modeling of velocity fluctuations on prediction of collection efficiency of cyclone separators. Appl. Math. Model. 2013, 37, 5774–5789. [Google Scholar] [CrossRef]
- Karr, C.L.; Stanley, D.A.; McWhorter, B. Optimization of hydrocyclone operation using a geno-fuzzy algorithm. Comput. Methods Appl. Mech. Eng. 2000, 186, 517–530. [Google Scholar] [CrossRef]
- Pishbin, S.I.; Moghiman, M. Optimization of Cyclone Separators Genetic Algorithm. Int. Rev. Chem. Eng. (I.RE.CH.E.) 2010, 2, 683–691. [Google Scholar] [CrossRef] [Green Version]
- Karagoz, I.; Avci, A. Modelling of the Pressure Drop in Tangential Inlet Cyclone Separators. Aerosol Sci. Technol. 2005, 39, 857–865. [Google Scholar] [CrossRef]
- Azadi, M.; Azadi, M.; Mohebbi, A. A CFD study of the effect of cyclone size on its performance parameters. J. Hazard. Mater. 2010, 182, 835–841. [Google Scholar] [CrossRef] [PubMed]
- Singh, P.; Couckuyt, I.; Elsayed, K.; Deschrijver, D. Shape optimization of a cyclone separator using multi-objective surrogate-based optimization. Appl. Math. Model. 2016, 40, 4248–4259. [Google Scholar] [CrossRef]
- Safikhani, H.; Esmaeili, F.; Salehfard, S. Numerical Study of Flow Field in New Design Dynamic Cyclone Separators. IJE TRANSACTIONS B Appl. 2020, 33, 357–365. [Google Scholar]
- Hreiz, R.; Lainé, R.; Wu, J.; Lemaitre, C.; Gentric, C.; Fünfschilling, D. On the effect of the nozzle design on the performances of gas–liquid cylindrical cyclone separators. Int. J. Multiph. Flow 2014, 58, 15–26. [Google Scholar] [CrossRef]
- Movafaghian, S.; Jaua-Marturet, J.A.; Mohan, R.S.; Shoham, O.; Kouba, G.E. The effects of geometry, fluid properties and pressure on the hydrodynamics of gas–liquid cylindrical cyclone separators. Int. J. Multiph. Flow 2000, 26, 999–1018. [Google Scholar] [CrossRef]
- Izadi, M.; Makvand, A.M.; Assareh, E.; Parvaz, F. Optimizing the design and performance of solid–liquid separators. Int. J. Thermofluids 2020, 5–6, 100033. [Google Scholar] [CrossRef]
- Ci, H.; Sun, G. Effects of Wall Roughness on the Flow Field and Vortex Length of Cyclone. Procedia Eng. 2015, 102, 1316–1325. [Google Scholar] [CrossRef] [Green Version]
- Elasyed, K.; Lacor, C. The effect of cyclone inlet dimensions on the flow pattern and performance. Appl. Math. Model. 2011, 35, 1952–1968. [Google Scholar] [CrossRef] [Green Version]
- Zhang, P.; Duan, J.; Chen, G.; Wang, W. Numerical Investigation on Gas-solid Flow in a Circumfluent Cyclone Separator. Aerosol Air Qual. Res. 2019, 19, 971–980. [Google Scholar] [CrossRef]
- Pandey, S.; Saha, I.; Prakash, O.; Mukherjee, T.; Iqbal, J.; Roy, A.K.; Wasilewski, M.; Brar, L.S. CFD Investigations of Cyclone Separators with Different Cone Heights and Shapes. Appl. Sci. 2022, 12, 4904. [Google Scholar] [CrossRef]
- Elasyed, K.; Lacor, C. The effect of cyclone vortex finder dimensions on the flow pattern and performance using LES. Comput. Fluids 2012, 71, 224–239. [Google Scholar] [CrossRef]
- Slack, M.D.; Prasad, R.O.; Bakker, A.; Boysan, F. Advances in Cyclone Modelling Using Unstructured Grids. TransIChemE 2000, 78, 1098–1104. [Google Scholar] [CrossRef]
- Brar, L.; Sharma, R. Corrigendum to Effect of Varying Diameter on the Performance of Industrial Scale Gas Cyclone Dust Separators. Mater. Today Proc. 2015, 2, 3230–3237. [Google Scholar] [CrossRef]
- Elasyed, K.; Lacor, C. The effect of the dust outlet geometry on the performance and hydrodynamics of gas cyclones. Comput. Fluids 2012, 68, 134–147. [Google Scholar] [CrossRef]
- Durango-Cogollo, M.; Garcia-Bravo, J.; Newell, B.; Gonzalez-Mancera, A. CFD Modeling of Hydrocyclones—A Study of Efficiency of Hydrodynamic Reservoirs. Fluids 2020, 5, 118. [Google Scholar] [CrossRef]
- Nor, M.A.M.; Kamaruddin, S.; Lemma, T.A. Numerical investigation of API 31 cyclone separator for mechanical seal piping plan for rotating machineries. Alex. Eng. J. 2022, 61, 1597–1606. [Google Scholar] [CrossRef]
- El-Batch, H.M. Improving cyclone performance by proper selection of the exit pipe. Appl. Math. Model. 2013, 37, 5286–5303. [Google Scholar] [CrossRef]
- Chu, K.W.; Wang, B.; Xu, D.L.; Chen, Y.X.; Yu, A.B. CFD–DEM simulation of the gas–solid flow in a cyclone separator. Chem. Eng. Sci. 2011, 66, 834–847. [Google Scholar] [CrossRef]
- Elasyed, K.; Lacor, C. Numerical modeling of the flow field and performance in cyclones of different cone-tip diameters. Comput. Fluids 2011, 51, 48–59. [Google Scholar] [CrossRef]
- Wójtowicz, R.; Wolak, P.; Wójtowicz-Wróbel, A. Numerical and Experimental Analysis of Flow Pattern, Pressure Drop and Collection Efficiency in a Cyclone with a Square Inlet and Different Dimensions of a Vortex Finder. Energies 2020, 14, 111. [Google Scholar] [CrossRef]
- Zabala-Quintero, C.; Ramirez-Pastran, J.; Torres, M. Performance Characterization of a New Model for a Cyclone Separator of Particles Using Computational Fluid Dynamics. Appl. Sci. 2021, 11, 5342. [Google Scholar] [CrossRef]
- Wang, B.; Xu, D.L.; Chu, K.W.; Yu, A.B. Numerical study of gas–solid flow in a cyclone separator. Appl. Math. Model. 2006, 30, 1326–1342. [Google Scholar] [CrossRef] [Green Version]
- Baroiu, N.; Moroșanu, G.A. Constructive-Functional Analysis and Sizing of Hydraulic Filters. Ann. ”Dunarea de Jos” Univ. Galati, Fascicle V, Technol. Mach. Build. 2021, 39, 5–10. [Google Scholar] [CrossRef]
- Azimian, M.; Bart, H.J. Numerical analysis of hydroabrasion in a hydrocyclone. Pet. Sci. 2016, 13, 304–319. [Google Scholar] [CrossRef] [Green Version]
- Gong, G.; Yang, Z.; Zhu, S. Numerical investigation of the effect of helix angle and leaf margin on the flow pattern and the performance of the axial flow cyclone separator. Appl. Math. Model. 2012, 36, 3916–3930. [Google Scholar] [CrossRef]
- Hamdy, O.; Bassily, M.A.; El-Batsh, H.M.; Mekhail, T.A. Numerical study of the effect of changing the cyclone cone length on the gas flow field. Appl. Math. Model. 2017, 46, 81–97. [Google Scholar] [CrossRef]
Figure 1.
Schematic representation of the cyclone principle.
Figure 1.
Schematic representation of the cyclone principle.
Figure 2.
Schematic diagram of cyclone models; (a) Model 1 (basic), (b) Model 2 (added socket 1), and (c) Model 3 (added socket 2).
Figure 2.
Schematic diagram of cyclone models; (a) Model 1 (basic), (b) Model 2 (added socket 1), and (c) Model 3 (added socket 2).
Figure 3.
Meshing of the cyclone models; (a) Model 1 (basic), (b) Model 2 (added socket 1), and (c) Model 3 (added socket 2).
Figure 3.
Meshing of the cyclone models; (a) Model 1 (basic), (b) Model 2 (added socket 1), and (c) Model 3 (added socket 2).
Figure 4.
Experimental setup.
Figure 4.
Experimental setup.
Figure 5.
Contour of Model 1 injected with 5 percent particles; (a) Total pressure, (b) Velocity magnitude, and (c) Vortices distribution.
Figure 5.
Contour of Model 1 injected with 5 percent particles; (a) Total pressure, (b) Velocity magnitude, and (c) Vortices distribution.
Figure 6.
Distribution profile of Model 1 injected with 5 percent particles; (a) Total pressure and (b) Velocity magnitude.
Figure 6.
Distribution profile of Model 1 injected with 5 percent particles; (a) Total pressure and (b) Velocity magnitude.
Figure 7.
Comparison of calculated and measured results; (a) inlet static pressure and (b) upper outlet flow rate.
Figure 7.
Comparison of calculated and measured results; (a) inlet static pressure and (b) upper outlet flow rate.
Figure 8.
Contour of tangential velocity for each cyclone model.
Figure 8.
Contour of tangential velocity for each cyclone model.
Figure 9.
Tangential velocity profile y1 (cylindrical center) and y2 (conical center); (a) Tangential velocity at y1 and (b) Tangential velocity at y2.
Figure 9.
Tangential velocity profile y1 (cylindrical center) and y2 (conical center); (a) Tangential velocity at y1 and (b) Tangential velocity at y2.
Figure 10.
Contour and profile of Axial velocity for the cyclone models.
Figure 10.
Contour and profile of Axial velocity for the cyclone models.
Figure 11.
Comparison of cyclone filter performance; (a) Separation efficiency and (b) Number of particles contained in discharge fluid (100 mL).
Figure 11.
Comparison of cyclone filter performance; (a) Separation efficiency and (b) Number of particles contained in discharge fluid (100 mL).
Table 1.
Dimensions of the cyclone models.
Table 1.
Dimensions of the cyclone models.
| Geometry | Symbol | Dimensions (mm) |
|---|
| Model 1 | Model 2 | Model 3 |
|---|
| Cylindrical length | | 112 |
| Conical length | | 187 |
| Inlet diameter | | 38.5 |
| Cylindrical diameter | | 74 |
| Vortex finder diameter | | 36.75 |
| Conical under diameter | | 18.5 |
| Socket 1 diameter | | - | 21.5 | - |
| Socket 1 length | | - | 70 | - |
| Socket 2 diameter | | - | - | 30.26 |
| Socket 2 middle diameter | | - | - | 6 |
| Socket 2 diameter | | - | - | 70 |
Table 2.
Mesh quality of cyclone models.
Table 2.
Mesh quality of cyclone models.
| Cyclone models | Model 1 | Model 2 | Model 3 |
|---|
| Number of Elements | 178,578 | 189,306 | 205,476 |
| Mesh quality | AR | OQ | S | AR | OQ | S | AR | OQ | S |
| 9.75 | 0.99 | 0.81 | 14.88 | 0.99 | 0.85 | 12.49 | 0.99 | 0.82 |
Table 3.
Boundary conditions.
Table 3.
Boundary conditions.
| Section | Boundary Conditions |
|---|
| Category | DPM |
|---|
| Inlet | Velocity inlet | Reflect |
| Upper outlet | Pressure outlet | Escape |
| Under outlet | Pressure outlet | Trapped |
| Wall | - | Reflect |
Table 4.
Averaged values obtained by measuring and calculating.
Table 4.
Averaged values obtained by measuring and calculating.
| Comparison | Inlet Static Pressure (bar) | Upper Outlet Flow Rate (L/min) |
|---|
| Measured | 1.85 (±0.5) | 111.27 (±6.18) |
| Calculated | 1.89 (±0.08) | 98.27 (±3.74) |
Table 5.
Comparison of upper outlet flow rate for cyclone models 1, 2, and 3.
Table 5.
Comparison of upper outlet flow rate for cyclone models 1, 2, and 3.
| Comparison | Upper Outlet Flow Rate (L/min) | (Inlet/Upper Outlet) × 100 (%) |
|---|
| Model 1 | 100.93 | 67.29 |
| Model 2 | 101.30 | 67.53 |
| Model 3 | 137.93 | 91.95 |
| Disclaimer/Publisher’s Note: The statements, opinions and data contained in all publications are solely those of the individual author(s) and contributor(s) and not of MDPI and/or the editor(s). MDPI and/or the editor(s) disclaim responsibility for any injury to people or property resulting from any ideas, methods, instructions or products referred to in the content. |
© 2023 by the authors. Licensee MDPI, Basel, Switzerland. This article is an open access article distributed under the terms and conditions of the Creative Commons Attribution (CC BY) license (https://creativecommons.org/licenses/by/4.0/).


