
Study on the Engagement Characteristics and Control Strategy of High Speed Difference Dry Friction Clutch
1
State Key Laboratory of High Performance Complex Manufacturing, College of Mechanical and Electrical Engineering, Central South University, Changsha 410083, China
2
National Key Laboratory of Science and Technology on Helicopter Transmission, Hunan Aviation Powerplant Research Institute, Aero Engine Corporation of China, Zhuzhou 412002, China
3
Shenzhen Research Institute of Central South University, Shenzhen 410012, China
4
Guangdong Provincial Key Laboratory of Manufacturing Equipment Digitization, Guangdong HUST Industrial Technology Research Institute, Dongguan 523835, China
*
Author to whom correspondence should be addressed.
Machines 2023, 11(3), 407; https://doi.org/10.3390/machines11030407
Submission received: 30 November 2022
/
Revised: 13 March 2023
/
Accepted: 17 March 2023
/
Published: 21 March 2023
(This article belongs to the Special Issue Dynamic Stability Analysis of Aerospace Structures)
Abstract
:In the short/vertical take-off and landing aircraft propulsion system, the vertical take-off/landing and rapid flight are switched through the engagement and disconnection of the dry friction clutch. The smooth and rapid connection of the friction clutch is crucial for the mobility and reliability of this type of aircraft. However, the friction clutch vibrates and generates a large amount of heat at high speed, which affects the engagement performance of the clutch. In practice, when the engagement pressure rises quickly, the clutch engagement time is short, and the temperature rise is small, but the impact torque is large, and vice versa. In view of this problem, with a short/vertical take-off aircraft dry friction clutch as the research object, considering the nonlinear variation of friction coefficient and lift fan load torque, the dynamics model and temperature field model of the high speed difference dry friction clutch are established to analyze the clutch engagement time, impact torque, and temperature change. The engagement test at the high speed of the clutch shows that the simulation results of the kinetic model and temperature field model are consistent with the test results. To realize low temperature rise, low impact torque, and short engagement time, the variable slope engagement pressure control method is proposed. Compared with the traditional fixed slope engagement pressure, the proposed variable slope engagement pressure can reduce the engagement time, impact torque and temperature rise simultaneously. The research results can provide a reference for the friction clutch engagement control of short-range take-off and landing aircraft, reduce the development cost of such aircraft, and improve the reliability of the design.
1. Introduction
Short take-off/vertical take-off and landing aircraft (STOVL) have the characteristics of high flight speed, high mobility, a short take-off/landing distance, and low runway site requirements, which is especially suitable for a scene with limited flight site conditions and rapid response of aircraft [1,2]. In the short/vertical takeoff and landing aircraft propulsion system, the vertical takeoff and fast flight states are switched through the engagement and disconnection of the dry friction clutch. In the vertical state, the engine’s low final output torque is transmitted to the lift fan through a dry friction clutch, providing approximately 50% lift for the short/vertical takeoff. However, in the process of switching between the two flight states of the short take-off/vertical take-off and landing aircraft, due to the large difference in rotational speed between the driving end and the driven end of the friction clutch, the friction coefficient of the friction plate changes, and the non-linear change of the lift fan load. During the engagement process of the friction clutch, there will generate a relatively obvious impact torque, which directly affects the flight stability of the STOVL aircraft. In addition, the engagement time and temperature rise of the friction clutch have a trade-off relationship with the impact torque. The shorter the engagement time and the lower the temperature rise are accompanied by the higher the impact torque, and vice versa. Therefore, simultaneously reducing engagement time, impact torque, and temperature rise is critical to the maneuverability and reliability of this type of aircraft.
As for the study of friction clutch control strategy, Zhao et al. [3] analyzed the principle of synchronous impact and adopted the control strategy of torque compensation to eliminate clutch synchronous impact (maximum speed 2200 rpm). An optimal starting control method based on torque compensation for zero synchronous shock is proposed. Through experimental verification, the proposed control method can effectively meet the starting control target and eliminate the synchronous impact. Zhang et al. [4] used a linear quadratic optimal regulator to control the pressure of the clutch (the maximum speed is 178 rad/s). The results show that this pressure control method can reduce the clutch jitter, friction and wear, and the optimization can reduce the pressure and shock value by 23%. Liu et al. [5] established the dynamic model of the dual-clutch transmission and analyzed the clutch torque during the shifting process. The results show that the shock can be effectively reduced by controlling the change of the clutch torque. Crowther et al. [6,7] established the model of the friction clutch four-degree-of-freedom torsion system and the variable speed transmission system and established the corresponding stick-slip model algorithm. The speed difference before and after clutch engagement is 430 rad/s, and the transmission power is 50 kW. It is proved that the clutch jitter is directly related to the slope of the friction coefficient, and the influence of clutch pressure fluctuation, jitter near engagement, and external torque fluctuation on clutch stick-slip is analyzed by the numerical simulation method. Vlase et al. [8,9] proposed a new approach to the advanced dynamics of mechanical systems, which used the acceleration energies of higher-order to replace kinetic energies. This method had important significance to the analysis of the advanced dynamics. Lai et al. [10] analyzed the effect of rubbing contact localization on squeal in pin-on-disc system. It was pointed out that the variation of the effective contact area on a macroscopic scale is a key parameter for squeal. The above research mainly takes the automobile dry friction clutch as the research object, and in the simulation research, the friction coefficient and load torque are considered constant values. However, the nonlinear change of the friction coefficient and load torque should not be ignored during the analysis of high speed difference friction clutch.
The research on the temperature change during the clutch engagement process is as follows, Mouffak et al. [11] established a clutch model consisting of a pressure plate, a flywheel, and a clutch plate, and simulated and analyzed the temperature field under three different materials and three different numbers of friction surfaces (the maximum speed is 200 rad/s). The results show that the choice of material has a great influence on the temperature rise of the clutch. In addition, the increase in the rotational speed has a great influence on the temperature rise of the clutch. The smaller slip time helps to reduce the temperature rise of the clutch. Pisaturo et al. [12] used the results of vehicle dynamics for finite element analysis (up to 400 rad/s) to predict the temperature rise of the contact surfaces during repeated engagement. The study found that the friction coefficient will decrease as the clutch engages. At the same time, it is found that after several engagements, the contact interface temperature is as high as 300 °C, which will seriously affect the clutch engagement performance. Li et al. [13] established a thermal model of a carbon fiber wet clutch at a maximum speed of 209.33 rad/s. The temperature field and temperature gradient are obtained by finite element analysis, and the results show that with the increase of time, the temperature rises rapidly to the maximum, then drops rapidly, and finally drops steadily until the temperature reaches 40 °C. Yevtushenko et al. [14] used COMSOL multiphysics simulation software to simulate the transient temperature field of the brake disc of the vehicle. Under the working condition of the maximum speed of 90 rad/s, with the increase of the exponentially increasing brake pressure, the shorter the operation time, the higher the maximum temperature, and it can reach about 150 °C. Jian Q et al. [15] carried out a simulation analysis of the transient temperature field of the ventilated disc brake (the maximum speed is 70 rad/s) and verified the simulation results with experiments. The results show that the high-temperature area is in the effective friction area. In the friction stage, the maximum temperature of the disc rises rapidly and reaches a maximum temperature of about 180 °C after 2 s, and the maximum temperature shows a slow downward trend after the braking is completed. The temperature characteristic is a key factor in the wear of the friction plate. The larger thermal energy will be produced under the higher rotation speed. According to the literature search, the rotation speed in most research is lower than 400 rad/s. Hence, it is necessary to further study the temperature characteristic of the high speed difference friction clutch.
According to the above research, the main factors restricting the clutch performance are the time, stability, and temperature of the engagement process, and adopting an appropriate clutch control strategy can improve the clutch engagement performance. In this paper, the dry friction clutch (maximum speed of 520 rad/s) of the STOVL aircraft propulsion system is taken as the research object, aiming at the problems that high speed difference will lead to a large change of friction coefficient, large shock fluctuation, and complex nonlinear characteristics during the engagement process, the dynamics model and temperature field model of the high speed difference dry friction clutch are established to analyze the clutch engagement time, impact torque and temperature change. In addition, the variable slope engagement pressure control method is proposed to reduce the engagement time, impact torque, and temperature rise, simultaneously.
2. Materials and Methods
2.1. Short Range/Vertical Aircraft Propulsion System
2.1.1. Principle of Short Range/Vertical Aircraft Propulsion System
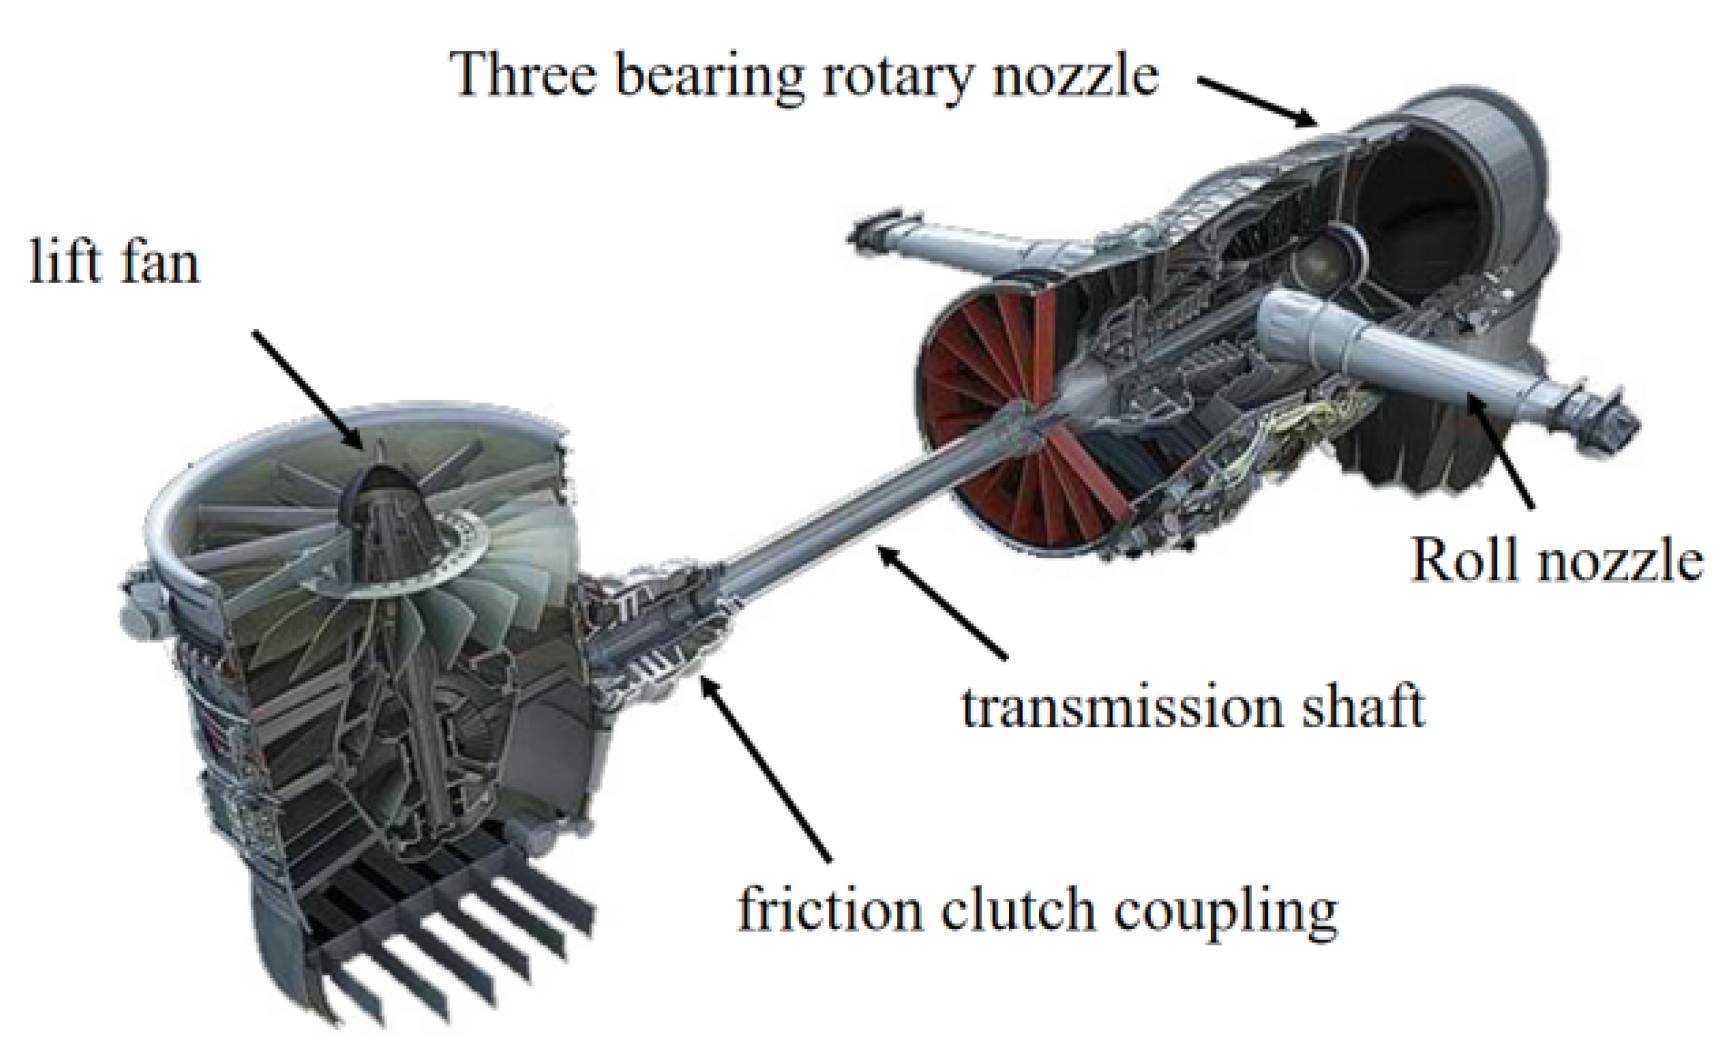
The schematic diagram of the propulsion system of the short-range/vertical take-off and landing aircraft is shown in Figure 1. The propulsion system has two states: one is the flight state when the clutch is disengaged, the nozzle is horizontal, and the propulsion power is provided for flight. The other is the lift state, which is a short take-off/vertical take-off and landing state. At this time, the clutch is engaged, the power is transmitted to the lift fan, and the rotating nozzle is facing down to provide vertical lift for the aircraft [16].
2.1.2. Test Equipment and Methods
The speed, torque, and temperature changes of the high speed difference dry friction clutch during the engagement process are experimentally researched, and the changes are obtained, which are compared with the dynamic simulation results and the temperature field simulation results. In the experiment, due to the low frequency of signal acquisition, in order to collect more data points for comparison, the dynamic simulation model was simulated and simulated under the working conditions of the engagement oil pressure of 1 MPa, the oil pressure rise time of 15 s, and the engagement speed of 4920 rpm. Test verification.
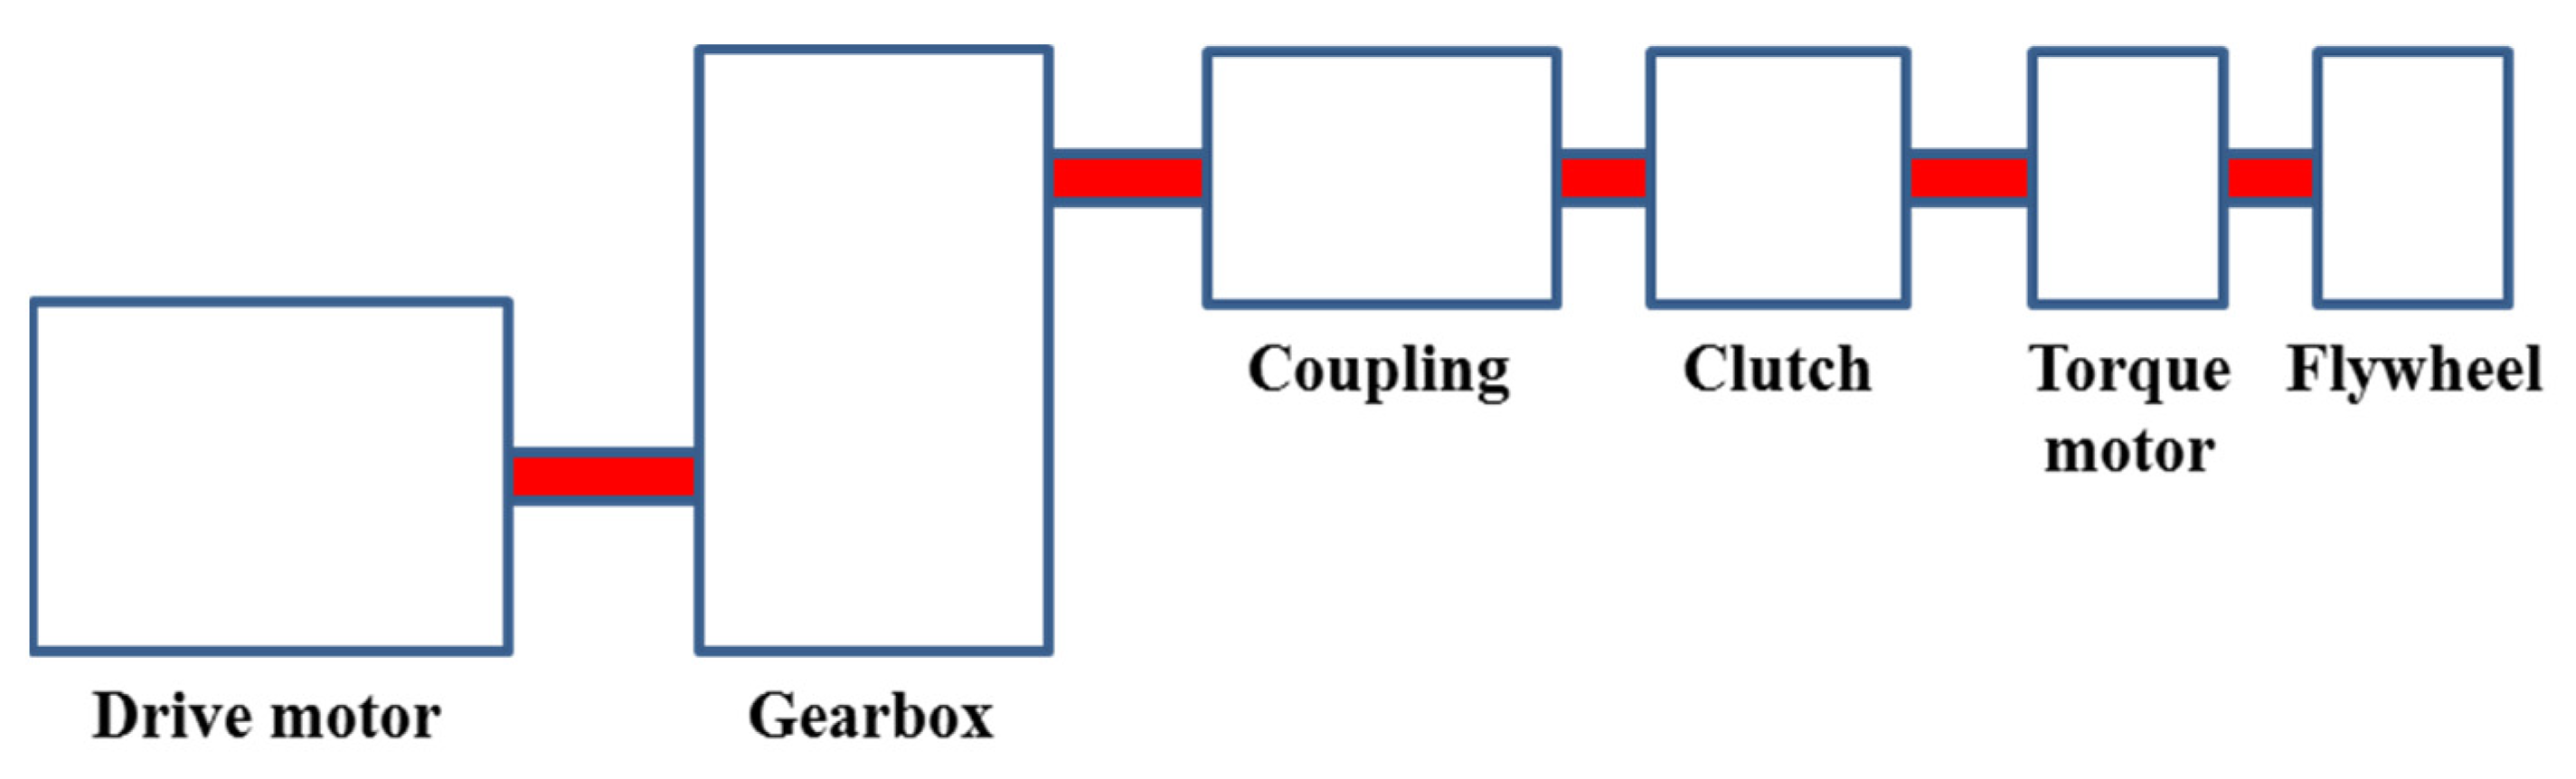
In order to study the engagement characteristics of the dry friction clutch at high speed and to verify the simulation model, an engagement characteristics test device with the clutch as the main body was built. The schematic diagram of the test principle is shown in Figure 2. The input shaft of the clutch is driven by the motor through its transmission system, which can meet the speed requirements of the input shaft connected to the clutch and can be steplessly regulated within the test speed range. The output shaft connection has two forms: flywheel and fan load. The output speed is measured by the HBM torque sensor, the clutch tester is equipped with a separate oil injection lubrication system equivalent to the working state of the clutch, and is equipped with a metal end alarm, so as to monitor the lubrication condition in time. During the tests of the speed, oil pressure, and oil temperature, the tester can alarm or stop in time if the parameter exceeds the limit value. In the test system, the engagement pressure comes from the hydraulic system. The oil pressure transmits to the friction plate through three mechanical arms. The hydraulic system is set near the friction clutch. This test system is an equivalent test system. The rotational inertia of the flywheel is equated to that of the lift fan. The torque motor applies torque to the flywheel, which is consistent with the loading characteristic of the lift fan.
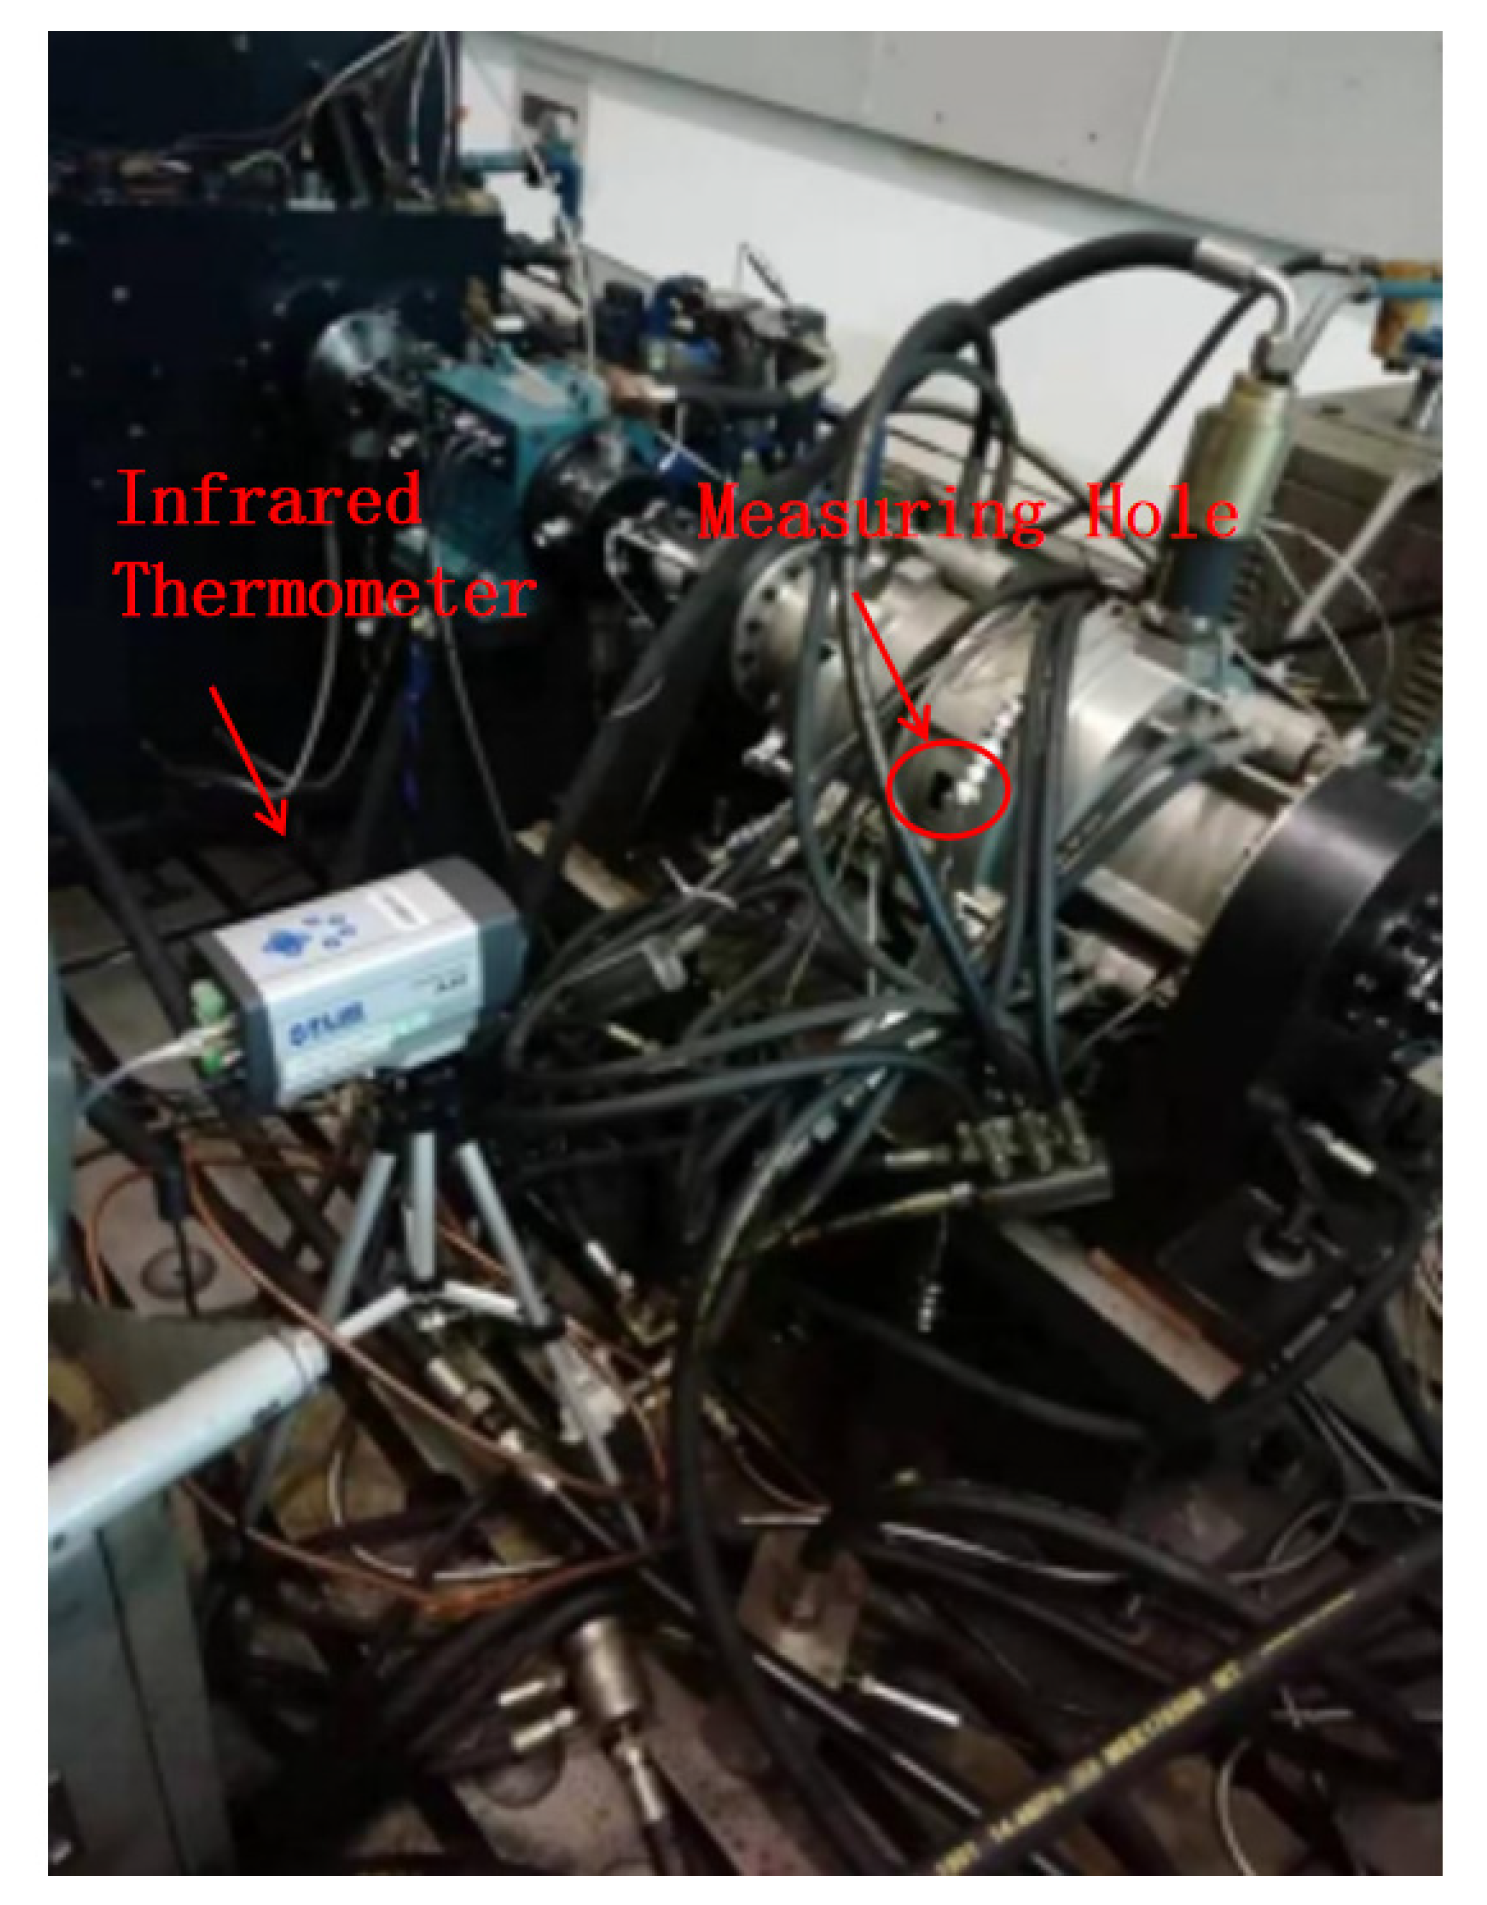
At the same time, in order to carry out the subsequent simulation research on the temperature field of the dry friction clutch engagement process, it is necessary to test the temperature of the clutch friction plate during the test. However, the clutch test of the propulsion system is wrapped under the shell, and it is difficult to directly collect the temperature of the friction plate at high speed. To ensure the accuracy and convenience of the temperature collection data, a wireless infrared test is used in this test. The wireless infrared thermometer is placed on the side of the test bench, and the temperature of the rotating friction plate is collected through the observation hole on the casing. See Figure 3.
The basic physical properties of the carbon-carbon friction sheet material are shown in Table 1.
The specific operation process of the engagement characteristic test is as follows:
- Turn on the input motor, push the input speed to the corresponding speed, and the stable running time is not less than 5 s.
- Start the friction plate actuator, and the pressure starts to load.
- After the speed of both ends of the clutch is the same, keep it for 5 s, and then retract the mechanical locking actuator.
- Confirm that the mechanical locking continues for 10 s.
- Reduce the input speed.
- Extend the mechanical lock actuator and stabilize for 5 s.
- Unload the friction plate actuator, the pressure is unloaded.
- After the output end stops under the action of inertia, after confirming that the clutch is disengaged, turn off the input end motor so that the motor speed decays to 0 within 10 s.
2.2. Model of Engagement Characteristics of Dry Friction Clutches
2.2.1. Modeling of the Friction Clutch Dynamics
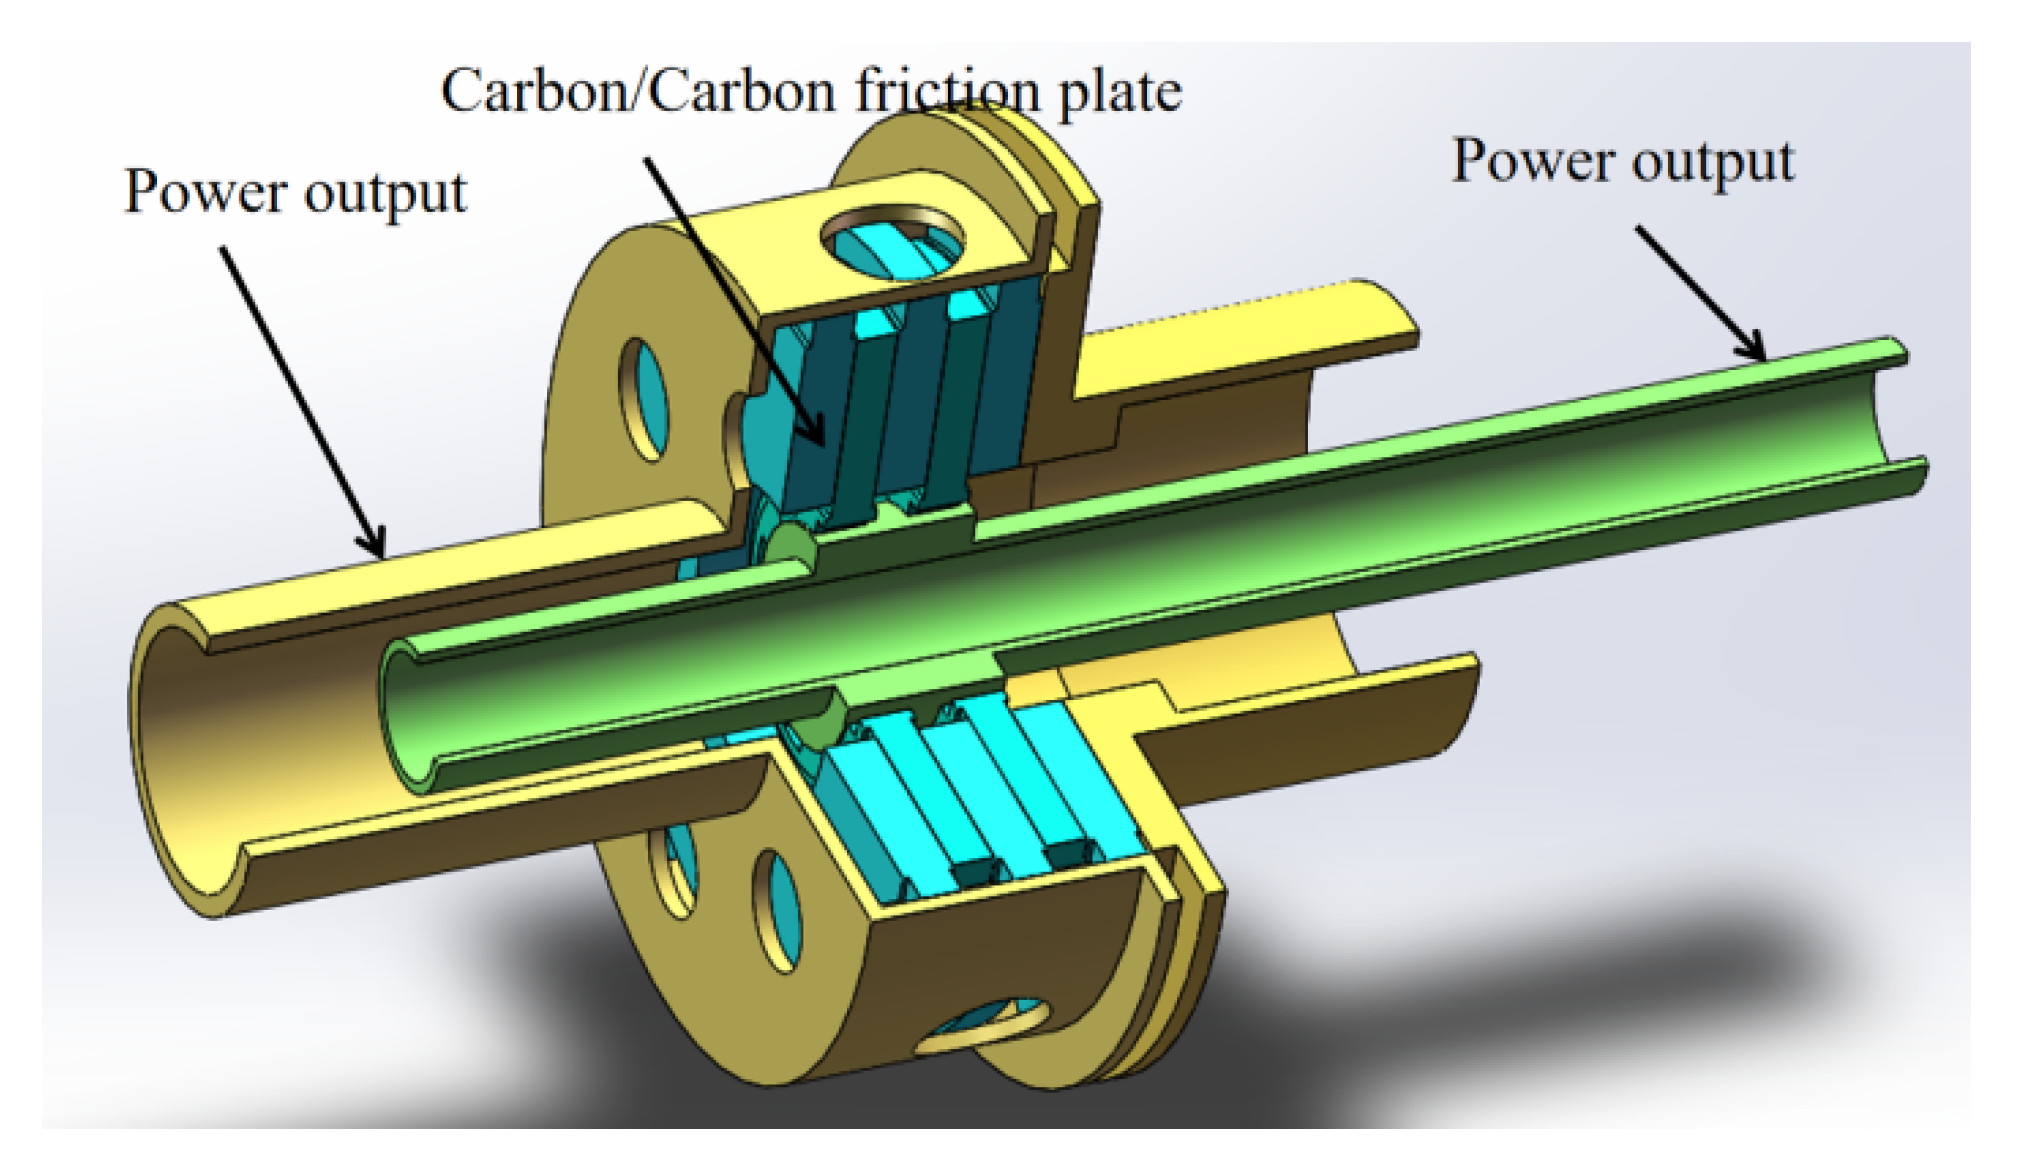
The power of the low-pressure shaft of the engine is transmitted to the lift fan through the engagement of the clutch, so as to realize the transition from the fast flight state to the vertical take-off and landing state. The three-dimensional simplified model of the clutch is shown in Figure 4.
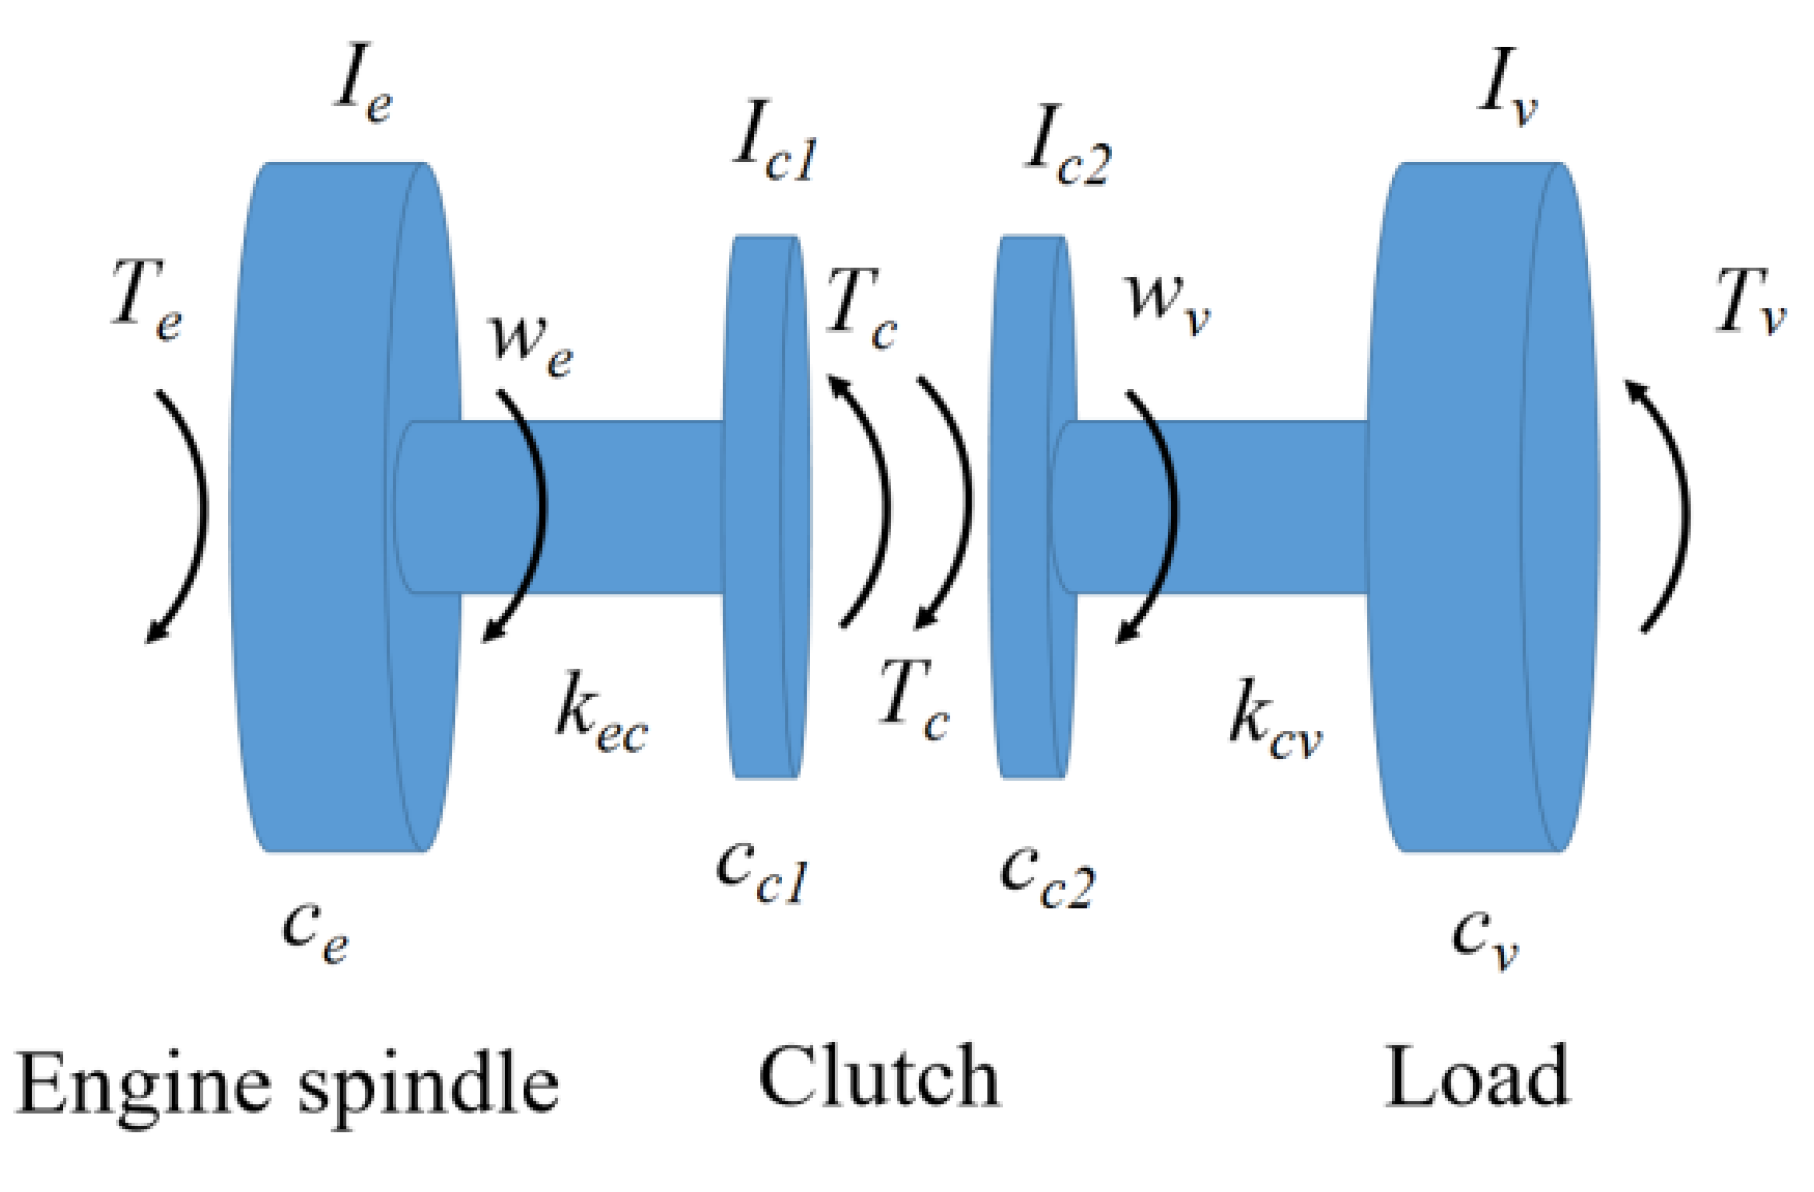
In order to better analyze the dynamic characteristics of the clutch engagement process, the mathematical modeling of the clutch engagement process is now carried out. The power transmission of the friction clutch is transmitted from the input end to the output end through the friction plate. Therefore, the input end of the low-pressure shaft and the output end of the clutch are regarded as a whole, and then the friction plates at both ends are regarded as a whole. Therefore, after a certain simplification of the model, the dynamic model of the friction clutch is shown in Figure 5.
Among them, Te is the output torque of the engine, Tc1 and Tc2 are the friction torque transmitted by the clutch, Tv is the load torque borne by the output end of the driven disc, and Ie, Ic1, Ic2, Iv is the rotation of the engine, the main/slave part of the clutch, and the load part respectively. Inertia, ce, cc1, cc2, cv is the damping coefficient of the engine, the driving disc, the driven disc, and the load part, kec is the torsional stiffness from the engine to the active part of the clutch, and kcv is the torsional stiffness from the clutch driven part to the load part.
The dry friction clutch has two states during the engagement process, namely the slipping state and the locking state. When the friction clutch is in the slipping state, its dynamic equation is shown in Equation (1). θe, θc1, θc2, θv are the angular displacements of the engine shaft, the driving disk, the driven disk, and the load part, respectively.
When the clutch is locked, its kinetic equation is shown in Equation (2).
According to the above theoretical analysis and the three-dimensional structural model, the dynamics model of friction clutch is developed in Simpack simulation software, as shown in Figure 6. The moving plate and the input shaft are cylindrical pairs. When the input shaft rotates, it drives the moving plate to rotate. There is a cylindrical pair between the static plate and the output shaft (shell). The static plate is close to the moving plate under the compression force, and it rotates under the driving force of the moving plate through the friction pair, while the static plate drives the output shaft to rotate.
2.2.2. Modeling of the Friction Clutch Temperature Field
The temperature field simulation model of the friction clutch is established, and the temperature field during the engagement process of the friction clutch is studied and analyzed based on the dynamic simulation results. The heat generation of the friction surface during the sliding friction process is simulated by setting the heat generation load on the friction surface. The heat generation load is shown in Equation (3).
where μ is the coefficient of friction, p is the pressure at the point, w is the relative sliding velocity, and r is the radius. The pressure p is known and w is derived by kinetic analysis.
The heat transfer process in the solid is simulated according to the thermodynamic theory, as shown in Equation (4) [11,15].
ρ is the density of the solid (unit: kg/m3), Cp is the heat capacity of the solid at constant pressure (unit: J/(kg·K)), k is the thermal conductivity of the solid (unit: W/(m·k)), and μ is the velocity field defined by the translation motion sub-node during motion (unit: m/s), Q is the heat source (unit: W/m3), and ∇T is the temperature gradient.
In this temperature model, the thermal energy is produced due to the friction effect of the friction plate. The clutch housing, input shaft, and output shaft are heated up. The thermal energy transfers from the friction plate to the clutch housing, input shaft, and output shaft because of thermal conduction. The surfaces of the clutch housing, input shaft, and output shaft are set as open boundaries. There exists thermal radiation between the open boundary and air. Because the drive source is an electric motor, the heat coming from the engine is ignored. Table 2 lists the mechanical and thermal properties of friction plate and steel.
Based on the above fundamental theory, the finite temperature model of friction clutch is calculated by COMSOL multi-physical field simulation software. Figure 7 shows the meshing of a friction clutch in the temperature model. The results of the dynamics model are treated as the input conditions. By combining the mechanical and thermal properties of friction plate and steel, the temperature distribution of the friction clutch can be obtained.
The state of the clutch during the engagement process is divided into the idle stroke stage, the slippage stage, and the synchronization stage. In the idle stroke stage, the clutch friction plates are not in contact, so no sliding friction work is generated, and no heat is generated on the contact surface. In the sliding friction stage, the friction plates of the clutch contact and rotate relative to each other, which generates a lot of heat and causes the temperature of the clutch to rise. In the synchronization stage, the friction plate is relatively static, and there is no friction work. Therefore, it can be known that the heat-generating stage of the friction clutch is the sliding friction stage, and ideally, when the clutch reaches synchronization, that is, the moment when the temperature is the highest.
3. Results and Verification
3.1. The Simulation Results of the Engagement Characteristics of Dry Friction Clutch
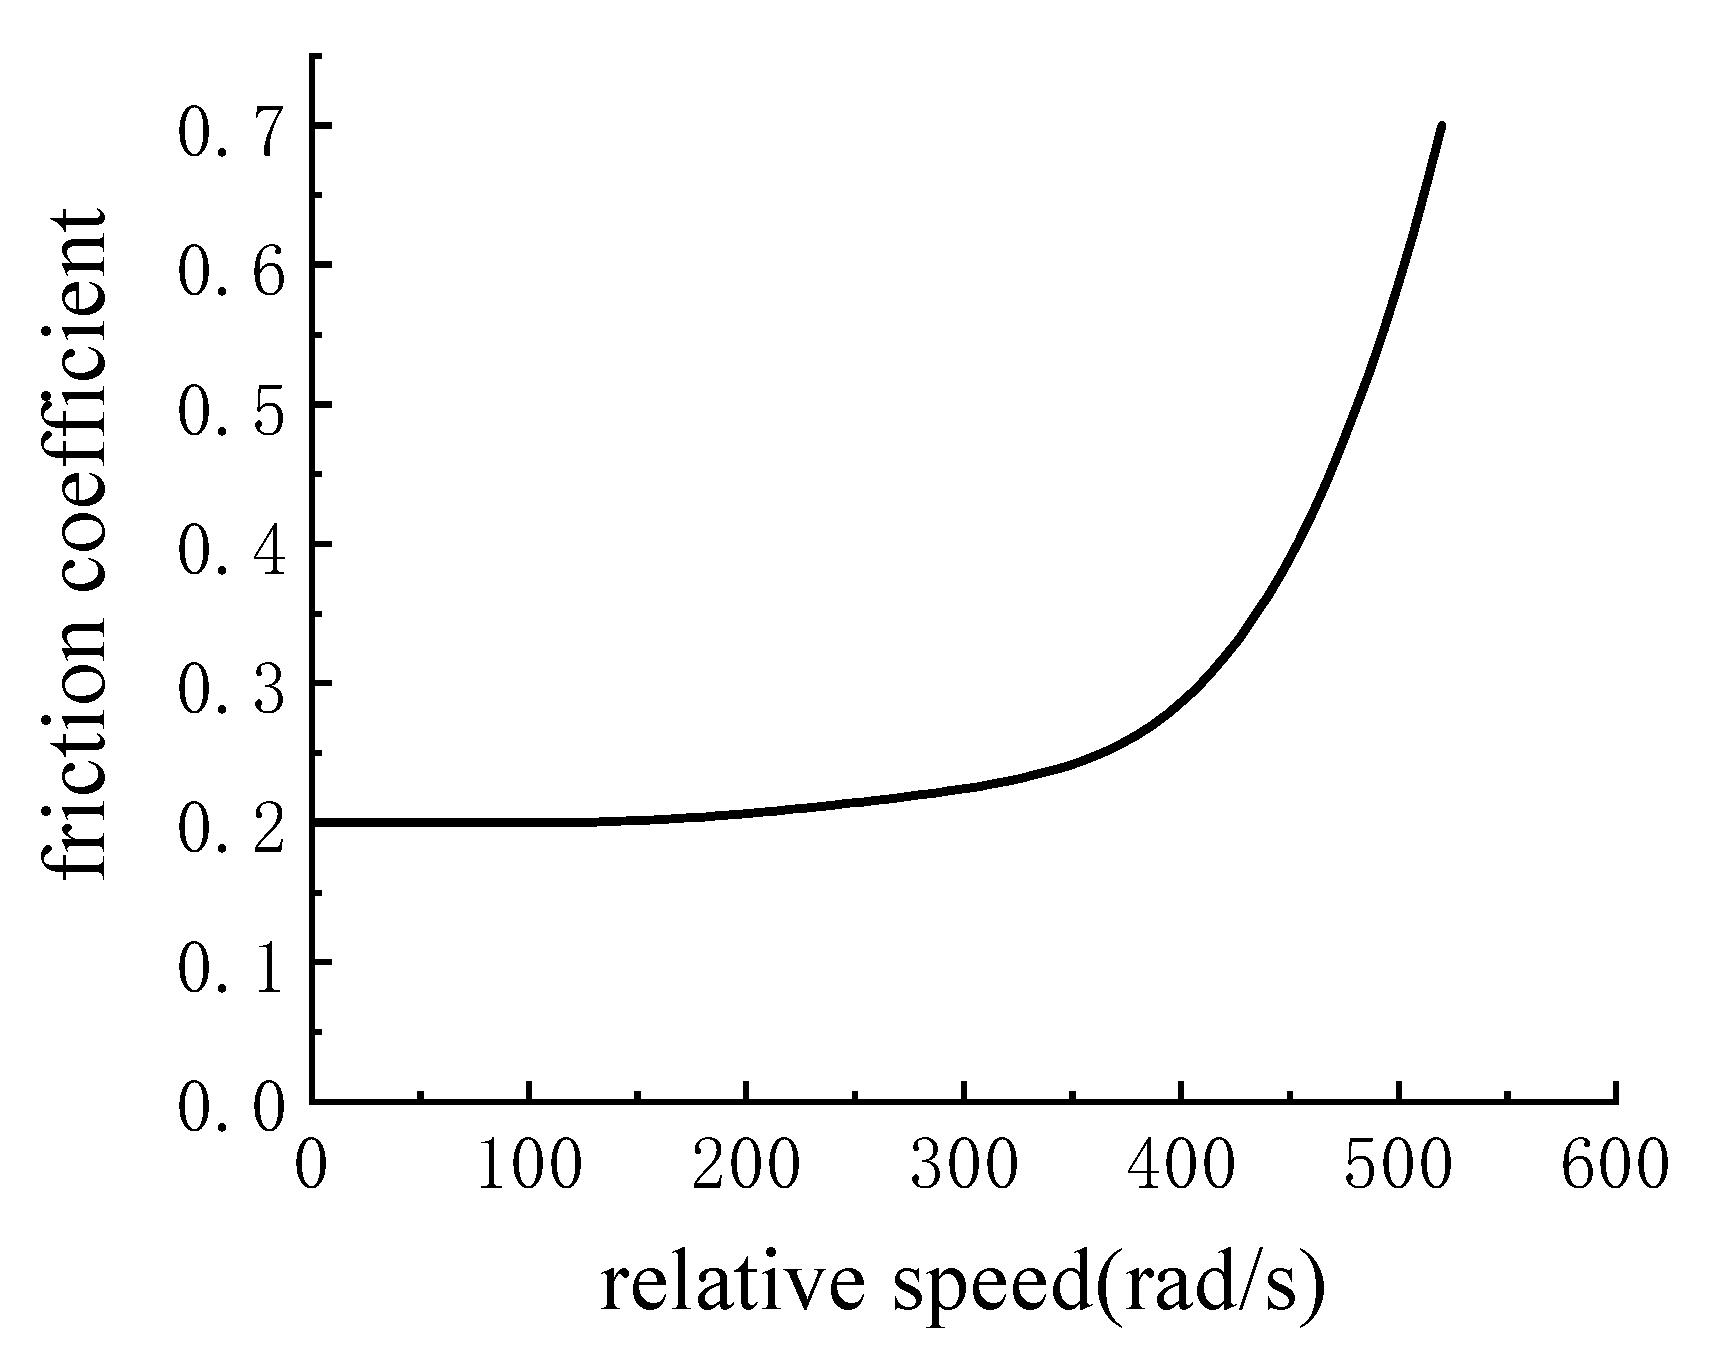
The friction coefficient of the carbon-carbon friction plate of the high-speed dry friction clutch for aviation is greatly affected by the relative rotation speed. Combined with the relevant experimental research and data, it can be seen that [18,19]: With the engagement of the friction clutch, the carbon-carbon friction plate wears debris. When the friction film falls off to form a friction film, the friction coefficient will drop rapidly and become stable when the friction film is completely formed. Therefore, according to the physical properties of the carbon-carbon friction plate used in this paper, the change curve of the friction coefficient with the relative rotational speed is set as shown in Figure 8.
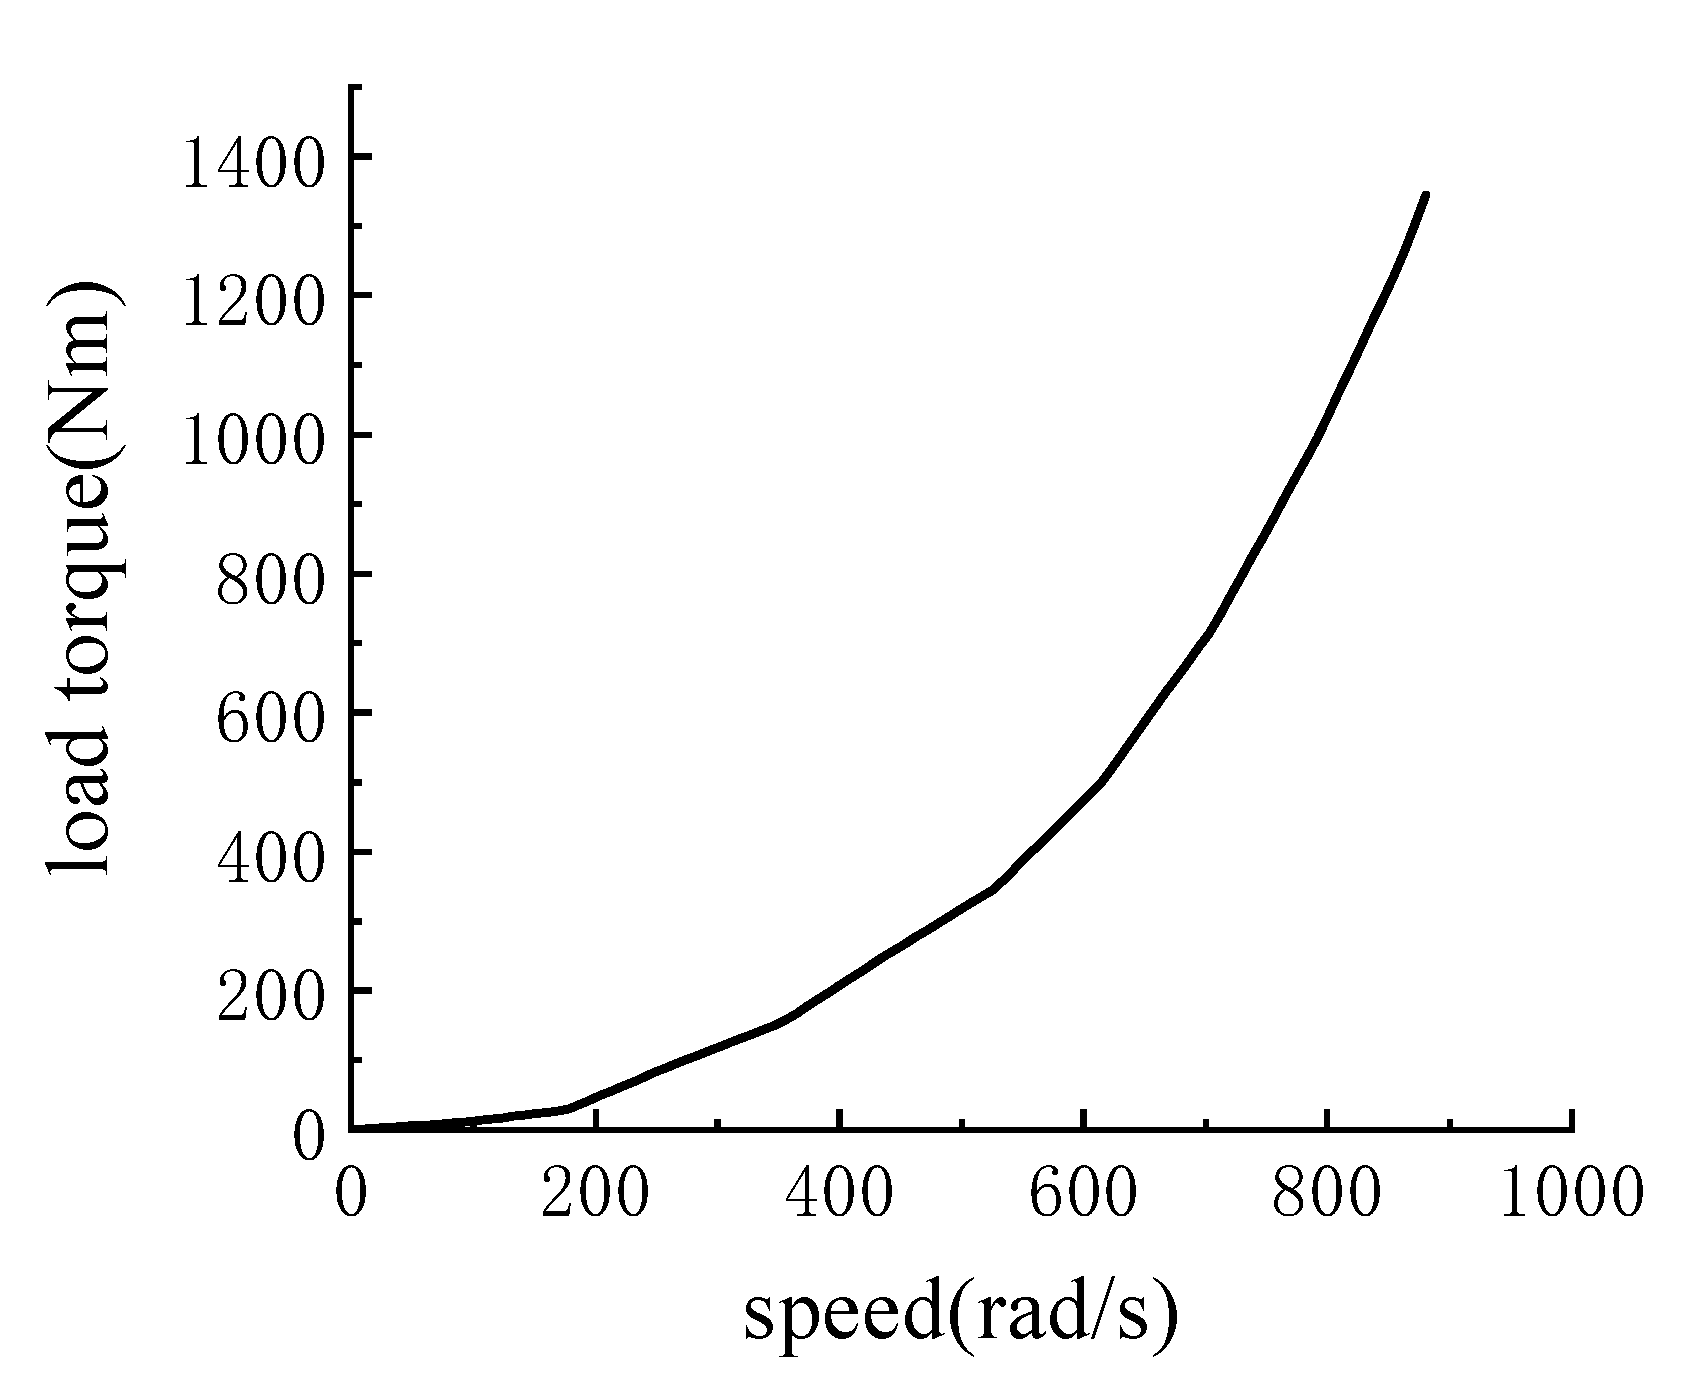
The torque received by the clutch-driven end comes from the lift fan. The experimental system of the lift fan mainly includes an electric motor, lift fan, rotation speed sensor, and torque sensor. The experimental steps are as follows: (1) Start electric motor. (2) Maintain rotation speed at a certain value. (3) Read the measurement results of rotation speed and torque speed. (4) Increase the rotation speed of electric motor. (5) Repeat step 1. Then, the relationship between the rotation speed and load torque can be acquired.
The torque received by the lift fan when it rotates is directly related to the speed of the fan. Through the relevant lift fan test experiments, the data of the clutch-driven shaft speed and load torque are measured. Through the interpolation method, the relation curve between load torque and rotational speed can be obtained, as shown in Figure 9.
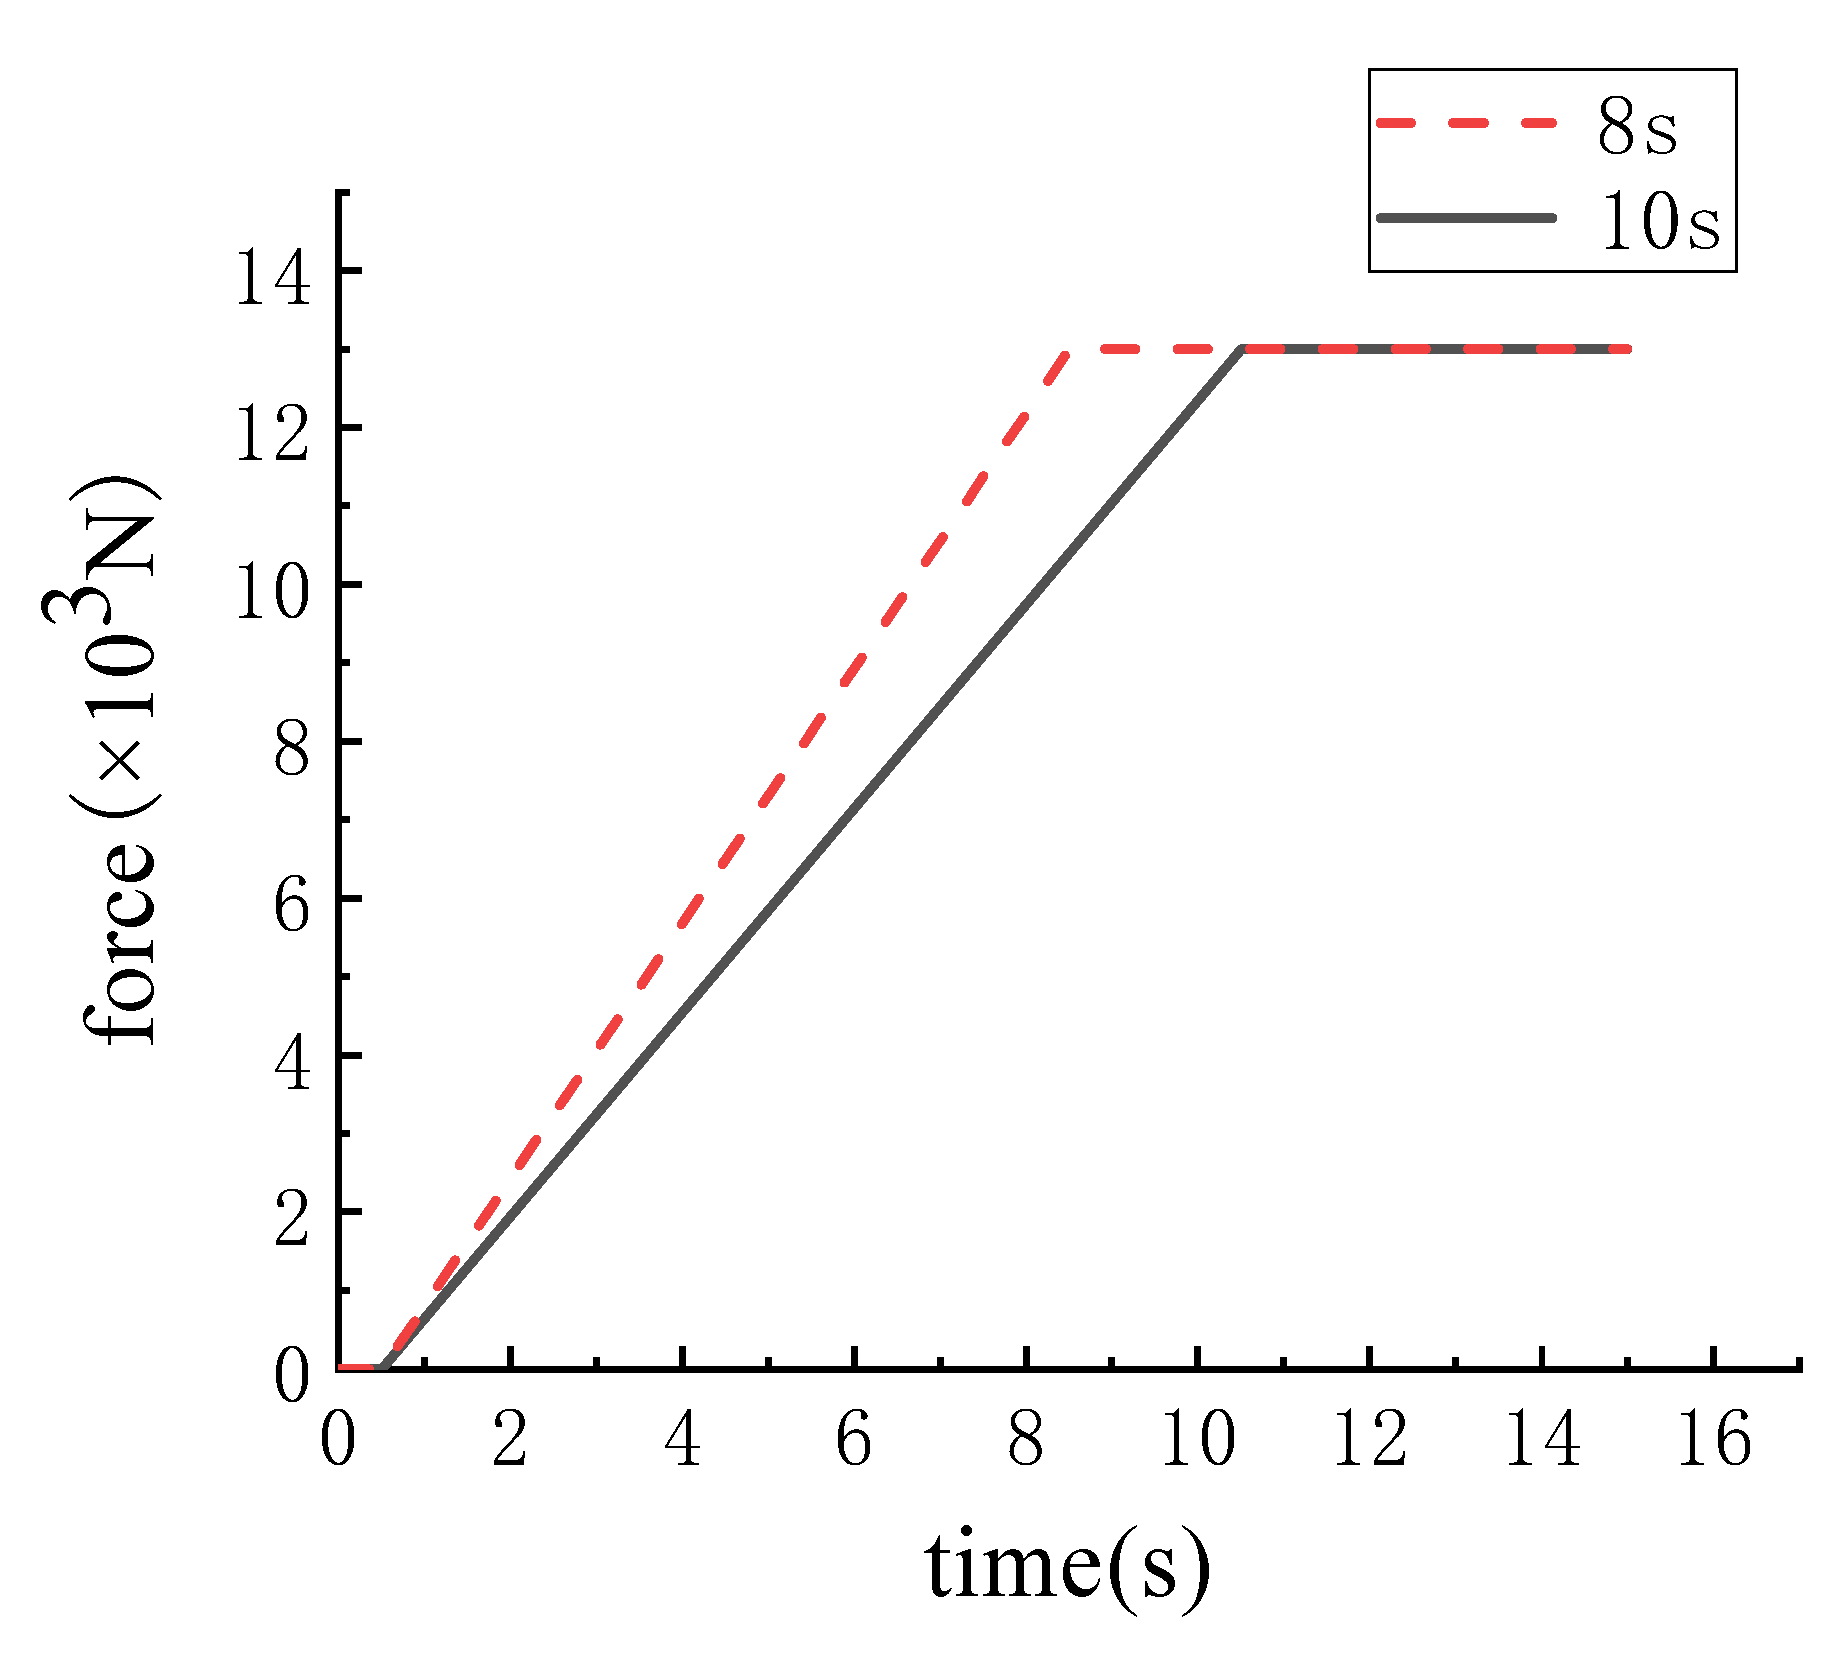
In the actual flight state transition of the short take-off/vertical take-off and landing aircraft propulsion system, the clutch engagement pressure is 5.9 MPa (13,000 N), and the engine speed is 4920 rpm (520 rad/s). Therefore, the dynamic simulation analysis of the clutch is carried out under this working condition, and the engagement pressure, friction coefficient, and load torque are input in the simulation model. Among them, the engagement pressure is set to the traditional fixed slope loading form as shown in Figure 10, and the rise time of engagement pressure is 10 s and 8 s respectively.
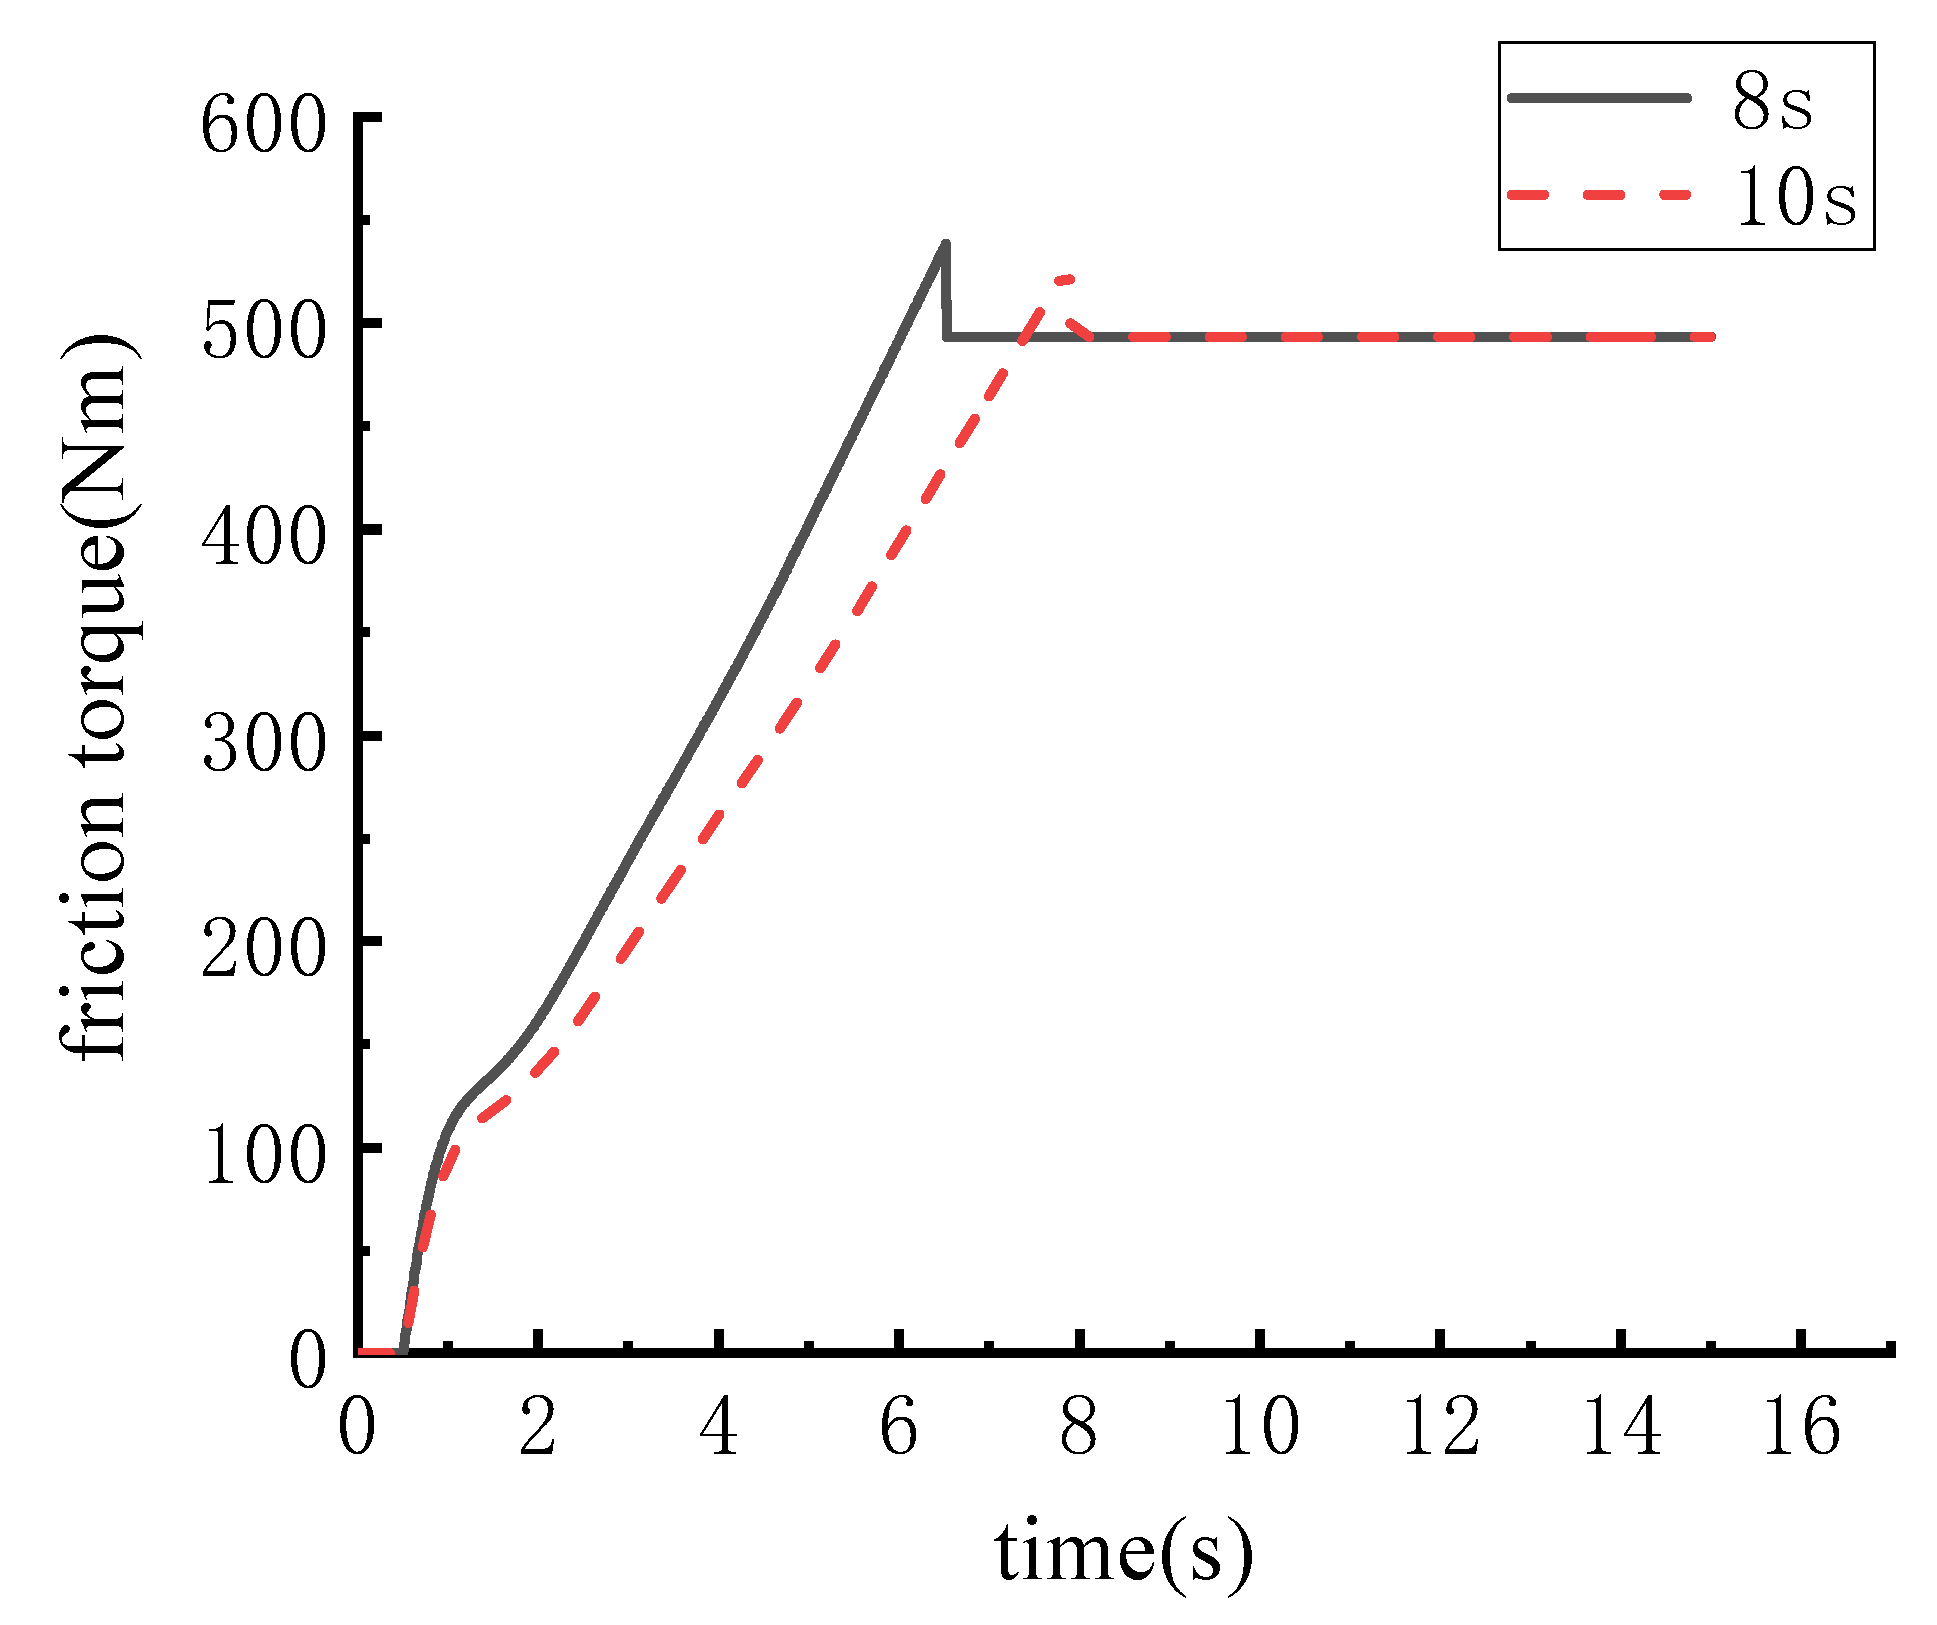
Through the dynamic simulation analysis, the dynamic characteristics of the clutch under the traditional fixed-slope engagement pressure load are obtained, and its speed curve is shown in Figure 11. The variation trend of the clutch friction torque is shown in Figure 12.
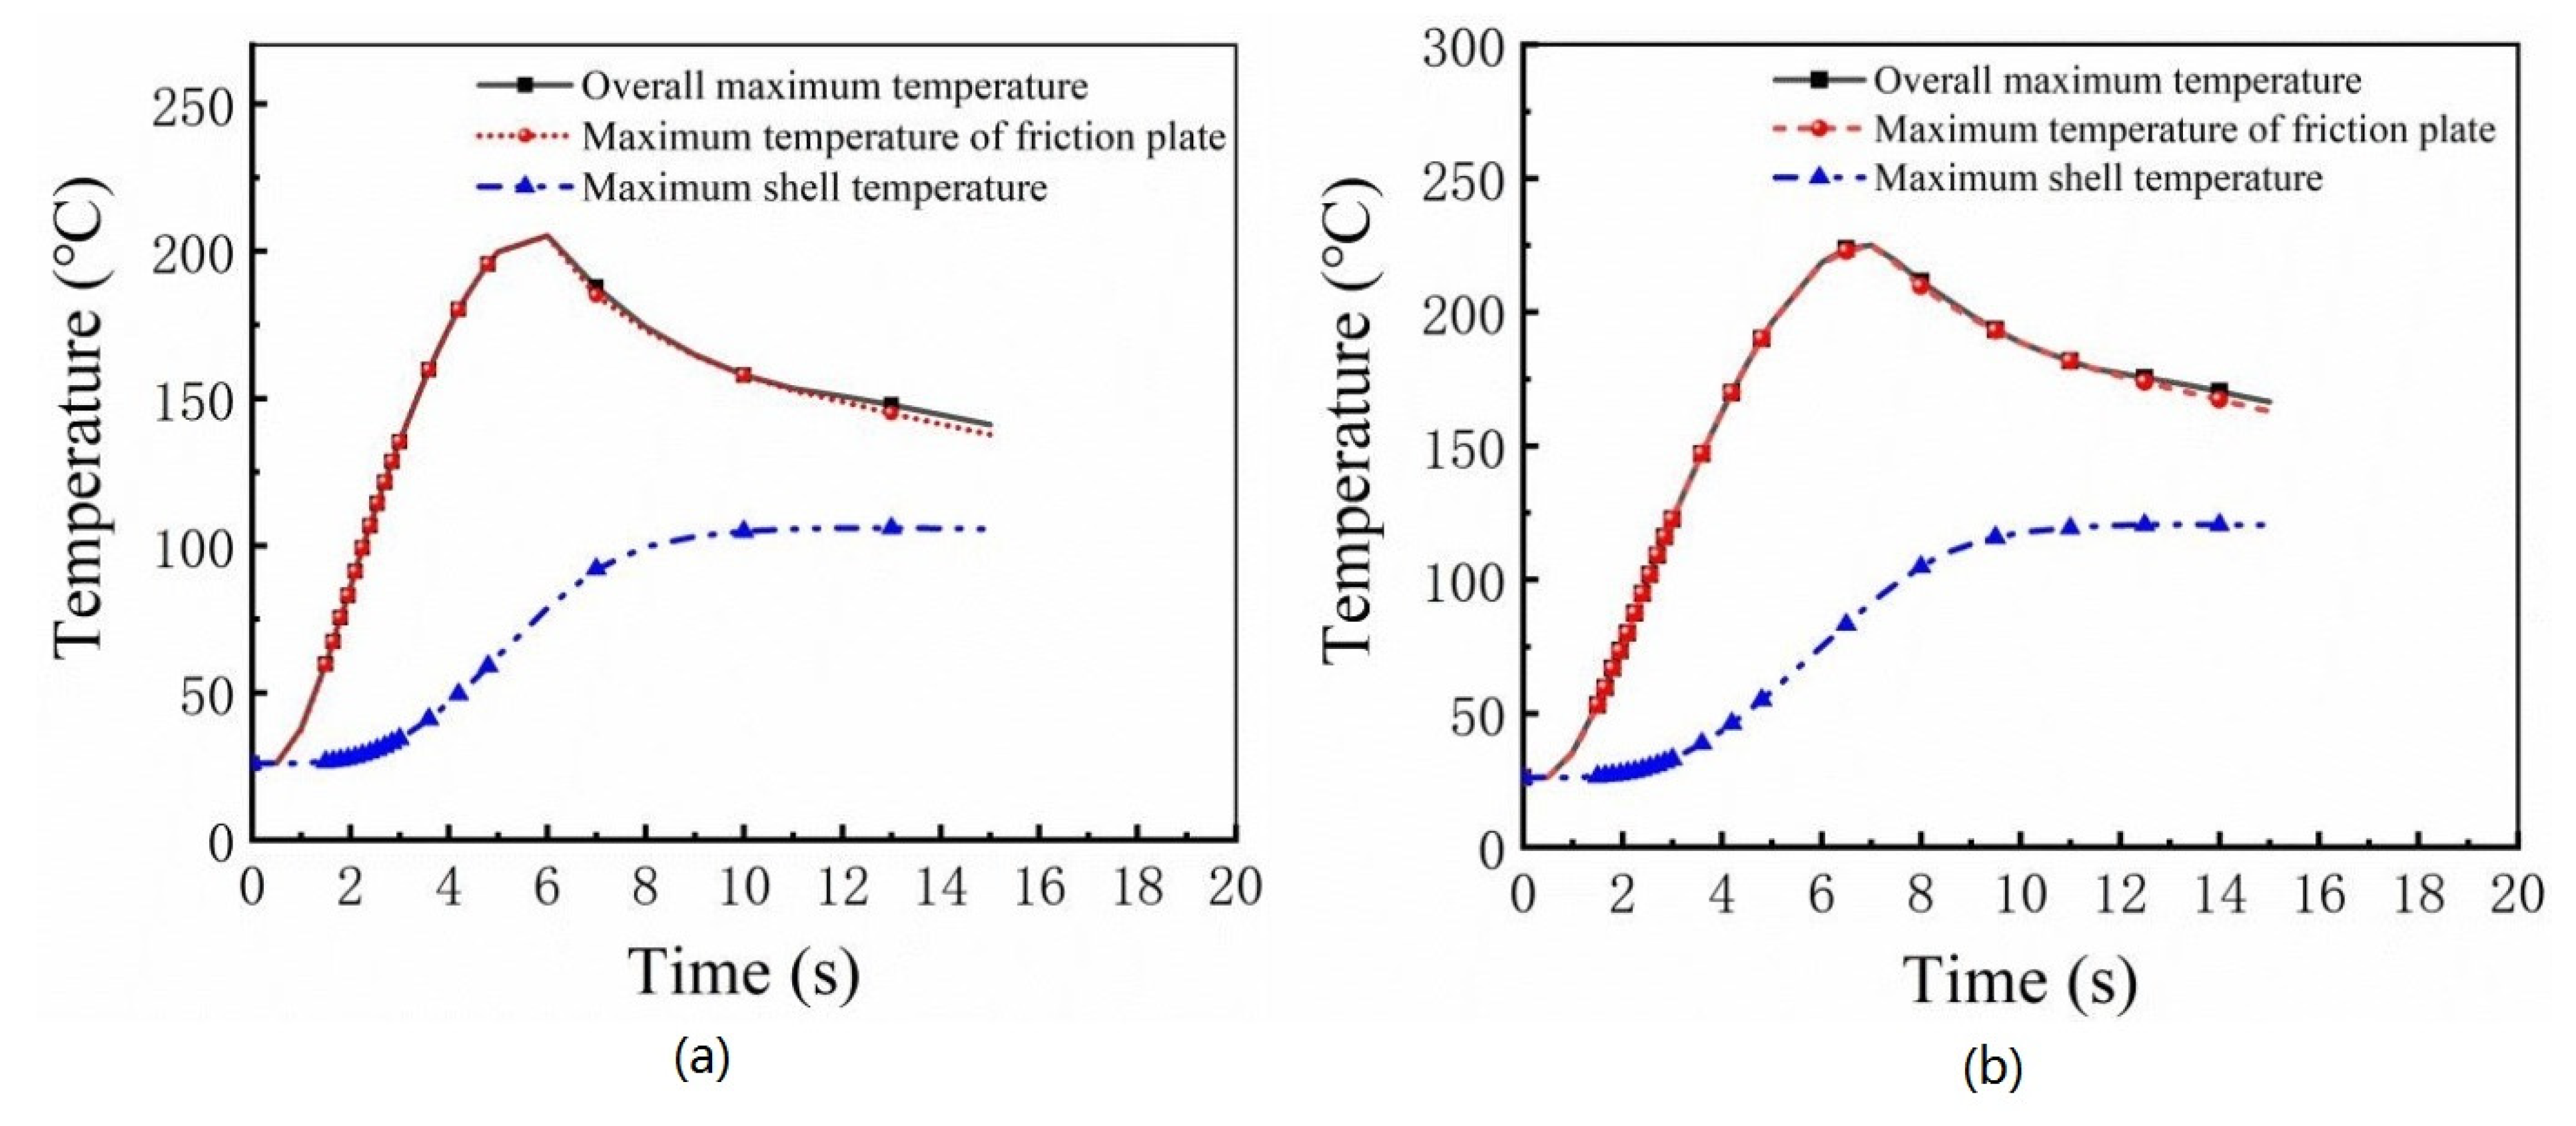
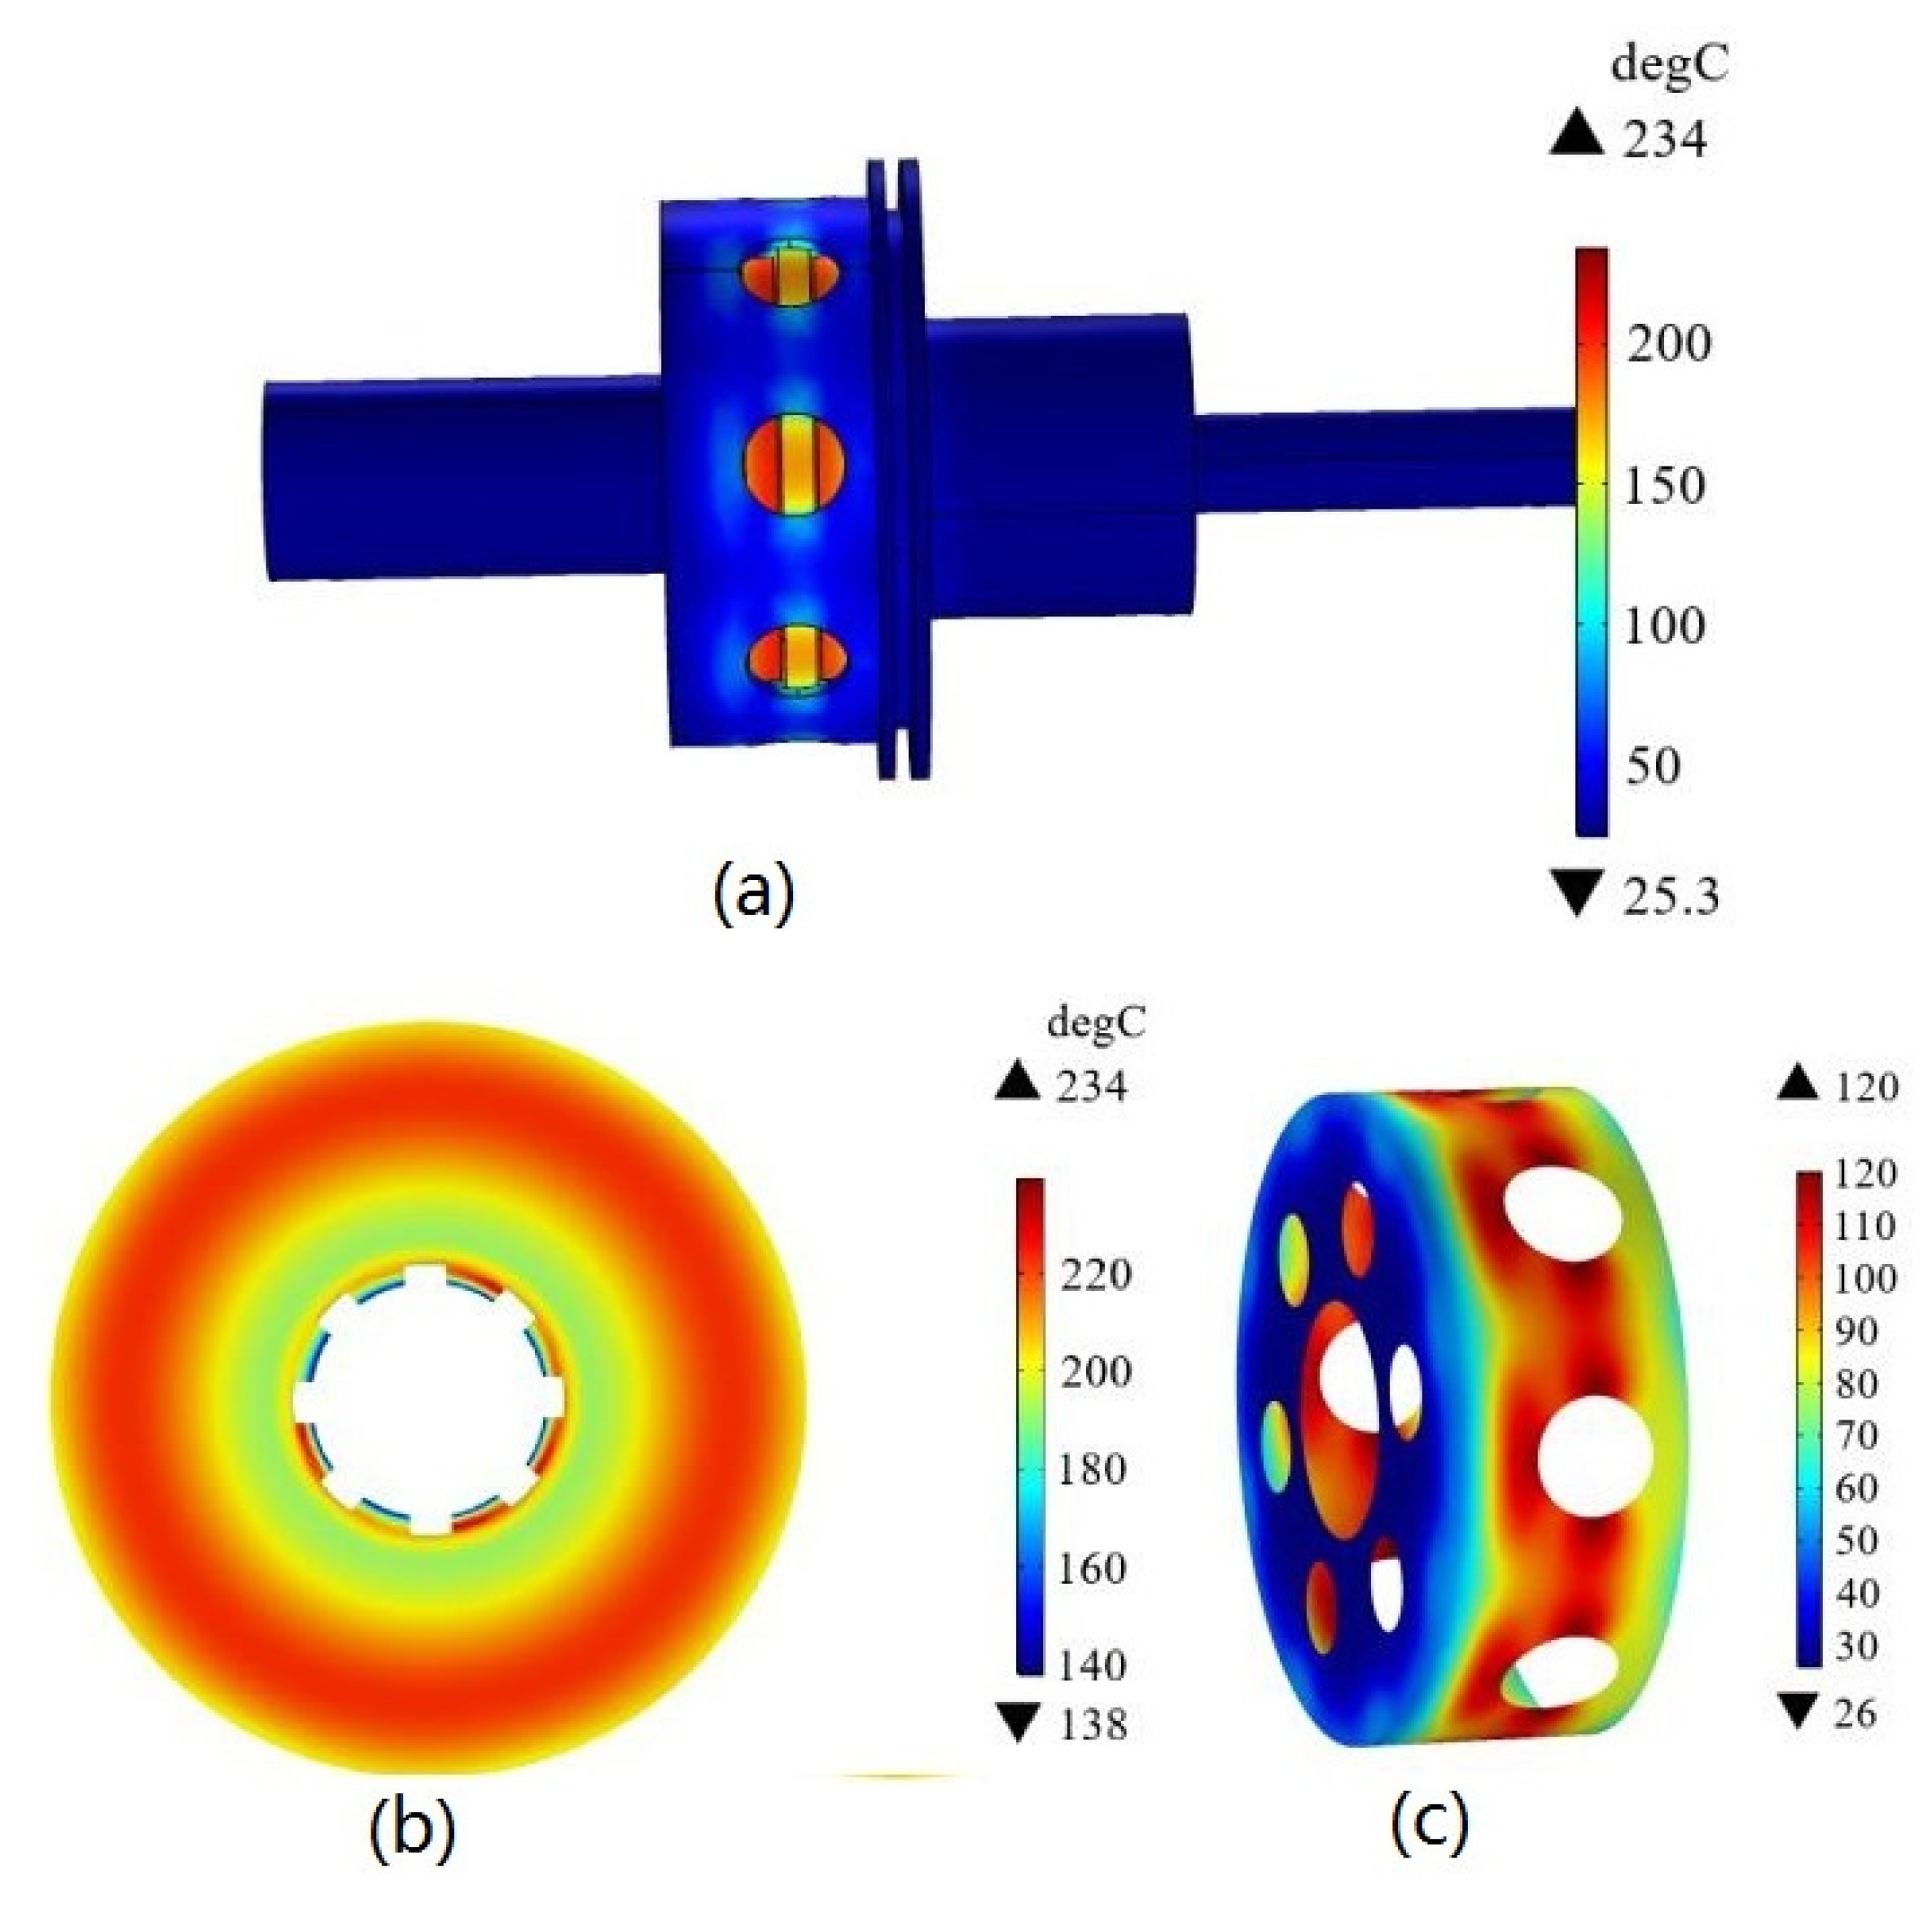
In this study, the finite element method and COMSOL simulation software were used for temperature simulation. The simulation temperature field is a transient temperature field. The time step is 0.05 s. The temperature field characteristic results are shown in Figure 13a. Figure 13b shows the temperature field model of the whole clutch, friction plate, and clutch shell when the engagement pressure rise time is 10 s.
In Figure 14a, it can be seen that the friction plate is the position with the highest temperature in the entire clutch, followed by the position close to the friction plate in the shell.
Figure 14b shows the simulational temperature distribution on the friction plate. It can be seen that the temperature increases and then decreases along the radius direction of the friction plate. The maximum temperature is 234 °C, which is located near the outer circle of the friction plate contact surface. This is attributed to the fact that the relatively linear velocity increases with the increasing of the radius. The friction heat is directly correlated with the linear velocity. The cylindrical surface of the friction plate contacts with air, which results in a certain extent temperature decreasing due to thermal radiation. Due to the high speed difference of the friction plate, the temperature distribution on the bottom surface is not verified by the experiment. Some temperature measurement on the cylindrical surface of the friction plate is carried out to evaluate the precision of the thermal model.
Figure 14c shows the simulation results of the temperature field of the clutch housing. It can be seen that the maximum temperature of the housing is close to the position where it is in direct contact with the friction plate, and the maximum temperature of the shell reaches 120 °C.
3.2. The Verification of Dynamics Model and Temperature Model
3.2.1. Dynamic Model
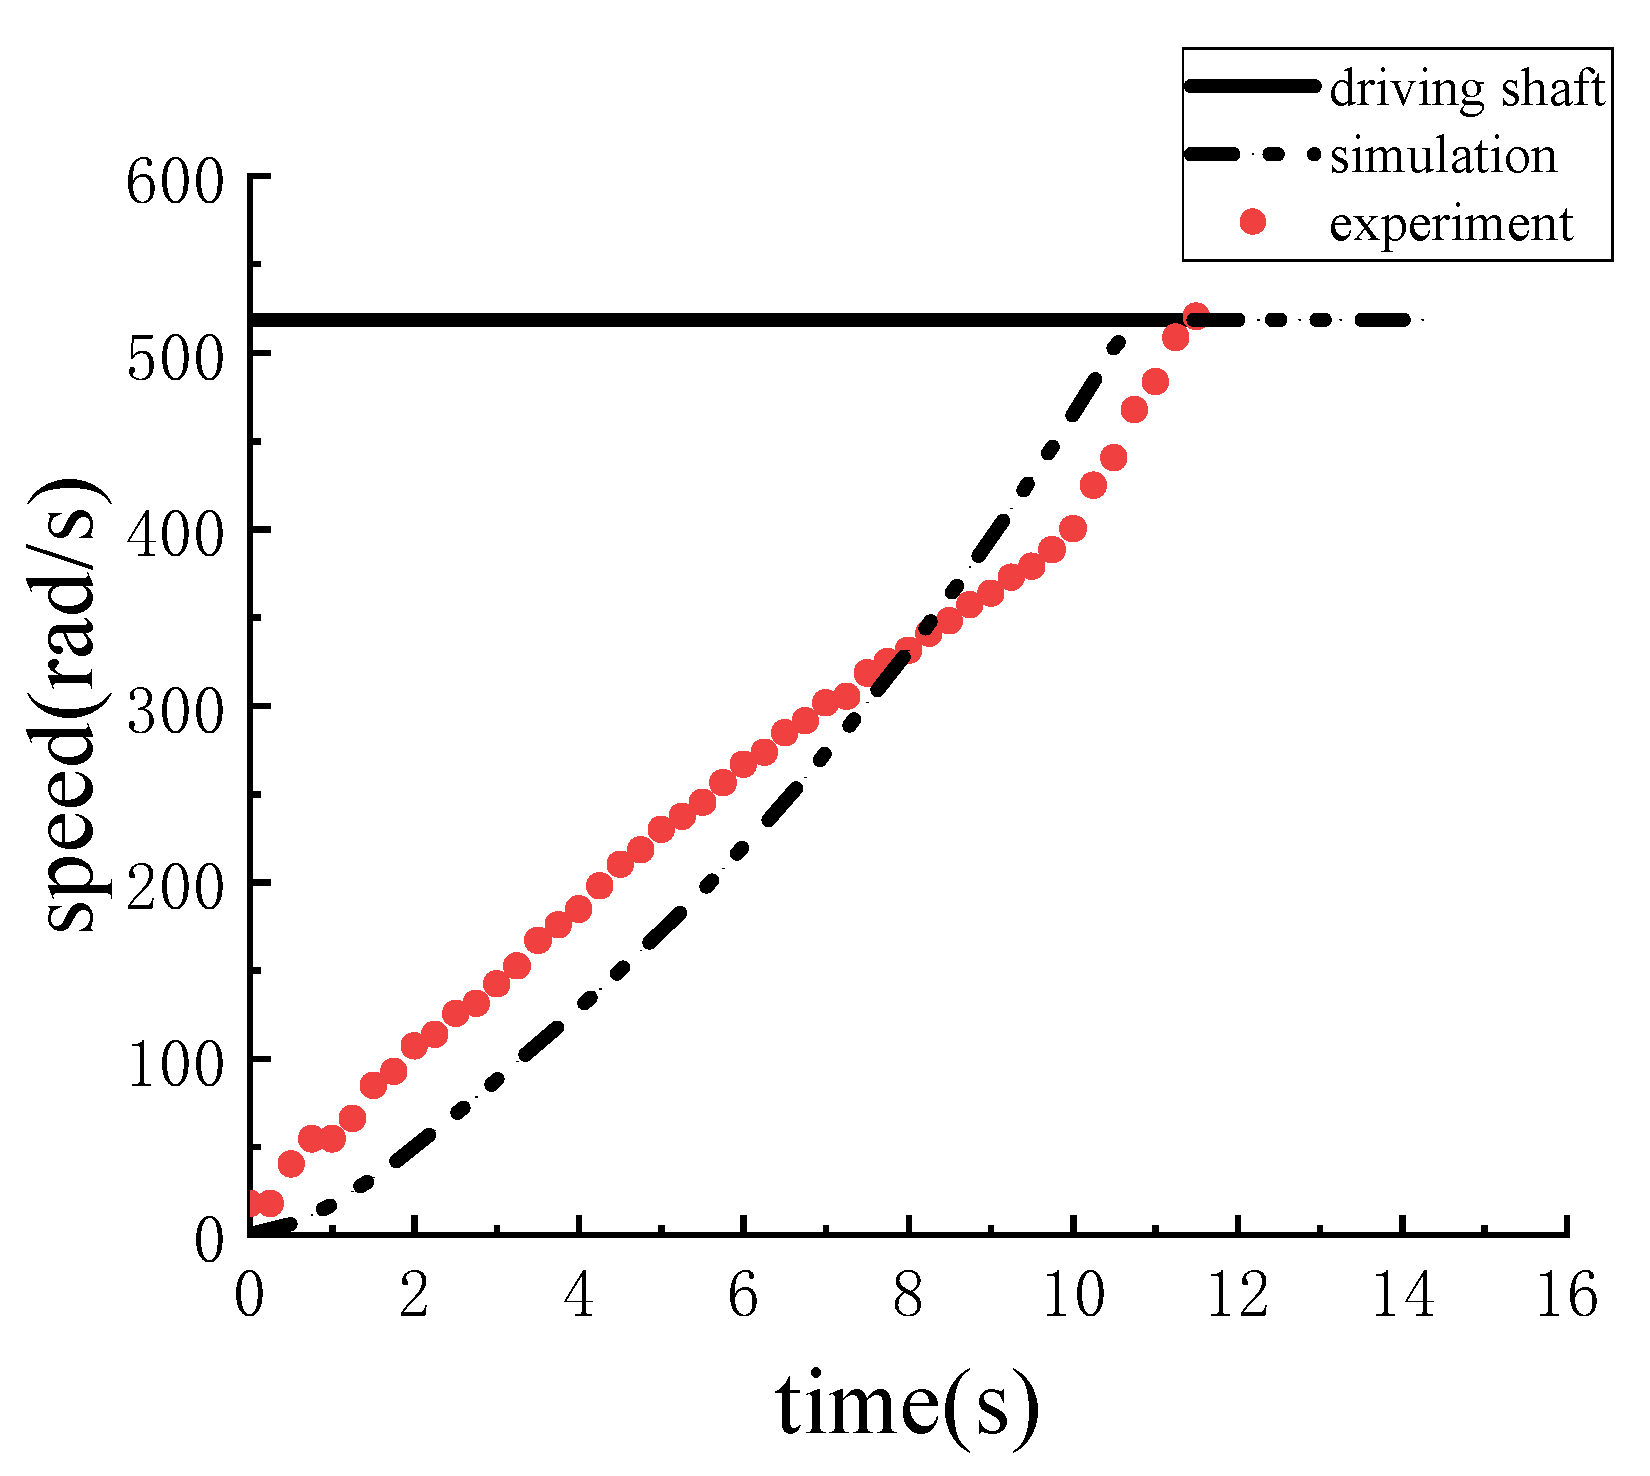
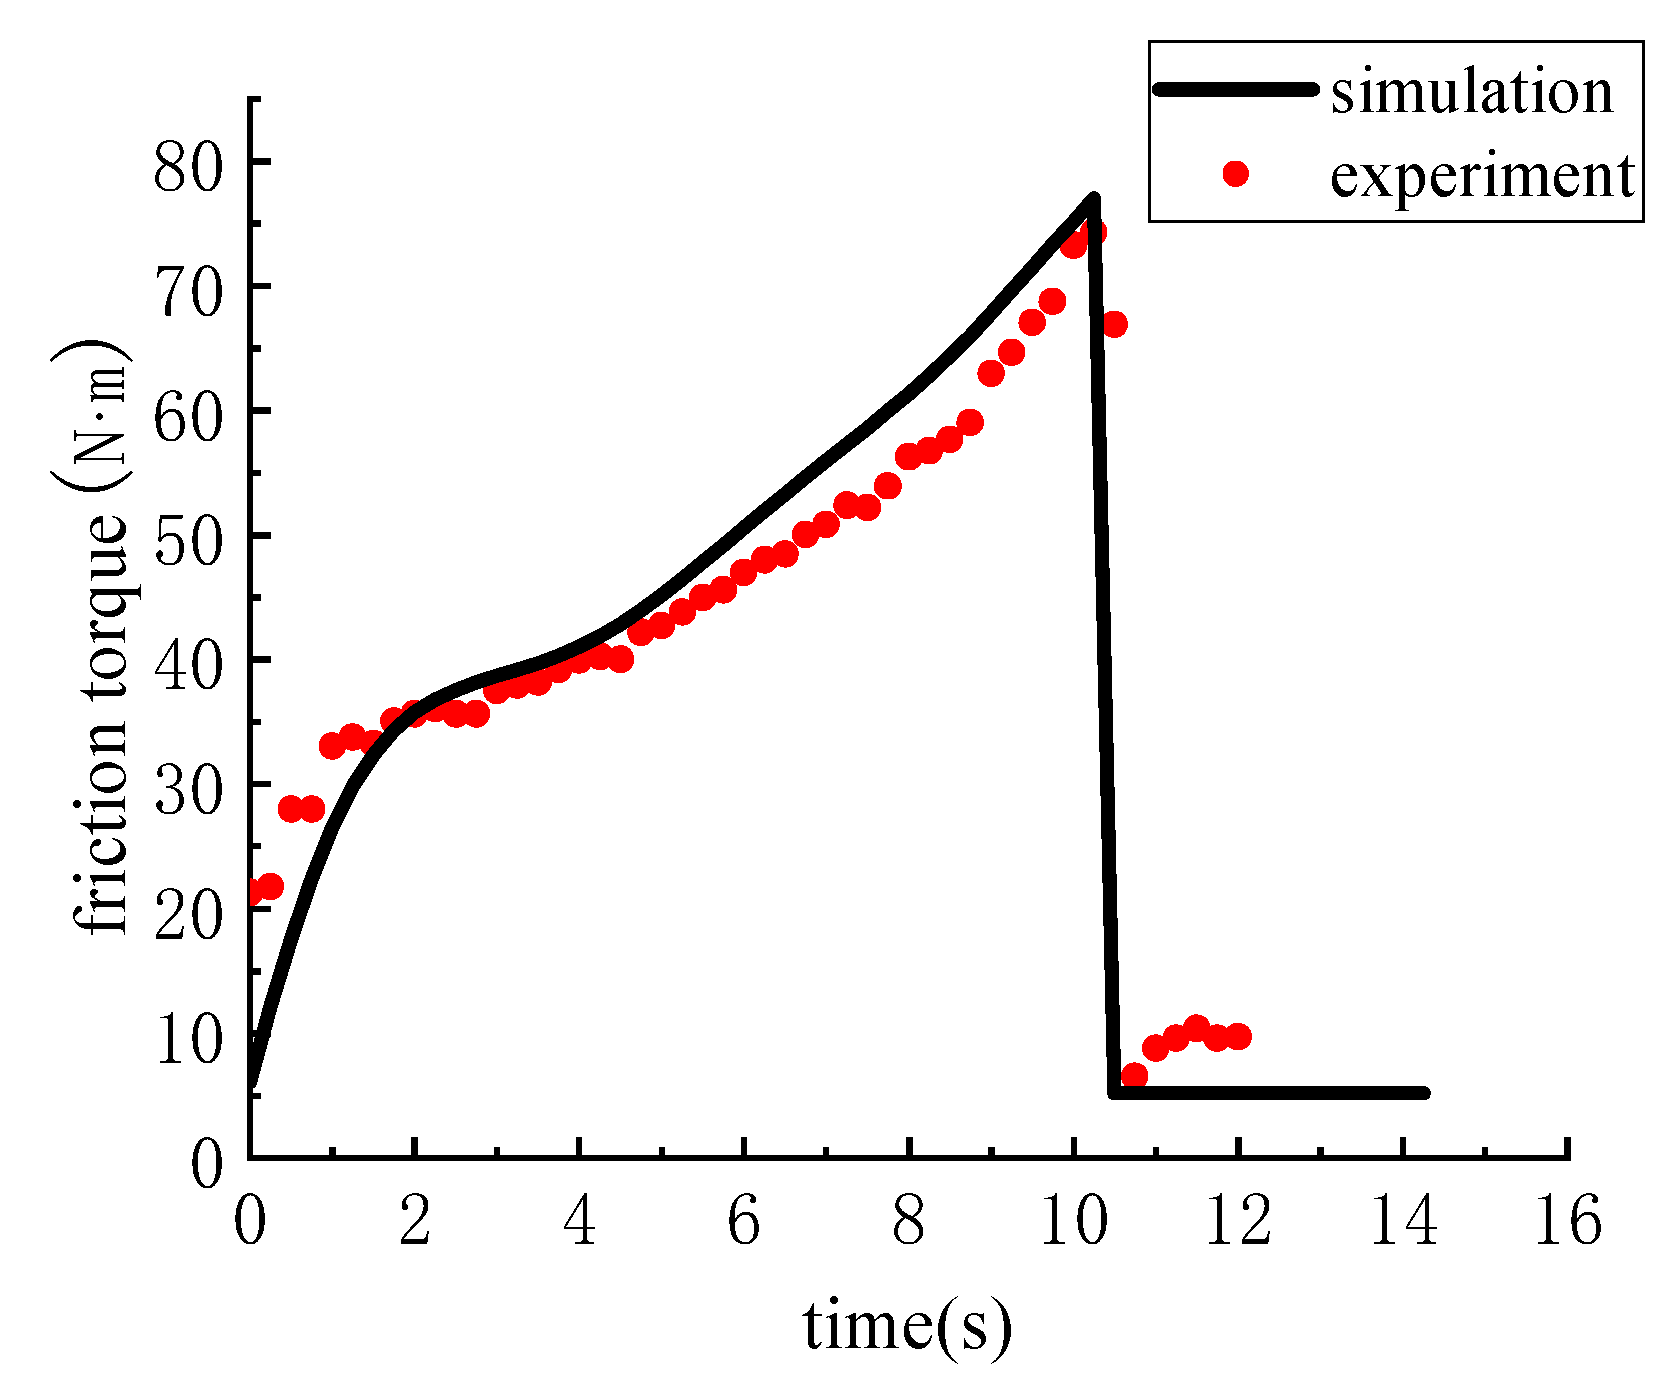
The simulation results and test results are shown in Figure 15 and Figure 16. In the test, the clutch engagement time is 10.5 s and the impact torque is 74 Nm. In the dynamic simulation, it is 11.5 s and the impact torque is 77 Nm. It can be seen that the relative error of the engagement time is 10%, and the relative error of the impact torque is 4%, indicating that the established clutch dynamics model is reliable.
3.2.2. Temperature Model
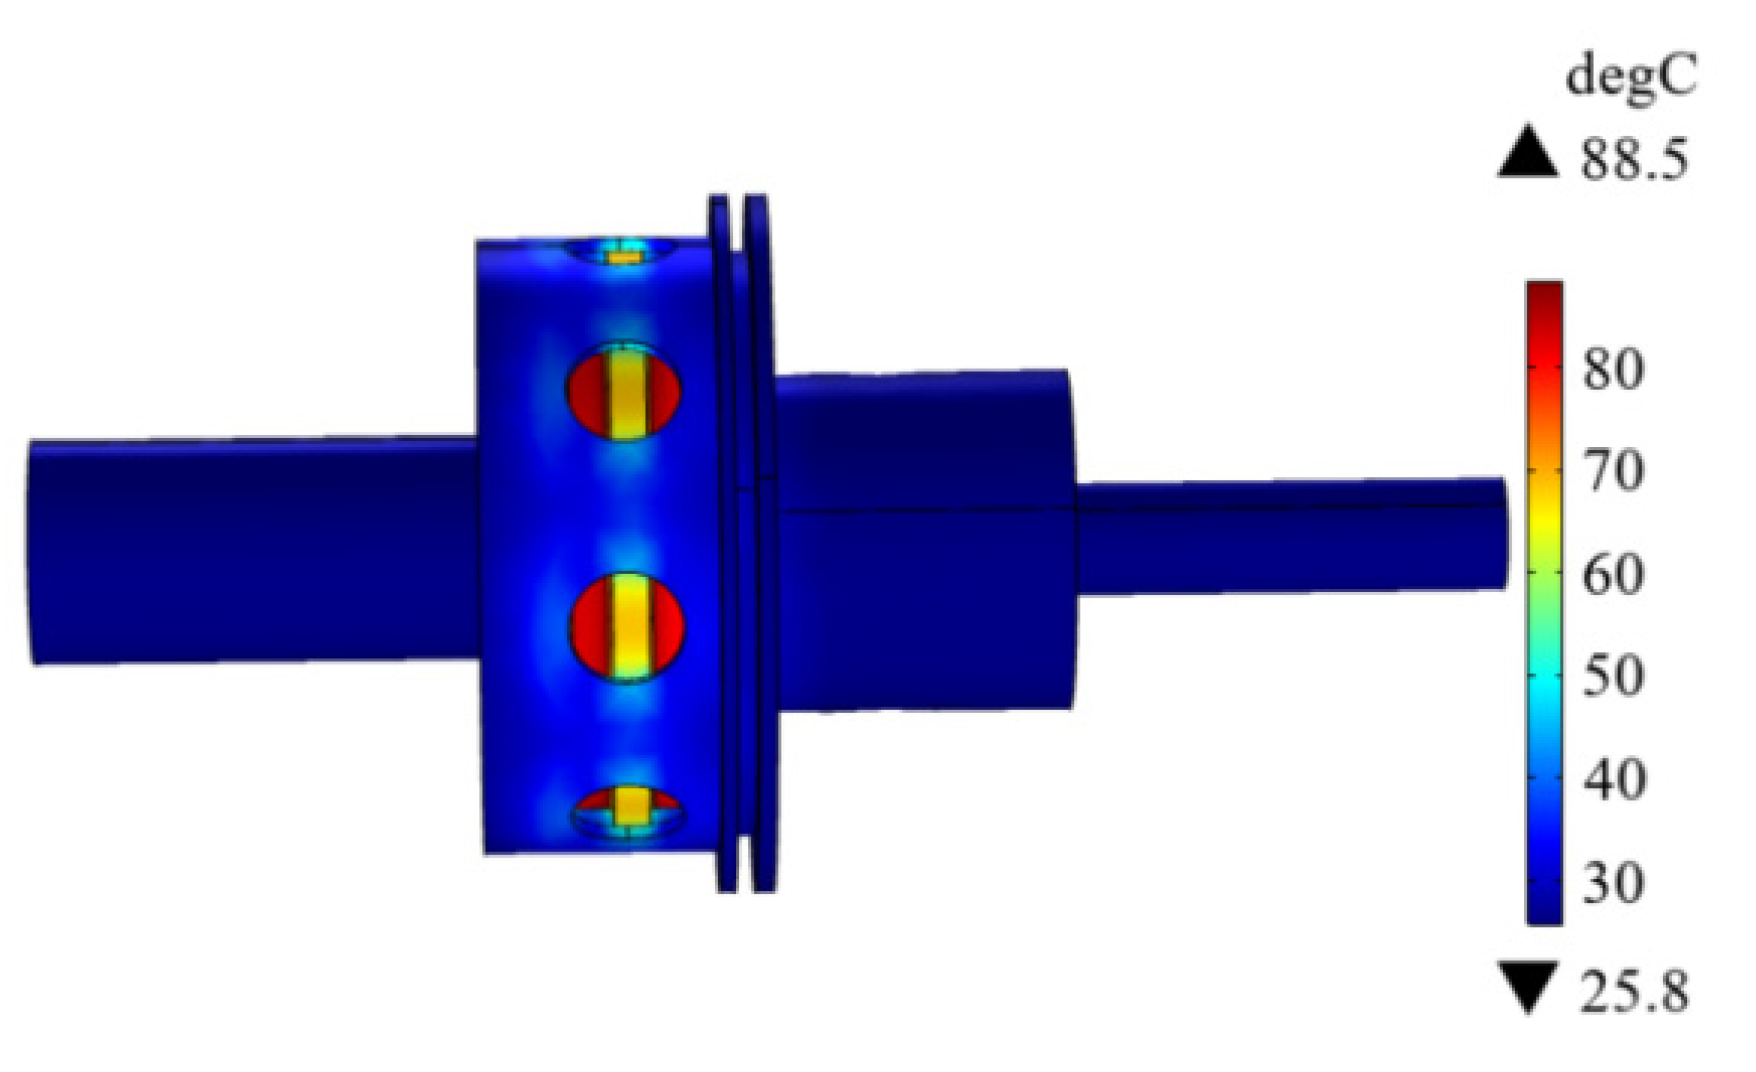
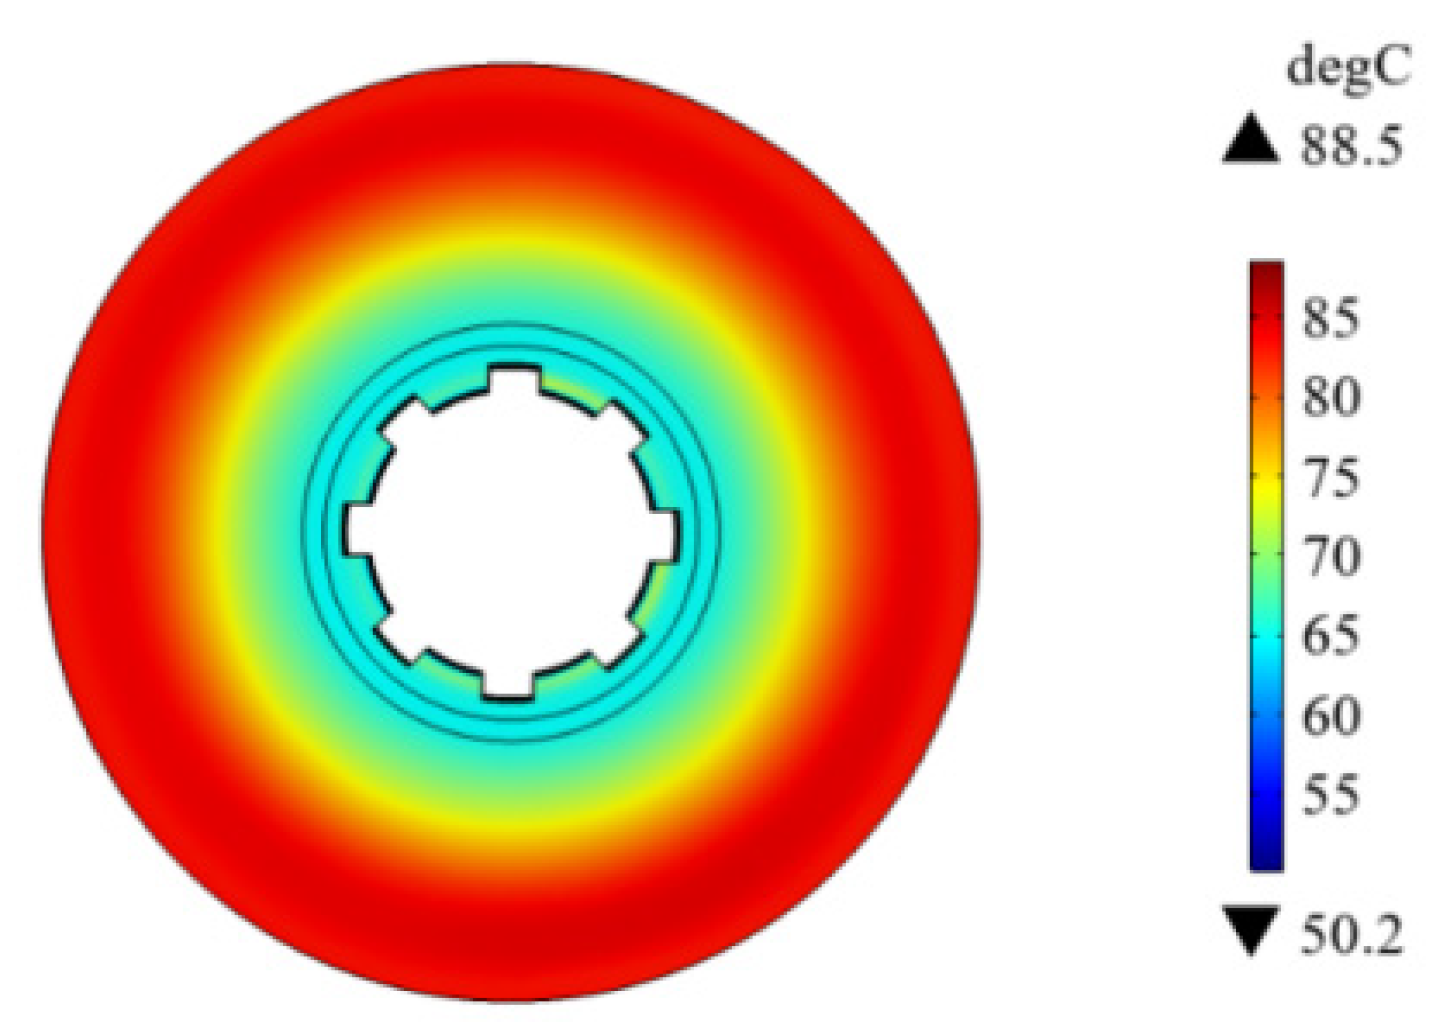
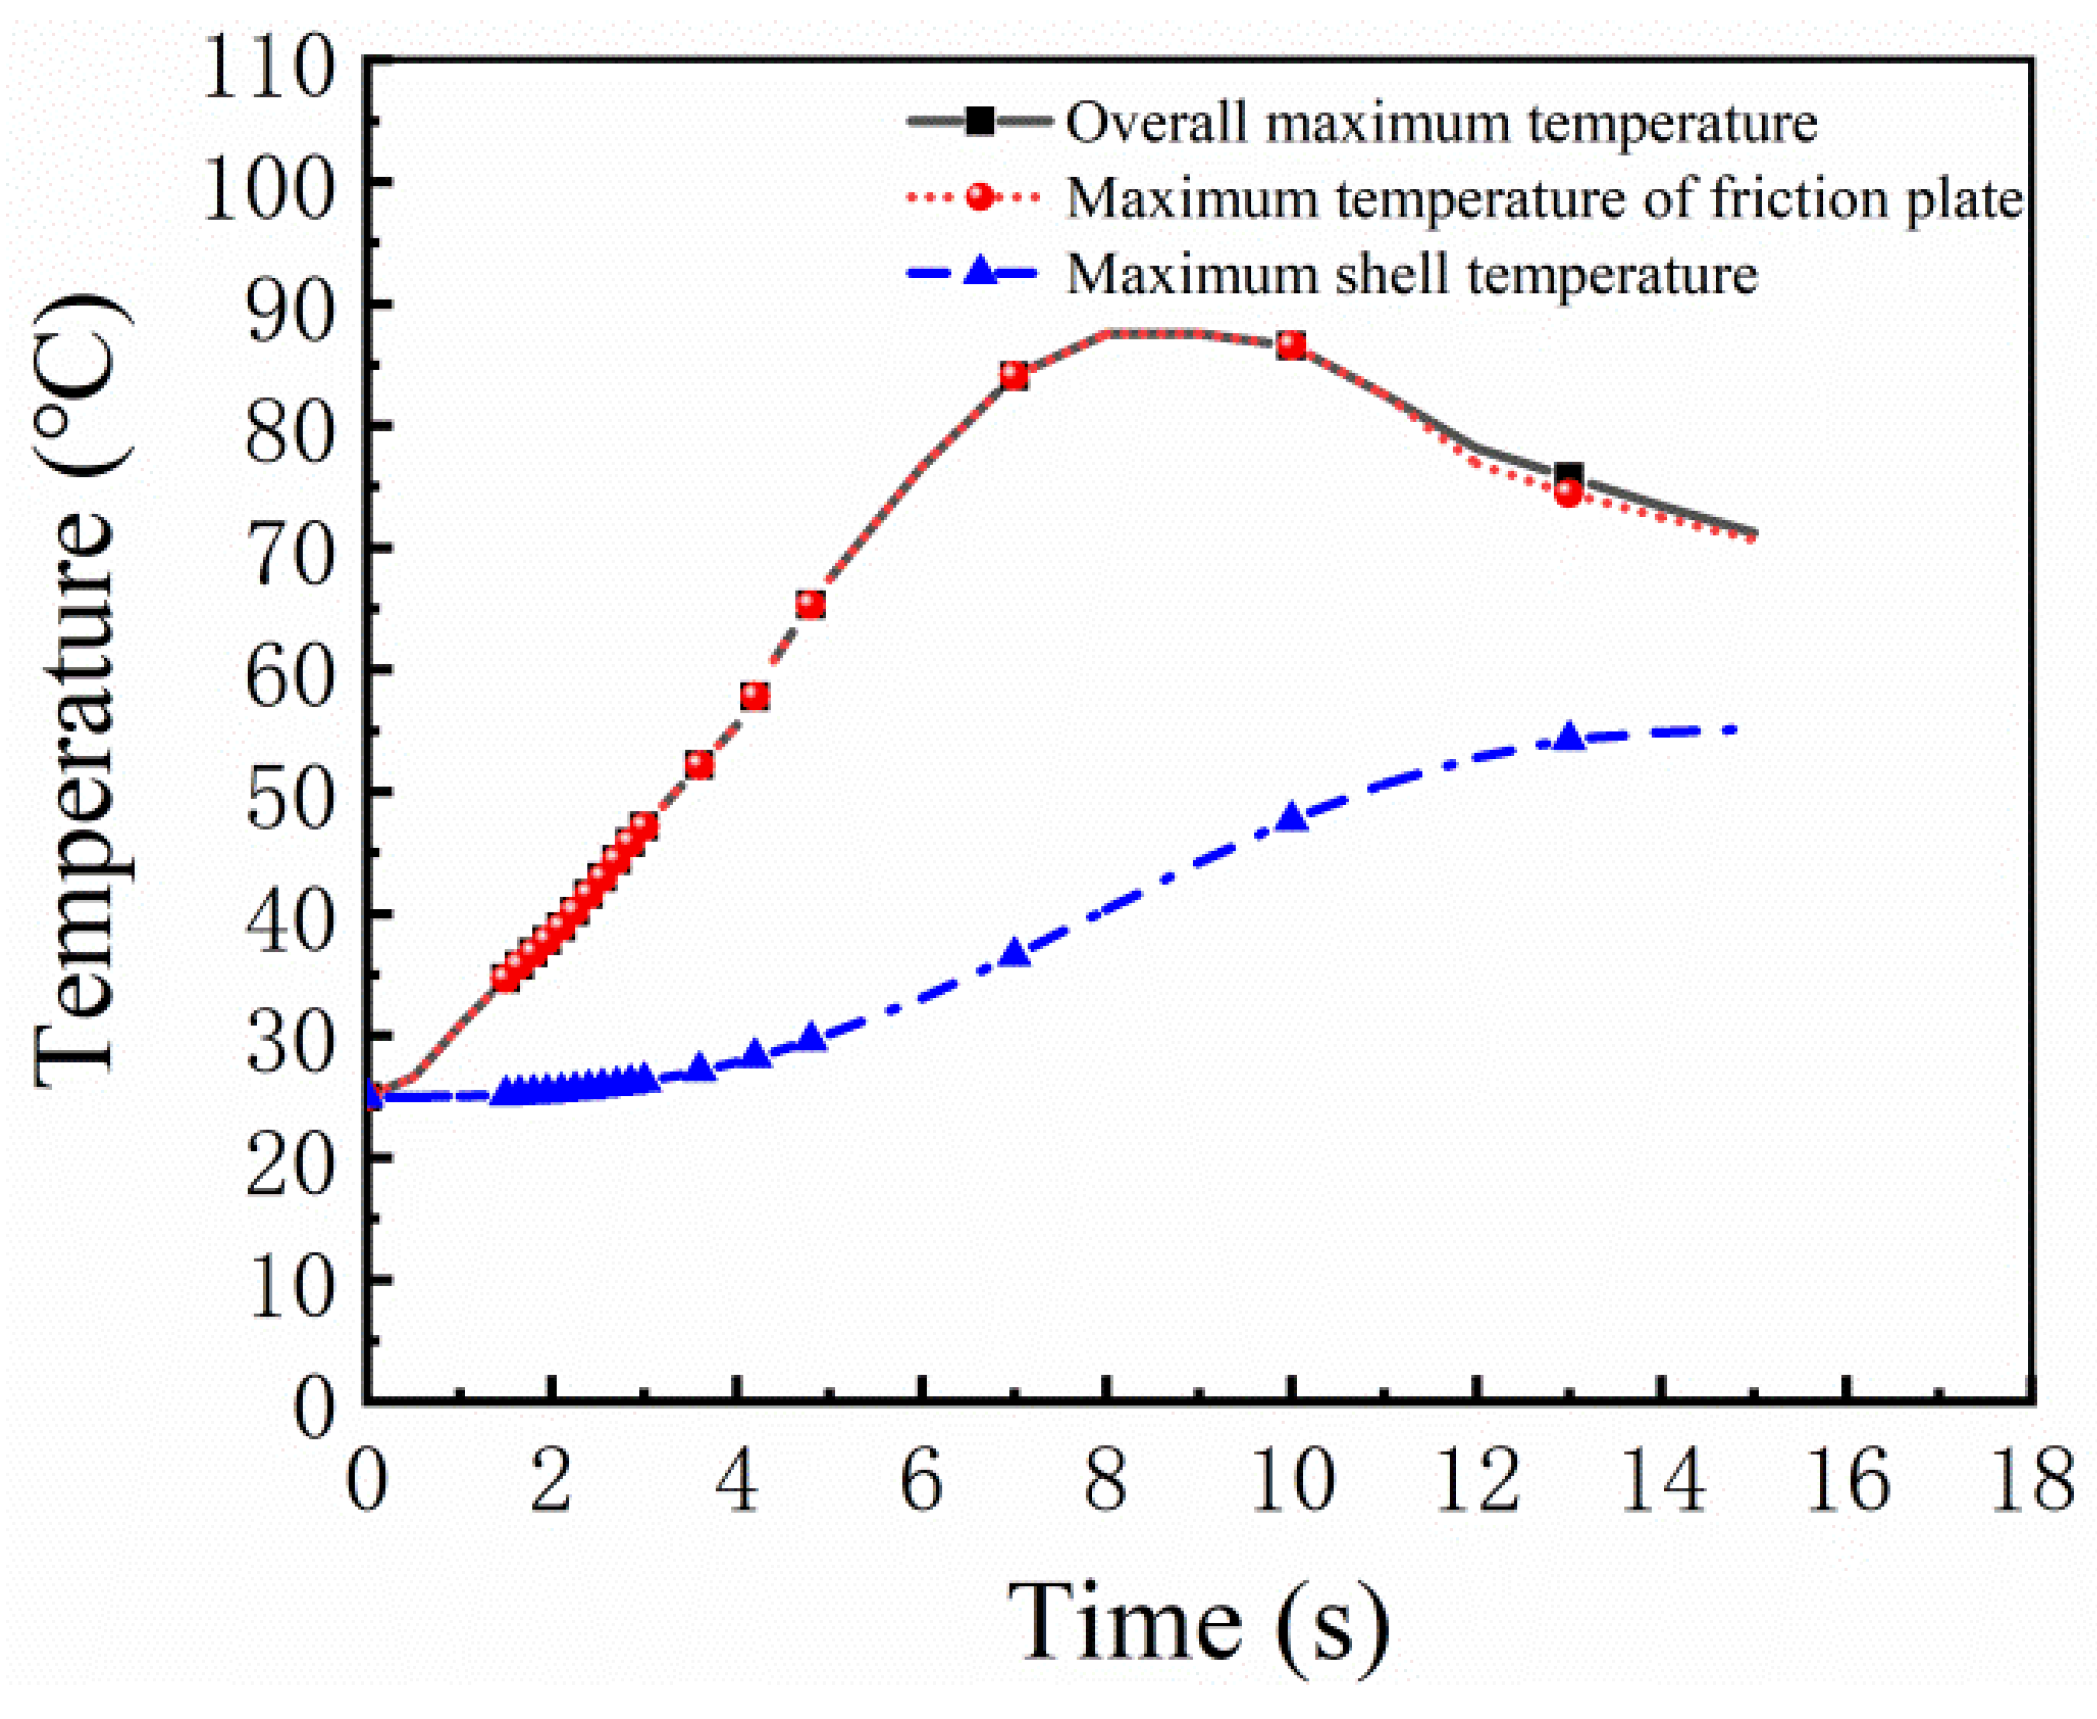
By establishing a temperature field model, the temperature field characteristics of the clutch during the engagement process are simulated and analyzed. The simulation results are shown in Figure 17 and Figure 18, which are the results of the temperature field at the time of clutch engagement. Figure 17 and Figure 18 show that the highest temperature occurs on the friction plate, which is up to 88.5 °C. The temperature of the clutch shell close to the friction plate is between 40 and 60 °C and it can be seen from Figure 17 that the area with the highest temperature on the friction plate is the outer ring of the friction plate because the linear velocity is the largest here, the sliding work is the most, and the temperature rise is the highest. Figure 19 is the temperature change curve of the clutch as a whole, the friction plate, and the clutch shell. Compared with Figure 15, it is known that due to the influence of the heat dissipation of the clutch, the temperature is the highest at the moment of engagement, but 1–2 s before the engagement, and then the temperature begins to gradually decrease.
During the test, the temperature could not be measured close to the friction lining due to the high clutch speed. Therefore, an infrared thermometer is used to detect the temperature of the clutch outside the test bench. In the temperature field simulation, the average temperature of the clutch housing area near the friction plate is collected as the simulation result. The temperature comparison curve between the test and the simulation is shown in Figure 20. It can be seen that the change trend of the temperature curve is basically the same, and the relative error is 4.3%, which proves that the predicted temperature basically conforms to the test results, and the established clutch temperature field simulation model is reliable.
4. Discussion
4.1. The Engagement Characteristics of the Traditional Fixed Slope Engagement Pressure
From Figure 11, it can be seen that: although the rise time of the engagement pressure is different, the overall change trend is similar. In the early stage of sliding friction, the friction coefficient is larger, and the speed of the output end increases rapidly. In the later stage of sliding friction, the increasing trend of the speed of the output end slows down due to the decrease in the friction coefficient. When the engagement pressure rise time is 10 s, the clutch is synchronized at 8 s. When the engagement pressure rise time is 8 s, the clutch is synchronized at 6.5 s. From Figure 12, it can be seen that the torque fluctuates due to the nonlinearity of the friction coefficient at the beginning of the engagement, and then rises steadily. The impact torque is the most obvious at the moment of engagement. When the engagement pressure rise time is 8 s, the maximum impact torque is 539 Nm. When the engagement pressure rise time is 10 s, the maximum impact torque is 529 Nm. Under the action of different engagement pressure rise times, the engagement time of the friction clutch is negatively correlated with the impact torque, and it is difficult to achieve the lowest value at the same time.
According to Figure 13, it can be observed that: from the overall trend, the rise time of the engagement pressure is 8 s and 10 s, and the maximum temperature curve of the clutch and the maximum temperature curve of the friction plate are almost coincident, indicating that the highest position of the clutch temperature is on the friction plate. In the early stage of engagement, the temperature rises rapidly, and when the temperature is near the engagement point, the temperature rise rate slows down and reaches the maximum value due to the decrease in the relative rotational speed. After that, the temperature gradually decreases due to the influence of heat radiation and heat conduction. When the engagement pressure rise time is 8 s, the maximum clutch temperature is 215 °C. When the engagement pressure rise time is 10 s, the maximum clutch temperature reaches 234 °C. Due to the influence of heat flux and heat radiation, the temperature of the clutch housing rises rapidly in the early stage, and after the clutch is engaged, the temperature tends to be flat. When the engagement pressure rise time is 8 s, the temperature is around 105 °C after 15 s. When the engagement pressure rise time is 10 s, the temperature is around 120 °C after 15 s.
It can be seen from the above analysis that reducing the slope of the engagement pressure can reduce the clutch engagement time, thereby reducing the heat generated by the clutch during the engagement process and reducing the overall temperature of the clutch. However, this will increase the friction torque and reduce the stability of the clutch.
4.2. The Variable Slope Engagement Pressure Loading
4.2.1. The Engagement Characteristics of the Variable Slope Engagement Pressure Loading
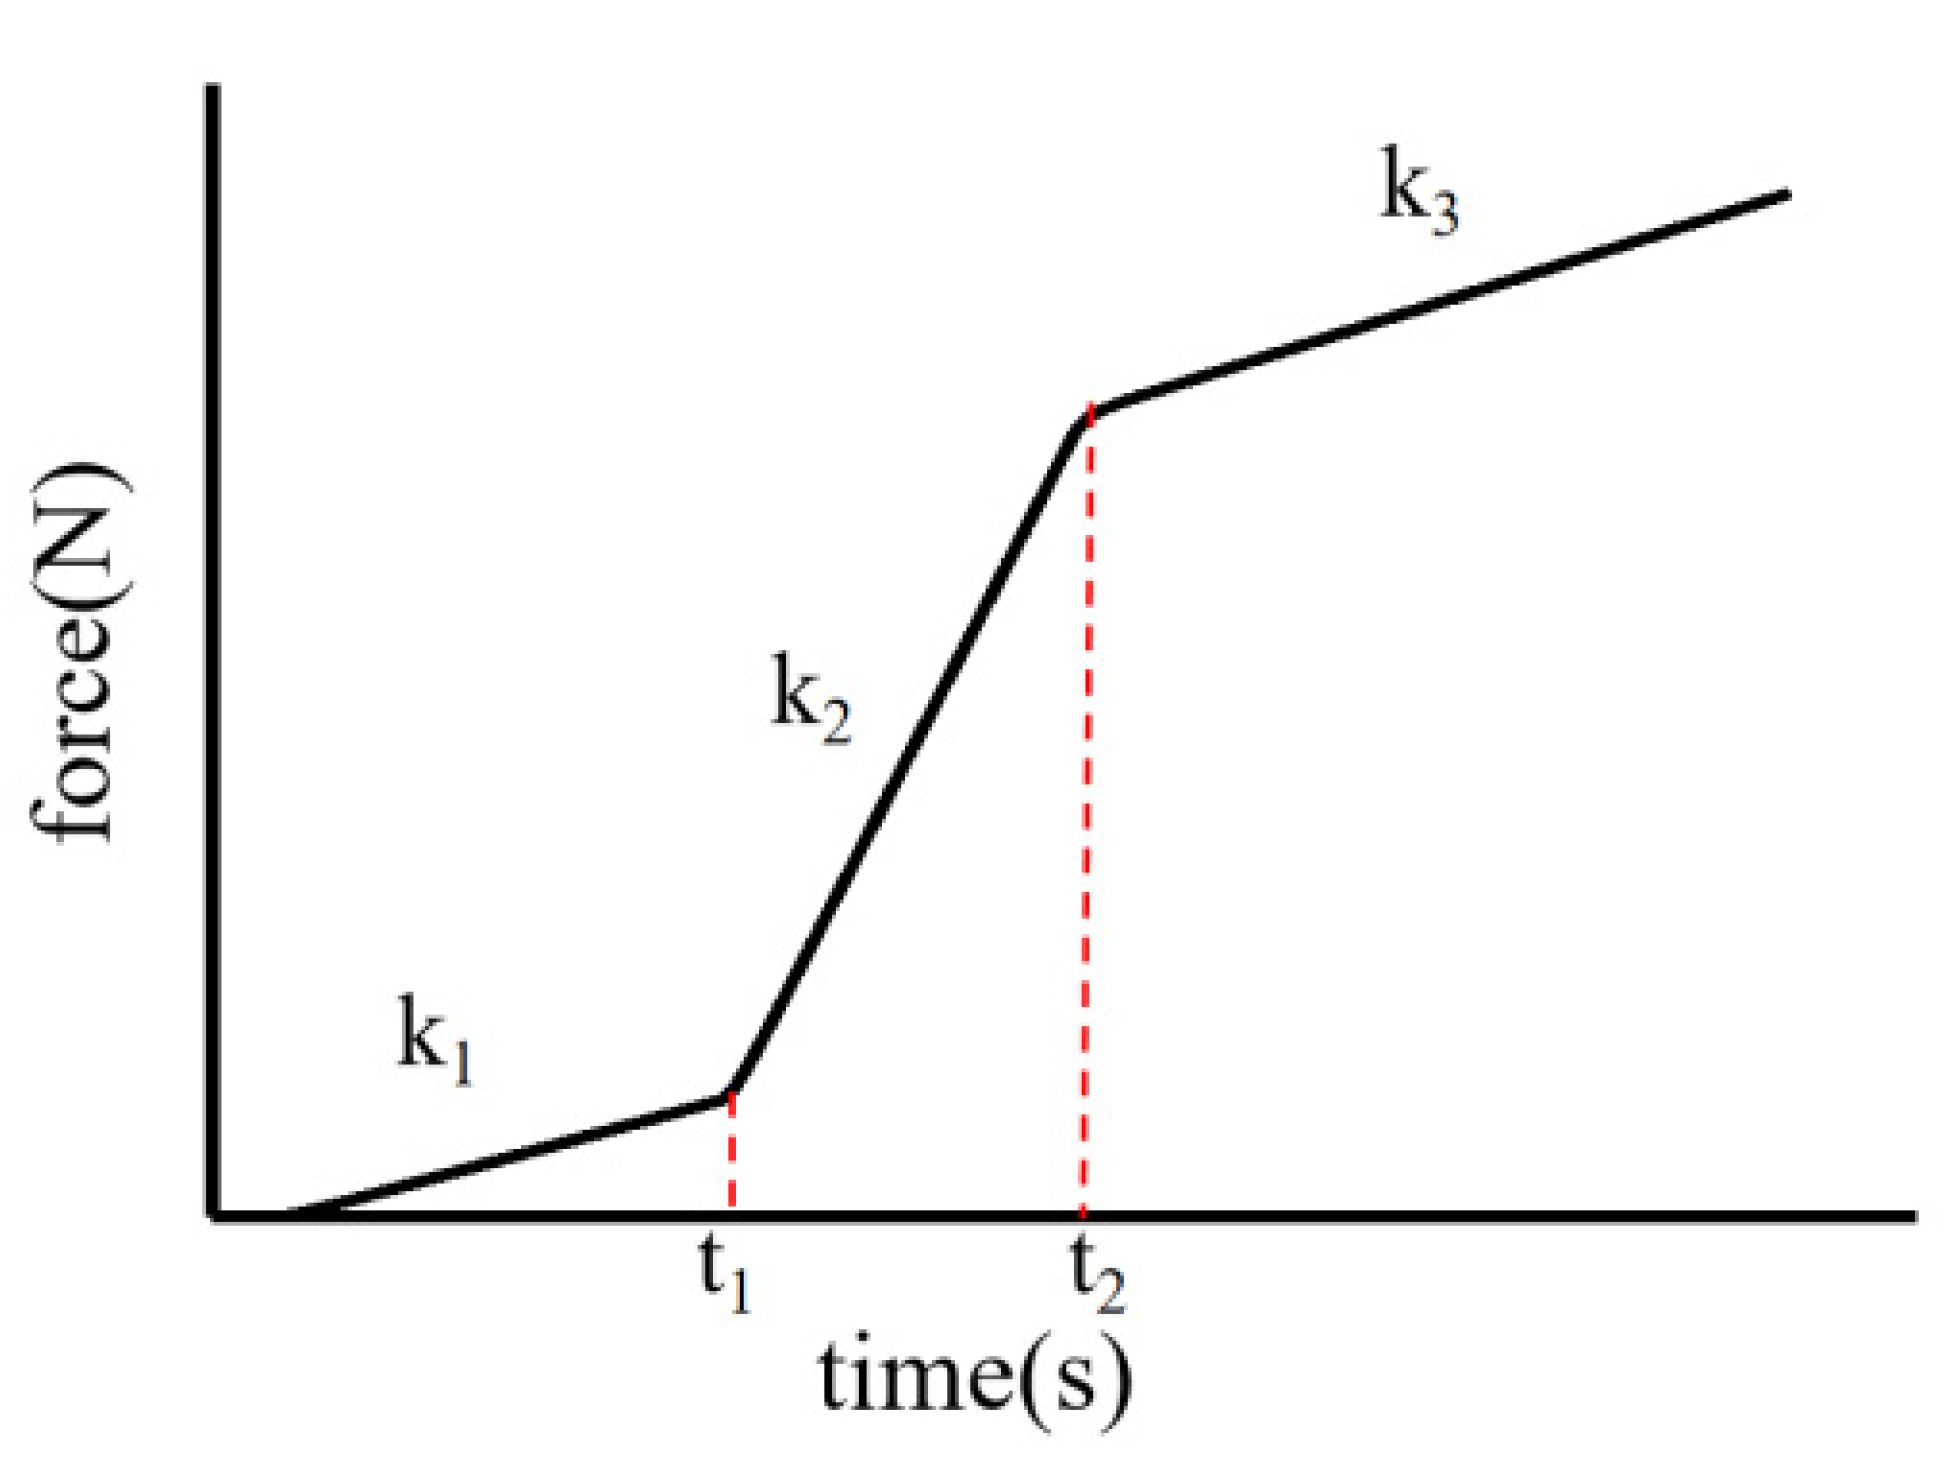
In the study of the dry friction clutch engagement strategy, improving the clutch engagement performance has always been the ultimate goal of the control strategy. It is necessary to shorten the engagement time as much as possible, reduce the temperature rise of the clutch, and at the same time control the impact torque within a certain range. Through the analysis of the traditional fixed-slope engagement pressure loading, it can be seen that when the engagement time decreases, the temperature rise also decreases, but the impact torque increases. To reduce the engagement time, temperature, and impact torque at the same time, a variable-slope engagement pressure loading method is proposed. When the clutch is just contacted, the pressure is applied slowly to control the chatter on contact. In the middle of the engagement, the pressure is applied quickly to reduce the engagement time. In the early stage of synchronization, the pressure is slowed down to reduce the synchronization shock torque. The engagement pressure function is as shown in Equation (5).
The design of the variable-slope engagement pressure curve is shown in Figure 21 The slopes of the first, second, and third pressure sections are k1, k2, and k3, and the corresponding change times t1, t2. Among them, t1 and t2 are determined by the speed difference w1 and w2 at the time of slope transition, that is, when the relative speed is less than w1, the slope is k1. When the relative speed is between w1 and w2, the slope is changed to k2, and when it is greater than w2, the slope is converted to k3.
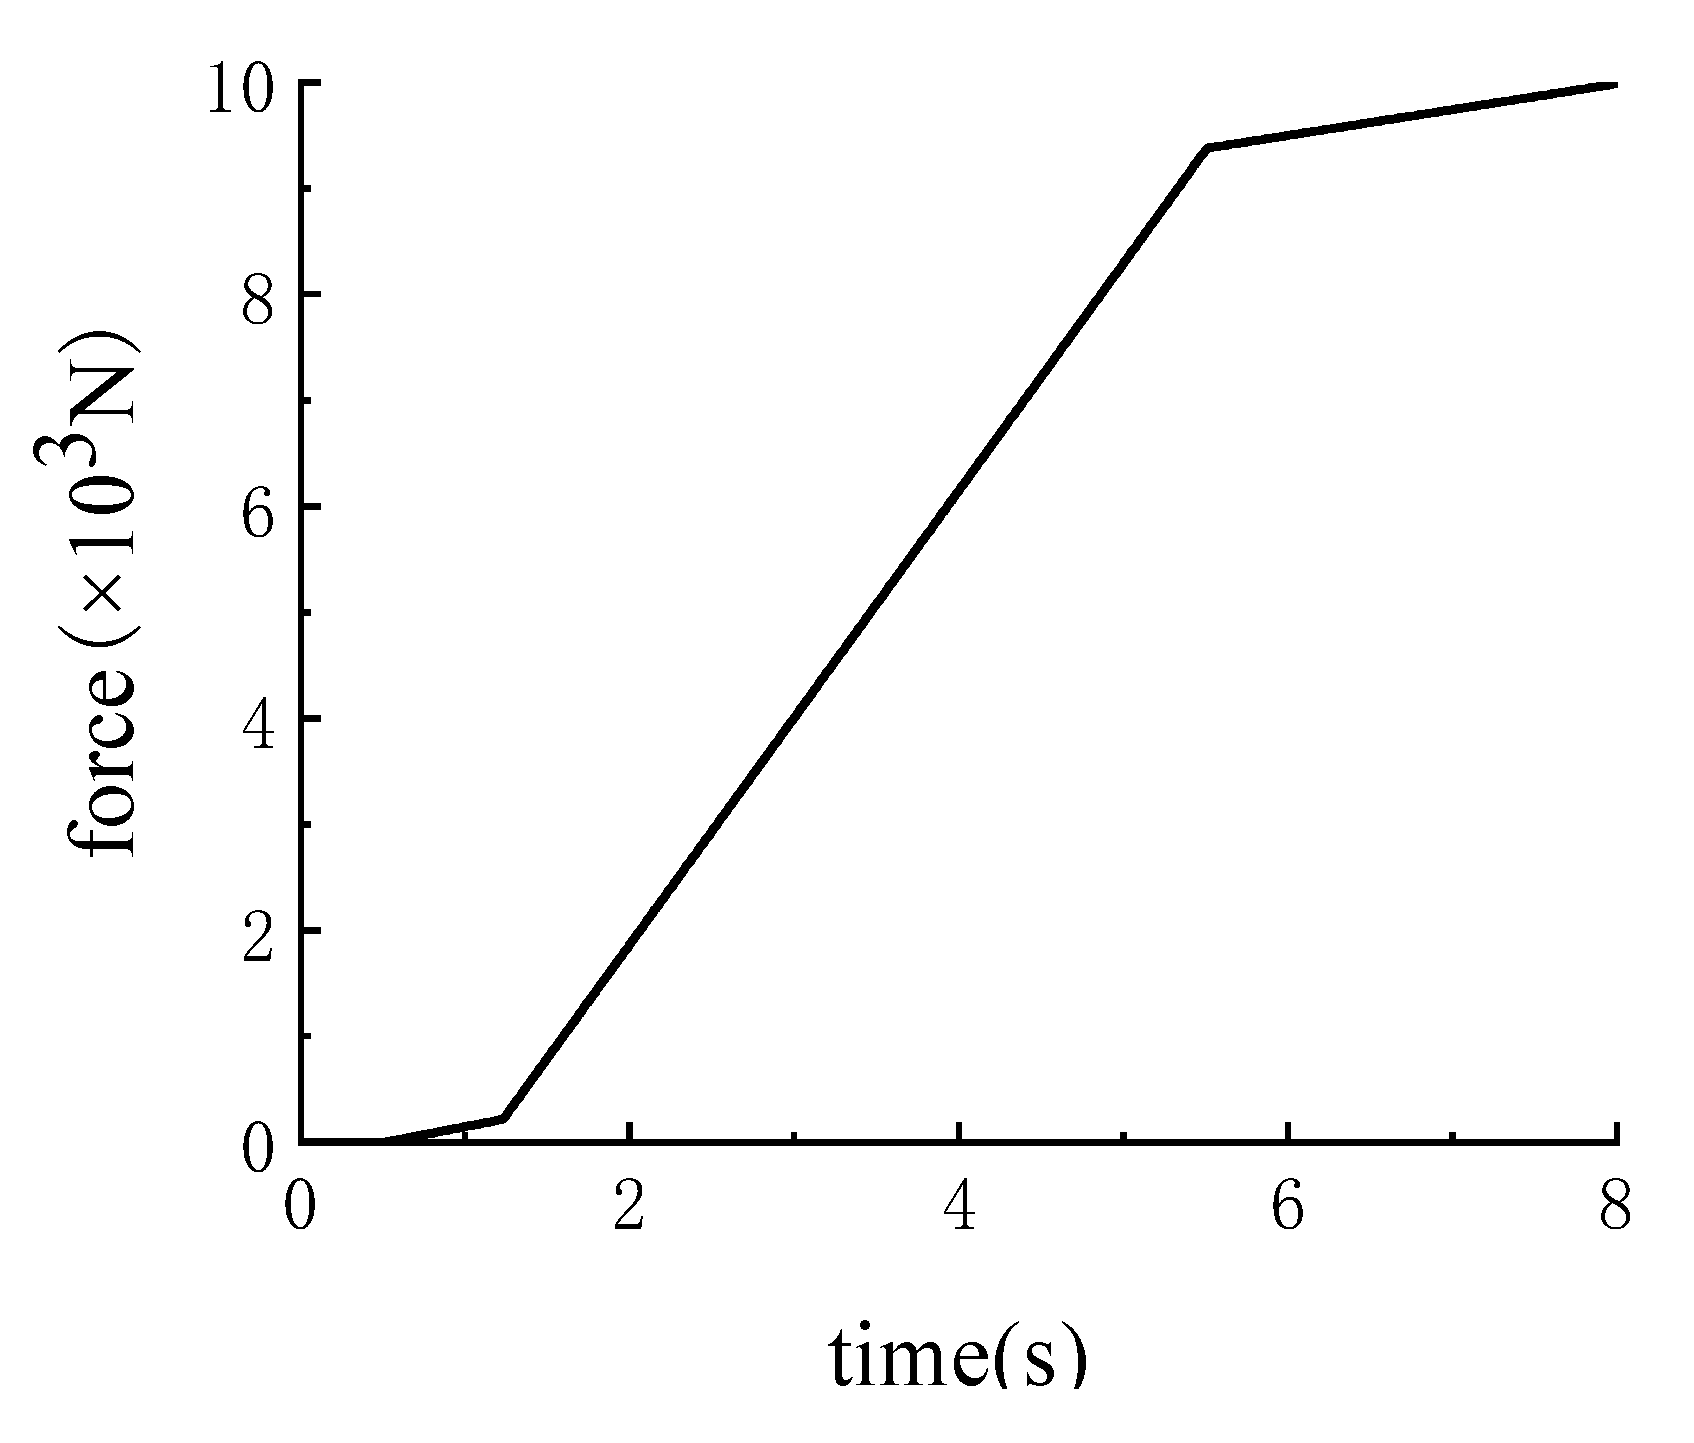
According to the actual situation of the clutch, the variable slope engagement pressure is designed as shown in Figure 22, k1 = 300 N/s, k2 = 2141 N/s, k3 = 244 N/s, w1 = 505 rad/s, w2 = 35 rad/s.
The variable slope engagement pressure loading curve is input into the clutch dynamics model, and the temperature field simulation analysis is carried out. The simulation results are shown in Figure 23, and the specific comparison data is shown in Table 3. It can be seen from Table 3 that under the load of variable slope engagement pressure, the clutch synchronization time is 5.9 s, the maximum impact torque is 523 Nm, and the maximum temperature is 184 °C. Compared with the traditional fixed slope engagement pressure rise time of 8 s, the engagement time is reduced by 9%, the maximum impact torque is reduced by 3%, and the temperature is reduced by 14%. Compared with the traditional fixed slope engagement pressure rise time of 10 s, the engagement time is reduced by 26%, the maximum impact torque is reduced by 1%, and the temperature is reduced by 21%. It shows that the variable-slope engagement pressure loading method can simultaneously reduce the engagement time of the clutch, reduce the temperature rise of the clutch, and reduce the impact torque, which has good and practical engineering value.
4.2.2. The Optimization of the Control Strategy for Variable Slope Pressure Loading
- (1)
- Orthogonal design
Orthogonal experimental design is an efficient and economical experimental design method, which is often used in the study of multi-factor and multi-level occasions. In this paper, an orthogonal experimental design is adopted, the impact torque and the engagement time are used as the optimization indicators, and the five factors k1, k2, k3, w1, and w2 are used as the optimization parameters, and the five parameters are all set at three levels. The levels of the experimental factors are shown in Table 4.
According to the orthogonal experimental design (L16 (45)) and the friction clutch dynamics simulation, the corresponding impact torque and engagement time can be obtained, as shown in Table 5.
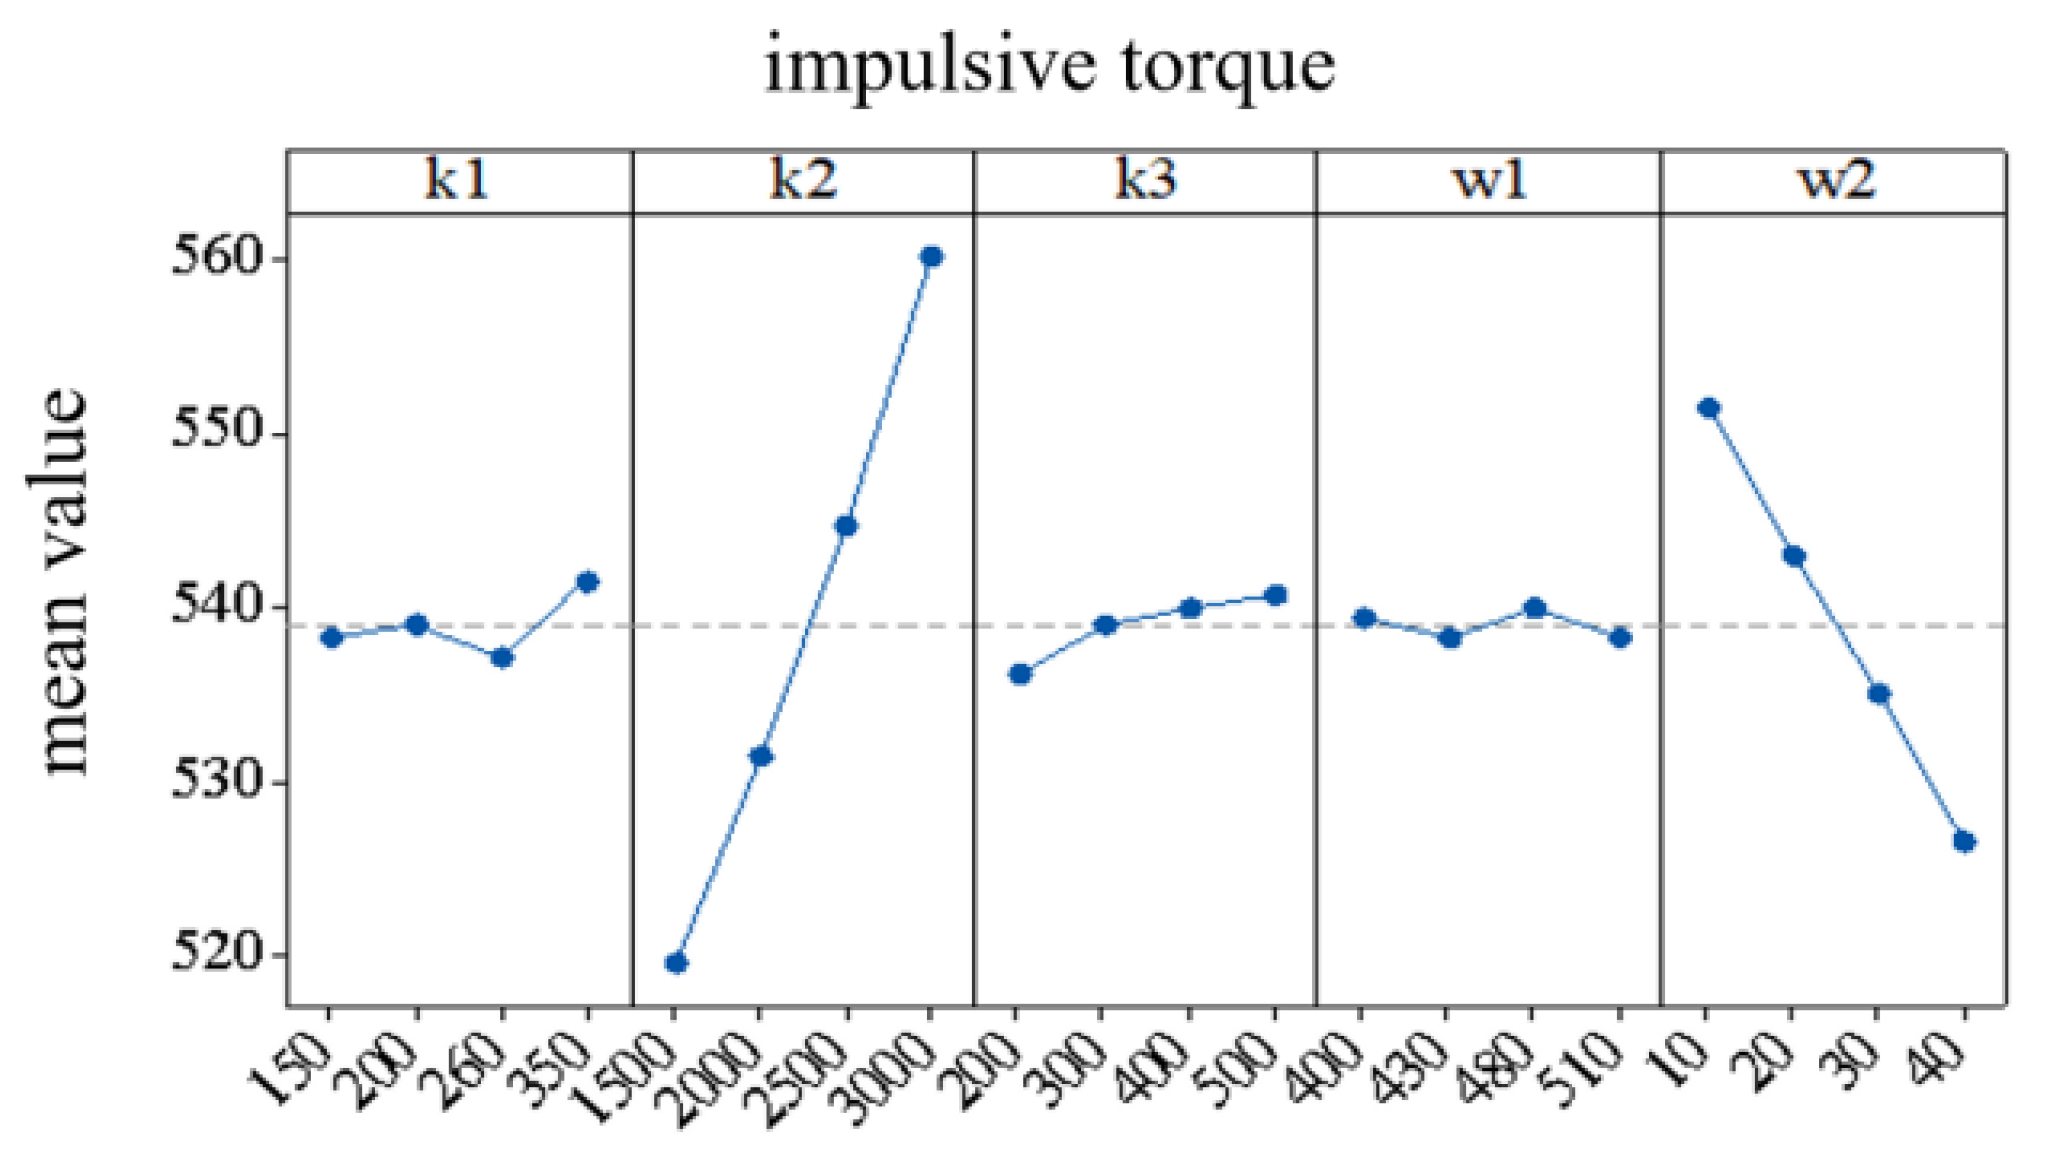
According to the mean value analysis method, the influence of the five parameters k1, k2, k3, w1, and w2 on the engagement time and impact torque can be obtained, as shown in Figure 24 and Figure 25.
It can be seen from Figure 24 that the order of influence on the impact torque is k2 > w2 > k1 > k3 > w1 in descending order. With the increase of k2 and k3, the impact torque increases. With the increase of k1, the impact torque first decreases and then increases, and reaches the maximum value at 350. With the increase of w2, the impact torque decreases. The influence of w1 on the impact torque is not obvious.
It can be seen from Figure 25 that the degree of influence on the engagement time is k2 > w1 > k1 > w2 > k3 in descending order. With the increase of k1, k2, k3, w1, w2 the engagement time decreases.
According to the above analysis, the influence of the five pressure loading parameters on the impact torque and the engagement time is inconsistent, and it is difficult to obtain a set of parameters to minimize the impact torque and the engagement time at the same time. Therefore, it is necessary to use a multi-objective optimization algorithm to further optimize the pressure loading parameters.
- (2)
- SVR-PSO multi-objective optimization algorithm and results
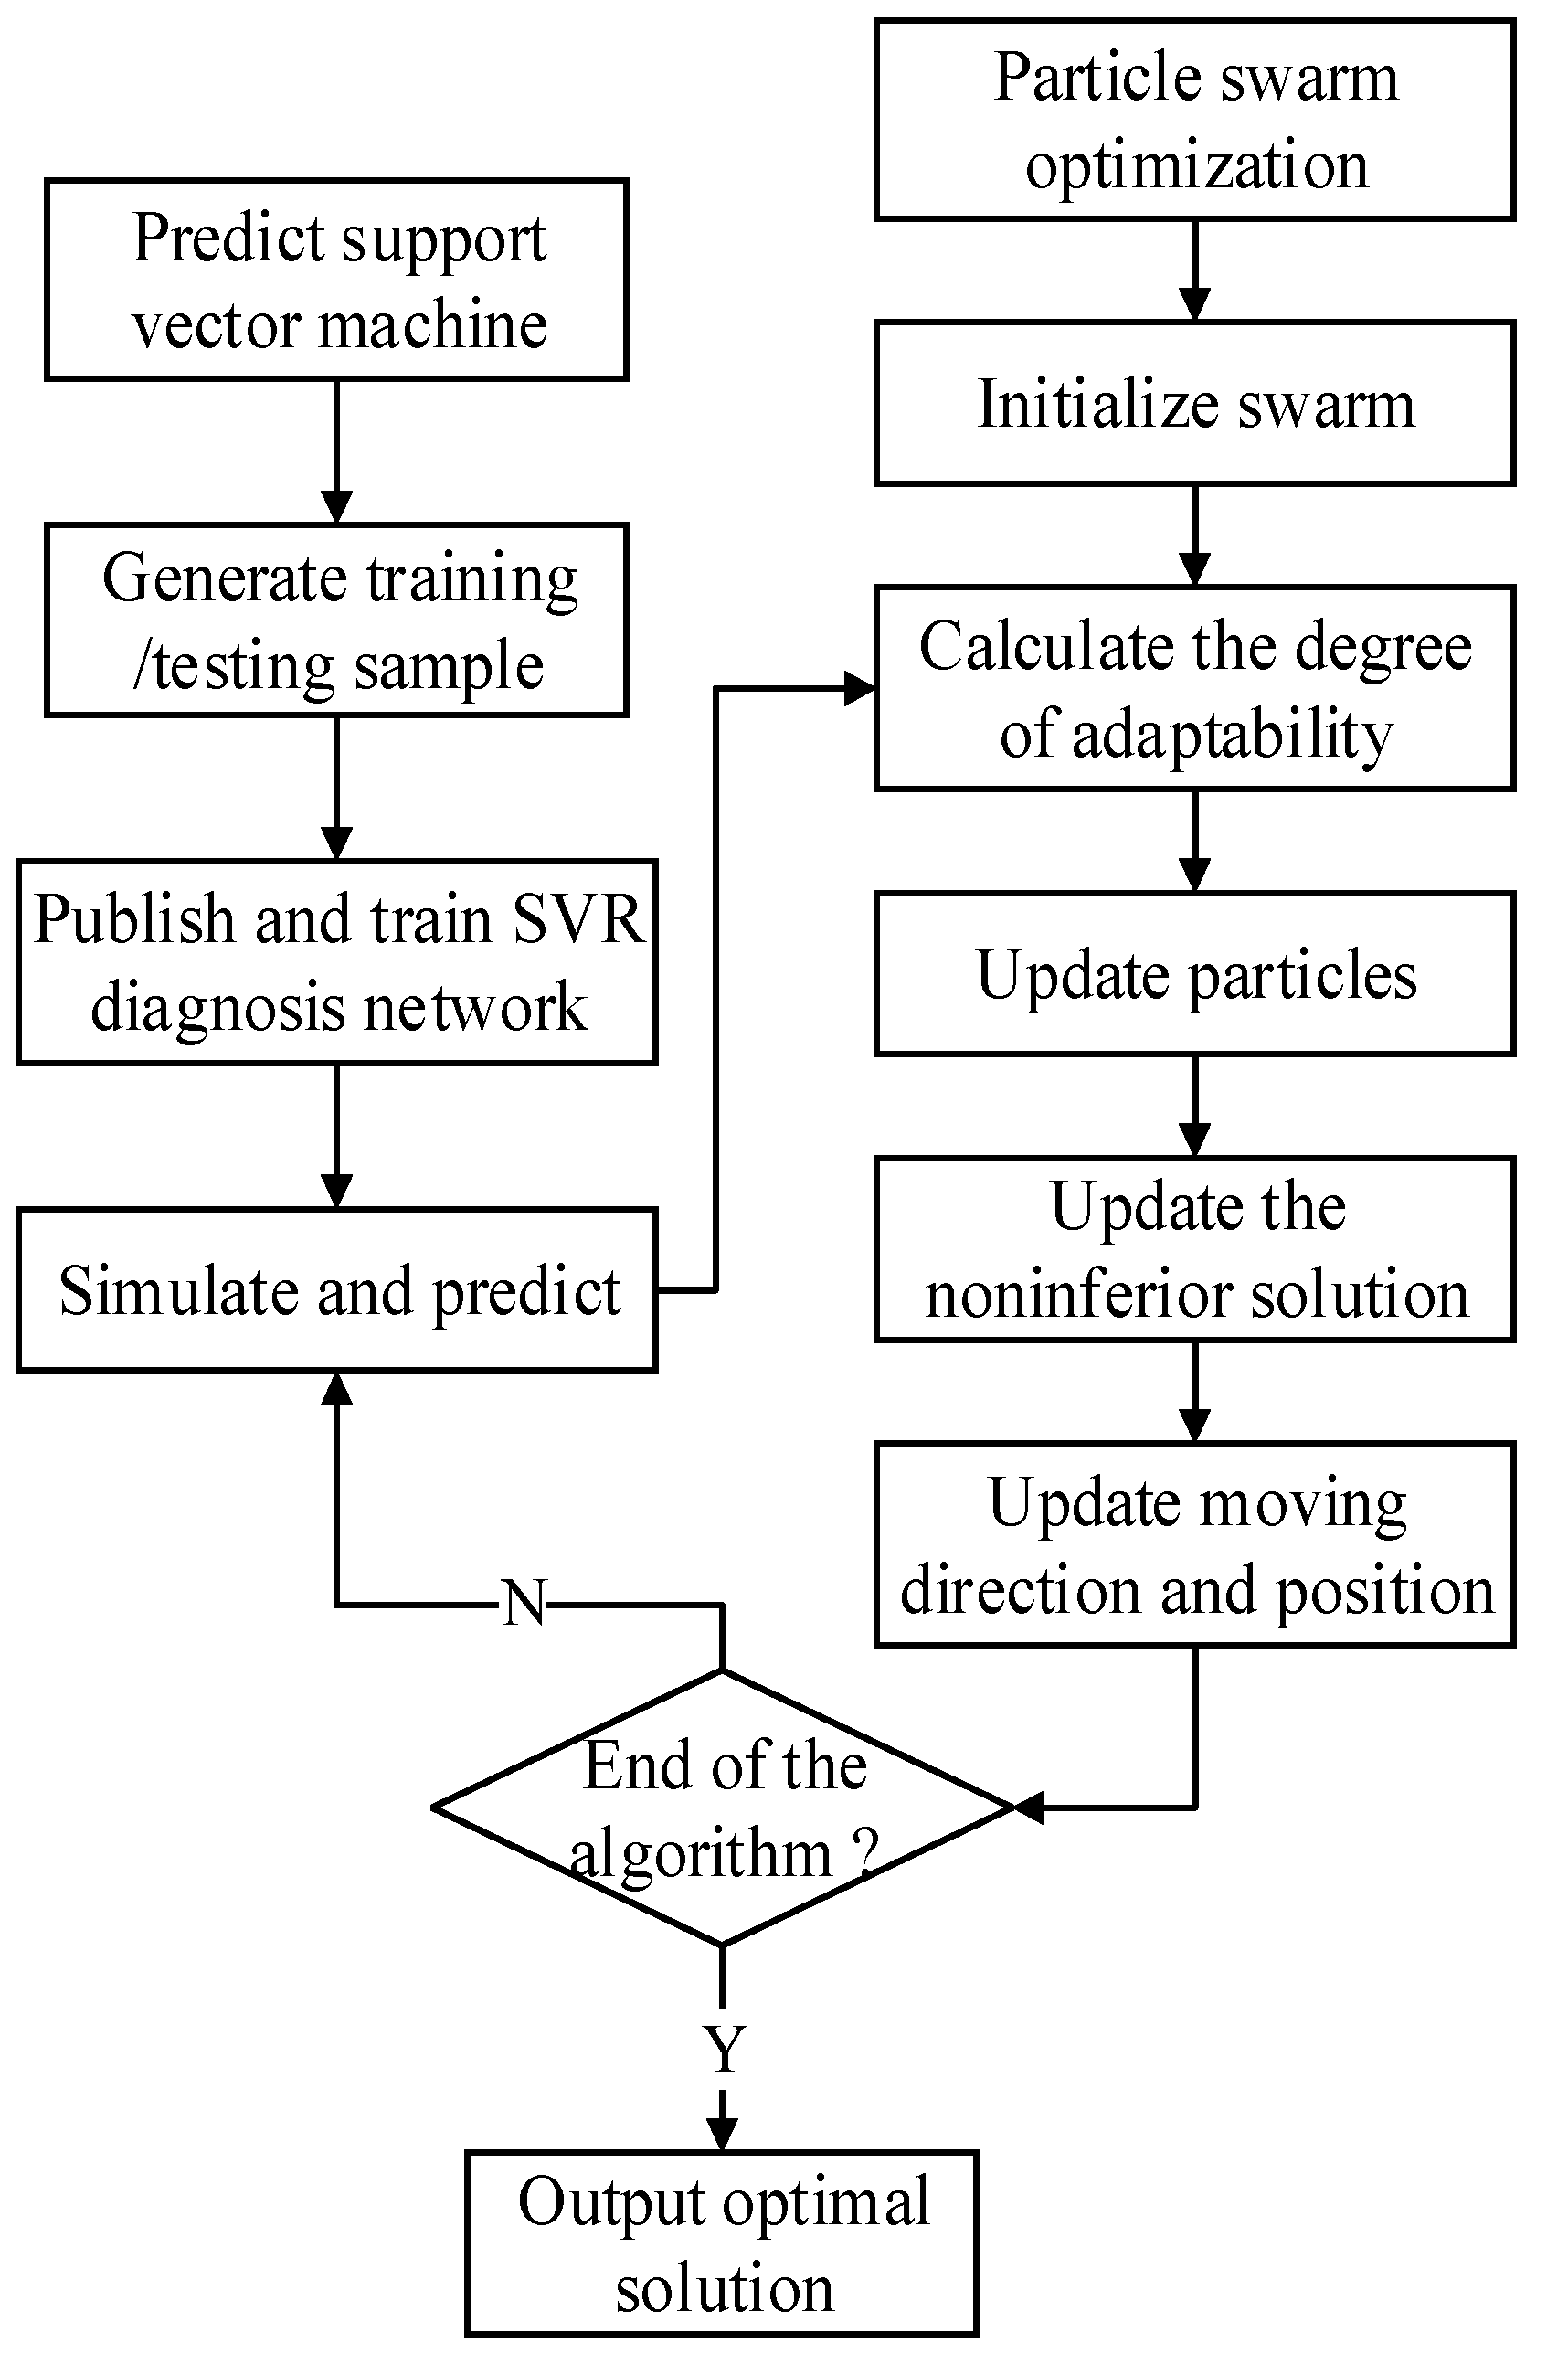
Support Vector Machine for Regression is an algorithm that improved on the basis of Support Vector Machine and is used to solve regression and fitting problems. The idea of particle swarm optimization originated from research on the predation behavior of birds/fish groups. The group achieves the optimal goal through collective cooperation. It is a global optimization algorithm. In different calculation processes, the solution often hovers around the optimal target and varies greatly. Therefore, the support vector regression algorithm is used to improve the search ability of particle swarm optimization. The SVR-PSO model establishment process is shown in Figure 26.
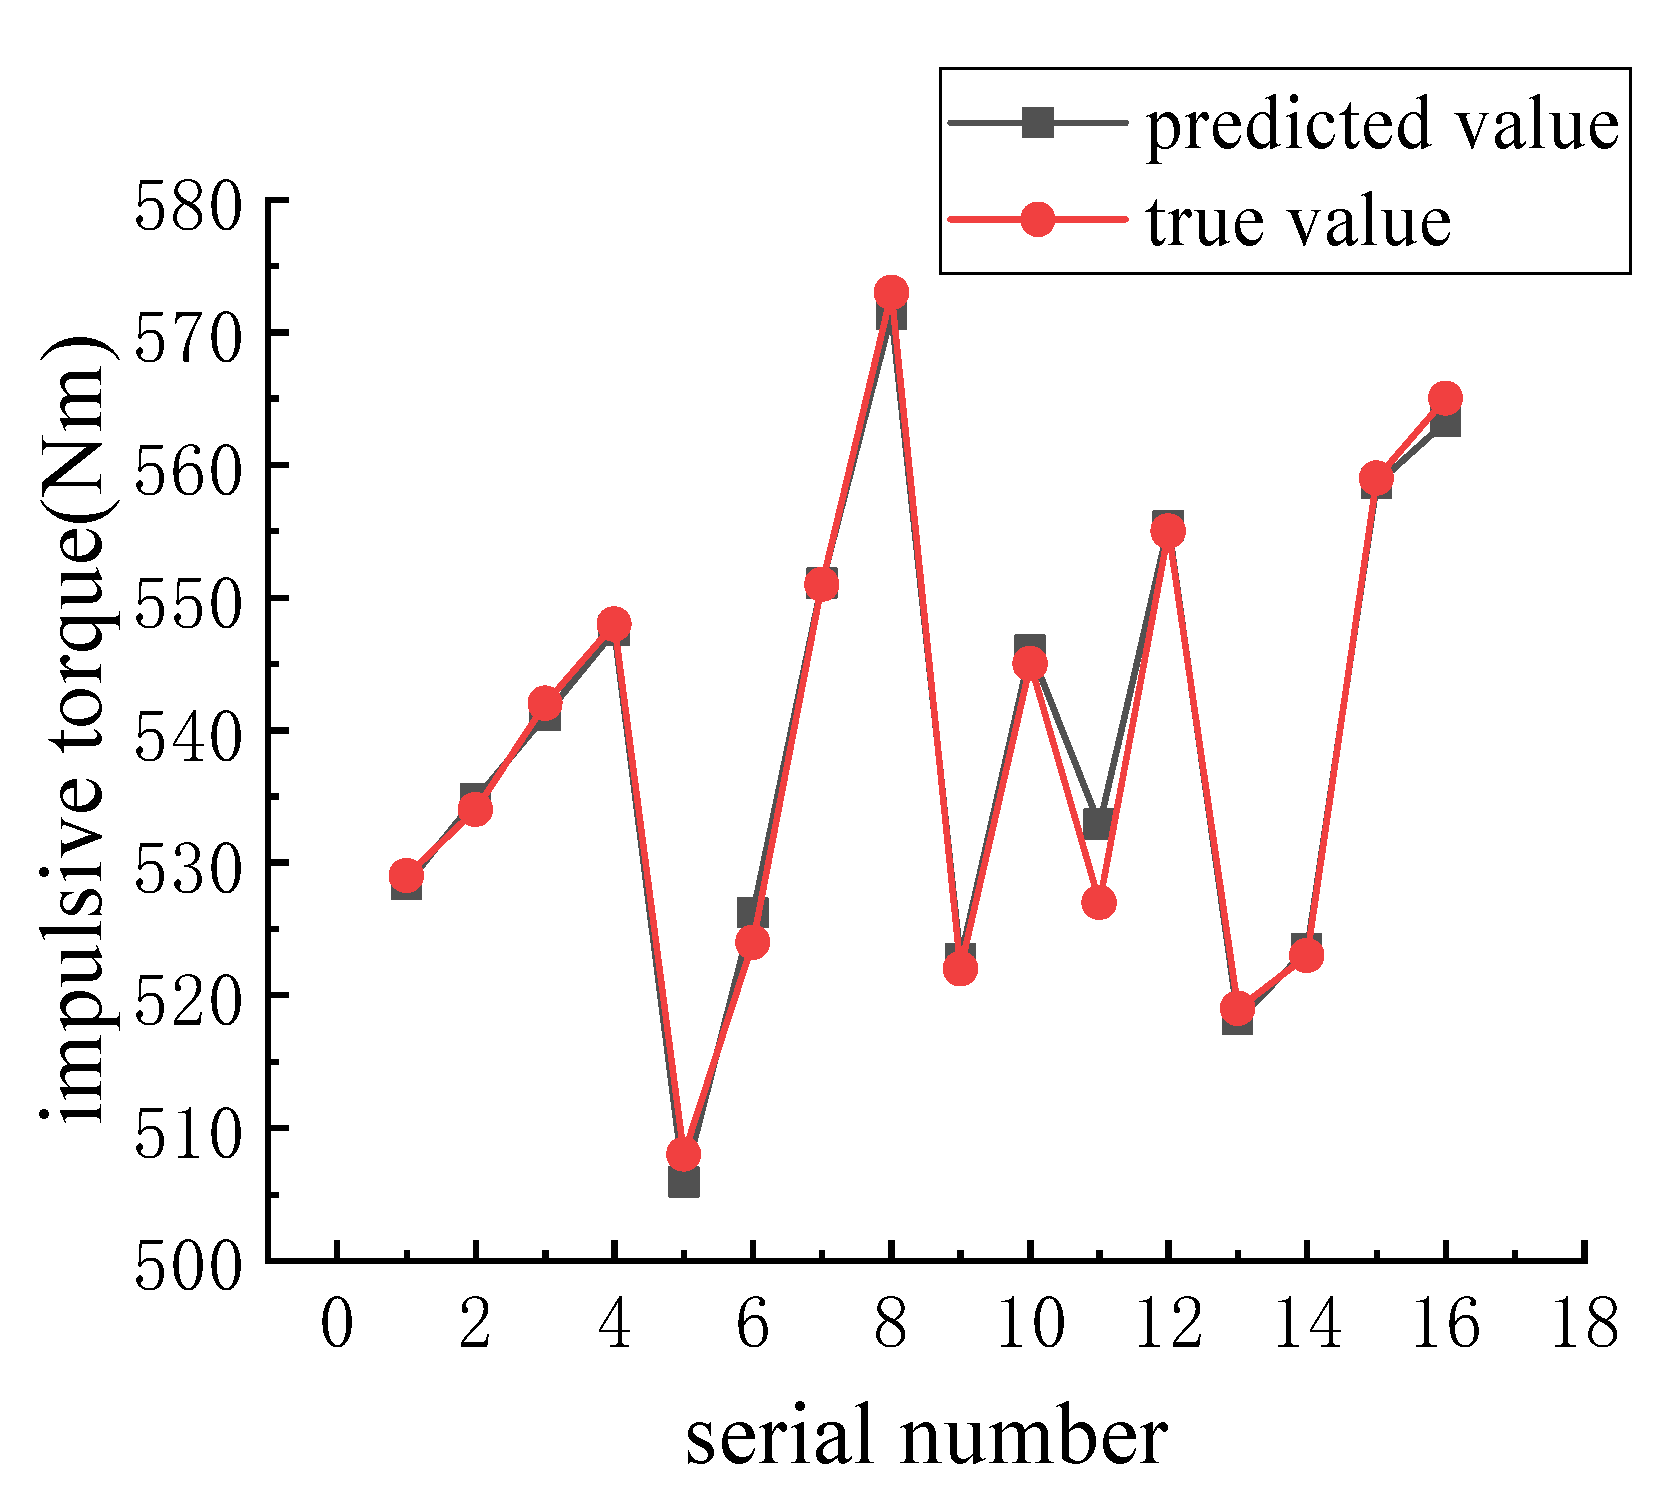
The SVR-PSO optimization model is established through optimization theory, and the trained SVR model is used for prediction. The comparison between the prediction results and the data in Table 5 is shown in Figure 27 and Figure 28. The relative error between the predicted value and the actual value is 3.41% and 4.1%, indicating that the SVR prediction model has a good prediction effect on the engagement time and impact torque.
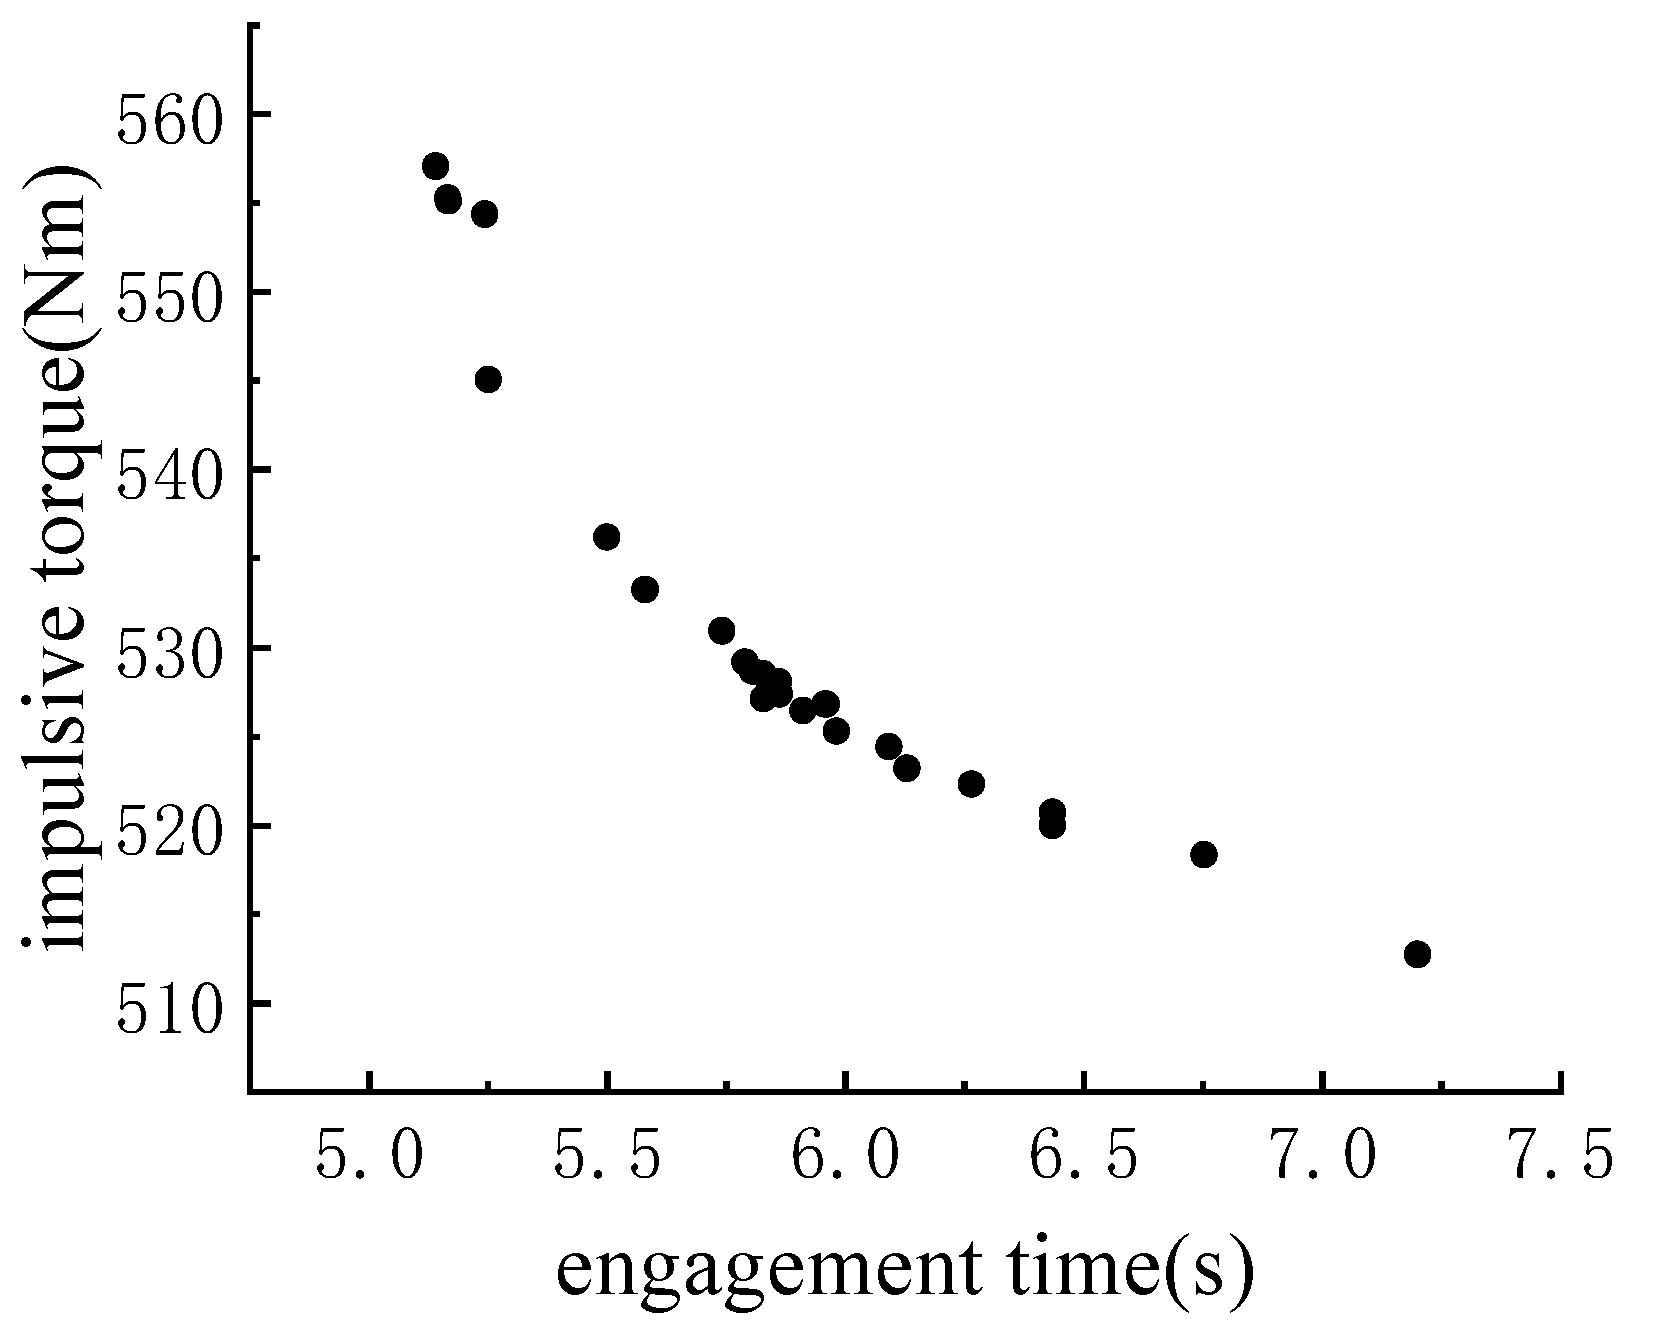
Using the trained SVR model combined with the PSO model to perform multi-objective optimization on the engagement time and impact torque, the Pareto solution can be obtained, as shown in Figure 29. It can be seen from the figure that the impact torque in the Pareto solution is proportional to the engagement time. In negative correlation, the impact torque decreases with the increase of engagement time, and the optimized Pareto solution can be applied to different working conditions.
In order to verify the effectiveness of the SVR-PSO optimization algorithm, six sets of data were simulated and verified. On the basis of the parameters in Table 6, the simulation result of engagement time, impact torque, and maximum temperature can be obtained through the dynamic model and the thermal model. The predicted result of engagement time, impact torque, and maximum temperature can be acquired through the SVR-PSO optimization algorithm. The relative error between the simulation result and the predicted result is treated as the evaluation index of the SVR-PSO optimization algorithm. The simulation results are shown In Table 6. According to the comparison between the simulation results and the optimization results, it is found that the average error of the predicted engagement time is 4.4%. The average error of the impact torque is 0.72%, indicating that the prediction results of the model are reliable. Compared with the traditional fixed-slope pressure loading of 8 s and 10 s, under the same engagement time, the impact torque of the variable-slope pressure loading is smaller and the temperature rise is smaller. For example, in the first set of data in Table 6, when the engagement time is 7.9 s, the impact torque is 512 N m and the maximum temperature is 202 °C. Compared with the traditional loading with a fixed slope of 10 s, the impact torque is reduced by 3% and the temperature rise is reduced by 14%. Under the same impact torque, the engagement time is shorter and the temperature rise is smaller. For example, in the third group of data in Table 6, the impact torque is 534 N m, the engagement time is 6 s, and the maximum temperature is 175 °C. Compared with the traditional load with a fixed slope of 8 s, the engagement time is reduced by 15%, and the temperature rise is reduced by 19%. Of course, there are also cases where the joining time, impact torque, and temperature rise are all reduced, such as the 5th set of data. This shows that the SVR-PSO optimization model can well realize the multi-objective optimization of the variable slope pressure loading parameters, and the optimized results can be applied to different working conditions.
5. Conclusions
- It is found that the faster engagement pressure loading occurs along with the shorter engagement time, the larger impact torque, and the higher temperature. How to decrease simultaneously engagement time and impact torque is important to the high speed difference friction clutch.
- Compared with the traditional fixed-slope engagement pressure loading method, the pro-posed variable-slope engagement pressure loading method can reduce simultaneously the engagement time, temperature rise, and impact torque, which has good application and spread value.
- The proposed SVR-PSO optimization algorithm can obtain the best parameters of the variable-slope pressing force strategy. The optimized Pareto solution can be applied to different working conditions.
- The simulational data show good agreement with the experimental result. It means that the simulation models have high precision and application value.
Author Contributions
C.Z.: Conceptualization; Funding acquisition; Formal analysis; Methodology; Investigation; Writing. Z.S.: Data curation; Investigation; Resources; Formal analysis; Writing. Y.Z.: Data curation; Investigation. Z.C.: Funding acquisition; Investigation; Methodology; Validation. All authors have read and agreed to the published version of the manuscript.
Funding
This research is supported by Natural Science Foundation of Changsha City, China (Grant No. 73773), Fundamental Research Funds for the Central Universities of Central South University (Grant No. 2022zzts0786), the Natural Science Foundation of Guangdong Province, China (Grant No. 2022A1515011226), Project of State Key Laboratory of High Performance Complex Manufacturing, Central South University (Grant ZZYJKT2022-10), Central Government Funds for Guiding Local Scientific and Technological Development (Grant No.2021Szvup167), the project of Guangdong Provincial Key Laboratory of Manufacturing Equipment Digitization (Grant No. 2020B1212060014).
Data Availability Statement
Not applicable.
Conflicts of Interest
The authors declare no conflict of interest.
References
- Hoggarth, R.; Mange, R. Highlights of the Lockheed Martin F-35 STOVL jet effects programme. Aeronaut. J. 2009, 113, 119–127. [Google Scholar] [CrossRef]
- Zhou, Y.; Zhao, H.; Liu, Y. An evaluative review of the VTOL technologies for unmanned and manned aerial vehicles. Comput. Commun. 2020, 149, 356–369. [Google Scholar] [CrossRef]
- Zhao, L.; Lin, Y.; Li, Z.; Huang, C. Optimal starting control of zero-synchronous shock AMT based on torque compensation. Sci. Prog. 2020, 103, 1–26. [Google Scholar] [CrossRef] [PubMed]
- Zhang, H.; Zhao, X.X.; Sun, J.N. Optimal Clutch Pressure Control in Shifting Process of Automatic Transmission for Heavy-Duty Mining Trucks. Math. Probl. Eng. 2020, 2020, 8618759. [Google Scholar] [CrossRef]
- Liu, Z.J.; Wang, L.; Ren, C.B. Accurate Calculation and Control of Dry Dual-Clutch Torque during Shifting Process. Adv. Mater. Res. 2012, 490, 1913–1919. [Google Scholar] [CrossRef]
- Crowther, A.; Zhang, N.; Liu, D.K.; Jeyakumaran, J.K. Analysis and simulation of clutch engagement judder and stick-slip in automotive powertrain systems. Drive Syst. Tech. 2008, 218, 1427–1446. [Google Scholar] [CrossRef]
- Crowther, A.R.; Zhang, N. Torsional finite elements and nonlinear numerical modelling in vehicle powertrain dynamics. J. Sound Vib. 2004, 284, 825–849. [Google Scholar] [CrossRef]
- Negrean, I.; Crisan, A.V.; Vlase, S. A New Approach in Analytical Dynamics of Mechanical Systems. Symmetry 2020, 12, 95. [Google Scholar] [CrossRef] [Green Version]
- Vlase, S.; Marin, M.; Scutaru, M.L.; Munteanu, R. Coupled transverse and torsional vibrations in a mechanical system with two identical beams. AIP Adv. 2017, 7, 065301. [Google Scholar] [CrossRef]
- Lai, V.V.; Paszkiewicz, I.; Brunel, J.F.; Dufrenoy, P. Squeal occurrence related to the tracking of the bearing surfaces on a pin-on-disc system. Mech. Syst. Signal Process. 2021, 165, 108364. [Google Scholar] [CrossRef]
- Mouffak, E.; Bouchetara, M. Transient thermal behavior of automotive dry clutch discs by using Ansys software. Mechanika 2017, 22, 562–570. [Google Scholar] [CrossRef] [Green Version]
- Pisaturo, M.; Senatore, A. Simulation of engagement control in automotive dry-clutch and temperature field analysis through finite element model. Appl. Therm. Eng. 2016, 93, 958–966. [Google Scholar] [CrossRef]
- Wenbin, L.; Jianfeng, H.; Jie, F.; Liyun, C.; Chunyan, Y. Simulation and application of temperature field of carbon fabric wet clutch during engagement based on finite element analysis. Int. Commun. Heat Mass Transf. 2016, 71, 180–187. [Google Scholar] [CrossRef]
- Yevtushenko, A.A.; Grzes, P. Mutual influence of the sliding velocity and temperature in frictional heating of the thermally nonlinear disc brake. Int. J. Therm. Sci. 2016, 102, 254–262. [Google Scholar] [CrossRef]
- Jian, Q.F.; Shui, Y. Numerical and experimental analysis of transient temperature field of ventilated disc brake under the condition of hard braking. Int. J. Therm. Sci. 2017, 122, 115–123. [Google Scholar] [CrossRef]
- Zhou, Y.; Huang, G.P.; Xia, C. Analysis of fixed-wing VTOL aircraft with gas-driven fan propulsion system. Aerosp. Sci. Technol. 2020, 104, 105984. [Google Scholar] [CrossRef]
- Li, L.; Lu, Z.; Liu, X.L.; Sun, T.; Jing, X.; Shangguan, W.B. Modeling and analysis of friction clutch at a driveline for suppressing car starting judder. J. Sound Vib. 2018, 424, 335–351. [Google Scholar] [CrossRef]
- Rao, J.G.; Selvam, P.; Sinnur, K.H. Effect of Type of Carbon Matrix on Tribological Properties of C C Aircraft Brake Discs. Def. Sci. J. 2019, 69, 585–590. [Google Scholar] [CrossRef] [Green Version]
- Shu, Y.; Jie, C.; Qizhong, H.; Xiang, X.; Tong, C.; Yunping, L. Effect of Braking Speeds on the Tribological Properties of Carbon/Carbon Composites. Mater. Trans. Jim 2010, 51, 1038–1043. [Google Scholar] [CrossRef] [Green Version]
Figure 1.
Schematic diagram of the short-range/vertical take-off and landing aircraft propulsion system.
Figure 1.
Schematic diagram of the short-range/vertical take-off and landing aircraft propulsion system.

Figure 2.
Layout diagram of the clutch comprehensive test bench.

Figure 3.
Layout drawing of the clutch comprehensive test table.

Figure 4.
3D simplified model of the clutch.

Figure 5.
Dynamic model of the friction clutch.

Figure 6.
The Simpack dynamics model of friction clutch. (1) Clutch housing (2) Moving plate (3) Static plate (4) Input shaft (5) Fixed constraints (6) Friction pair restraint (7) Drive constraints.
Figure 6.
The Simpack dynamics model of friction clutch. (1) Clutch housing (2) Moving plate (3) Static plate (4) Input shaft (5) Fixed constraints (6) Friction pair restraint (7) Drive constraints.

Figure 7.
The meshing of a friction clutch in the temperature model.


Figure 9.
Relationship between load torque and rotational speed.

Figure 10.
Conventional fixed slope engagement pressure loading curve.

Figure 11.
Speed curve for conventional fixed slope engagement pressure loading.

Figure 12.
Frictional torque curve for conventional fixed slope loading.

Figure 13.
Temperature curve of conventional fixed slope. (a) Engagement pressure rise time is 8 s (b) Engagement pressure rise time of 10 s.
Figure 13.
Temperature curve of conventional fixed slope. (a) Engagement pressure rise time is 8 s (b) Engagement pressure rise time of 10 s.

Figure 14.
Temperature field simulation results (engagement pressure rise time is 10 s). (a) Overall temperature field (b) Friction plate (c) Clutch housing.
Figure 14.
Temperature field simulation results (engagement pressure rise time is 10 s). (a) Overall temperature field (b) Friction plate (c) Clutch housing.

Figure 15.
Speed curve for test and simulation.

Figure 16.
Torque curve for Test and Simulation.

Figure 17.
Clutch temperature field simulation results.

Figure 18.
Simulation results of the clutch friction plate temperature field.

Figure 19.
Temperature change curve of the friction clutch.

Figure 20.
Test and Simulation temperature curve.

Figure 21.
The variable slope pressure loading curve form.

Figure 22.
Variable slope pressure loading curve.

Figure 23.
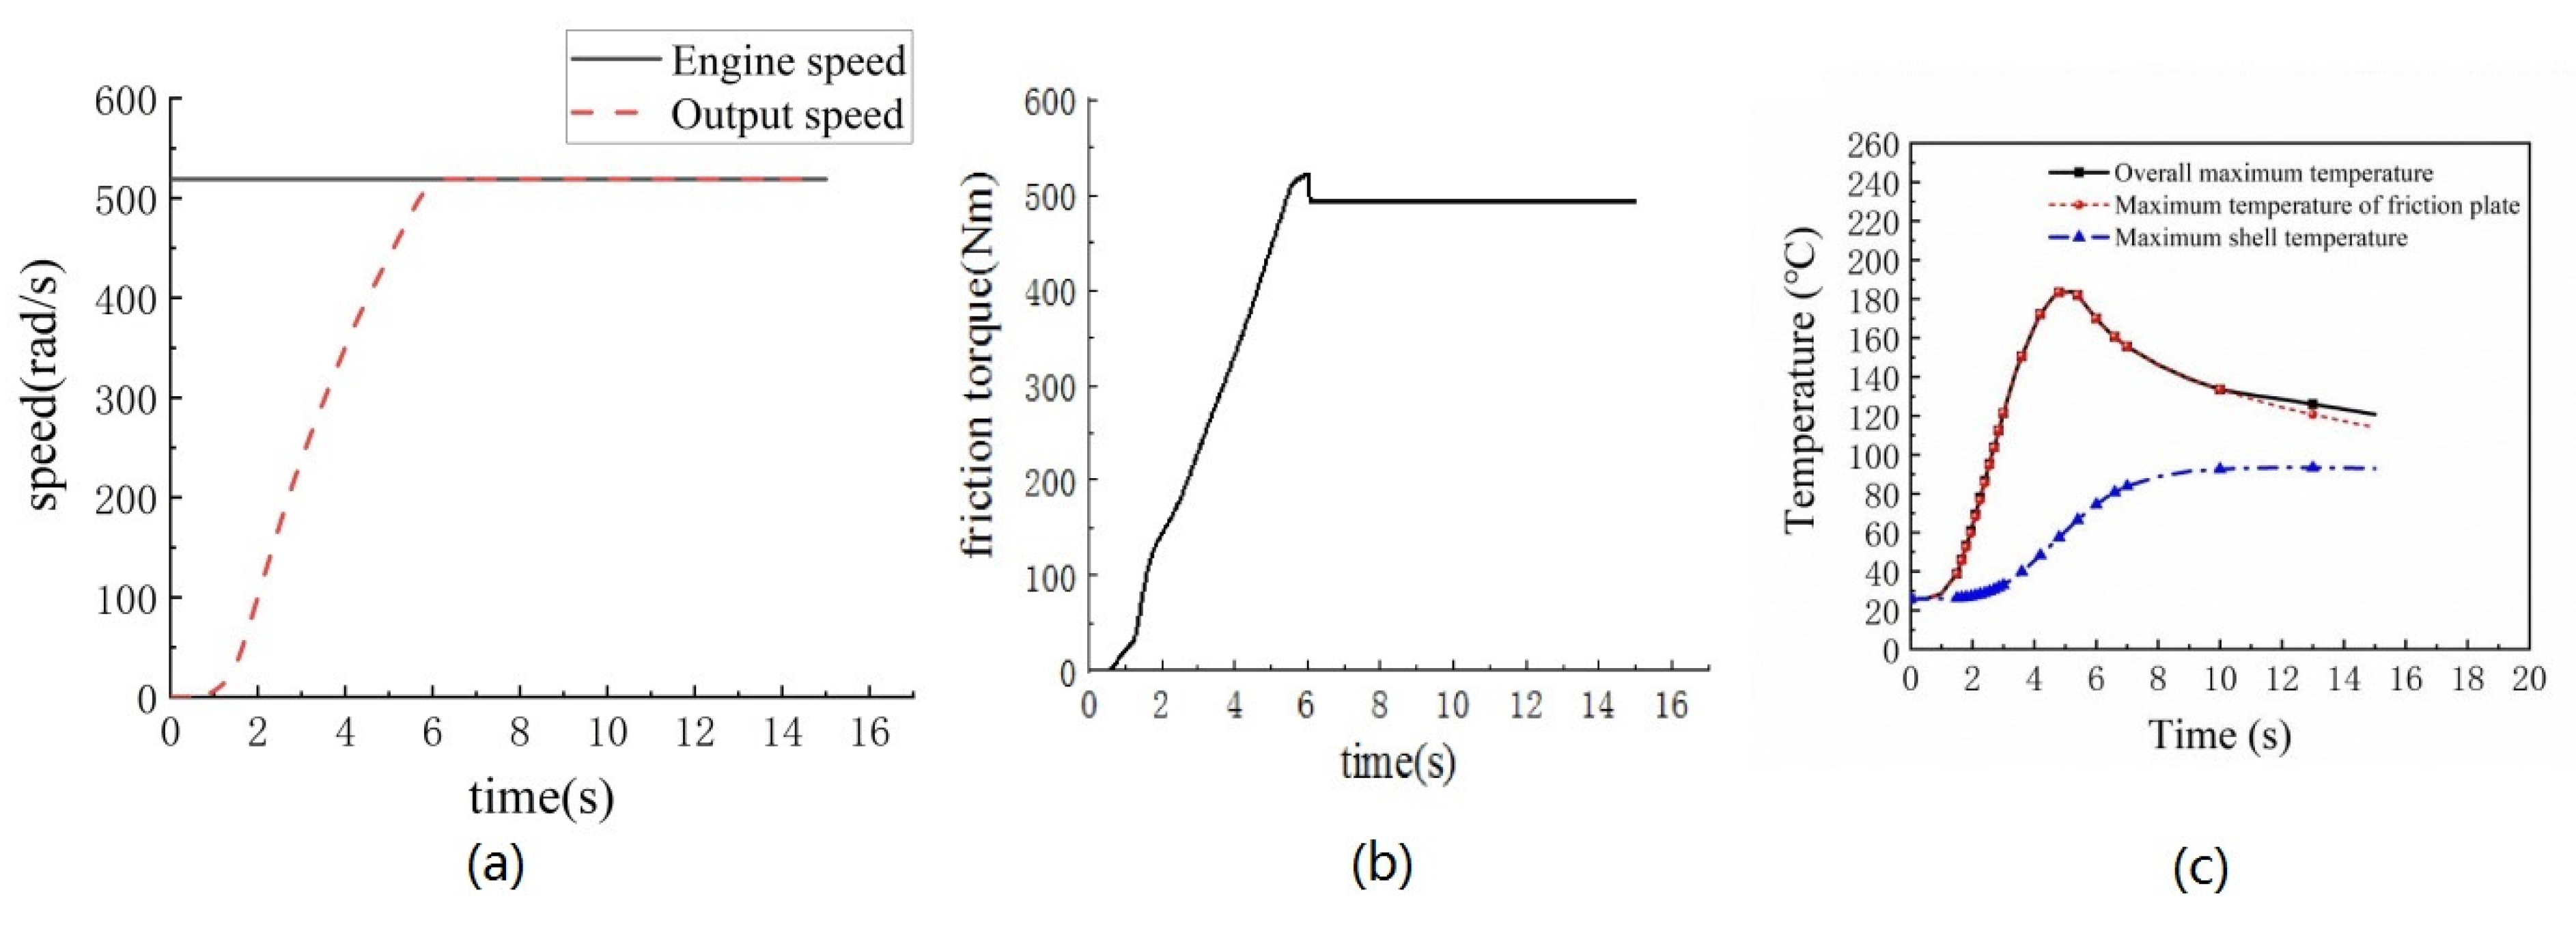
Results of variable slope pressure loading. (a) Main/driven disk speed curve (b) Torque curve (c) Temperature curve.
Figure 23.
Results of variable slope pressure loading. (a) Main/driven disk speed curve (b) Torque curve (c) Temperature curve.

Figure 24.
The influence of k1 on engagement time and impact torque.

Figure 25.
The influence of k2 on engagement time and impact torque.

Figure 26.
Flow chart of the SVR-PSO model establishment.

Figure 27.
Engagement time SVR prediction results.

Figure 28.
Prediction results of the impact torque, SVR.

Figure 29.
Multi-objective optimization results for engagement time/impact torque.


| Physical and Mechanical Properties | Numeric Value |
|---|---|
| density/(g·cm−3) | 1.76 |
| tensile strength/MPa | 55.7 |
| compressive strength/MPa | 68.8 |
| bending strength/MPa | 72.9 |
| Interlayer shear strength/MPa | 7.6 |
| Thermal conductivity W/(m·K) | 100 |
Table 2.
The mechanical and thermal properties of friction plate and steel.
| Properties | Friction Plate | Steel |
|---|---|---|
| Thermal conductivity | 100 W/(m·K) | 46 W/(m·K) |
| Specific heat capacity | 1800 J/(kg·K) | 300 J/(kg·K) |
| Density | 753 kg/m3 | 7800 kg/m3 |
Table 3.
Comparison of the simulation results for different loading methods.
| Loading Mode | Engagement Time (s) | Impact Torque (Nm) | Maximum Temperature (°C) |
|---|---|---|---|
| up time is 8 s | 6.5 | 539 | 215 |
| up time is 10 s | 8 | 529 | 234 |
| variable-slope | 5.9 | 523 | 184 |
Table 4.
Level table of variable slope pressure loading factors.
| Factor | Horizontal | |||
|---|---|---|---|---|
| 1 | 2 | 3 | 4 | |
| k1 (N/s) | 150 | 200 | 260 | 350 |
| k2 (N/s) | 1500 | 2000 | 2500 | 3000 |
| k3 (N/s) | 200 | 300 | 400 | 500 |
| w1 (rad/s) | 400 | 430 | 480 | 510 |
| w2 (rad/s) | 10 | 20 | 30 | 40 |
Table 5.
The simulation results of the orthogonal experimental design.
| Order Number | k1 (N/s) | k2 (N/s) | k3 (N/s) | w1 (Rad/s) | w2 (Rad/s) | T (s) | M (N·m) |
|---|---|---|---|---|---|---|---|
| 1 | 150 | 1500 | 200 | 400 | 10 | 12 | 529 |
| 2 | 150 | 2000 | 300 | 430 | 20 | 9 | 534 |
| 3 | 150 | 2500 | 400 | 480 | 30 | 6.5 | 542 |
| 4 | 150 | 3000 | 500 | 510 | 40 | 5 | 548 |
| 5 | 200 | 1500 | 300 | 480 | 40 | 9 | 508 |
| 6 | 200 | 2000 | 200 | 510 | 30 | 6.4 | 524 |
| 7 | 200 | 2500 | 500 | 400 | 20 | 8.7 | 551 |
| 8 | 200 | 3000 | 400 | 430 | 10 | 7 | 573 |
| 9 | 260 | 1500 | 400 | 510 | 20 | 7.7 | 522 |
| 10 | 260 | 2000 | 500 | 480 | 10 | 6.8 | 545 |
| 11 | 260 | 2500 | 200 | 430 | 40 | 7.2 | 527 |
| 12 | 260 | 3000 | 300 | 400 | 30 | 7.4 | 555 |
| 13 | 350 | 1500 | 500 | 430 | 30 | 8.9 | 519 |
| 14 | 350 | 2000 | 400 | 400 | 40 | 8.2 | 523 |
| 15 | 350 | 2500 | 300 | 510 | 10 | 5.2 | 559 |
| 16 | 350 | 3000 | 200 | 480 | 20 | 5.2 | 565 |
Table 6.
Multi-objective optimization validation data.
| Order Number | k1 (N/s) | k2 (N/s) | k3 (N/s) | w1 (Rad/s) | w2 (Rad/s) | Time (s) | Actual Time (s) | Fractional Error (%) | Impulsive Torque (N·m) | Actual Impact Torque (N·m) | Fractional Error (%) | Maximum Temperature (°C) |
|---|---|---|---|---|---|---|---|---|---|---|---|---|
| 1 | 260 | 1635 | 412 | 489 | 40 | 7.2 | 7.9 | 8.9 | 513 | 512 | 0.2 | 202 |
| 2 | 300 | 2639 | 249 | 510 | 15 | 5.1 | 5 | 2 | 557 | 560 | 0.5 | 181 |
| 3 | 287 | 2486 | 229 | 503 | 36 | 5.5 | 5.5 | 0 | 536 | 534 | 0.4 | 175 |
| 4 | 279 | 1847 | 253 | 485 | 38 | 6.8 | 7.3 | 6.8 | 518 | 514 | 0.8 | 198 |
| 5 | 303 | 1896 | 247 | 492 | 36 | 6.4 | 6.9 | 7.2 | 521 | 514 | 1.4 | 201 |
| 6 | 300 | 2141 | 244 | 505 | 35 | 5.9 | 6 | 1.7 | 528 | 523 | 1 | 188 |
| average error | 4.4 | average error | 0.72 |
Disclaimer/Publisher’s Note: The statements, opinions and data contained in all publications are solely those of the individual author(s) and contributor(s) and not of MDPI and/or the editor(s). MDPI and/or the editor(s) disclaim responsibility for any injury to people or property resulting from any ideas, methods, instructions or products referred to in the content. |
© 2023 by the authors. Licensee MDPI, Basel, Switzerland. This article is an open access article distributed under the terms and conditions of the Creative Commons Attribution (CC BY) license (https://creativecommons.org/licenses/by/4.0/).
Share and Cite
MDPI and ACS Style
Zhu, C.; Chen, Z.; Shi, Z.; Zhang, Y. Study on the Engagement Characteristics and Control Strategy of High Speed Difference Dry Friction Clutch. Machines 2023, 11, 407. https://doi.org/10.3390/machines11030407
AMA Style
Zhu C, Chen Z, Shi Z, Zhang Y. Study on the Engagement Characteristics and Control Strategy of High Speed Difference Dry Friction Clutch. Machines. 2023; 11(3):407. https://doi.org/10.3390/machines11030407
Chicago/Turabian StyleZhu, Chu, Zhi Chen, Zongcai Shi, and Yingdong Zhang. 2023. "Study on the Engagement Characteristics and Control Strategy of High Speed Difference Dry Friction Clutch" Machines 11, no. 3: 407. https://doi.org/10.3390/machines11030407
Note that from the first issue of 2016, this journal uses article numbers instead of page numbers. See further details here.