
A Digital Twin-Based System to Manage the Energy Hub and Enhance the Electrical Grid Resiliency

Department of Electrical and Electronics Engineering, Shiraz University of Technology, Shiraz 7155713876, Iran
*
Author to whom correspondence should be addressed.
Machines 2023, 11(3), 392; https://doi.org/10.3390/machines11030392
Submission received: 3 February 2023
/
Revised: 21 February 2023
/
Accepted: 13 March 2023
/
Published: 17 March 2023
(This article belongs to the Special Issue Advances in Electric Power Systems and Microgrids)
Abstract
:This article addresses a digital twin-based real-time analysis (DTRA) to meditate the power system vulnerability whenever cascading failures and blackouts occur for any reason, and thus, to improve the resiliency. In addition to this, a water-power package is proposed to enhance the vulnerable percentage of the system by promptly syringing energy to the grid under line/generator outage contingencies. To this end, in the first place, we will develop a digital twin model along with a cloud platform derived from the Amazon Cloud Service (ACS) into the Amazon Web in order to scrutinize the online vulnerability data arising from the equivalent physical twin in real-time. Indeed, such a DTRA model can help us check the real grid’s behavior and determine how to meet the needs of the energy hub system to prevent blackouts. Additionally, a modified bat-based optimization algorithm is matched to settle the energy between the hub system and the electrical grid in furtherance of real-time analysis. To raise awareness, we will first compile how the hub system interactions can be effective in declining the vulnerability indices, and afterward, we will map out the ACS-based digital twin model on the studied case.
1. Introduction
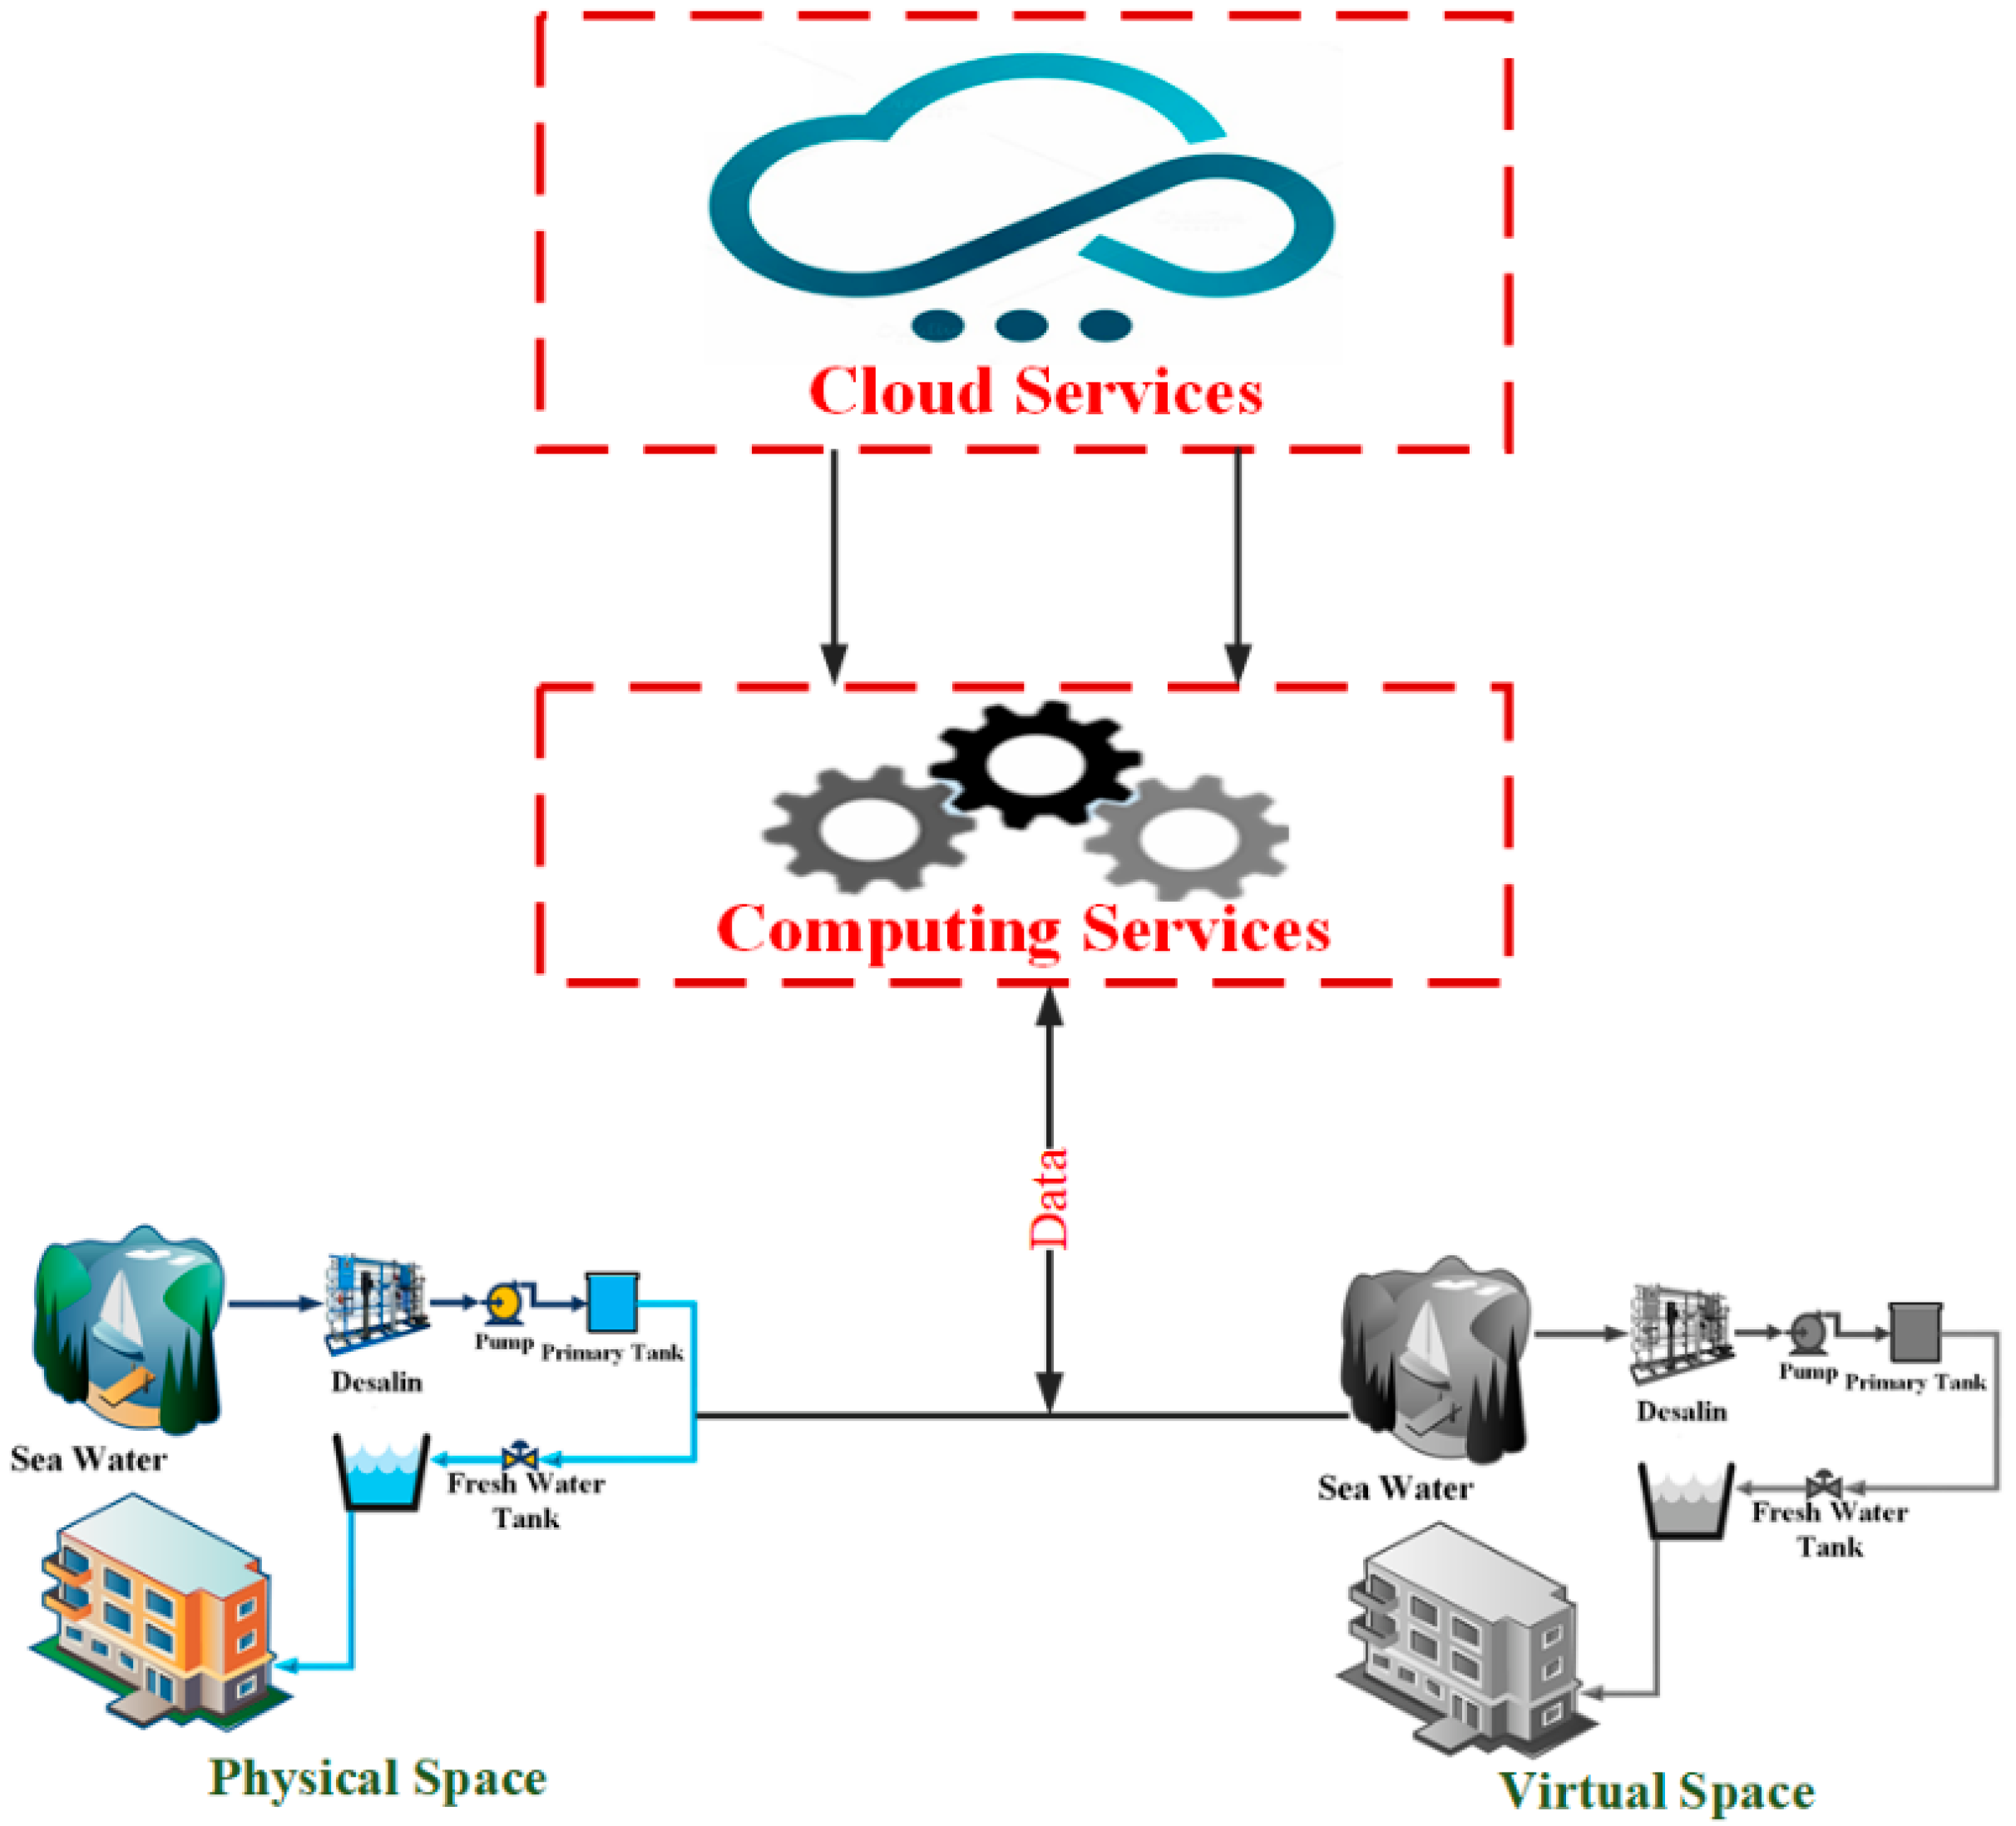
Developing multi-energy systems is on the rise, in order to bring about solidarity among various energy resources in response to energy demands, including water, electricity, and heat. Meanwhile, the growing loads along with the expansion of cities reveal the need to have flexible energy in terms of energy management in smart cities. This has led to the creation of new concepts and ideas in smart cities, one of which is the energy hub system. Indeed, such a system was introduced as the multi-carrier energy system, made up of some inputs and outputs as well as conversion devices for ease of use in the synergy framework to cover the water, thermal, and electrical consumptions [1,2]. Hence, we will try in this paper to utilize this idea as our main goal. Employing the hub systems in the grid would be a great revolution for energy management as well as environmental concerns. It is worth noting here that each innovation leads to the advent of advanced communication devices in conjunction with the varied energy natures [3]. Authors in [4] have presented a hub system for the ease of electrical grid operation. In [5], a communication network was developed to make the residential hub system more prevalent within the smart grid. One other thing to note is that grid enlargement due to the remarkably increasing demands causes vulnerable areas to appear, which results in cascading failures and blackouts. Looking at the resiliency analysis on the grid, it is apparent that the grid configuration is easily damaged in some areas where the downcast indices fall under the line/generator outage contingencies. Hence, identifying these areas of the grid in the first place is a must. Therefore, this case was worthy of the attention of many researchers in the literature. It was proven that cascading failures and blackouts were possible if they did not anticipate the needed proceedings for the grid during the faults. Ref. [6] has reported that 75% of the disruptions have been rooted in protective devices. In recent years, many customers have incurred losses from blackouts that have occurred in the United States. On this basis, it is necessary to take a closer look at the vulnerability analysis of the grid operation [7]. Indeed, this analysis can help bring an invulnerable structure by developing the weak and critical areas within the grid [8]. In this way, authors in [9,10,11] have presented various models of vulnerability that evaluated the relevant indices regarding a (1) dynamical analysis and a (2) steady-state analysis [12]. Generally speaking, this paper aims to enhance the vulnerability indices by taking inspiration from the hub system concept along with the digital twin-based real-time analysis (DTRA). The rationale is that the charming idea of the digital twin first emerged in 2002 by Dr. Michael Grieves. Inspiration from the digital twin concept makes the life cycle of smart and complex tech visible in real-time. Additionally, such a concept would be great for working up efficiency in the process of manufacturing a smart product. Of course, employing the digital twin needs to be revolutionized in the information technology (IT) and operation trends as a way of learning about this idea [13]. For all these reasons, the digital twin idea has become the center of attention for many researchers in the literature. There is convincing evidence that an analogous tendency can be found among all analysts and vendors toward taking such an idea to realize the industrial environment on the right. It is worth noting that the digital twin model could make us aware of the information that is the same as the physical twin. Indeed, scholars have decided to use this concept instead of modeling and simulating the systems with the help of inspiration from the “what-if scenarios” idea. Widely utilizing the digital twin in the industry to reflect and identify the physical data points is effective in practical environments. In fact, the digital tools are able to mirror the system’s objects based on what is observed in the real system through a linked platform and the physical model. Keeping all of this in mind, various definitions of the digital twin model can be introduced, with an emphasis on the application as follows:
- Virtually mapping out a real system provides data derived from the physical world, aiming to respond to the varied applications [14].
- The digital twin is the digital image of equipment akin to industrial machines and products based on their information, which indicates their behavior [15].
- Describing a virtual infrastructure of data arising from the physical smart products, from the macro geometrical perspective to the micro atomic ones [16].
- Figure 1 shows a digital twin concept in the power system.
Focusing on the argument above, the unquestionable input data for both the digital and physical systems can make the digital analysis more reliable and more precise. So, it seems that having a closer look at estimating the input data of a physical system using the uncertainty models can be useful for the digital twin’s performance. In the literature, the Monte Carlo method is well known as an acceptable approach for mapping out the effects of the uncertain parameters that are made possible in the real system. The challenges, such as the high passing time facing this method, have forced researchers to find different models in response to this problem [17]. Hence, the unscented transformation (UT)-based uncertainty model has been presented in order to provide results that are close to the main method but are less time-consuming [18]. It is worth mentioning that this method is able to model the correlation effects among the parameters in the system [19].
All in all, the highlights of this paper are outlined as follows:
- Improving the vulnerability induces using a novel water-power system in the electrical grid, considering various contingencies, and improving the resiliency.
- Proposing and developing a real-time vulnerability analysis based on the proposed digital twin model.
- Proposing an uncertainty model based on the unscented transformation concept to model the randomness of inputs to the digital twin structure to make the real-time analysis meticulous.
2. Modeling of the Physical Layer of the Hub System on the Resiliency and Vulnerability Analysis
In this section, we aim to present the physical twin of the hub system’s connected electrical grid and how to model the grid’s vulnerability. Indeed, this section follows our goal toward decreasing the vulnerability indices using the power injection of the hub package to the grid in the physical part.
2.1. The Mathematical Definition of the Electrical Grid
Before the vulnerability analysis model and the hub system, it is necessary to present the underlying substructure of the electrical grid for a better realization of the following aims. Therefore, the mathematical structure of the grid’s behavior, with an emphasis on the objective function and relevant constraints, is provided here. The electrical grid used in this case is made up of fossil fuel-based generation units, buses, and lines that make connections between the generators and load demands. Indeed, the electrical loads are satisfied based on an optimal energy scheduler, which results in a decline in the generation unit’s cost, consisting of the supplement cost of the active power and the shut-down/start-up cost, as shown in the objective function (1). It is worth mentioning that this target will be well followed if the technical limitations on the grid are well managed. Likewise, the generators are amenable to adhering to their reactive/active generation limits on Equations (2) and (3). Additionally, relations (4) and (5) indicate that the reservations related to the power generation are maintained for an hour. Balancing reactive/active powers between the generators and loads is one of the most noteworthy constraints of the energy management, as shown in (6) and (7). The lines are allowed to flow power through them, having looked at the authorized limits of the bus voltages and the bus angles based on constraints (8)–(13).
2.2. The Physical Model of the Proposed Water-Power System
The hub system is one of the most well-known multi-energy systems because it has the ability to satisfy multi-energy carriers, including electricity, heat, and even water. To realize such a system, we present the mathematical formulations related to the energy linkage among the water, thermal, and electrical sections within a hub system [20]. Indeed, here we will show how the hub system can achieve solidarity among the varied energy resources to satisfy the load demands. Keeping this in mind, each energy part is differentiated based on three factors, such as the (1) objective function, (2) load type, and (3) corresponding limitations. Meanwhile, the totally aimed function for the hub system is defined based on Equation (6):
- Objective Function
- Constraints: Electrical
- Constraints: Heat
- Constraints: Water
Looking at (14), the function follows the CHP, boiler, and battery units’ energy costs, alongside it, paying the cost of the water energy from the water grid, and finally, the energy transaction cost/profit on behalf of the interaction with the grid. Then, the energy constraints that are individually related to each part of the objective function can be seen in (15)–(30). First, the electrical section adheres to the power balance between the energy resources, including the CHP, battery, and power transaction, and loads the demands that need to be satisfied. This electrical equilibrium is defined in (15). In addition to this, limitations on the powers generated by the varied types of resources are met by Equations (16)–(18). As mentioned already, the hub system can exchange its energy with the grid, but it is limited to an allowed level, which is defined in (19) and (20). A similar note for the thermal energy section regarding Equations (21)–(25) must also be considered. As it is seen, the heat generation units, such as the boiler and CHP units, should cover the heat load in reference to Equations (21) and (22). However, the heat units, like other resources, are involved in the limitation of the generation capacities. Hence, the CHP and boiler units’ heat generation is doomed to hold in check concerning the constraints outlined in (23)–(25). In the last section, the water-energy schedule is described considering Equations (26)–(29). Here, assume that the water load can be served, taking into account the two ways to go: (1) the water tanker desalinated by the desalination units, and (2) the main water grid. Firstly, the desalination unit refreshes seawater from salt and then saves it in a water tanker, whose capacity is defined by (27) and (28). Additionally, the water balance is unfolded based on (26). Finally, the desalination unit needs to consume the electrical power , which can be calculated by the seawater amount, as indicated in (29).
3. Vulnerability Model of the Proposed Water-Power System
As noted already, on account of the growing residential loads and especially industrial loads in response to social modernism, the electrical grid infrastructure needs to be developed for dealing with it, resulting in a widely held complexity when networking the grid. This raises the chance of cascading faults and blackouts due to the vulnerable areas in the grid. To raise awareness of the grid’s vulnerability, evaluating the overriding points as a result of the at-risk areas in the grid is a must. Indeed, having looked at an efficient vulnerability analysis can help us realize the grid response once falling out of a contingency in the grid for any reason. Keeping these in mind, this section is dedicated to providing an evaluating model of vulnerability based on the structurally related matrix adjusted to the grid infrastructure. To start with, an electrical grid networked to the r line, the v bus, as well as the u generation unit are considered in the first place. In such a grid, the lines and the generators have a high chance of falling out compared to other components when several faults occur for whatever reasons. Meanwhile, we want to examine the wrecking effects of interrupting the lines and generators on powering the non-neighboring components into the grid, as shown in the results below:
3.1. The Bus Vulnerability Indices
Here, we assume that line r is disconnected due to the abrupt faults, and we describe its effects on all buses of the grid based on the following:
Equation (1) indicates that the outage of line k can affect the voltage of bus v, which results in the vulnerability index of bus . The bus index (VIN) will be 1 if overtaken by the from the threshold, otherwise the bus index will be 0. For VIN = 1, this means being vulnerable to this bus arising from the outage of line r.
3.2. The Line Vulnerability Indices
Similarly to the bus index, this part is aimed at modeling the outage effects of line k on other lines in order to identify the vulnerable lines in the grid. To this end, Equations (32) and (33) formulate the vulnerability indexes of lines based on the flowing power as follows:
Needless to say, disconnecting a line in the grid influences the flowing powers related to other lines due to the complex networking structure overlaying the grid. So, as can be seen in (32) and (33) changing the line power to the normal value is indicated in the vulnerability value for which the line index VIK will be 1 if is in excess of a threshold under the outage of line r and vice versa. By doing this, the vulnerable lines of the grid can be identified.
3.3. The Vulnerability Indices of Generators
The protective planning for generators is contrived at the highest level due to their being more easily damaged than others once a contingency has occurred within the grid. Therefore, we try to model the susceptible percentage of altering the generator’s demeanor in a reactive/active power generation system for truck contingencies. Assume that the line r is not achievable because of a fault here. It is worth noting that powering loads through generators is possible by using the connecting lines over the grid. Hence, getting lines out results in the alteration of the power generation of the generators to optimally dispatch and consult the power balance between the loads and resources. If these changes are in excess of the normal value, it indicates being vulnerable to generators for the outage of line r. The calculation of how the vulnerability index of reactive/active powers for the generation units can be modeled is demonstrated in Equations (34)–(37).
Thereafter, we insert and save the vulnerability indexes arising from the outage of line k for buses, generators, and lines in the matrix .
Additionally, this process from Equation (32) to Equation (37) is echoed for evaluating the vulnerability of the grid under the outage of generator u, and in turn, the relevant results are saved into the matrix , as indicated in (39).
Following this, it is necessary to normalize the matrixes with an emphasis on the total number of the grid components for making the sensitive effects of the contingencies on the buses, lines, and generators as the outage indexes of the line and generator (NLO, NGO), as demonstrated in (40) and (41).
Based on all these results, the objective function for satisfying the vulnerability goals is defined below:
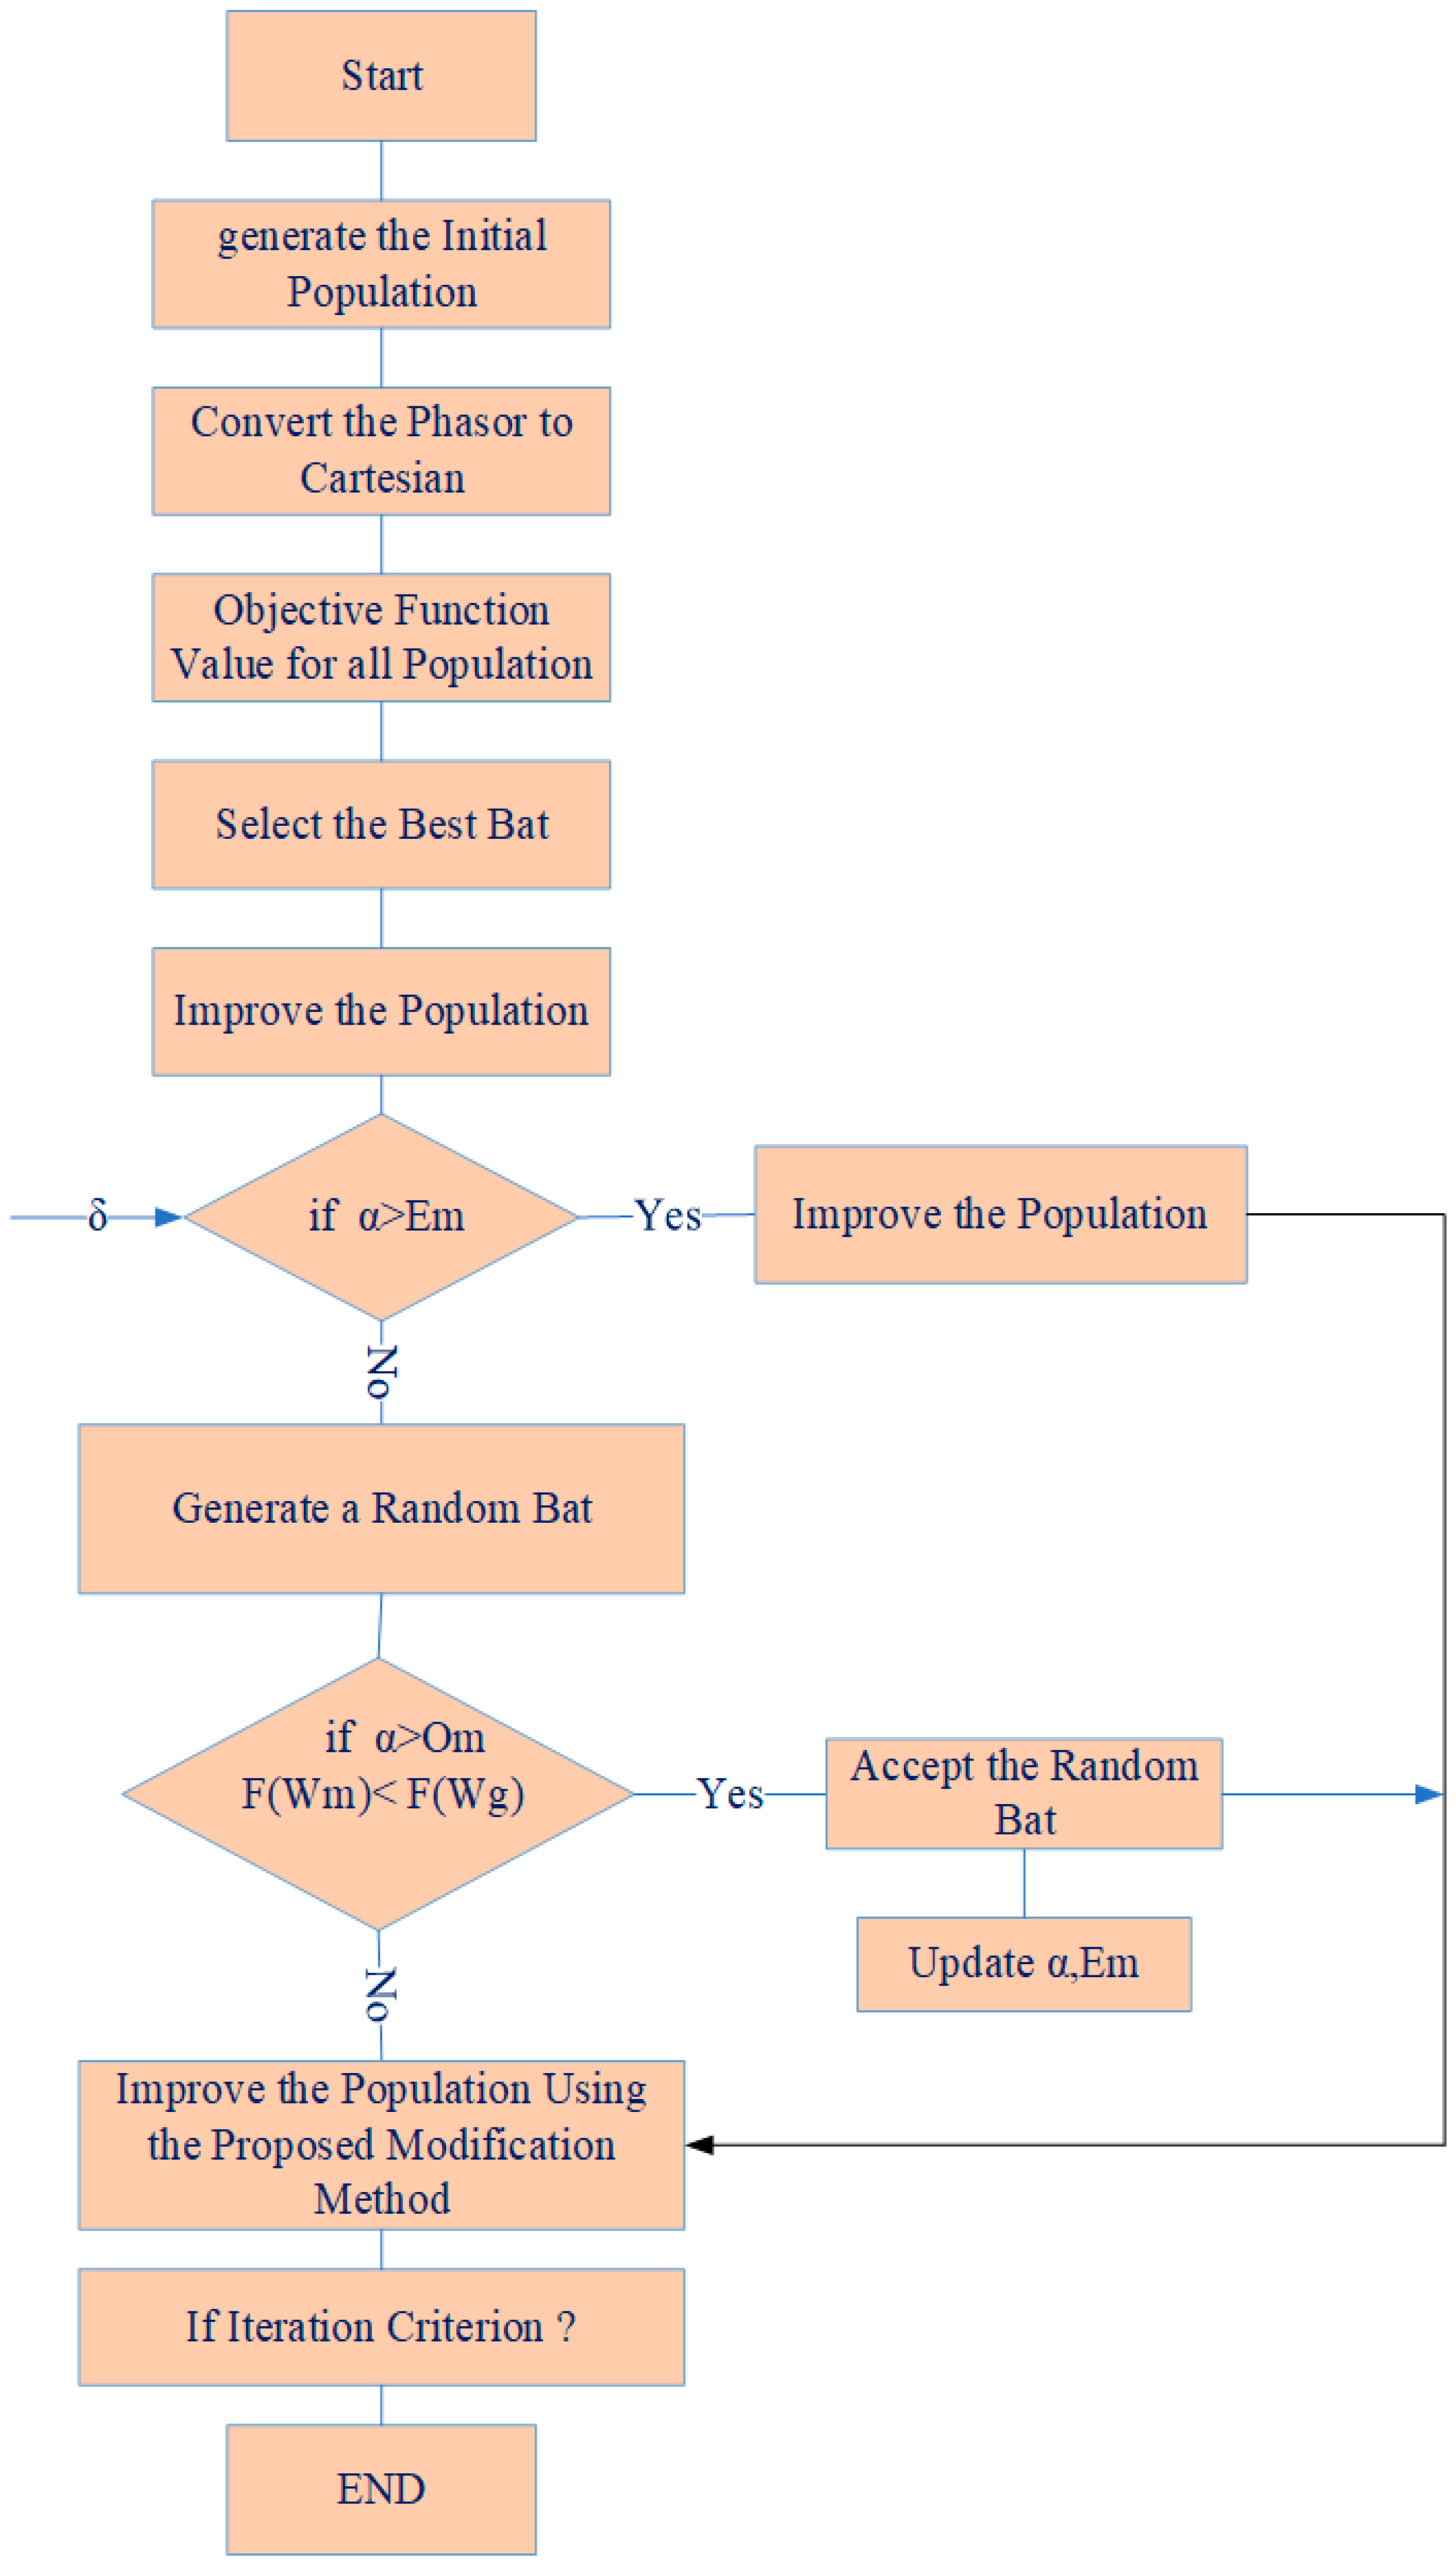
3.4. θ-Modified Bat Optimization Algorithm
Finding an optimal solution to manage energy between the proposal hub system and the electrical grid while aiming to decline the vulnerability indices is another challenge that needs to be dealt with. Hence, we propose a modified bat-based solving algorithm to achieve reliable energy management and determine the optimal power transaction between the hub system and the grid. To start with, the number of flying bats is first defined in the same way in and velocity , while the voice signal’s frequency is regarding loudness . Note that the varied rates of (speed value of bats) are considered a target in the converging process of this algorithm. Based on speaking, finding an optimal solution is possible if the bat population is updated, considering the fitness function related to each member:
Following this, the bat population needs to achieve the new update with an emphasis on bat speed and α. On the basis of this, if , the updated moving will be as follows:
However, otherwise, new bat regarding will be generated, and the finality of other parameters will be updated based on the following:
In order to enhance the algorithm’s performance in terms of the converging speed and finding solutions, there is a modification to the process based on the mapping coordinates from cartesian space to polar space as follows:
Here, is defined . All in all, a member of the population is generated regarding Equation (51), as indicated in Figure 2.
4. Digital Twin Model of the Proposed Water-Power System
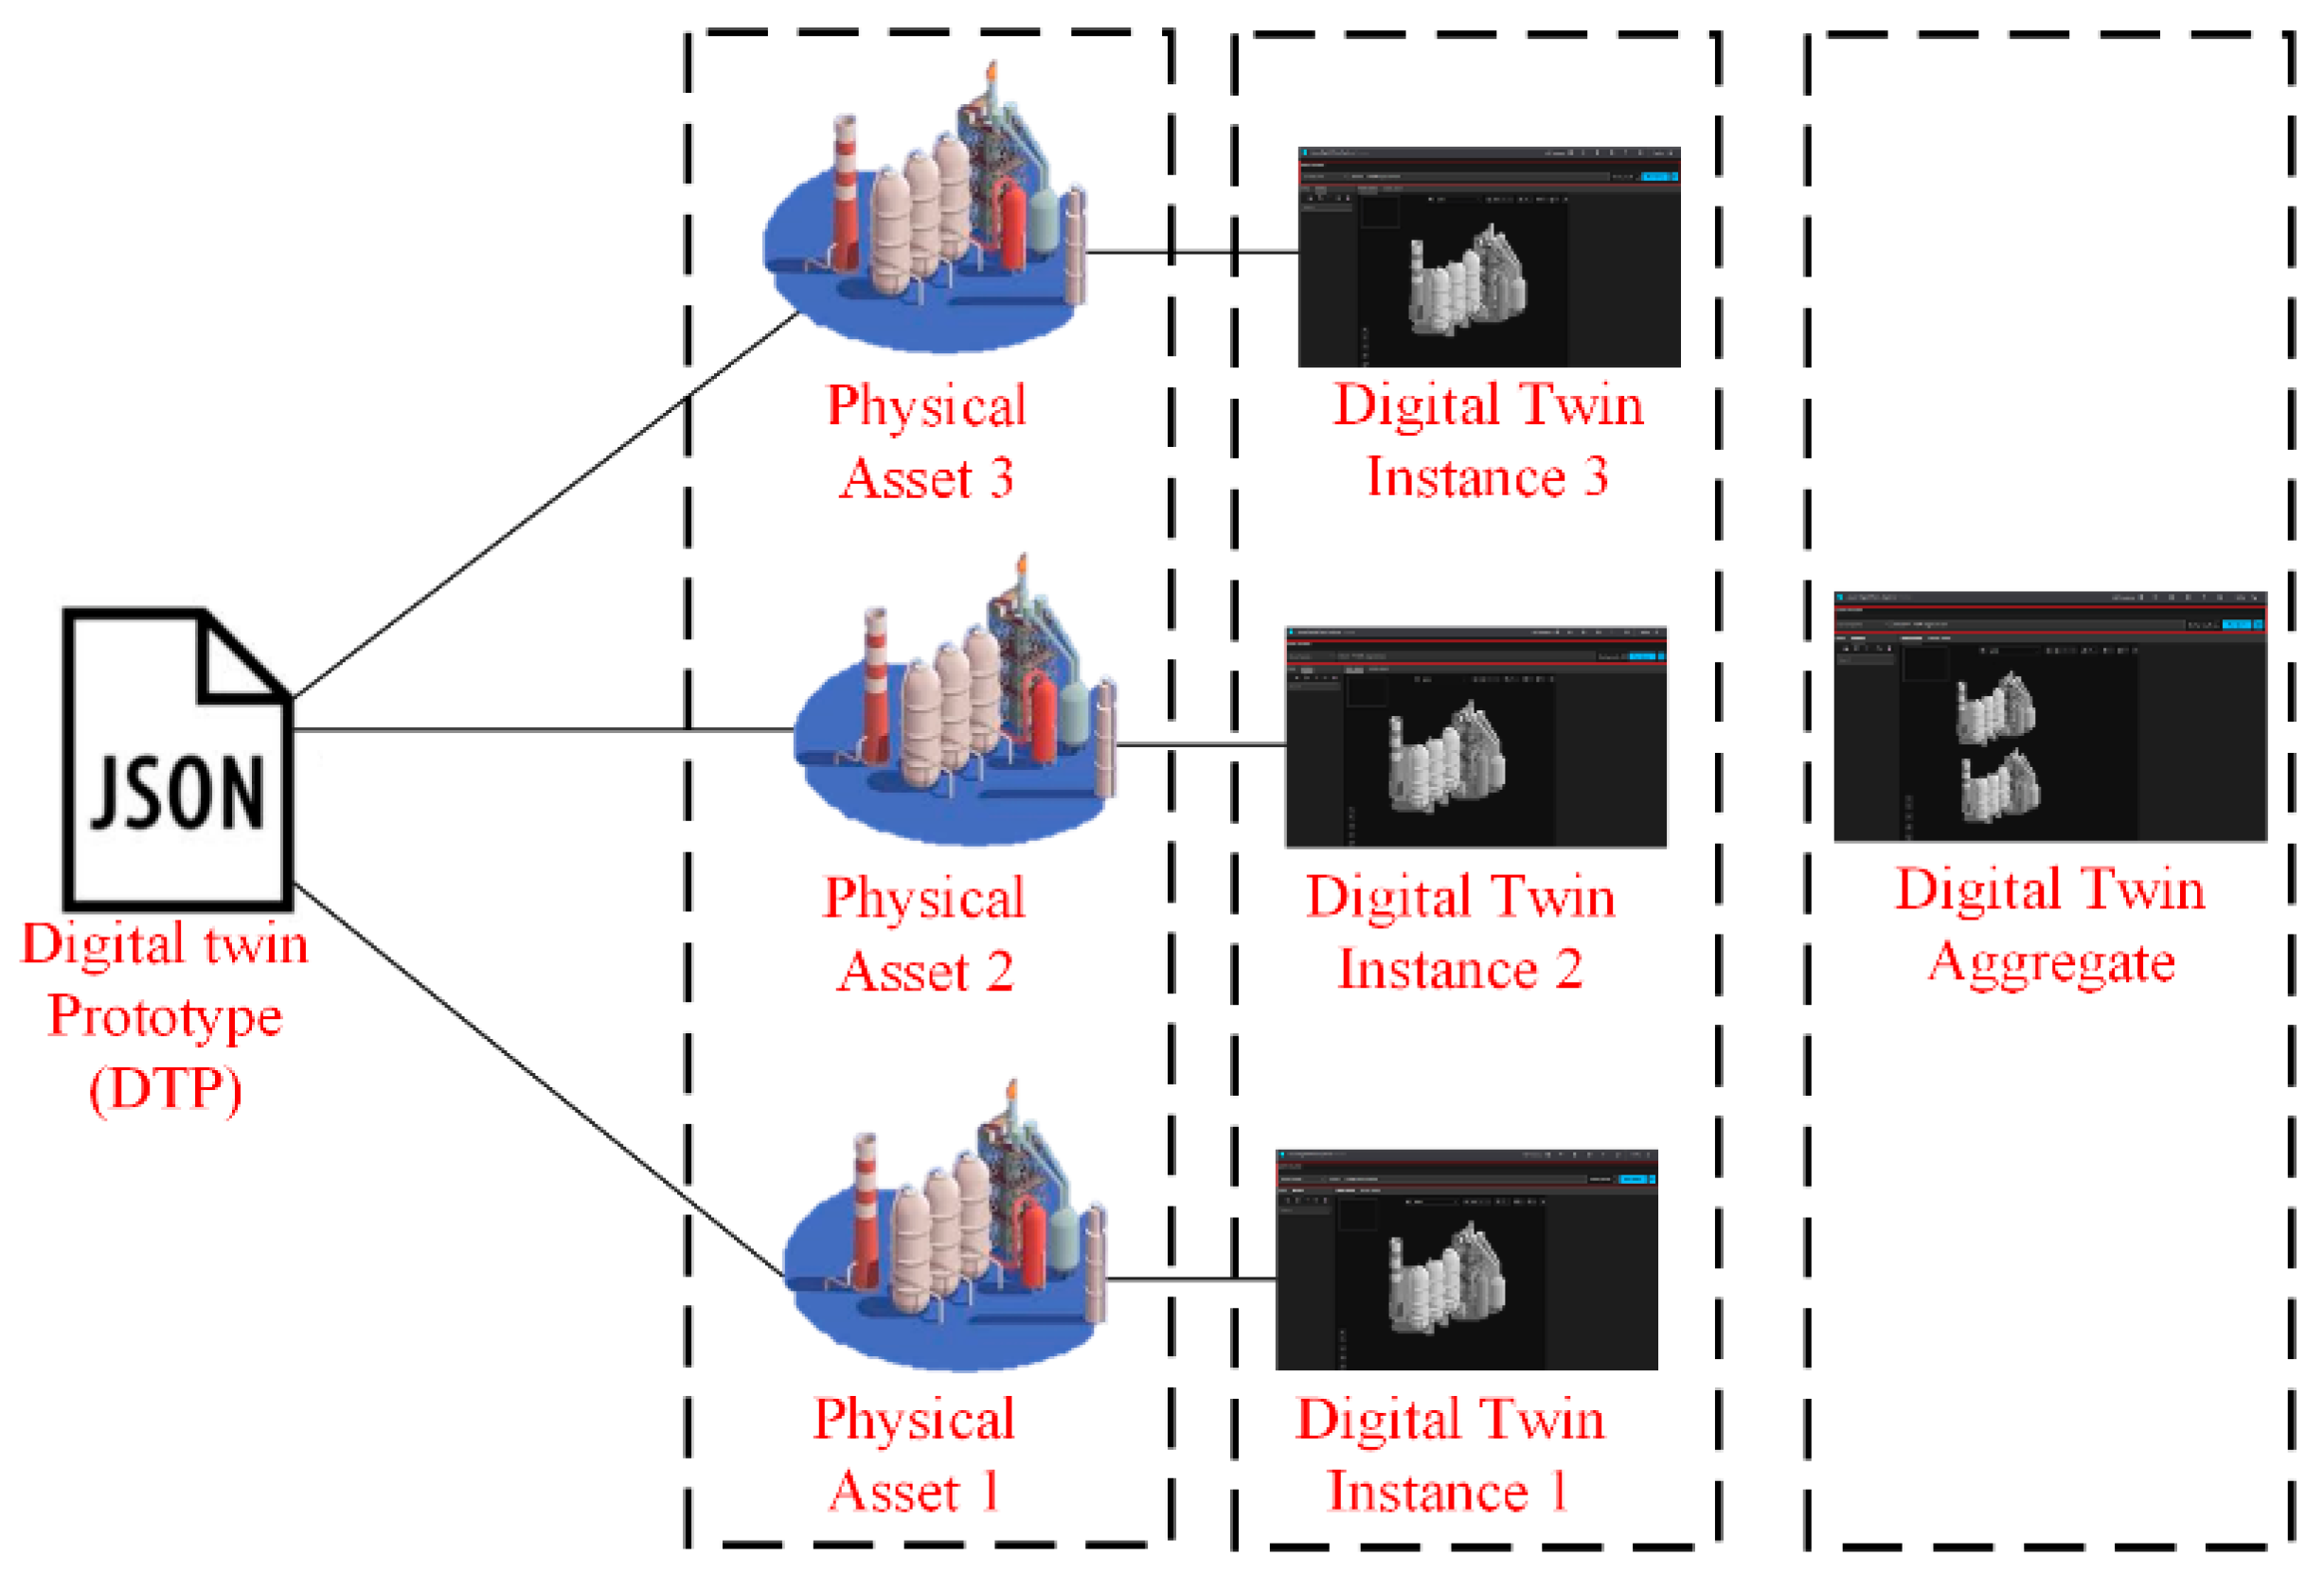
The digital twin is a basic definition of the data structure adapted from the physical model itself. Basically, the digital twin can carry out results that are similar to the physical one for the same inputs. Overall, the digital twin’s definition that is presented in the literature is based on three concepts: (1) the digital twin prototype (DTP), (2) the digital twin instance (DTI), and (3) the digital twin aggregate (DTA). The first definition provides the type of physical model. This concept is considered in the design process as the primary version of the digital twin development. A DTP draft of a CHP unit with a JSON format, for instance, is described as the CHP model. This JSON format is also enforceable for the other types of equipment in a water-power system. such as a boiler, battery, and desalination unit. as well as a whole electrical grid. In the second stage, regarding the JSON draft of the prototype, the digital twin instance (DTI) is drawn out and mapped on the digital software (as Amazon and or another one). On the basis of this, any change in the DTP version leads to updating its DTI draft, which can help with the allegiance enhancement in the digital twin process. In the end, all the digital drafts of the DTIs related to a digital twin model are concentrated in a digital twin aggregator (DTA) draft and are provided with a tracking mechanism to handle them. It is necessary to note that any draft of a DTI can be carried out without the need for other DTIs, whereas it is impossible to draft DTAs. All in all, to raise awareness, Figure 3 shows the design process of a digital twin.
4.1. The DT Development Process of the Water-Power System into the Electrical Grid
In this section, let us treat the digital twin development for the proposed water-power system that is used in the electrical grid. As noted already, the water-power or hub system includes various physical assets such as the boiler and CHP units, the water desalinated unit, the storage unit, and also a transformation device that connects with the grid. On the other side, a simple structure of the electrical grid is made up of varied components that are akin to the lines, buses, generators, and finality loads concerning their connections. Starting with the digital twin development of the studied case, it should be generated in JSON format, and then the DTI drafts of all units for the water-power system should be jointly aggregated in the DTIs as the end version of the DTA of the water-power system. This work was carried out for the simple structure of the electrical grid and generated a DTA draft of the grid. Finally, both the DTA drafts are laid up together in a final DTA draft, which describes the primary digital twin that is developed for our system along with an Internet of Things (IoT)-based cloud mechanism. This mechanism can facilitate the data exchange between the physical and digital twins.
4.2. Definition of the Proposed Digital Twin Model
Early on, for better realization, the step-by-step trend of making a CHP-DTA is illustrated in Figure 3. Practically, if we here want to develop a digital twin model, we need to learn a digital twin model language (DTML) to make the JSON format of every physical model. Indeed, this DTML helps us have access to the defined digital twin in order to fill in the real data that is derived from the physical assets and is related to their properties. By doing this, interoperability can be flexible among the digital twin models that are defined in a system. In our case, the digital twin drafts of the water-power system and the electrical grid can have internet access based on the DTML and the developing IoT platform.
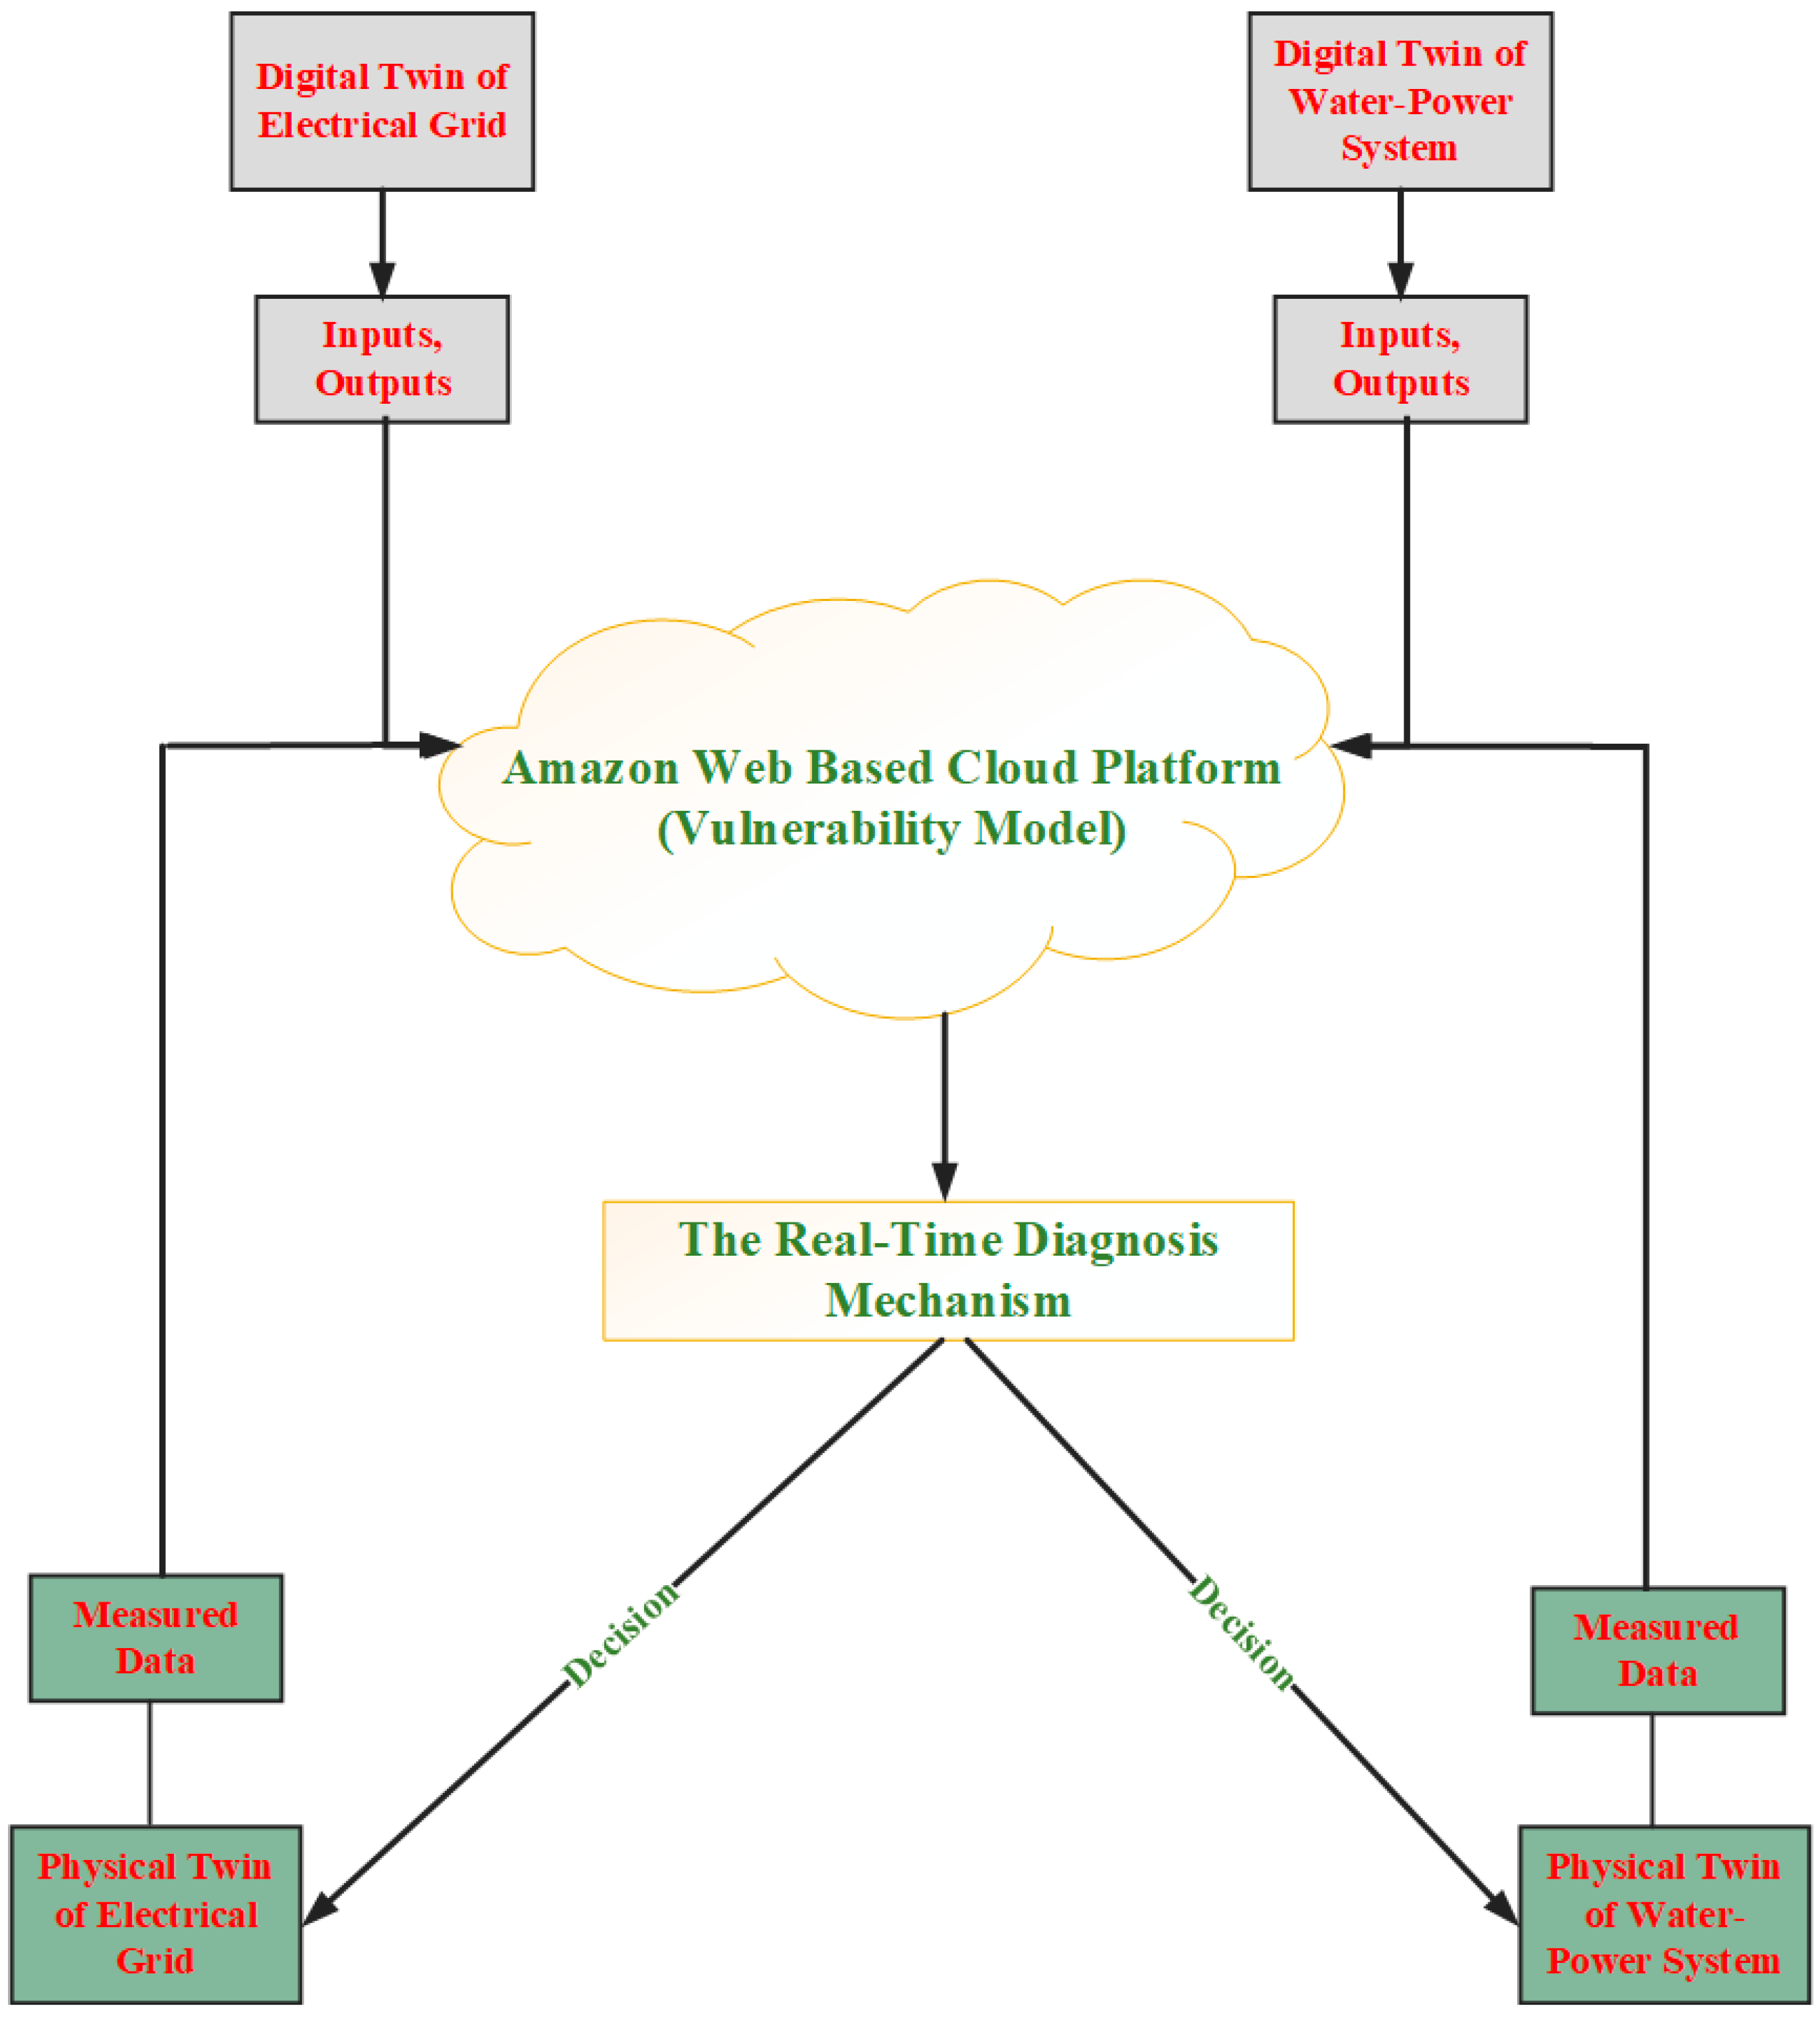
Hence, an easy and simple understanding of the proposed structure is provided in Figure 4. It is shown that the digital and physical twins of the water-power system are run for the same inputs, and their data are sent to the cloud platform for comparison in real time. On another note, the interaction between the digital and physical twins of the electrical grid is compared based on real-time data. It is worth noting that DTIs and DTAs related to both the digital twins (water-power system and grid) are defined based on the “member of” scenario using DTML. Definitely, such a DTLM-based structure makes us realize all of the activities of the physical twins (water-power system and grid) that are sent to the cloud environment by IoT. We can also add every new DTI to our digital twin model and relate it to others thanks to the digital twin’s software design. All in all, this digital structure of our system can help us instantaneously check the grid’s behavior under contingencies and make a coefficient decision for the interaction with the water-power system to control the vulnerability indices.
5. Uncertainty Model of the Proposed Energy Management
In this section, we tend to describe the effects of uncertain input parameters in the real system, which can affect the analysis of the digital twin model and result in unreliable results and decisions. Therefore, it is needed to provide an effective method to model the uncertainty before the performance of the digital twin model. On the basis of this, we propose an uncertainty model derived from the UT concept in order to reduce the errors of the estimating parameters and map out the correlation among them. To start with, the uncertain points are stored in pi considering their means and variances C, Q, and also function . The modeling process of the proposed method can be found below.
Step 1: calculate the uncertain points based on (52)–(54).
here is the covariance of points and also .
Step 2: the weight related to each point is calculated as follows:
Step 3: carrying out steps 1 and 2, the outcomes are obtained by .
6. Simulation and Evaluation
We have performed and assessed the electrical grid’s vulnerability, which is bolstered via a water-power system that takes advantage of the digital twin’s knowledge for a real-time analysis. To tell the truth, developing the digital analysis of our physical twin model provides assistance and enables us to check out the real grid’s performance and provide well-timed decisions in interaction with the water-power system, which is aiming for vulnerability enhancement. On the basis of this, we tried to develop the proposed water-power system along with the electrical grid for both forms of the physical and digital twin models with the help of Gams, MATLAB, Python, Linux, and Amazon Cloud Services (ACS) on an i7-PC with 64 GB of RAM. It is axiomatic that the smart grid structure comprises fossil fuel, buses, lines, and loads, all of which are located in the IEEE 24-bus test system. Besides that, the studied hub system includes three various parts: (1) the electrical network: the transformative unit and the storage unit; (2) the heat network: the boiler unit and the CHP unit; (3) and the water network: the desalination unit and the main water grid. The detail data of the hub system is derived from [20]. The study was carried out over a 24 h daily horizon. Given this note, the input data related to the water-power system and grid infrastructure can be found in detail in the references [21,22,23].
6.1. The Vulnerability Analysis of the Physical Water-Power System Based Electrical Grid
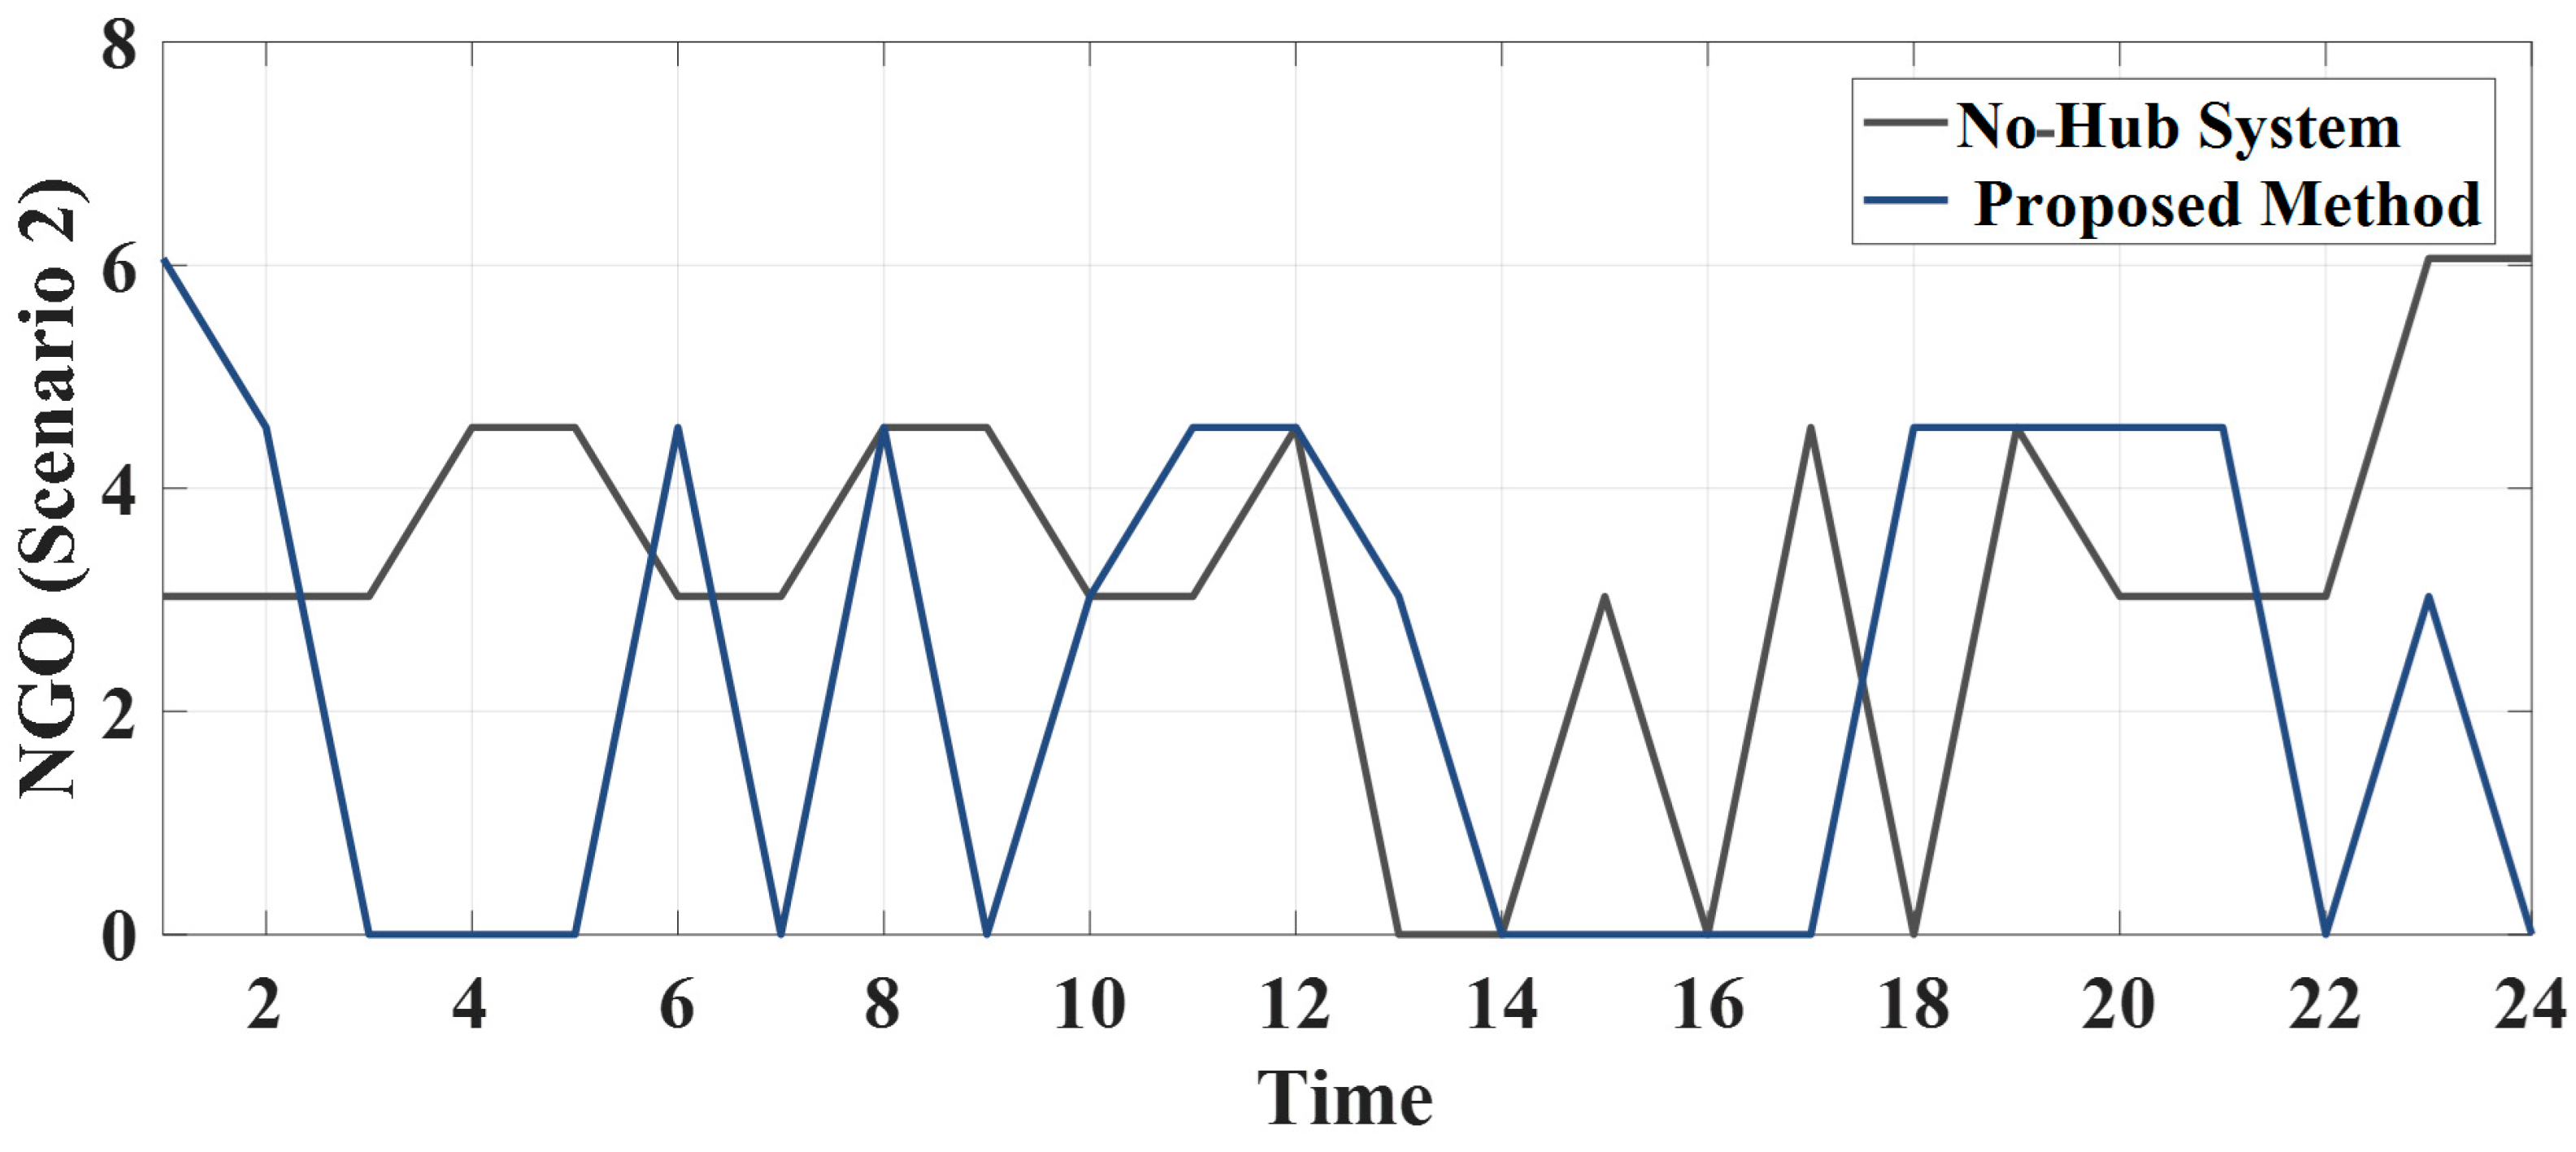
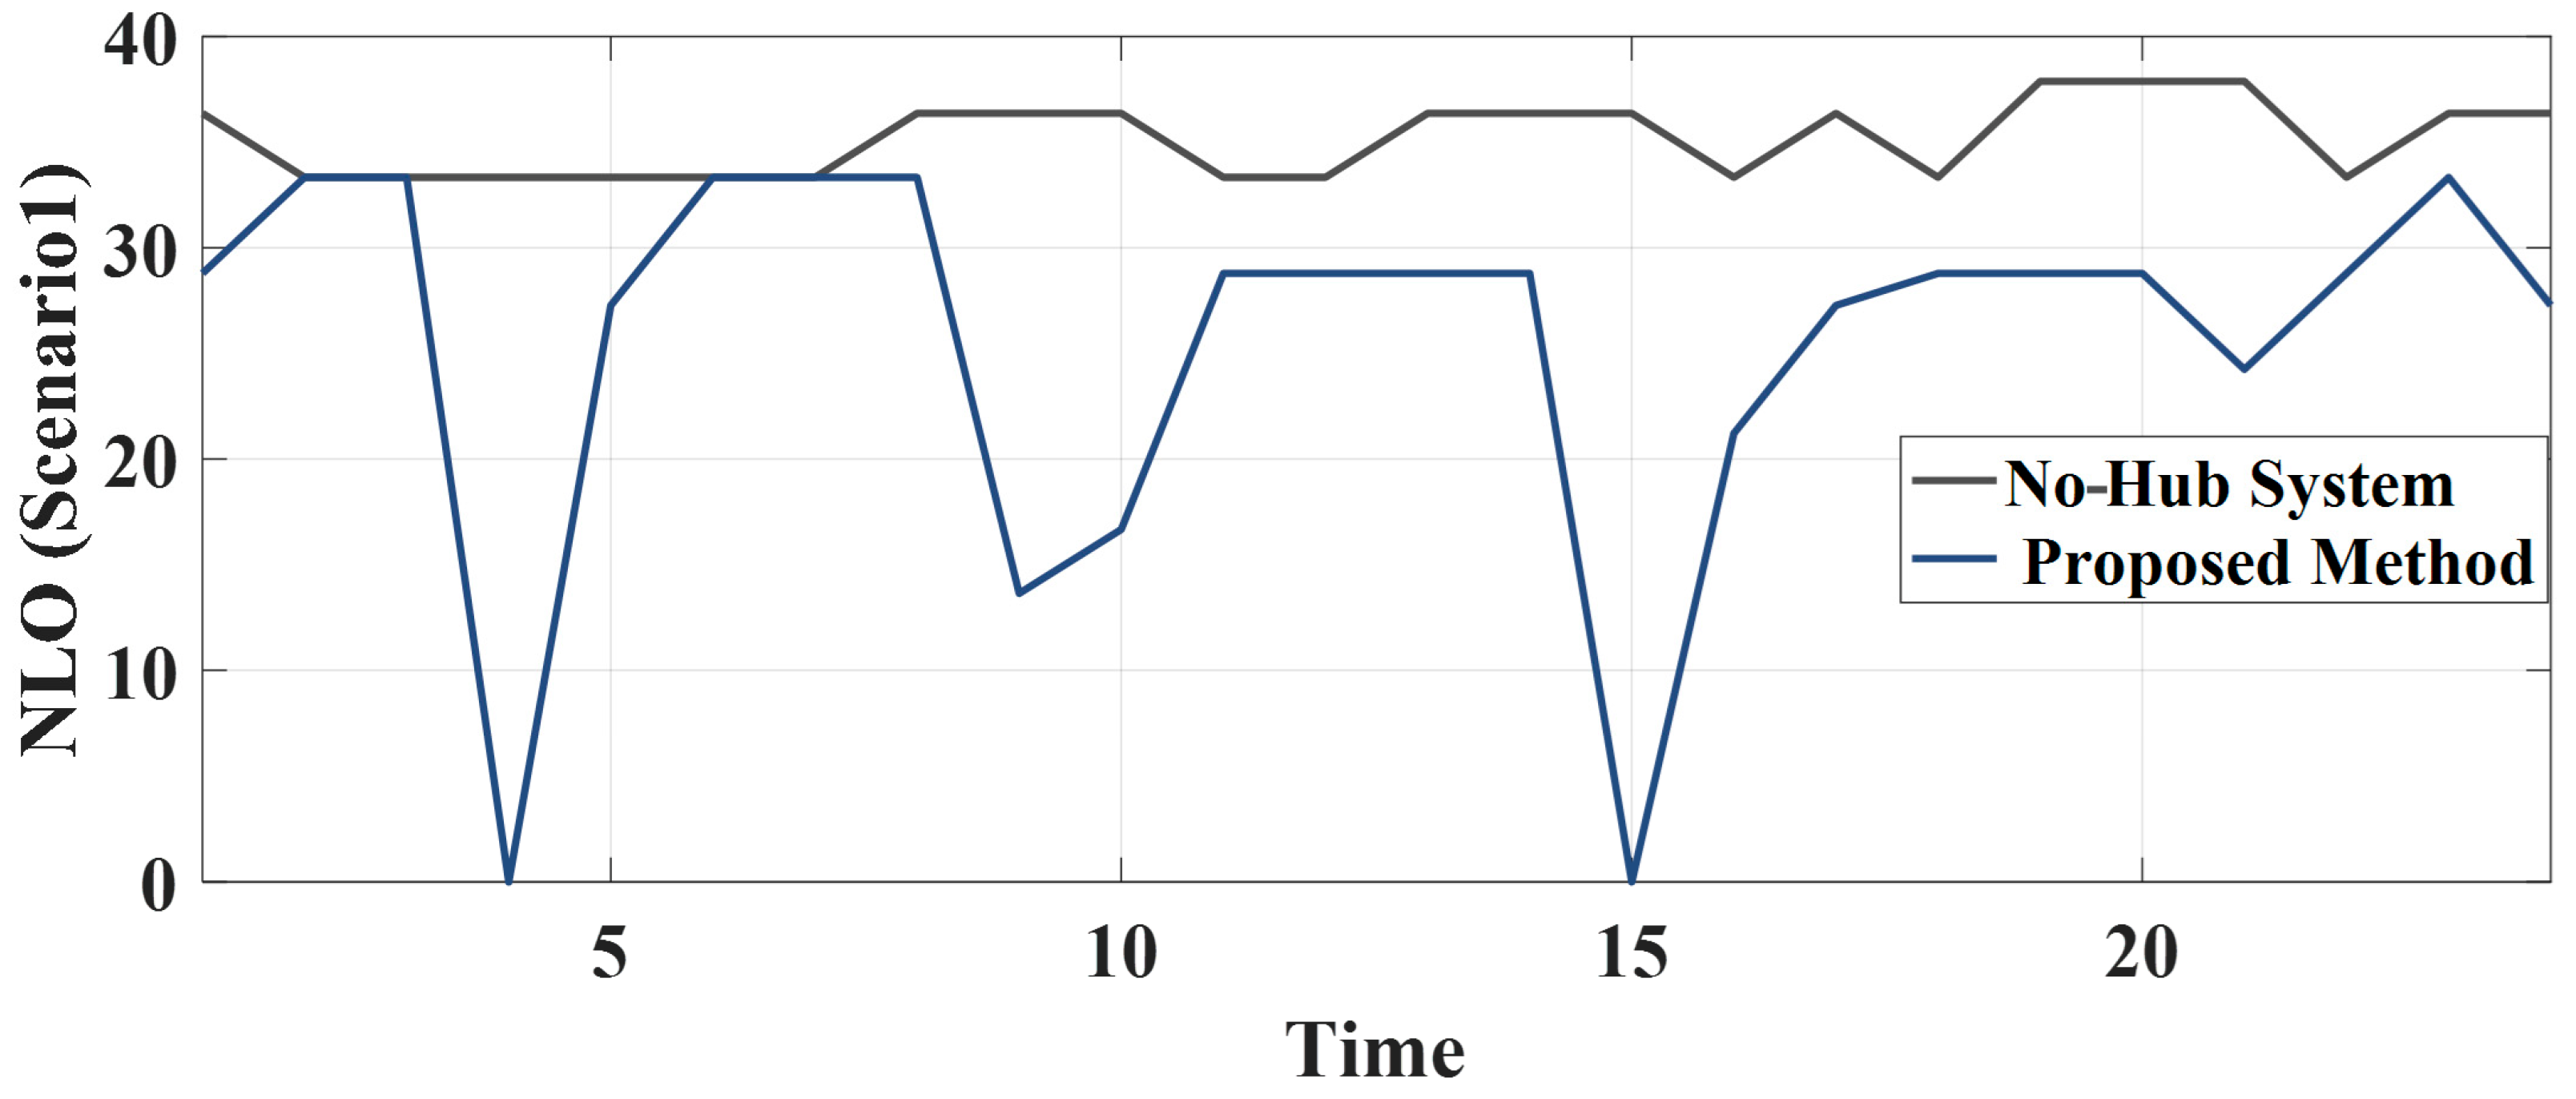
In this section, we first try to guide readers on how to develop the physical and digital twins of our proposed whole system and then illustrate the privilege of the water-power system on the grid vulnerability enhancement against the line and generator contingencies. To this end, we performed the physical model of the water-power system along with the electrical grid on the Gams and Matlab software and developed them into the Wi-Fi-based hardware well-known Raspberry Pi Board (RPB) as our physical twin. On the other side, the digital twin model of our system was carried out in the Linux environment with reference to the same structure and inputs that would be sent as outcomes to the ACS for assessment. To raise awareness, let us explain some elucidations on how to run the physical and digital twins based on the ACS in a relationship. At the end of running the real system on RPB, the inputs and outputs of the system’s performance that are needed for analysis are sent to the cloud platform, which is connected to the Amazon Web. Conversely, the digital twin model of our system is operative on Linux, and the buffered data are sent to ACS through a Python program. Here, the analysis mechanism based on the digital twin will check and provide errors, resulting in the RPB-based real system becoming the physical twin model. Based on these errors and on the basis of our studied case, we separately carried out the water-power system and the electrical grid based on the IEEE-24 bus test system in RPB and sent the data to the cloud platform. Following that, a similar system that was also individually performed on Linux and connected with the cloud using a Python code [16] is used to illustrate the root mean square (RMS) errors in the physical one. Based on these errors, the grid can adapt a coefficient decision in interaction with the water-power or hub system to enhance the vulnerability indices. It is worth noting here that we first presented the convincing reasons for the proposed system’s effectiveness in improving the vulnerability indices of the gird. To start with, we run the system along with the vulnerability model for two varied scenarios: (1) the outage of lines 22 and 15 and (2) the outage of generator 1, which also provided the relevant consequences in Figure 5, Figure 6, Figure 7, Figure 8, Figure 9 and Figure 10. As noted in the vulnerability analysis, when a contingency occurs during the grid operation, its effects can intervene in the grid’s performance in terms of the bus voltage, the power flow of lines, and the active/reactive power generation of generators. Hence, we hope that the proposed framework can reduce the reasonless effects of shutting down the generators or the lines on the whole grid operation. To achieve a better realization, indices NGO and NLO in the vulnerability analysis can help us understand the proposed method’s effectiveness. Hence, Figure 5 and Figure 6 illustrate the comparative results for two scenarios, 1 and 2, based on the following two methods: (1) the no-hub system and (2) the proposed system. In fact, this comparison can reveal the proposed model’s effects on enhancing the grid’s vulnerability. As can be seen in Figure 5, the vulnerability index of the NGO for the proposed model takes an alleviating way on average for scenario 2 compared to the no-hub system. This means that the grid’s performance in terms of voltages and flowing power would be slightly impressed against the contingency of the generator outage, which in turn leads to a reliable grid. The same deduction can be seen for the vulnerability index of the NLO once applying scenario 1 onto the grid, as shown in Figure 6. In light of this evidence, the grid vulnerability that arises from the line outage is notably reduced by the power interaction with the water-power system.
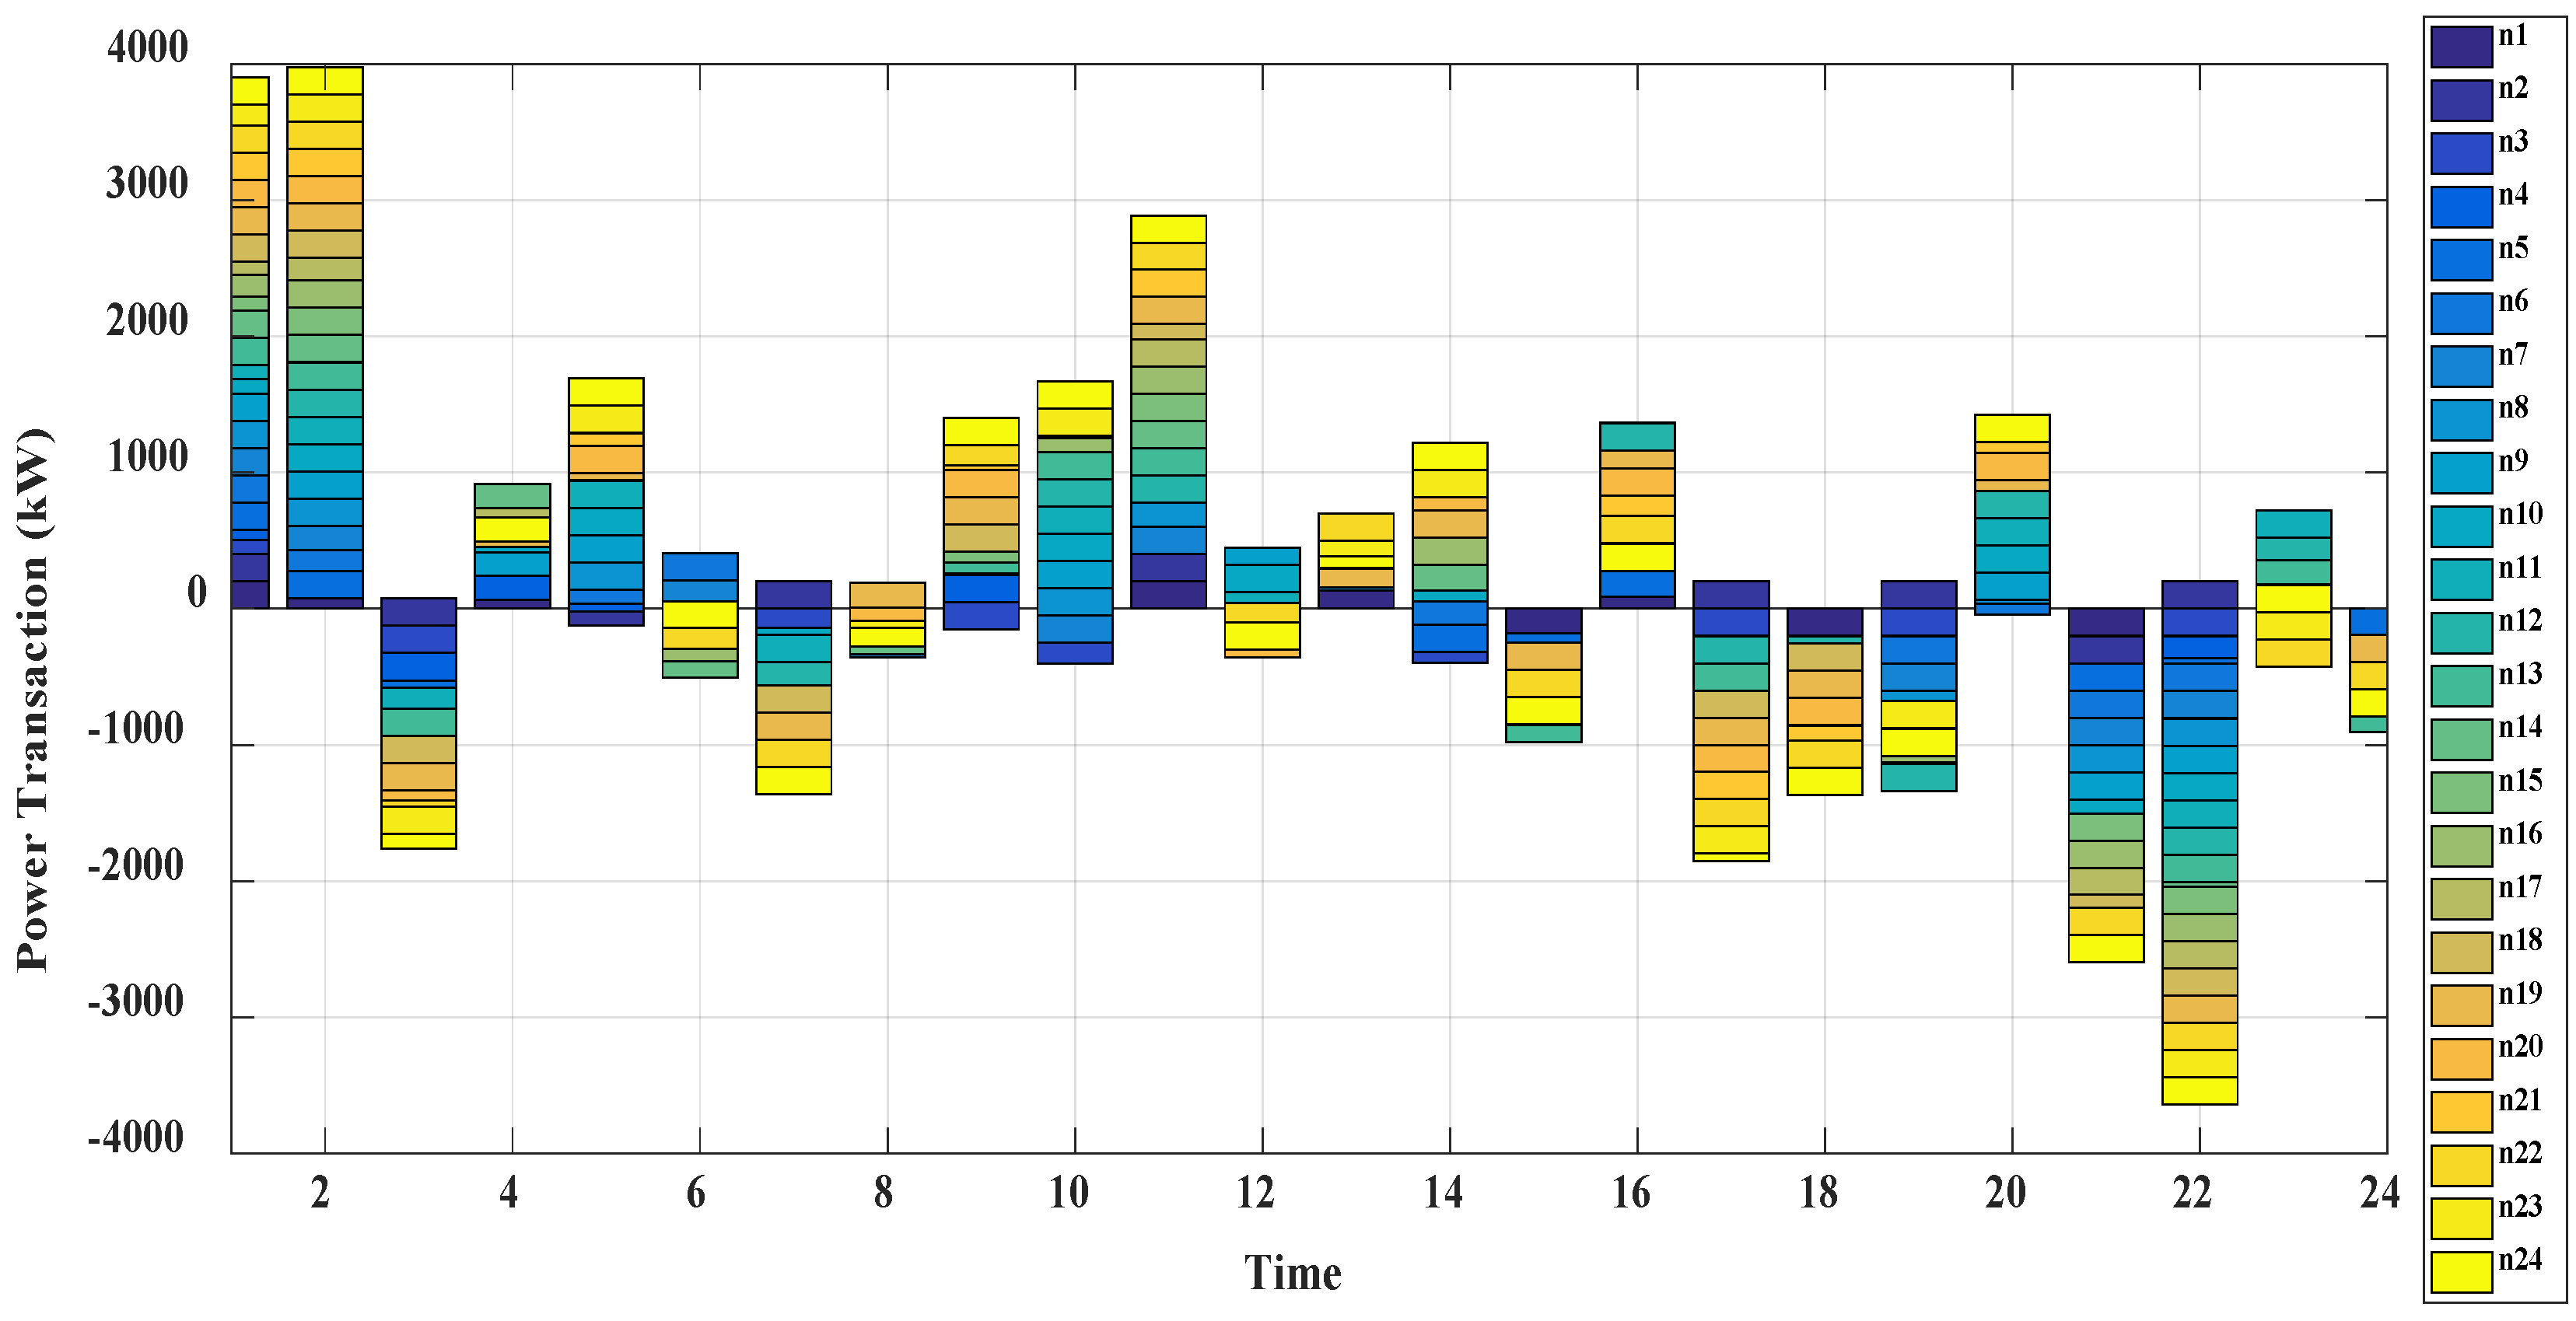
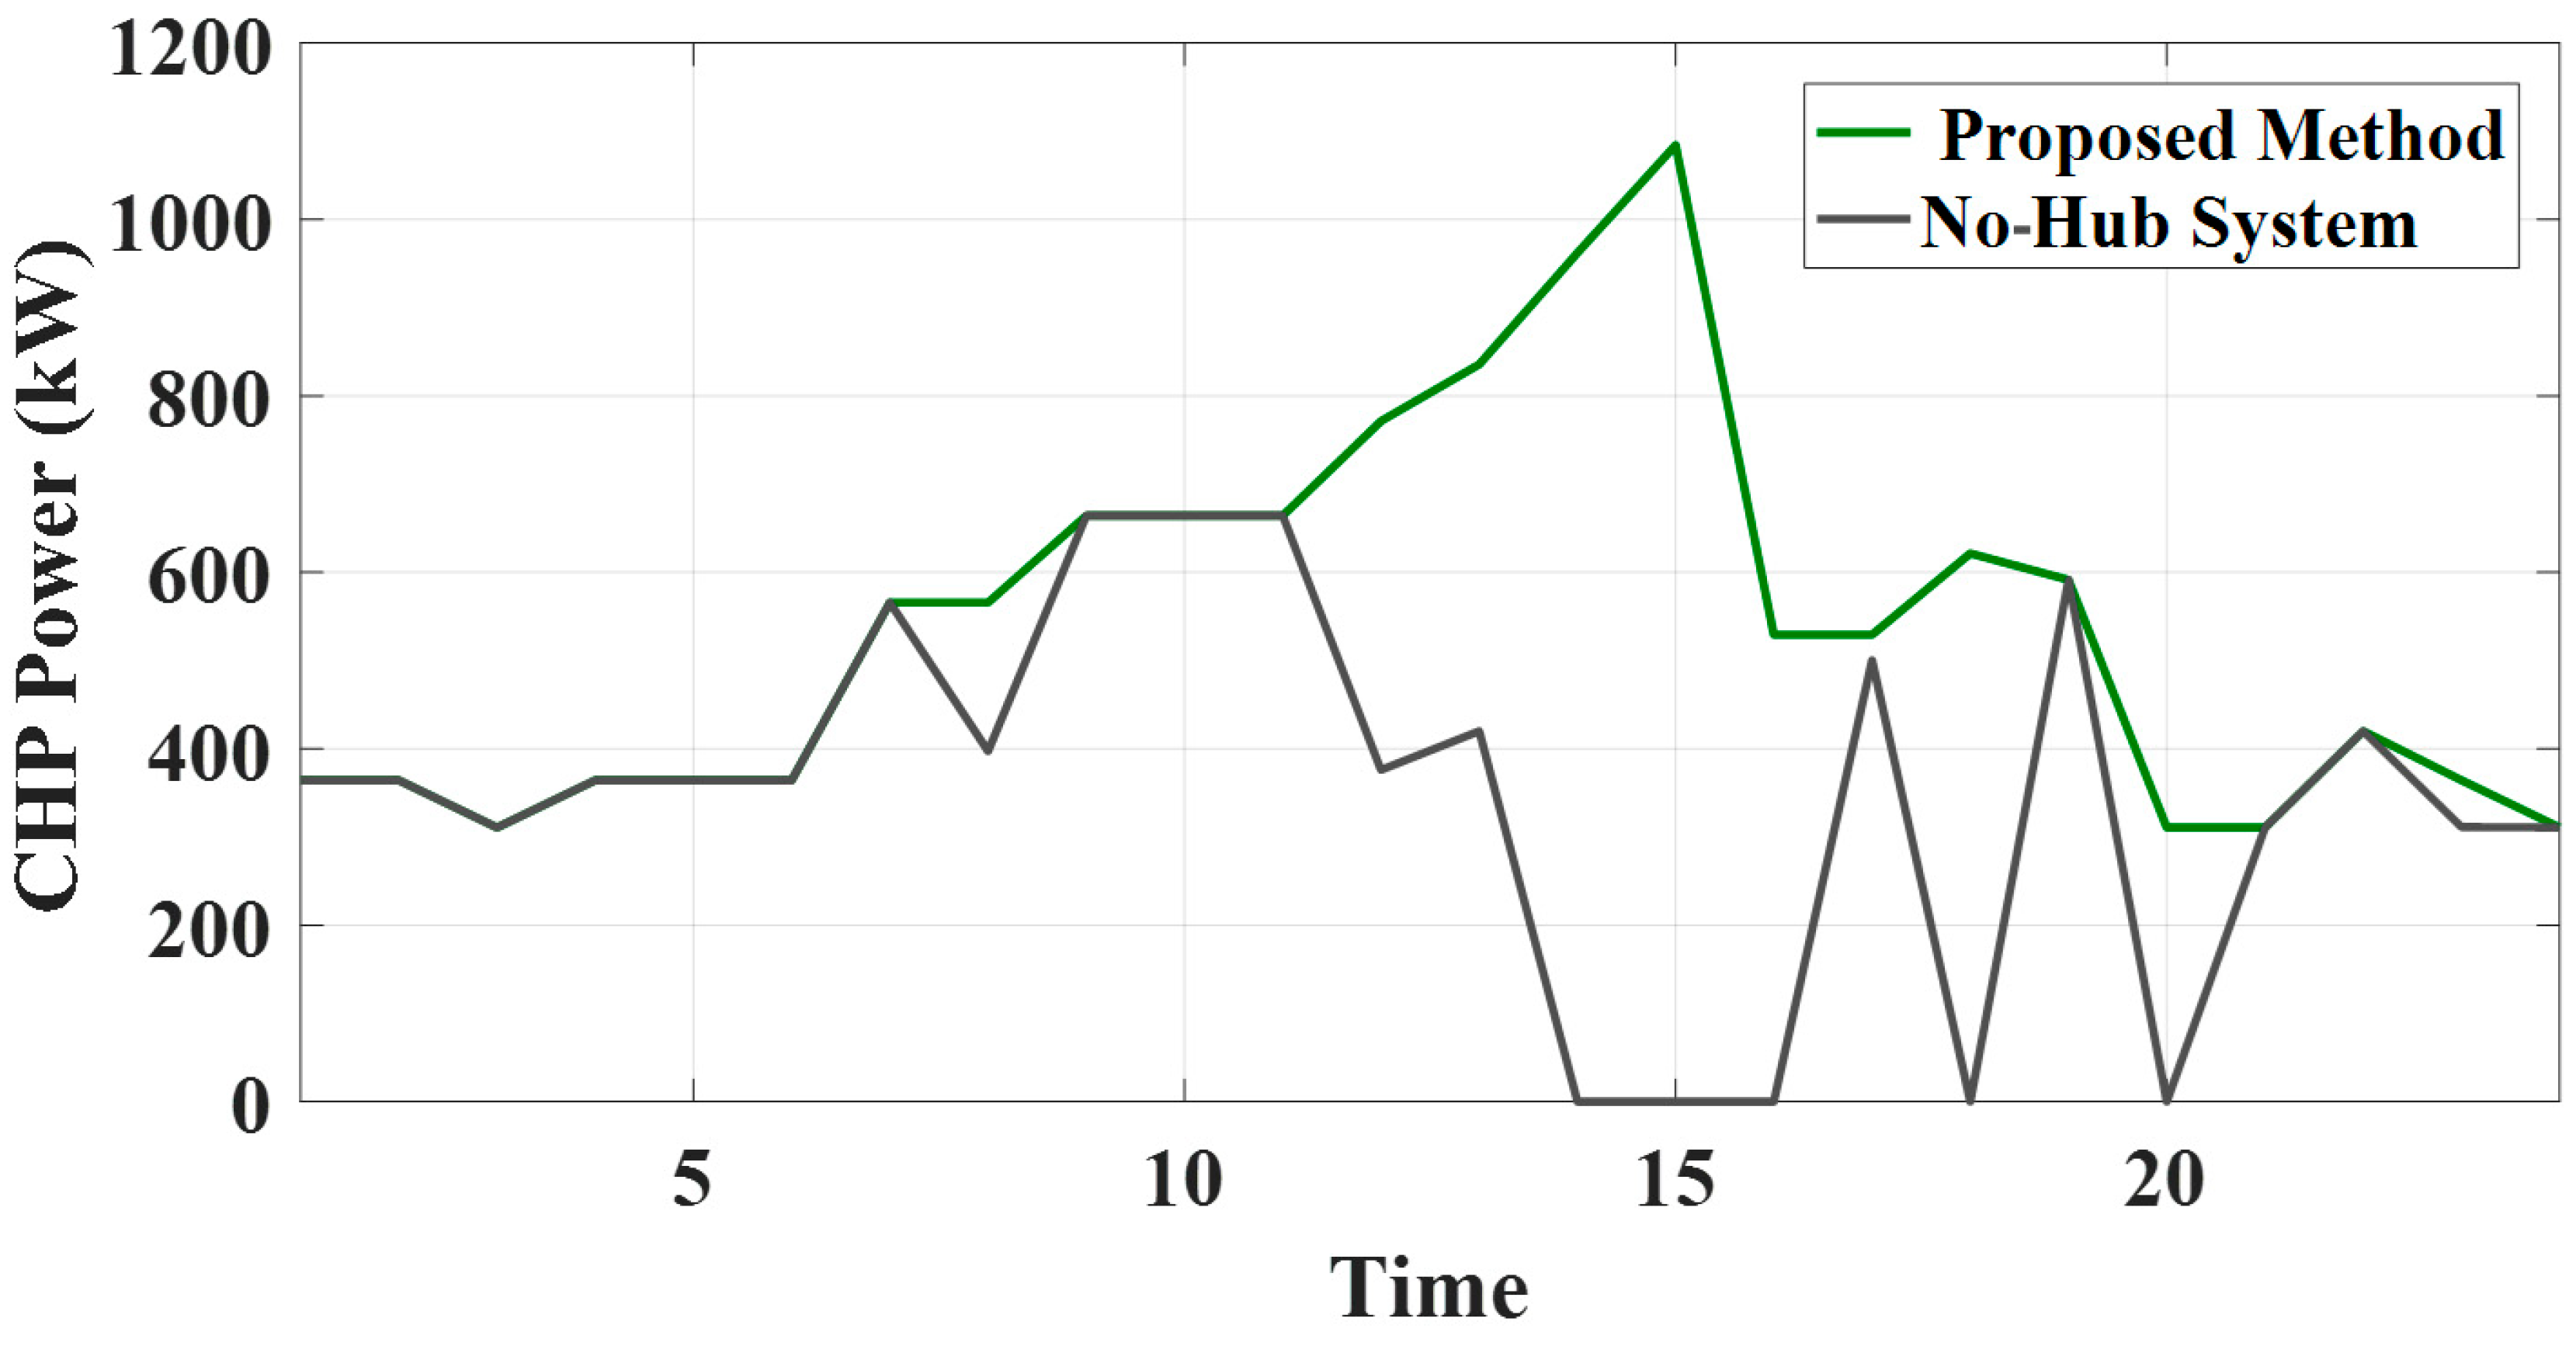
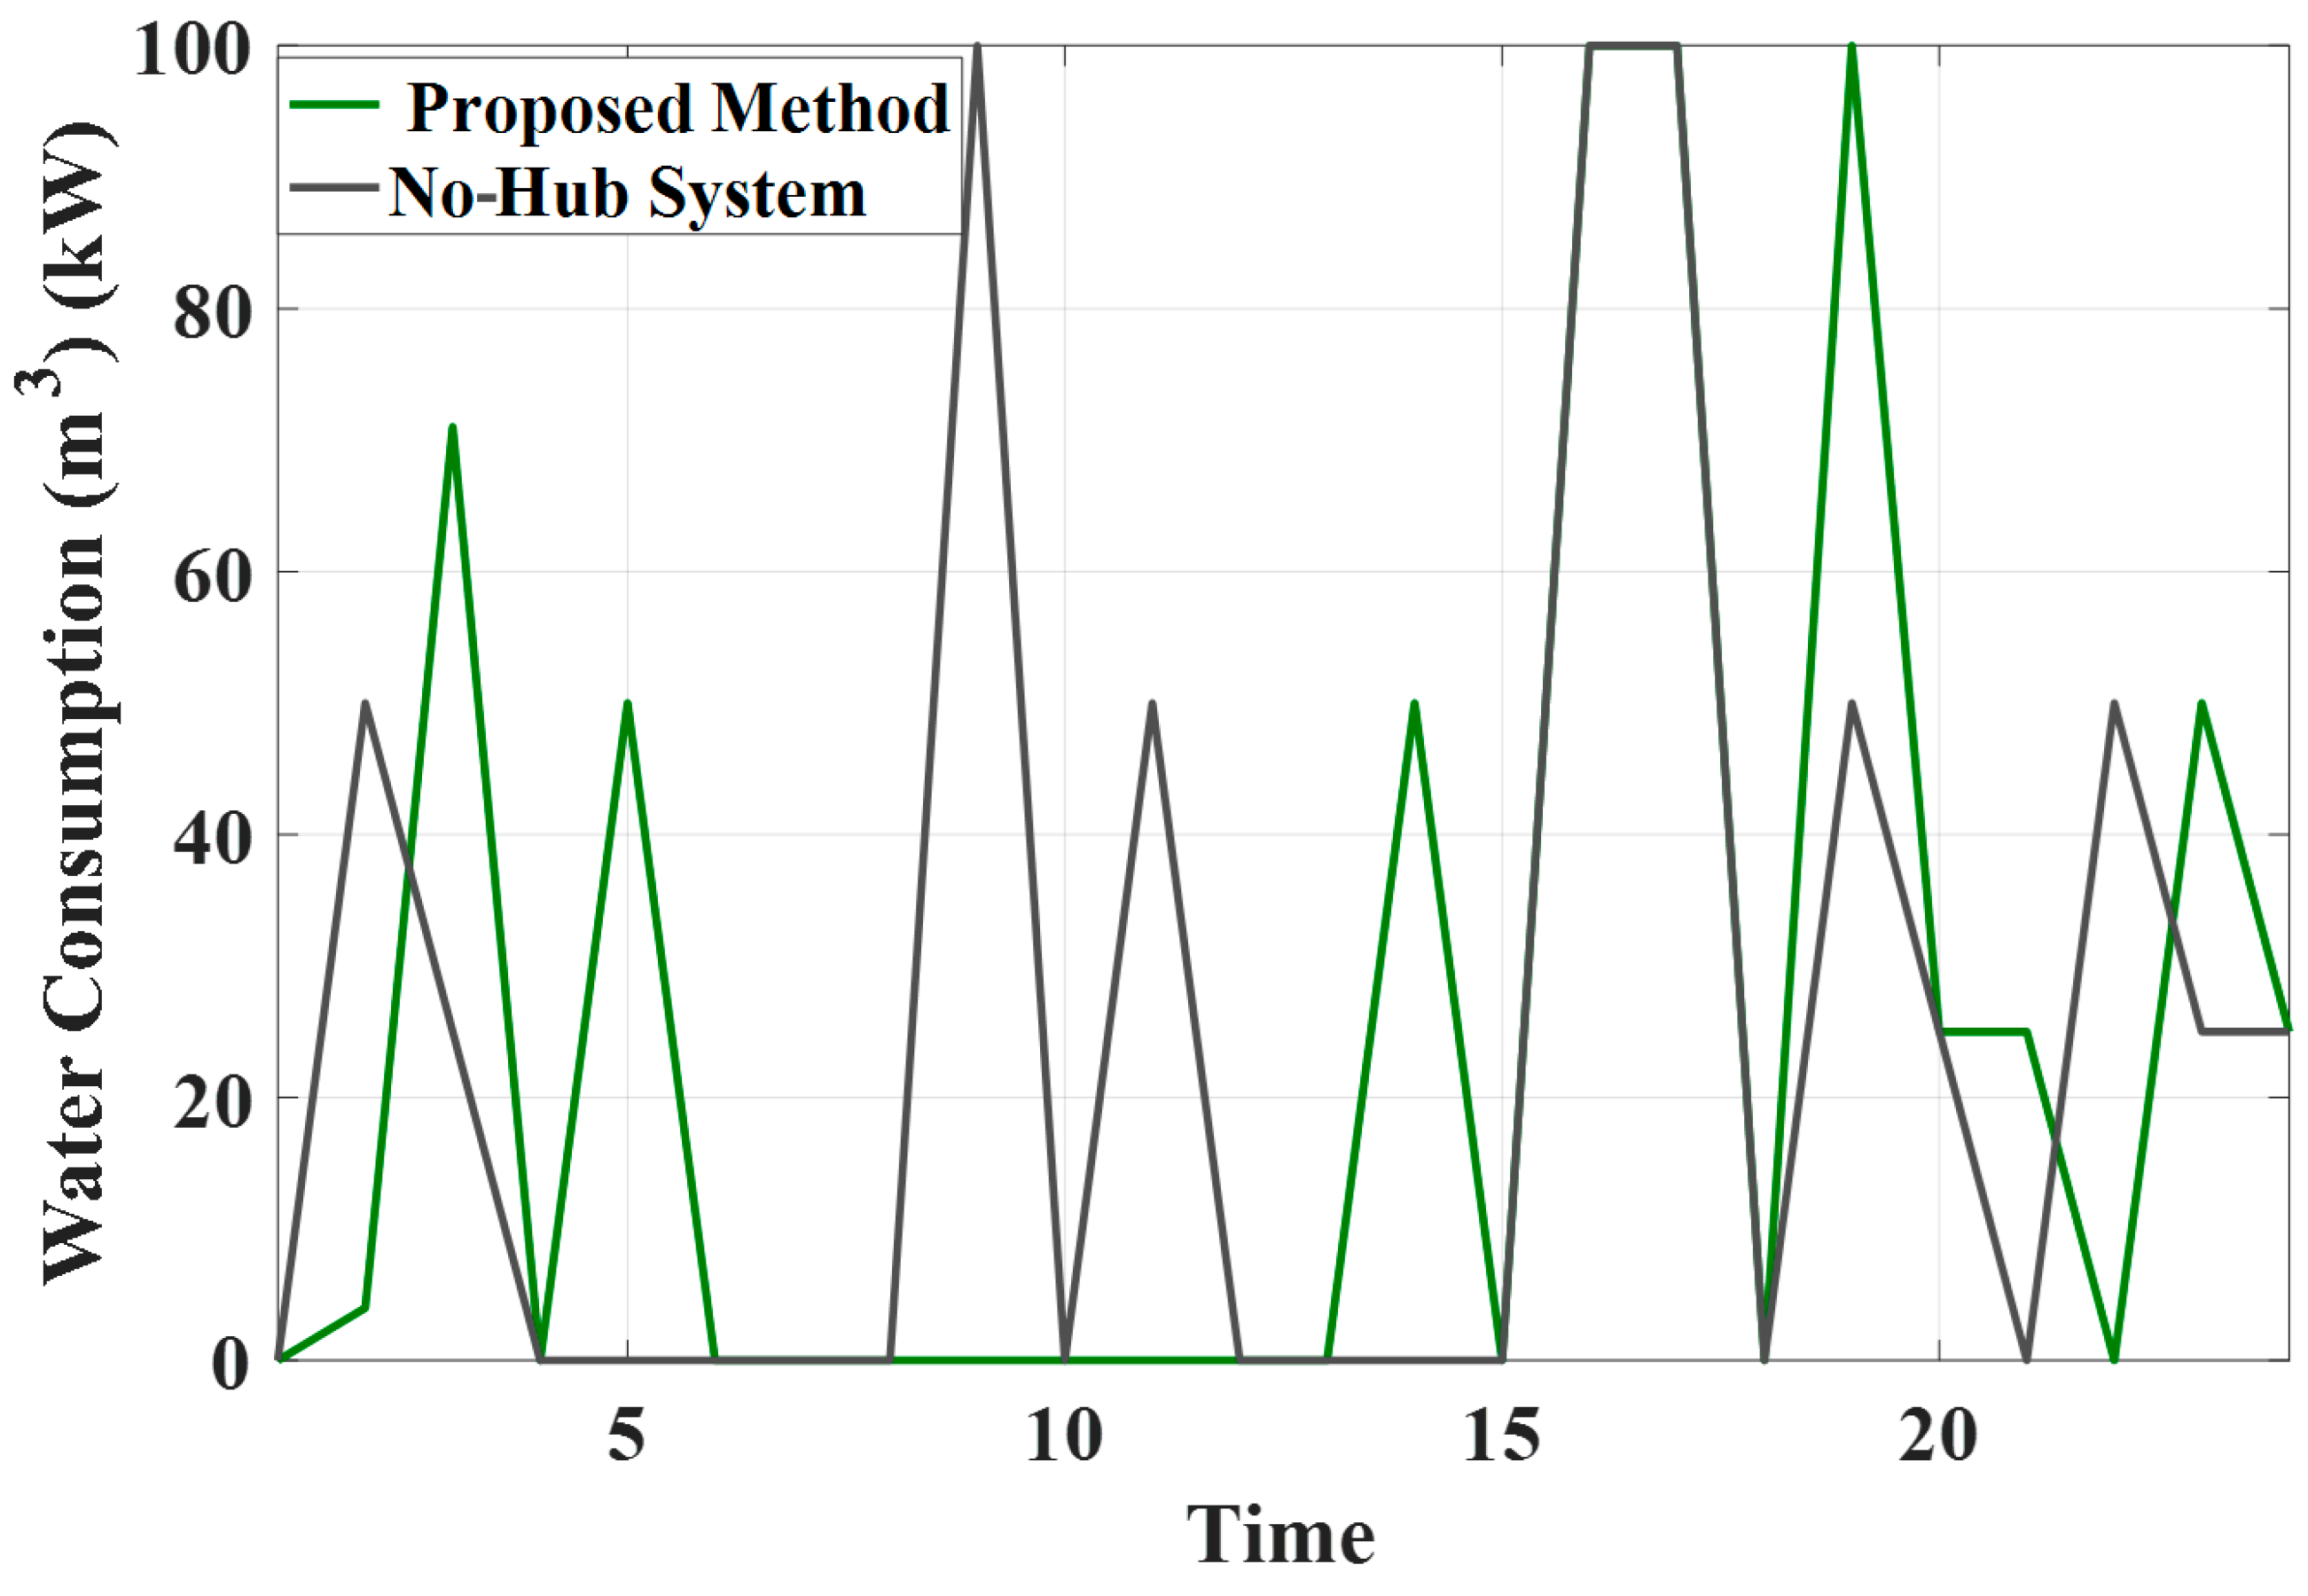
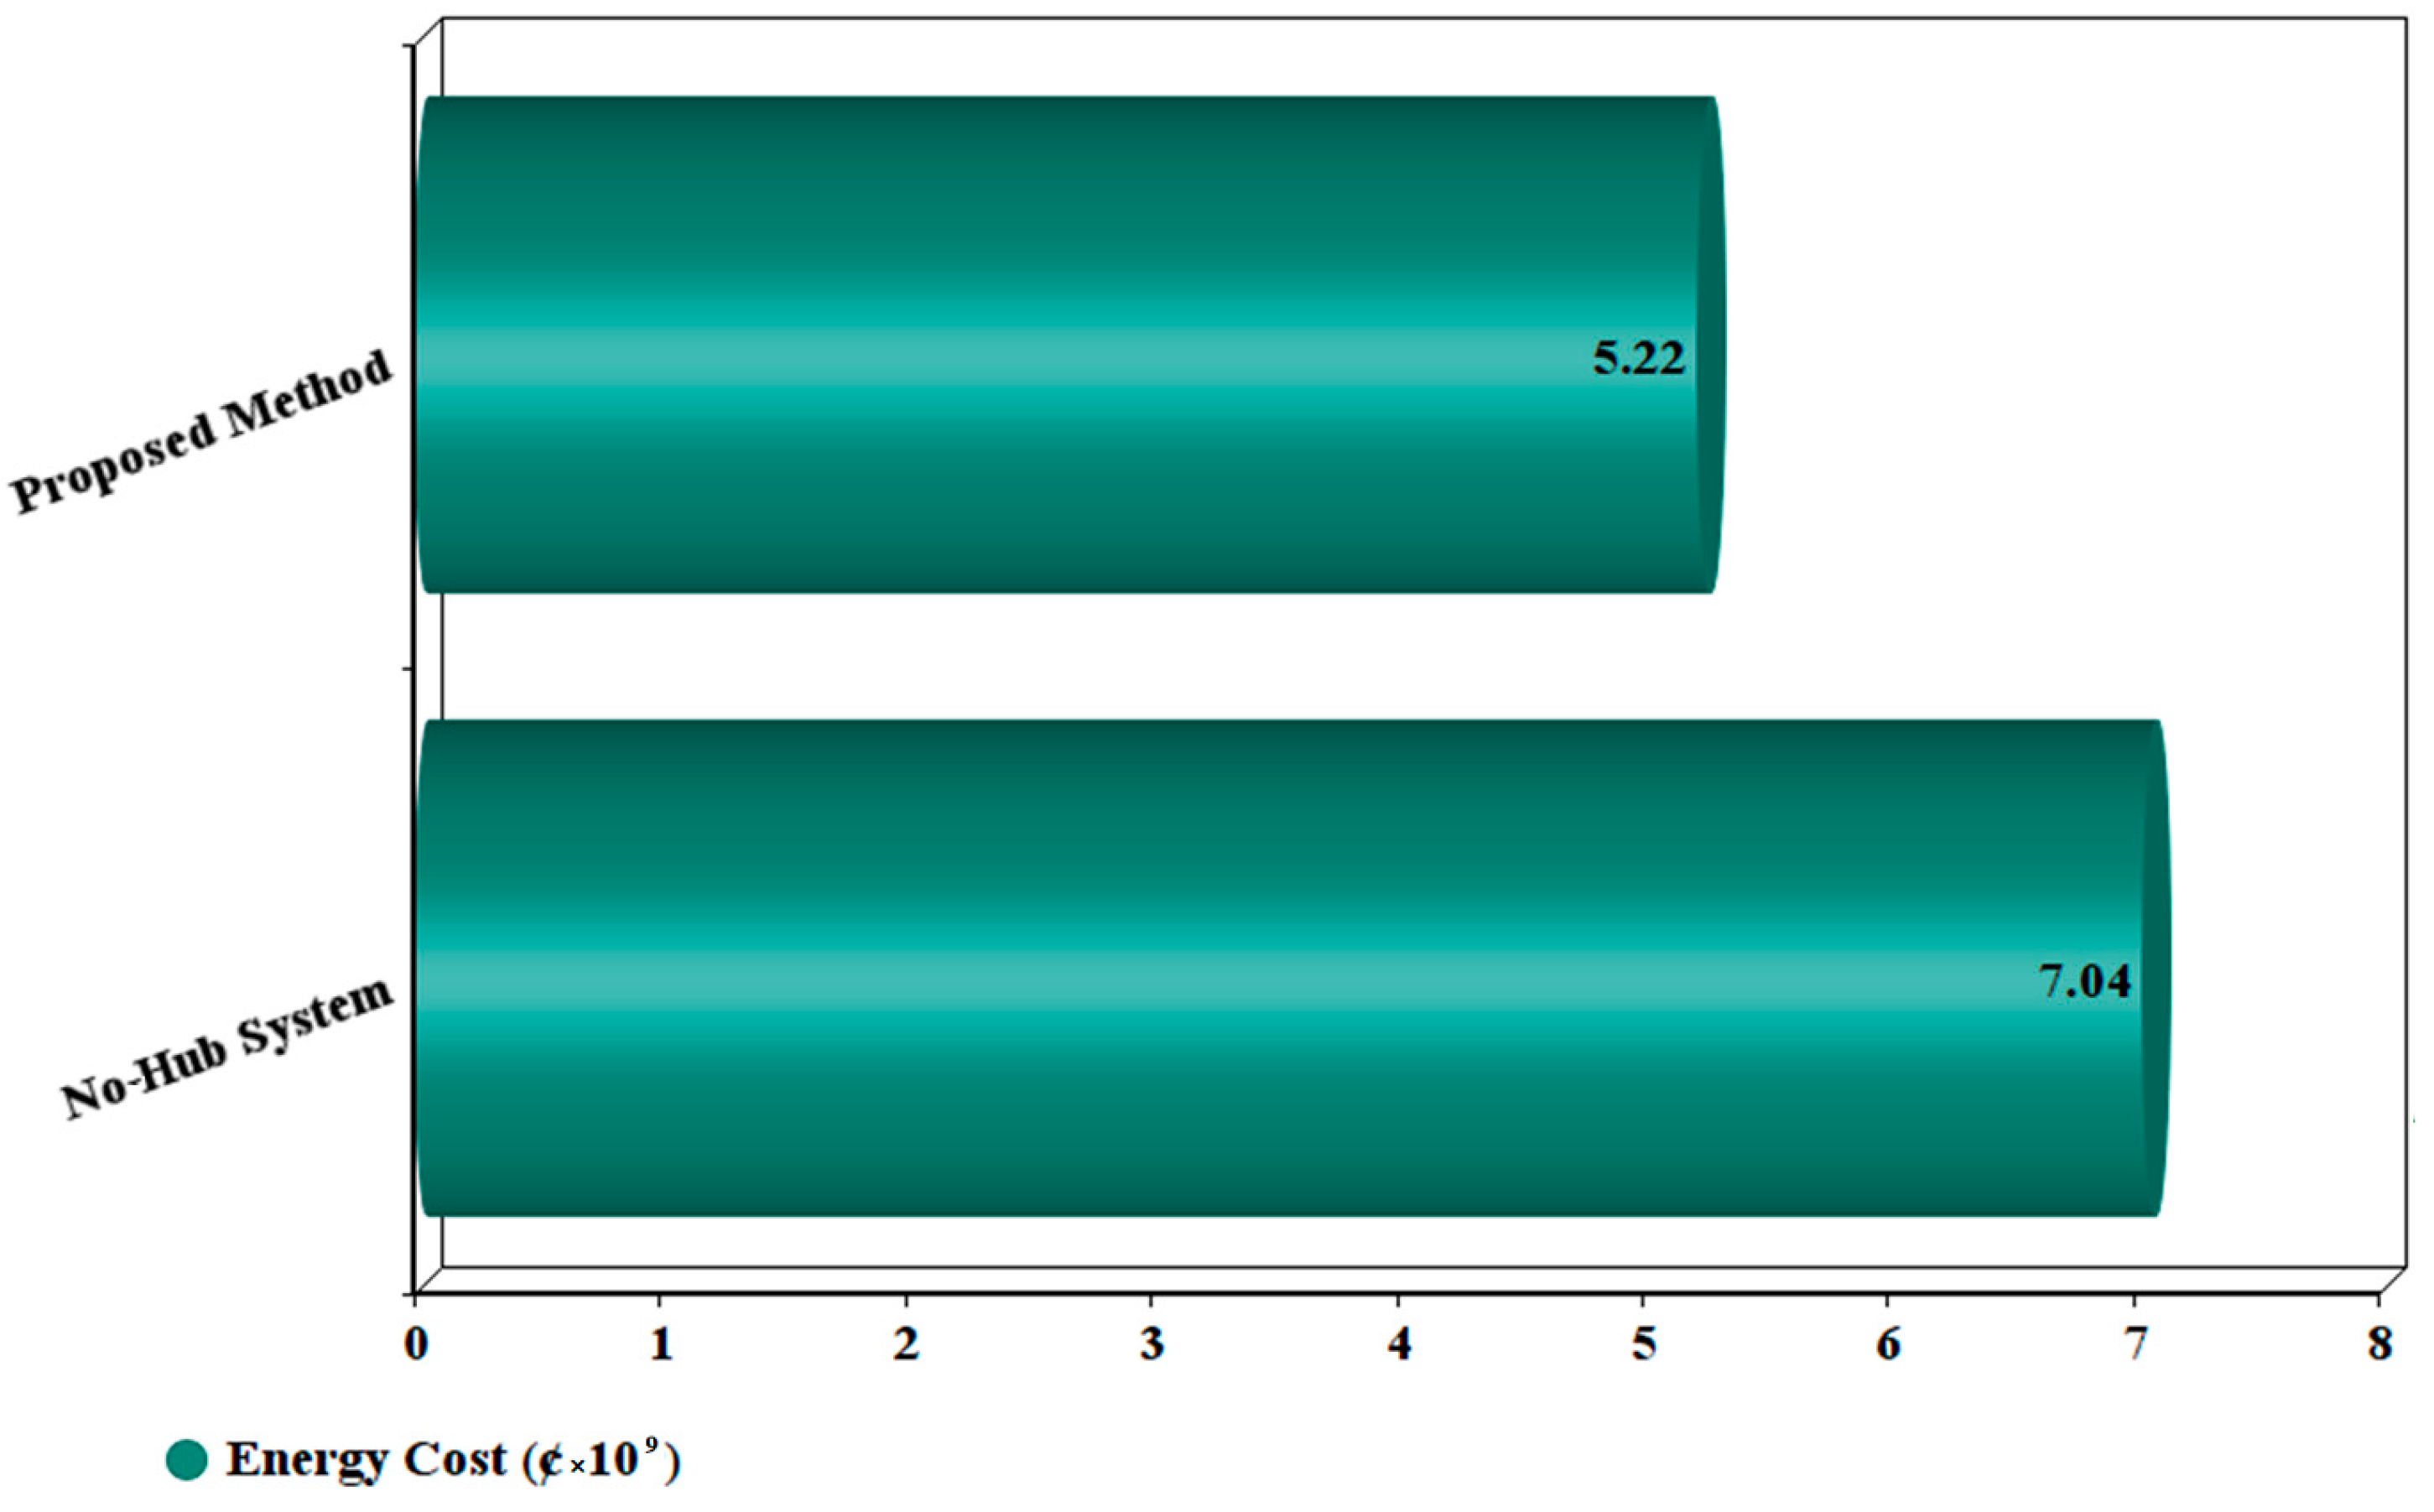
Hitherto, the description of the water-power system’s performance illustrates how it could alter the grid operation in such a way that it unaffected the presence of contingency as much as possible. Hence, Figure 7 demonstrates the power transaction between the water-power or hub system and the electrical grid for a 24 h horizon. It is worth mentioning here that the positive value of the power shows the power exchange from the hub system to the grid and vice versa. It can be seen that the grid made a satisfactory decision in its interaction with the hub system and assimilated a great deal of power on average in most buses. Additionally, Figure 8 and Figure 9 indicate the performance of heat and water energy parts in the hub system, referring to the comparative evidence. Eventually, Figure 10 shows that the proposed model caused a decline in the energy cost of 25%, which is another reason for the effectiveness of the proposed model.
6.2. The Digital Twin Model-Based Water-Power System
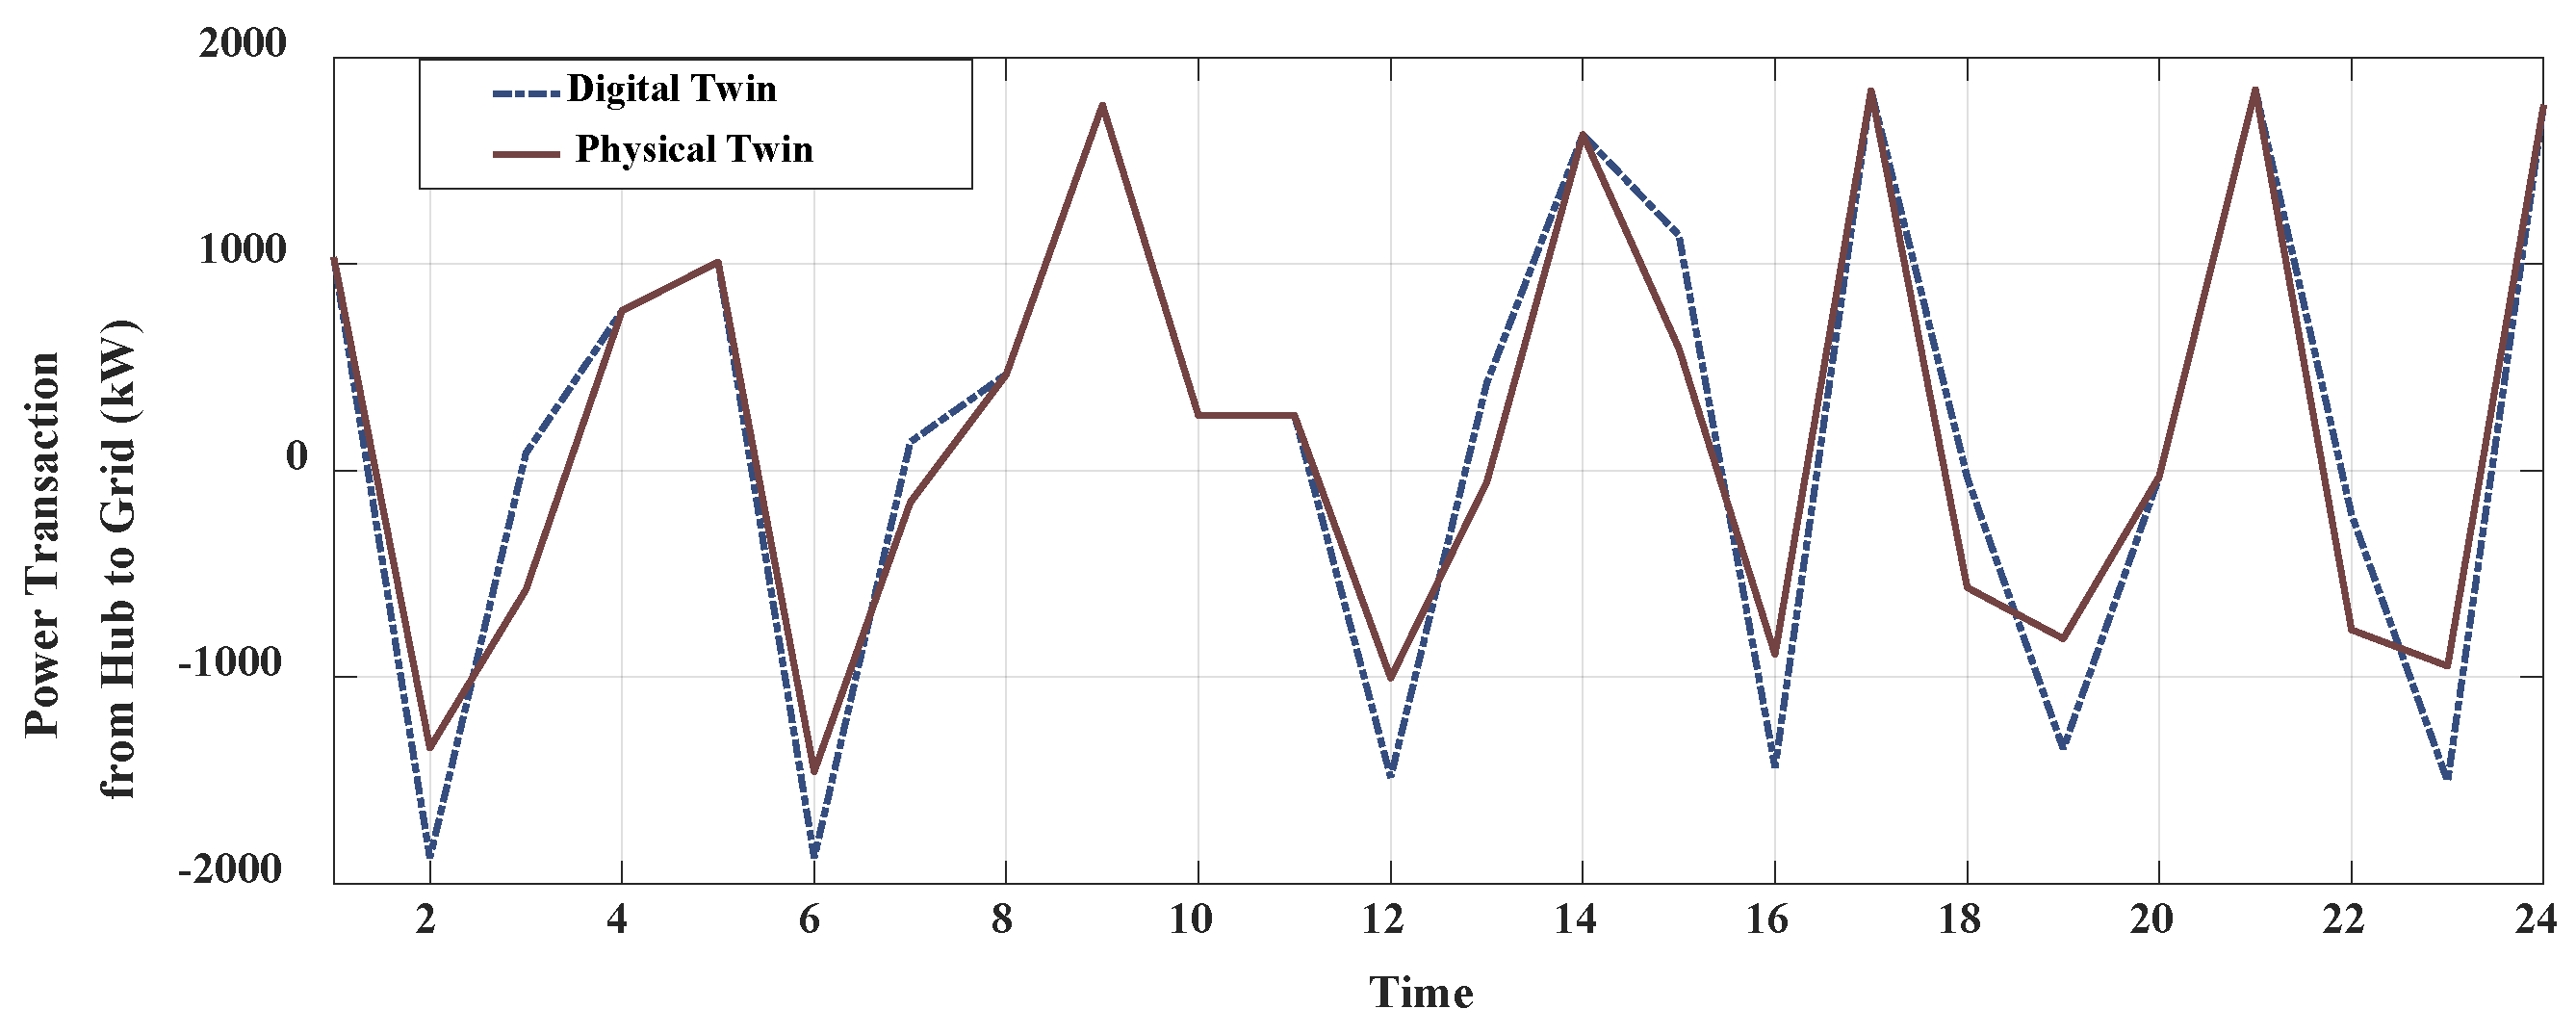
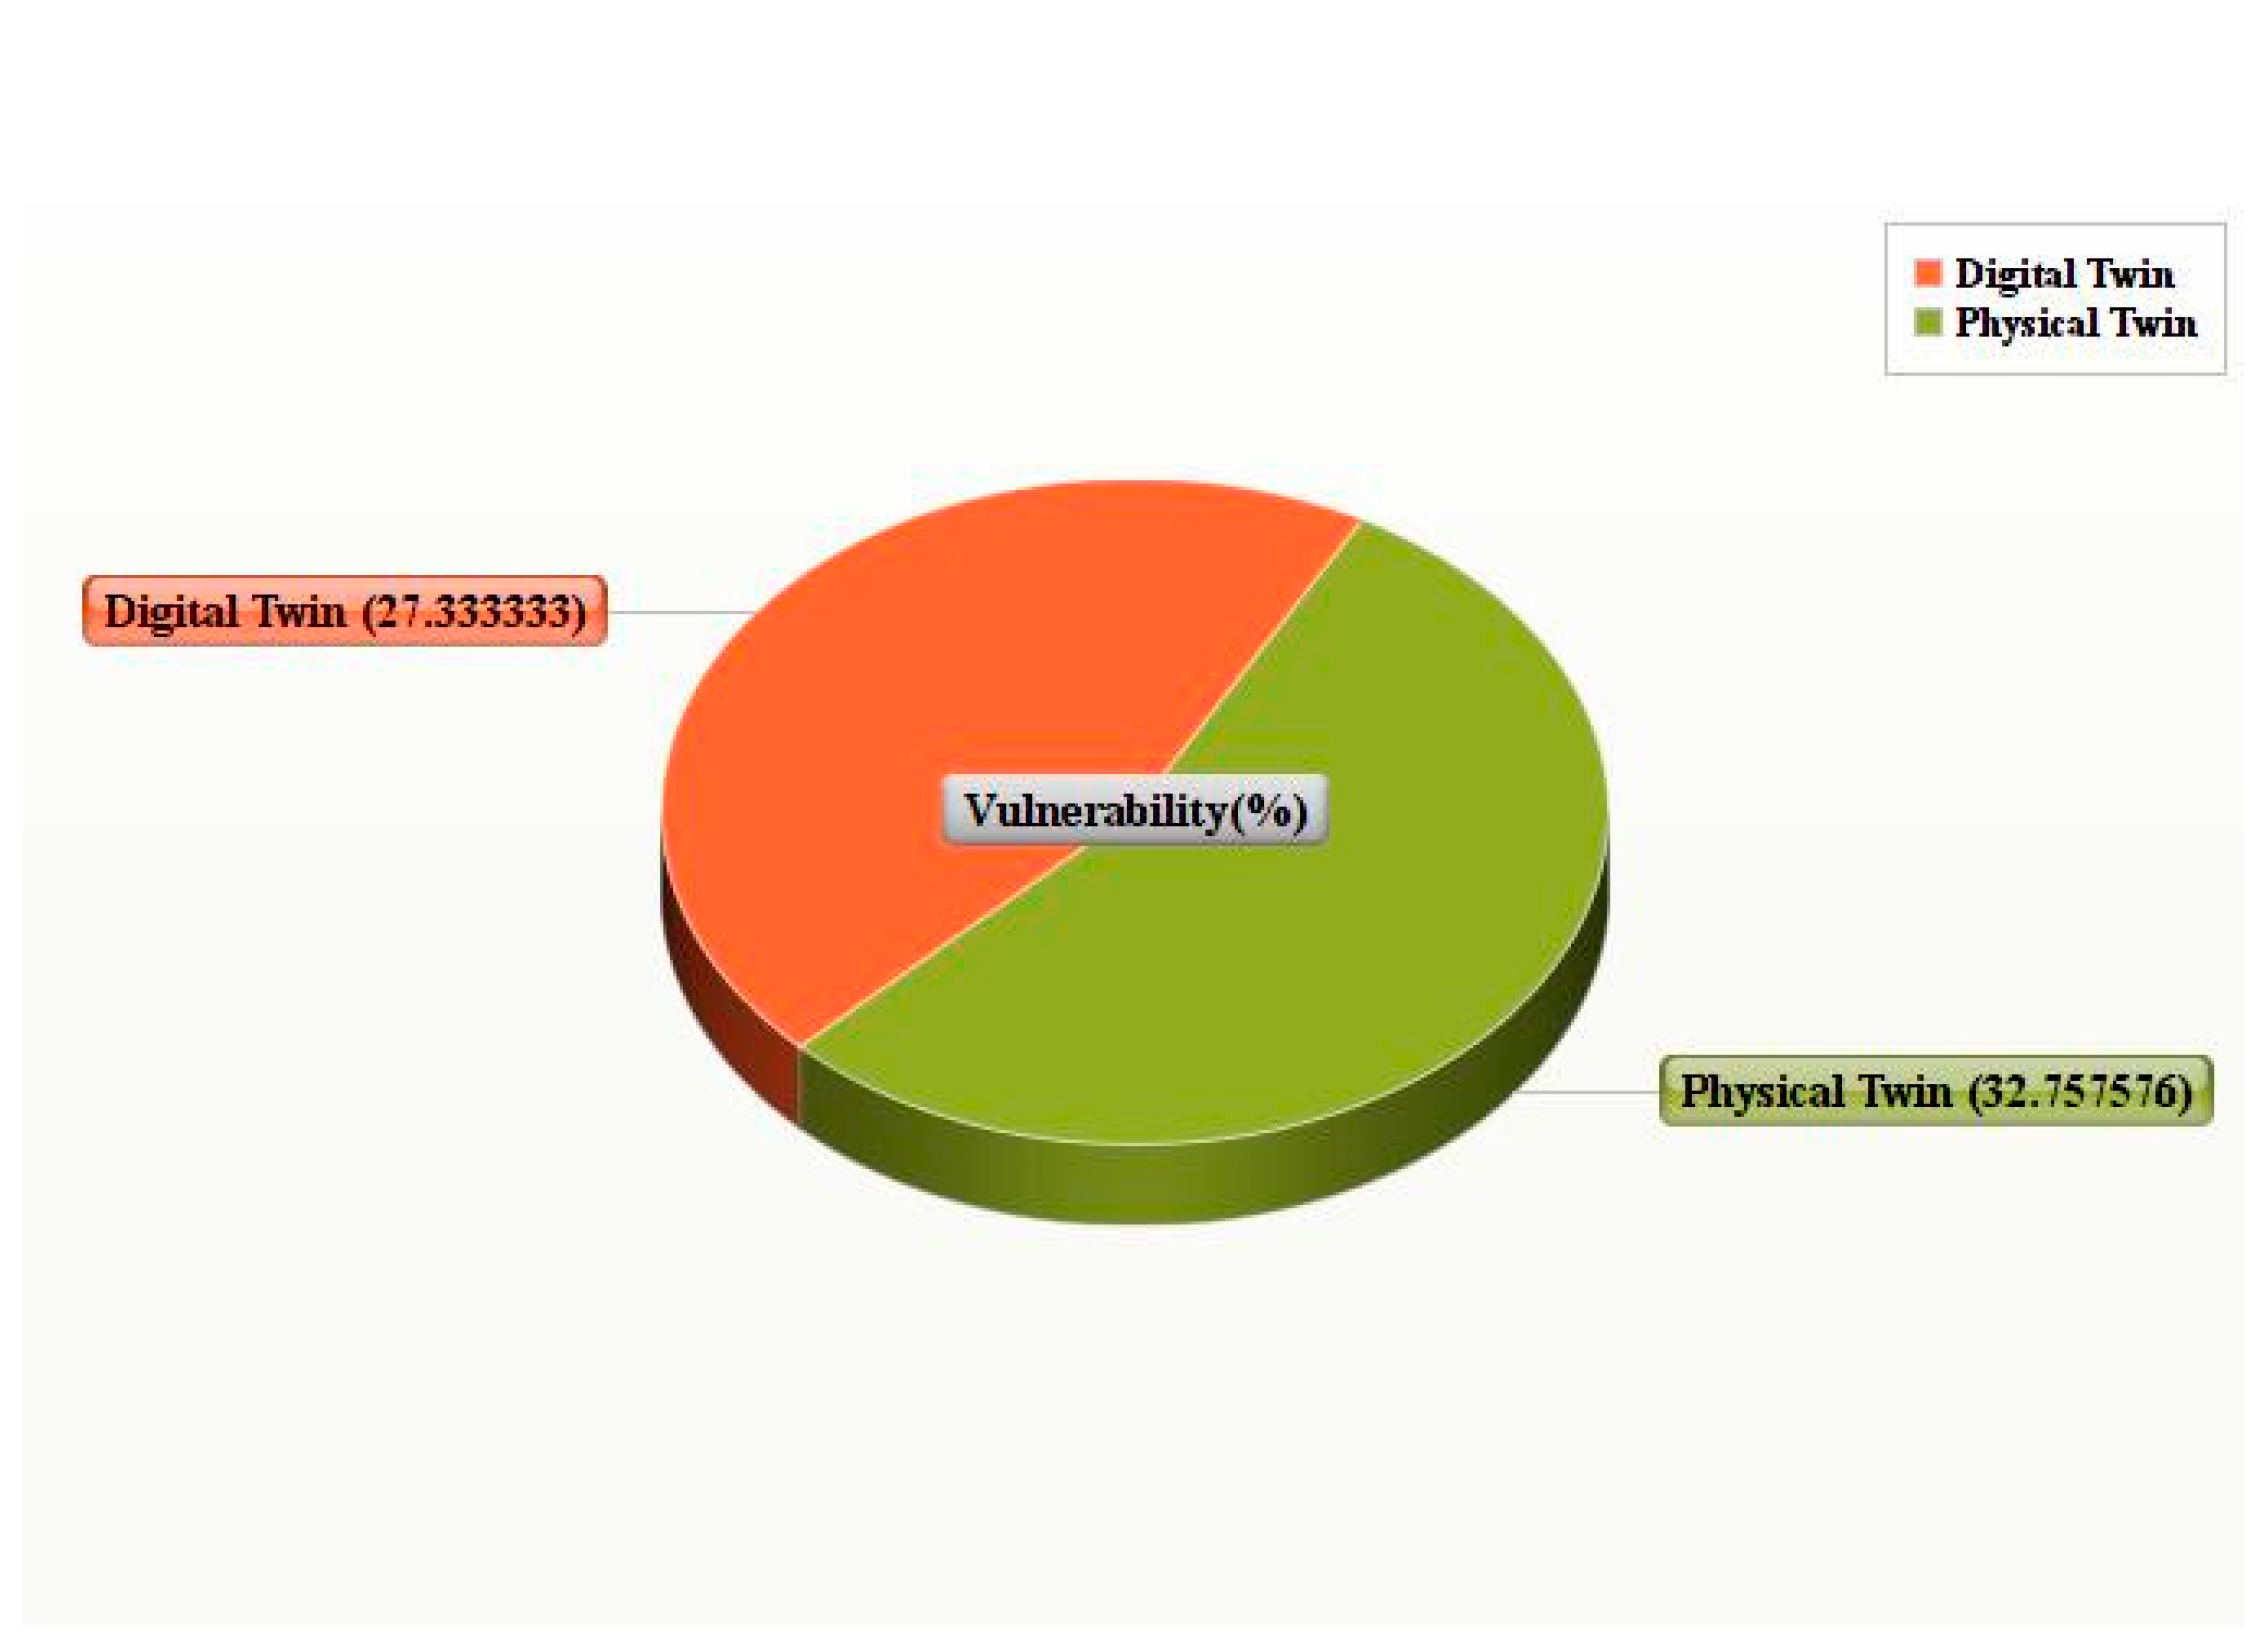
In addition to the physical twin model of our proposed system, we also want to perform the digital twin model and assess the real system’s behavior in real time. Indeed, here it is also explained whether the proposed digital twin model is able to check real data aberrations based on its threshold value and provide an RMS error to the operator if there is an unreasonable achievement on the physical system’s operation. Meanwhile, this work can help us make an admissible execution for the well-timed decision for interaction with the water-power system owing to its real-time evaluation peculiarities. As noted already, the physical model of the electrical grid along with the water-power system is simulated on Matlab and Gams and is run on the Raspberry Pi Board hardware in order to send real data to the cloud platform. Of course, the RPB hardware is unable to promptly connect to the ACS for assessing the real system. Hence, we used an interface link known as Python software for information gathering derived from RPB using Wi-Fi and appealing it to ASC. On the other side, we developed our digital twin model in a Linux environment and called digital data using Python code on our PC. Then, an interface function in Python was applied in order to send the digital data to ACS. Now, both physical and digital data are available on the cloud platform in Amazon Web for diagnosing errors. To evaluate our digital twin model, we carried out a gas-breaking handicap on the water-power system’s performance in our physical model while it was absent in the digital twin. It is necessary to say that this fault is different and sovereign compared to the contingencies accomplished for the vulnerability analysis. After running, we provided the relevant results in Figure 11, Figure 12 and Figure 13. Looking at the results, what is inferred is that the physical model’s outcome is distinctive in the power transaction with the digital one for most hours of the day, as indicated in Figure 11. Indeed, the power value takes a remarkable change of 25% on average, which shows the RMS error in the physical twin, which needs to be dealt with. The RMS curve is illustrated in Figure 12. Note that altering the hub system’s power in interaction with the electrical grid affects the grid vulnerability indices due to the ill-suited mutual interaction during contingencies. Hence, Figure 13 shows the vulnerability percentage of the grid for the physical and digital twin models. As can be seen, there is an outstanding error of 15% in the vulnerability indices compared to the physical model, which equates to the real-time diagnosis mechanism’s effectiveness.
6.3. The Evaluation of the Uncertainty Model
The online digital analysis of the system is useful to accurately check the real system and make a well-timed decision, as long as the inputs for both twins are the same. Hence, having awareness of the uncertain inputs for the real-time analysis of the system is a must. So, it seems that executing an uncertainty model on the uncertain inputs of the system is necessary before the online checking mechanism based on the digital twin. To this end, as previously mentioned, we proposed a coefficient model derived from the UT concept to model the inputs, including the load demands within the grid. Additionally, we here performed the proposed uncertainty model on the inputs and provided the convincing consequence in this way. Hence, Figure 14 shows the total energy costs resulting from two different models: (1) the normal model and (2) the uncertainty model. Note that because the energy cost is increasingly more impressive than the other variables, we have provided it as a result of the uncertainty model’s performance. As can be seen in the figure, the system is bound to remit an additional 11% in costs to cover the energy scheduling in the uncertainty. Of course, it is worth noting that the uncertainty effects might be substantial for large-scale systems.
7. Conclusions
In this article, we presented a developed water-power system derived from the digital twin concept in furtherance of the vulnerability degradation within the electrical grid. Indeed, the real-time vulnerability analysis could make things well in the decision-making process aiming at the vulnerability enhancement of the grid using the interaction with the proposed water-power system. To this end, we carried out our water-power system along with the electrical grid on the Matlab and Gams software based on the Raspberry Pi Board hardware (as the physical twin model), which were designed to meet the real data using Wi-Fi. Additionally, the digital twin model was performed on Linux, and the digital data were sent, using the Python code, to the Amazon Web–cloud platform. After running for two various scenarios, we first noticed that the proposed method could reduce the vulnerability index of an NGO by almost 30% on average. In addition to that, the index NLO captured a descending trend toward 33% once the lines were laid within the water-power system-connected grid. The digital analysis mechanism based on the cloud platform illustrated to us a remarkably changing percentage of 25% compared to the physical system in exchanging power between the hub system and grid. Conclusively, this means the truthfulness of the proposed digital twin’s performance. Authors would assess the cyber vulnerabilities of the proposed model in future works.
Author Contributions
Conceptualization, data curation, formal analysis, software, investigation, resources, and writing—original draft, completed by G.N.; project administration, supervision, validation, writing—review and editing, visualization, methodology and funding acquisition completed by A.K.-F. All authors contributed equally to this paper. This research paper is contributed by the authors mentioned above. All authors have read and agreed to the published version of the manuscript.
Funding
This research received no external funding.
Data Availability Statement
Data are contained within the article.
Conflicts of Interest
The authors declare no conflict of interest.
Abbreviations
| Sets/Indices | Sets/Indices |
| Limitations | Limitations |
| Technical characteristics of line. | |
| Unit start-up, shut down. | |
| Active power limitations. | |
| Line active power limitations. | |
| Line reactive power limitations. | |
| Reactive power limitations. | |
| , | Up/down limits of reserve. |
| Limits of voltage. | |
| Limits of angle. | |
| Smart grid active demand in each bus. | |
| Smart grid reactive demand in each bus. | |
| Generation price of the generator. | |
| , | The max/min of energy level of the battery, respectively. |
| , | The max/min of power exchange of the battery, respectively. |
| , | Electrical demand of the multi-EH system, thermal demand of the multi-EH, respectively. |
| , , | Nominal capacities of the transformer, CHP, and boiler units, respectively. |
| , , | Direct normal irradiation, solar radiation, and power loss of PV, respectively. |
| , , | Wind density, area of rotor blades, and wind speed, respectively. |
| , , | The power capture coefficient, seawater density, and swept area of the turbine blades, respectively. |
| Line outage index of bus n. | |
| Bus index. | |
| Line outage index of line l. | |
| Line index. | |
| Unit outage active index of line l. | |
| Unit index. | |
| Unit outage reactive index of line l. | |
| Unit index. | |
| VUL | The objective function. |
| Generator and feeder reactive power at time t. | |
| Generator and line active power at time t. | |
| Binary variables of the generator. | |
| Bus voltage or angle. | |
| Operation cost functions of smart grid. |
References
- Geidl, M.; Koeppel, G.; Favre-Perrod, P.; Klöckl, B.; Andersson, G.; Fröhlich, K. Energy Hubs for the futures. IEEE Power Energy Mag. 2007, 5, 24–30. [Google Scholar] [CrossRef]
- Xiaping, Z.; Shahidehpour, M.; Alabdulwahab, A.; Abusorrah, A. Optimal expansion planning of energy hub with multiple energy infrastructures. IEEE Trans. Smart Grid 2015, 6, 2302–2311. [Google Scholar]
- Dolatabadi, A.; Mohammadi-Ivatloo, B. Stochastic risk-constrained scheduling of smart energy hub in the presence of wind power and demand response. Appl. Therm. Eng. 2017, 123, 40–49. [Google Scholar] [CrossRef]
- Roustai, M.; Rayati, M.; Sheikhi, A.; Ranjbar, A.M. A scenario-based optimization of Smart Energy Hub operation in a stochastic environment using conditional-value-at-risk. Sustain. Cities Soc. 2018, 39, 309–316. [Google Scholar] [CrossRef]
- Mehdizadeh, A.; Taghizadegan, N. Robust optimisation approach for bidding strategy of renewable generation-based microgrid under demand side management. IET Ren. Power Gen. 2017, 11, 1446–1455. [Google Scholar] [CrossRef]
- Abedi, A.; Hesamzadeh, M.R.; Romerio, F. An ACOPF-based bilevel optimization approach for vulnerability assessment of a power system. Int. J. Electr. Power Energy Syst. 2021, 125, 106455. [Google Scholar] [CrossRef]
- Mohamed, M.A.; Chen, T.; Su, W.; Jin, T. Proactive resilience of power systems against natural disasters: A literature review. IEEE Access 2019, 7, 163778–163795. [Google Scholar] [CrossRef]
- Liu, Y.; Jin, T.; Mohamed, M.A.; Wang, Q. A Novel Three-Step Classification Approach Based on Time-Dependent Spectral Features for Complex Power Quality Disturbances. IEEE Trans. Instrum. Meas. 2021, 70, 3000814. [Google Scholar] [CrossRef]
- Kavousi-Fard, A.; Samet, H.; Marzbani, F. A new hybrid modified firefly algorithm and support vector regression model for accurate short term load forecasting. Expert Syst. Appl. 2014, 41, 6047–6056. [Google Scholar] [CrossRef]
- Dehghani, M.; Kavousi-Fard, A.; Niknam, T.; Avatefipour, O. A robust voltage and current controller of parallel inverters in smart island: A novel approach. Energy 2021, 214, 118879. [Google Scholar] [CrossRef]
- Kavousi-Fard, A.; Su, W.; Jin, T. A Machine Learning Based Cyber Attack Detection Model for Wireless Sensor Networks in Microgrids. IEEE Trans. Ind. Inform. 2021, 17, 20115703. [Google Scholar] [CrossRef]
- Abedi, A.; Gaudard, L.; Romerio, F. Power flow-based approaches to assess vulnerability, reliability, and contingency of the power systems: The benefits and limitations. Reliab. Eng. Syst. Saf. 2020, 201, 106961. [Google Scholar] [CrossRef]
- Jafari, M.; Kavousi-fard, A.; Chen, T.; Karimi, M. A Review on Digital Twin Technology in Smart Grid, Transportation System and Smart City: Challenges and Future. IEEE Access 2023, 11, 2169–3536. [Google Scholar] [CrossRef]
- Danilczyk, W.; Sun, Y.; He, H. Angel: An intelligent digital twin framework for microgrid security. In Proceedings of the 2019 North American Power Symposium (NAPS), Wichita, KS, USA, 13–15 October 2019. [Google Scholar]
- Olivares-Rojas, J.; Reyes-Archundia, E.; Gutierrez-Gnecchi, A.; Molina-Moreno, I.; Cerda-Jacobo, J.; Méndez-Patiño, A. Towards cybersecurity of the smart grid using digital twins. IEEE Internet Comput. 2021, 26, 52–57. [Google Scholar] [CrossRef]
- Jafari, M.; Kavousi-Fard, A.; Dabbaghjamanesh, M.; Karimi, M. A Survey on Deep Learning Role in Distribution Automation System: A New Collaborative Learning-to-Learning (L2L) Concept. IEEE Access 2022, 10, 2169–3536. [Google Scholar] [CrossRef]
- Zhang, L.; Cheng, L.; Alsokhiry, F.; Mohamed, M.A. A Novel Stochastic Blockchain-Based Energy Management in Smart Cities Using V2S and V2G. IEEE Trans. Intell. Transp. Syst 2022, 24, 915–922. [Google Scholar] [CrossRef]
- Zhang, C.; Chen, X. Stochastic nonlinear complementarity problem and applications to traffic equilibrium under uncertainty. J. Optim. Theory Appl. 2018, 137, 277–295. [Google Scholar] [CrossRef] [Green Version]
- Rivera-Durán, Y.; Berna-Escriche, C.; Córdova-Chávez, Y.; Muñoz-Cobo, J.L. Assessment of a Fully Renewable Generation System with Storage to Cost-Effectively Cover the Electricity Demand of Standalone Grids: The Case of the Canary Archipelago by 2040. Machines 2023, 11, 101. [Google Scholar] [CrossRef]
- Sheikh, M.; Aghaei, J.; Chabok, H.; Roustaei, M.; Niknam, T.; Kavousi-Fard, A.; Shafie-Khah, M.; Catalão, J.P. Synergies Between Transportation Systems, Energy Hub and the Grid in Smart Cities. IEEE Trans. Intell. Transp. Syst. 2021, 23, 7371–7385. [Google Scholar] [CrossRef]
- Mohammadi, M.; Kavousi-Fard, A.; Dehghani, M.; Karimi, M.; Loia, V.; Alhelou, H.H.; Siano, P. Reinforcing data integrity in renewable hybrid AC-DC microgrids from social-economic perspectives. ACM Trans. Sens. Netw. 2022, 19, 1–19. [Google Scholar] [CrossRef]
- Hamza, A.; Rizvi, S.T.; Safder, M.U.; Asif, H. A Novel Mathematical Approach to Model Multi-Agent-Based Main Grid and Microgrid Networks for Complete System Analysis. Machines 2022, 10, 110. [Google Scholar] [CrossRef]
- Dabbaghjamanesh, M.; Kavousi-Fard, A.; Mehraeen, S.; Zhang, J.; Dong, Z.Y. Sensitivity analysis of renewable energy integration on stochastic energy management of automated reconfigurable hybrid AC–DC microgrid considering DLR security constraint. IEEE Trans. Ind. Inform. 2018, 16, 120–131. [Google Scholar] [CrossRef]
Figure 1.
Illustration of a digital twin structure.

Figure 2.
The bat optimization algorithm’s performance.

Figure 3.
The relational structure among DTP, DTI, and DTA.

Figure 4.
A digital twin model for the proposed system.

Figure 5.
The vulnerability index NGO for scenario 2.

Figure 6.
The vulnerability index NLO for scenario 1.

Figure 7.
The power transaction between the grid and the hub system.

Figure 8.
The CHP power for two methods: (1) proposal (2) no hub.

Figure 9.
The water consumption for two methods: (1) proposal (2) no hub.

Figure 10.
The energy cost for two methods: (1) proposal (2) no hub.

Figure 11.
The power transaction for the physical and digital twins.

Figure 12.
The RMS value based on the digital twin model.

Figure 13.
The vulnerability percentage for the physical and digital twins.

Figure 14.
The energy cost for the normal and uncertain manners.

Disclaimer/Publisher’s Note: The statements, opinions and data contained in all publications are solely those of the individual author(s) and contributor(s) and not of MDPI and/or the editor(s). MDPI and/or the editor(s) disclaim responsibility for any injury to people or property resulting from any ideas, methods, instructions or products referred to in the content. |
© 2023 by the authors. Licensee MDPI, Basel, Switzerland. This article is an open access article distributed under the terms and conditions of the Creative Commons Attribution (CC BY) license (https://creativecommons.org/licenses/by/4.0/).
Share and Cite
MDPI and ACS Style
Nasiri, G.; Kavousi-Fard, A. A Digital Twin-Based System to Manage the Energy Hub and Enhance the Electrical Grid Resiliency. Machines 2023, 11, 392. https://doi.org/10.3390/machines11030392
AMA Style
Nasiri G, Kavousi-Fard A. A Digital Twin-Based System to Manage the Energy Hub and Enhance the Electrical Grid Resiliency. Machines. 2023; 11(3):392. https://doi.org/10.3390/machines11030392
Chicago/Turabian StyleNasiri, Gholamreza, and Abdollah Kavousi-Fard. 2023. "A Digital Twin-Based System to Manage the Energy Hub and Enhance the Electrical Grid Resiliency" Machines 11, no. 3: 392. https://doi.org/10.3390/machines11030392
Note that from the first issue of 2016, this journal uses article numbers instead of page numbers. See further details here.