Article

Design and Verification of Adaptive Adjustable Output Control on Micro Spray Gun †

1
College of Electrical Engineering and Computer Science, National Kaohsiung University of Science and Technology, Kaohsiung 824005, Taiwan
2
Department of Electronic Engineering, Kun Shan University, Tainan 710303, Taiwan
3
Department of Biomedical Engineering, Ming Chuan University, Taoyuan 333321, Taiwan
*
Author to whom correspondence should be addressed.
This paper is an extended version of our paper published in 2022 International Conference on Fuzzy Theory and Its Applications (iFUZZY), Kaohsiung, Taiwan, 3–5 November 2022; Available online: https://doi.org/10.1109/iFUZZY55320.2022.9985228.
Machines 2023, 11(3), 354; https://doi.org/10.3390/machines11030354
Submission received: 5 February 2023 / Revised: 3 March 2023 / Accepted: 3 March 2023 / Published: 4 March 2023
(This article belongs to the Topic Designs and Drive Control of Electromechanical Machines)

Abstract

:
The general spray gun is used for industrial large-area spraying, and there is less demand for different pressures and the accuracy of spraying pressure, so mechanical pressure regulators are mostly used. However, as the demand for artistic innovation continues to grow, it promotes the advent of the micro spray gun. The micro spray gun is currently commonly known as an airbrush. The micro spray gun is mainly used for fine drawing, so it must provide different pressures with high precision pressures, but the existing mechanical regulators cannot meet this requirement. For these unmet requirements, this study proposed a solution for PID (proportional-integral-derivative) control micro spray gun system. The results showed that the PID control could effectively provide various stable output pressures of the micro spray gun. The pressure-varying range of 30 kPa could rapidly return to the target value in 10 s (the usual spraying time). The proposed solution then presents better spraying effects.

1. Introduction

A compressor is a mechanical device used for increasing distinct compressible fluid or air pressure, whereas an air compressor is the commonest one using air output technology. An air compressor is an inevitable and important piece of equipment in various industries converting the mechanical energy of a motor into air pressure energy. Compressed air is used as the power source for industrial pneumatic tools, paint-spraying machines, and sand-blast equipment. Many air compressors are applied to paint spraying with spray guns [1,2]. Such a traditional sprayer is generally equipped with a mechanical air pressure regulator to adjust the pressure output with manual mode, and a pneumatic throttle valve is used for tuning the pressure for paint output. An air compressor running with an electric motor, rather than a mechanical principle, is called an air pump. The principle of the air pump is to exhaust from an enclosed space or to generate air from an enclosed space. When it is used for small-size vacuum pumping, it is also called a micro air pump, or a micro air compressor.
With either mechanical or electric air compressors, the paint going through the spray gun might be interfered by air pressure or the external environment. It would result in the change of air current in the spray gun to cause unstable working of the spray gun or affect the spraying efficiency and effectiveness [3]. The control valve of current spray gun systems generally balances the air manually, without the function to regulate signal feedback. It is rather difficult to regulate air output along with experience or condition during the work, and air pressure might not be stabilized. Due to the rapid development of microcontrollers in past years, there are many studies on the application of control technology to medium sprayers, in which variable control technique is added to largely reduce unstable output, e.g., intermittent and continuous variable rate spraying based on pulse width modulation [4,5,6,7]. Pulse width modulation (PWM) changes the winding driving module through impulse signals to achieve the variable spray coating through the duty ratio of pulse-width signals. Researchers also control the spraying amount by flow control with pressure monitoring and pulse width modulation [8,9,10,11]. Such variable pressure control is limited the regulation range and appears unstable atomization characteristics, but the principle is simple and the cost of constructing control circuits is lower. The technology of adaptive air compressors, therefore, is a long-term development direction.
A pressure-monitoring output control technology is proposed for micro spray guns in art drawing, body painting, and cosmetic fields [12,13,14]. Such micro air pumps cannot use mechanical air pressure modulators and air receivers due to the cost and size limit that the pressure output is modulated with simple power control. A proportional-integral-derivative (PID) control algorithm with pressure feedback is therefore developed to provide stable air output for the micro air compressor in the sprayer as well as modulate the air output. The motor valve in the air pump is modulated by pulse width modulation, according to the algorithm calculation result, so that the spray gun presents pressure feedback and adaptability to achieve the variable spraying effect. We implemented an adaptive micro spray gun simulation platform in 2022 [15]. The simulation results show that the PID algorithm is feasible in the control of the micro-spray gun device. Therefore, in this study, we applied the method on the real device, and further determined the ranges of the algorithm parameters and convergence conditions. We applied the pulse-like driving waves to observe the influences of the algorithm parameters. At the same time, the performances of algorithm convergence are analyzed. All considerations are for determining the operation optimization.

2. Materials and Methods

The basic components for this system contain a micro air pump, DC motor drive module, and PID control unit.

2.1. DC Motor Drive Module

The micro air pump used in this study is a kind of electric diaphragm pump with an intake and exhaust structure, Figure 1. During the compression, the air intake is closed, while the exhaust port is open to form the positive pressure; during the stretch, the exhaust port is closed, and the air intake is open to form negative pressure. The pressure difference appears on the air intake of the air pump and the ambient pressure, and under the pressure difference, the air is sucked into the pump chamber. It is the entire exhaust motion of the micro air pump. Unlike a large air pump requiring lubricating oil and vacuum pump oil, a micro air pump would not pollute the working medium and shows the advantages of small size, low noise, maintenance-free, and continuous running [16].
The DC motor revolution basically presents analog modulation and pulse-width modulation. Analog modulation linearly modulates the input voltage or current of a motor; since the signals show linear changes, they are more easily interfered with by ambient electric noise and affected stability. Furthermore, control signals would easily drift with time and appear large power dissipation and worse energy efficiency. Moreover, the motor torque depends on the current going through the motor winding; when the voltage on the motor winding is changed, the current going through the motor winding would be unstable and the motor torque is also unstable. Unlike the instability of analog modulation, pulse width modulation is often used for DC motor drives as well as power conversion of DC/DC converters and AC/DC converters [17]. PWM, in principle, outputs the required power through switching impulse, and pulse amplitude and cycle are constant. The output power is controlled with conducting pulse width. The voltage output, therefore, is the average of the ratio of the corresponding conducting and pulse cycle time, called duty ratio or duty cycle which the unit is a percentage (%). Since the motor torque depends on the current going through motor winding, the increase in duty ratio also increases power output, and the motor speed would be relatively faster. With PWM control, the impulse voltage is comparatively constant, and the current stability is influenced that the motor torque output being relatively stable.

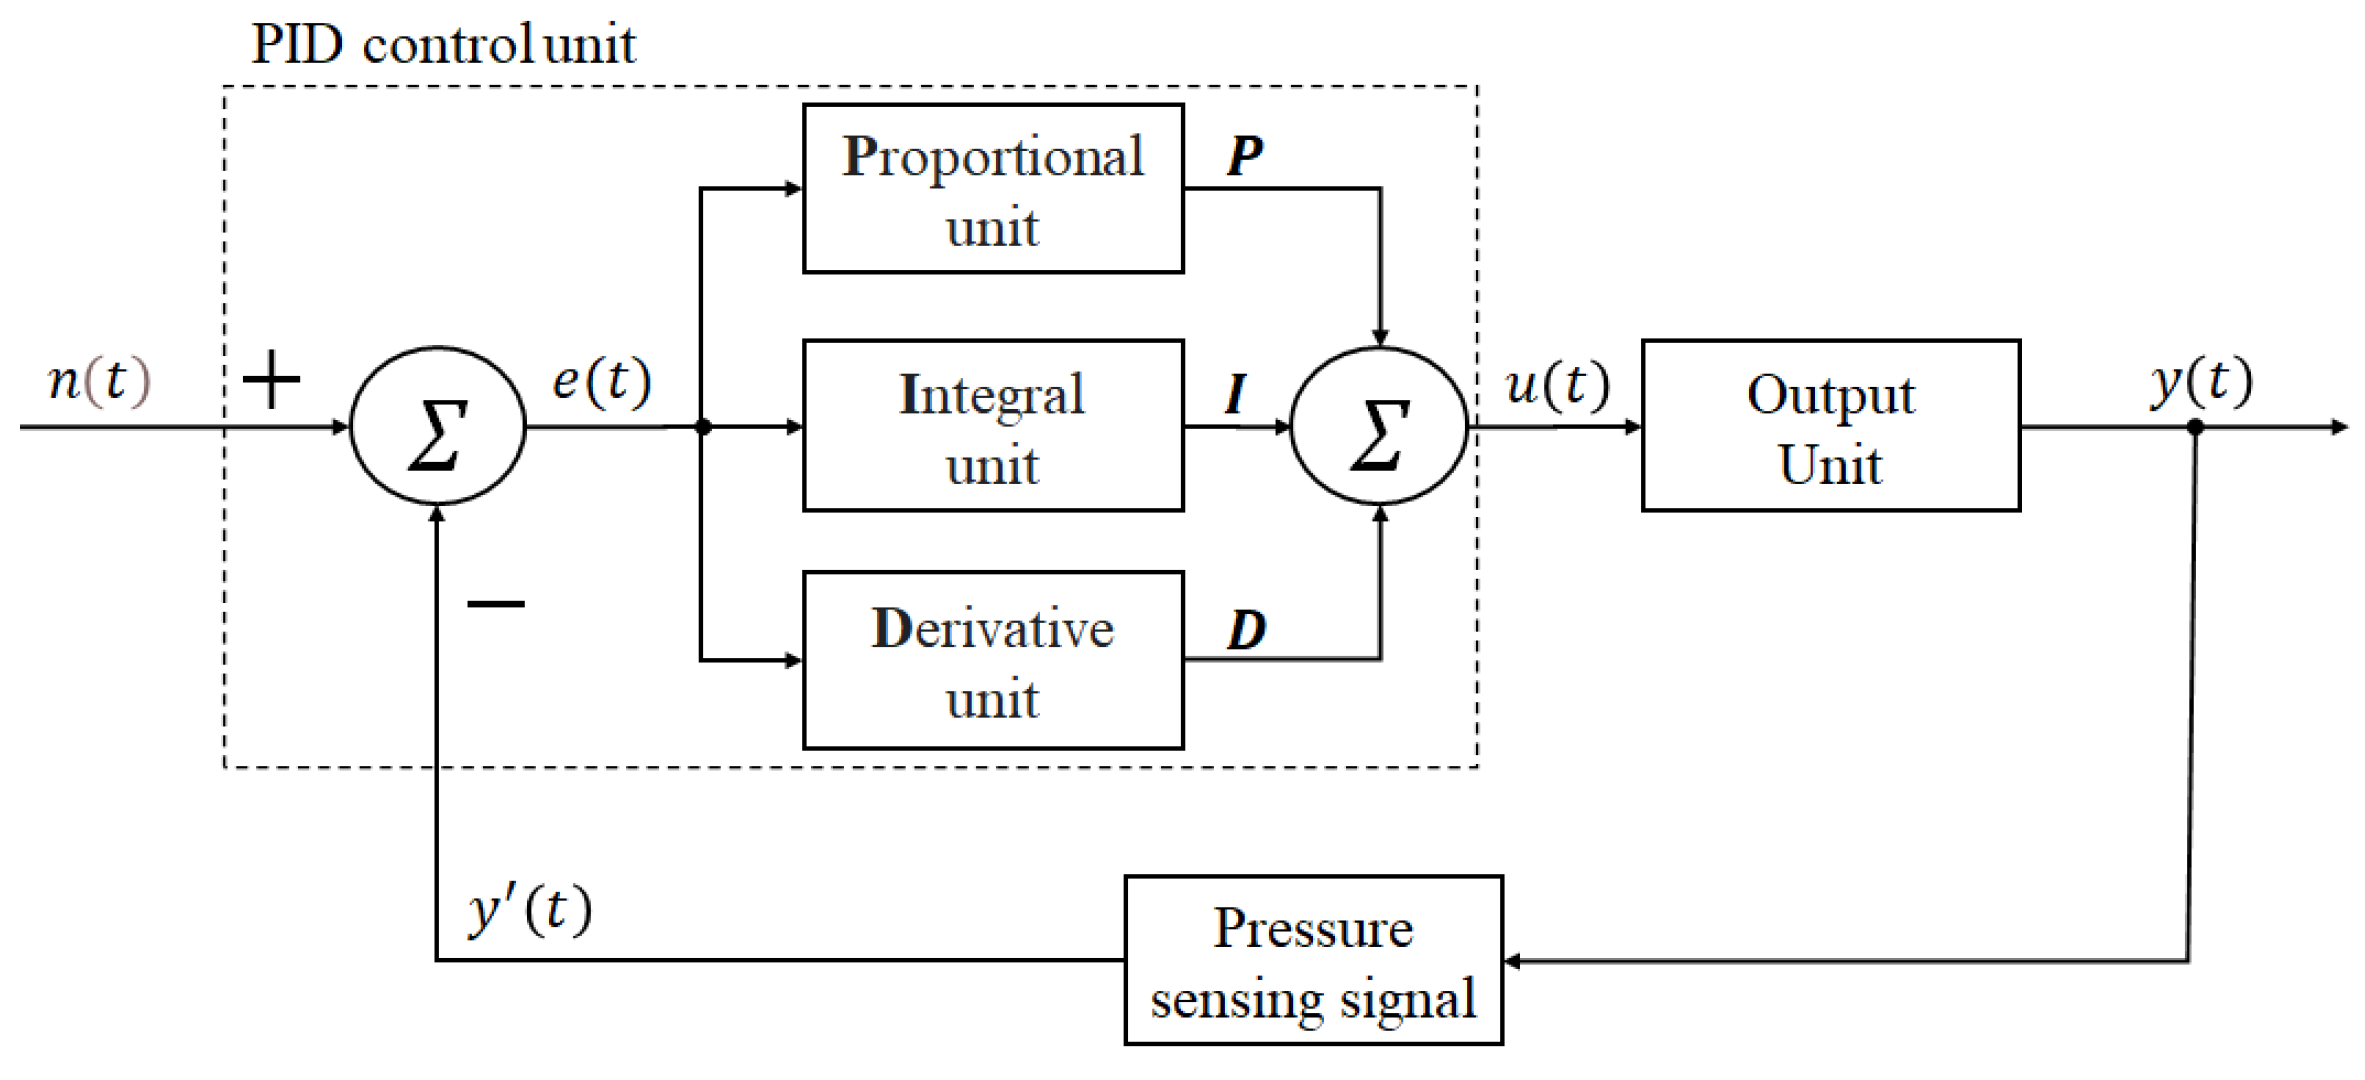
2.2. PID Control Unit

Stable air output is required in this study and the adaptive control presents is important. In industrial control, PID control is a mature control system with broad applications [18,19,20]. It is often used for control feedback to stabilize output signals. PID control technology is suitable for a system and a controlled object not being completed understood or the system parameters not being acquired through effective measurement. A PID controller is composed of a proportional unit (P), integral unit (I), and derivative unit (D), whose parameters of proportional gain, integral gain, and differential gain could be used for modulating the system output characteristics. Figure 2 shows the basic architecture of the PID control module.
PID control is a linear control method, which subtracts the desired target value n(t) and y′(t) to obtain the deviation e(t), where y′(t) is the digitalized version of the actual output air pressure signal y(t). The deviation e(t) is further operated in the proportional control, integral control, and derivative control equations and then combined with the output u(t) to control the output object. The PID algorithm is denoted with the following equations.
u t = P + I + D
P = K p × e t
I = K i × 0 t e τ d τ
D = K d × d d t e t
where
  • Kp: proportional gain adjustable parameter,
  • Ki: integral gain adjustable parameter,
  • Kd: differential gain adjustable parameter,
  • t: current time,
  • τ: variable of integration, with the number from 0 to current time t .
When the system is continuously operated, the PID control unit must constantly modulate proportional gain, integral gain, and differential gain parameters according to the feedback of the barometric pressure sensing signal to have the system achieve optimal control, i.e., achieving system stability without divergence or excessive oscillation of output signals. When PID is applied to the micro spray gun (airbrush) system that can switch the spray on and off, its robustness can make the spray gun maintain a constant output speed and allow the spray gun to maintain the required output speed under different working conditions. Through the feedback control, the motor can reduce the jitter when starting and stopping, reducing the wear or damage of the motor.

2.3. Experimental Design

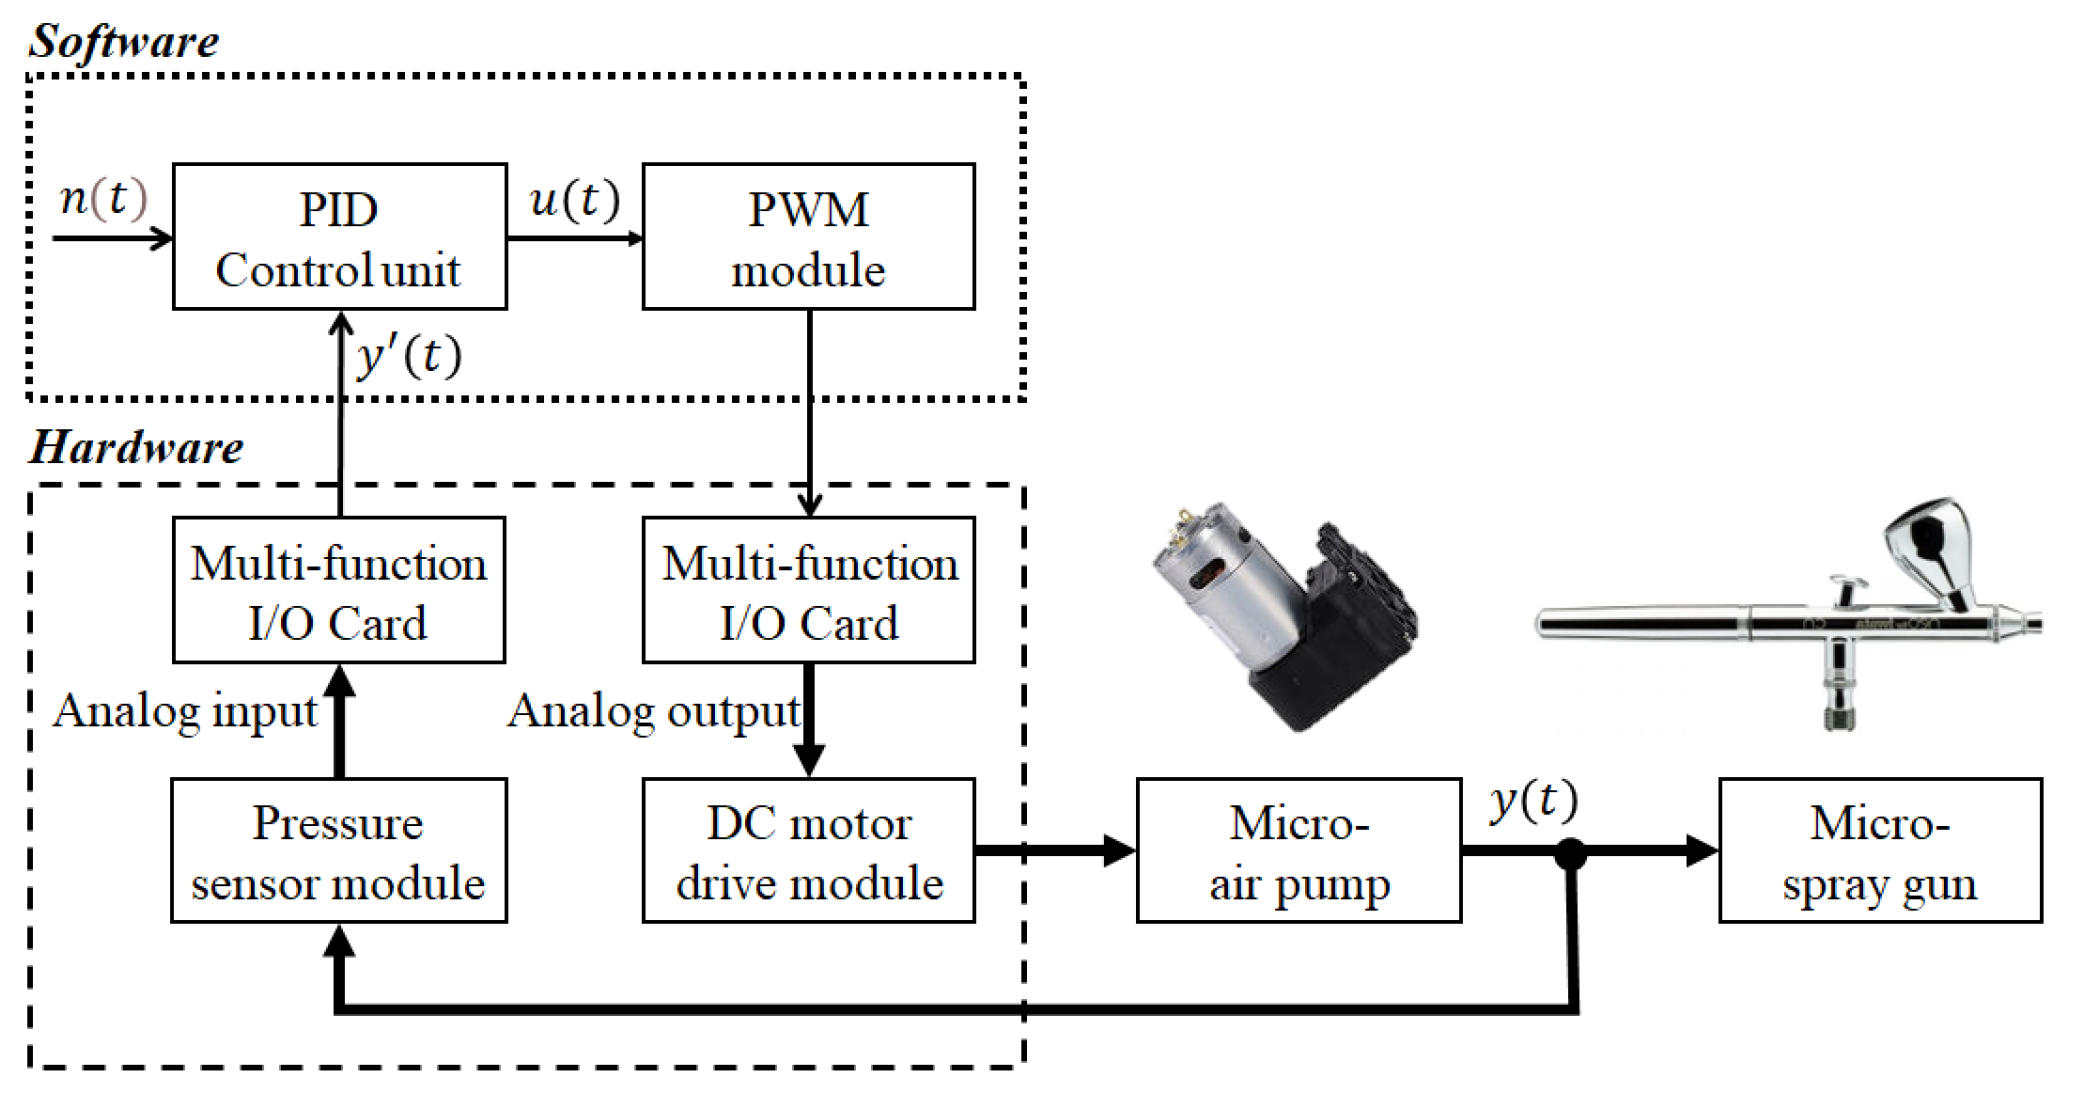
2.3.1. System Architecture

Figure 3 depicts the PID control process, mainly containing two dotted square boxes of software function and hardware function. The software box includes a PID control algorithm and outputs pulse width modulation through programming. NI LabVIEW (National Instruments Co., Austin, TX, USA), the graphic high-level programming language, is used for software development. The hardware box covers a multifunction I/O card (NI USB-6211, National Instruments Co., Austin, TX, USA), a DC motor drive module, and a pressure sensor module. The u(t) in the PID control block is eventually driven for the output unit, which contains a pulse width modulation converting module and DC motor drive module to drive the micro air pump. In order to acquire the feedback signal output for the parameter modulation in the PID control module, a barometric pressure sensor is selected for capturing the pressure change in the pipe, Figure 3.
NI USB-6211 isolated multifunction I/O card, with digital and analog output/input function and the highest digital-analog resolution and sampling rate of up to 16 bits and 250 k samples per second, is utilized as the digital-analog interface card. The hardware interface card reads analog signals from the pressure sensor module as real-time feedback data for the PID control module, and the analog output refresh rate is 250 k samples per second, of the interface card, which could generate high-frequency impulse shape to modulate accurate duty ratio for controlling the micro air pump.
The small air pump, Airpon D2028 (Ningbo Forever Electronic Appliance Co., Ltd., Ningbo, Zhejiang, China) with a working pressure from −70 to +250 kPa, is used as the micro air pump in this study. DC motor drive module with dull-channel full-bridge motor driver chip produced by STMicroelectronics company (Geneva, Switzerland) is used for driving the micro air pump. The driver module with the features of high operating voltage, large output current, strong driving capability, low calorific power, and strong anti-jamming capability is often used for driving relay, solenoid, solenoid valve, DC motor, and stepping motor. To reduce shock at the beginning of the air pump start, the micro air pump is directly fixed on the plastic mat with plastic ties, Figure 4a. Two control signal wires of the air pump are connected to the DC motor drive module so that the exhaust would first pass a unidirectional valve to prevent airflow from backflow and affecting motor operation. The exhaust pipe of the micro air pump, through a three-way pipe, as the dotted square in Figure 4a, is connected to the micro spray gun and a pressure sensor module.
To test the control effect of the sprayer of the air pump, an airbrush is added to the back of the micro air pump. The system is called a micro spray gun. The professional spray gun (Iwata NEO N4500 Airbrush, Anest Iwata Co., Nishio-shi, Aichi, Japan) is adopted; it is the spray gun suitable for dealing with details or large areas. Figure 4b shows the picture of the spray gun. The micro spray gun sprays paint through air pressure, and the spray gun is generally equipped with an air exhaust switch. The spray gun applies dual action function, as green and blue arrows in Figure 4b. The exhaust volume is controlled by pressing the button or pressing the back of the spray gun. The air input source comes from the micro air pump shown in Figure 4a. The connection point can be seen from the plastic hose above the picture.
To observe the pressure change in the system operating process, another side of the three-way pipe is connected to a pressure sensor module, which integrates a Wheatstone bridge sensor and signals processing chip and covers circuits of a differential amplifier, automated calibration, and temperature compensation. The pressure sensor module could transmit the pressure in the pipe, through the analog-digital conversion of a multifunction I/O card, to the software box for algorithm operation.

2.3.2. Characteristics of the Micro Air Pump

To test the air pressure changes after the multifunction I/O card driving the micro air pump, the PID control algorithm is not utilized, but simply using the multifunction I/O card to output the PWM signals to the DC motor drive module for the micro air pump exhaust. A program is planned with software to change the duty ratio of PWM signal output from 0% to 100% in 20 s, meaning that the duty ratio would increase by 1% per 200 ms. Finally, the multifunction I/O card would read and record the pressure in the pipe.
After the 20 s experimental recording, Figure 5a shows the air pressure change without pressing the micro spray gun switch, as a black solid line, and the air pressure change when pressing the micro spray gun switch, as a gray solid line. The left vertical axis is the pressure change. From the data in Figure 5a,b, the micro air pump appears slow pressure rise on PWM being 55% in both experiments, i.e., the motor smoothly runs at about 11 s, and the initial running of the motor appears on the PWM duty ratio about 55–65%. As shown in the red square in Figure 5b, there is a comparatively large pressure fluctuation. The pressure fluctuation is considered as the micro air pump exhaust not being stable yet, and the pressure signal change would also affect the algorithm in successive PID control experiments. In this case, the duty ratio of the PWM output is controlled at >70% in the successive PID experiment, as to set the micro air pump pressure above 40 kPa, to stabilize the system. It is also discovered in Figure 5b that a large amount of exhaust appears when the micro spray gun switch is pressed, and the maximal pressure difference, under the same PWM output control, is about 30 kPa; it could be understood from the green area in the figure. From Figure 5b, it can be found that when the PWM output is in the range of 70% to 100%, the pressure fluctuation does not exceed 10 kPa. Therefore, assumed that the e(t) of pressure should be controlled below 10 kPa when the algorithm could stabilize the convergence.
The relationship between the driving motor speed and the current of the micro air compressor is quite complicated, and it will vary due to factors such as structure, power supply, and load. This study used a 12 V micro air compressor. When the PWM duty ratio reaches the maximum percentage rate (100%), the motor will also reach the highest speed. When the motor starts from the static, the speed of the motor is not a linear relationship with the driving current, and it must be known according to the actual experiment. Therefore, to understand the relationship between the speed and current of the driving motor, the current corresponding to different PWM duty ratios must be measured. The correlation characteristic curve of the two is shown in Figure 5c. There are five slope lines in Figure 5b that indicate the pressure delta to PWM duty ratio. The slope is in order p3 > p2 > p5 > p4 > p1, and the unit is kPa/%. The driving current of the corresponding PWM duty ratio is shown in Figure 5c. Compared with Figure 5b,c, which would present the driving currents at each stage. The Area-A area of Figure 5c are the currents when the PWM duty ratio is below 55%. Due to insufficient driving current, the motor is almost un-rotated. Area-B was just starting, so the pressure shown in Figure 5b has not yet stabilized. When the micro spray gun is not started, it can be seen from Figure 5b,c that the current value of the Area-C is large, the current delta is relatively large, and the pressure slope is largest. Currently, the PWM duty ratio is about 69–77%. The current in Area-D is relatively stable. So, when the PWM duty ratio is more than 77%, it can reach stability. When the micro spray gun starts to spray, the p4 slope line in Figure 5b corresponds to the Area-C, D, and E in Figure 5c, the PWM duty ratio is more than 69%, and the current is relatively stable. This should be because the gas starts to discharge, lifting the previous closed chamber effect, so that pump can operate stably; improve efficiency.

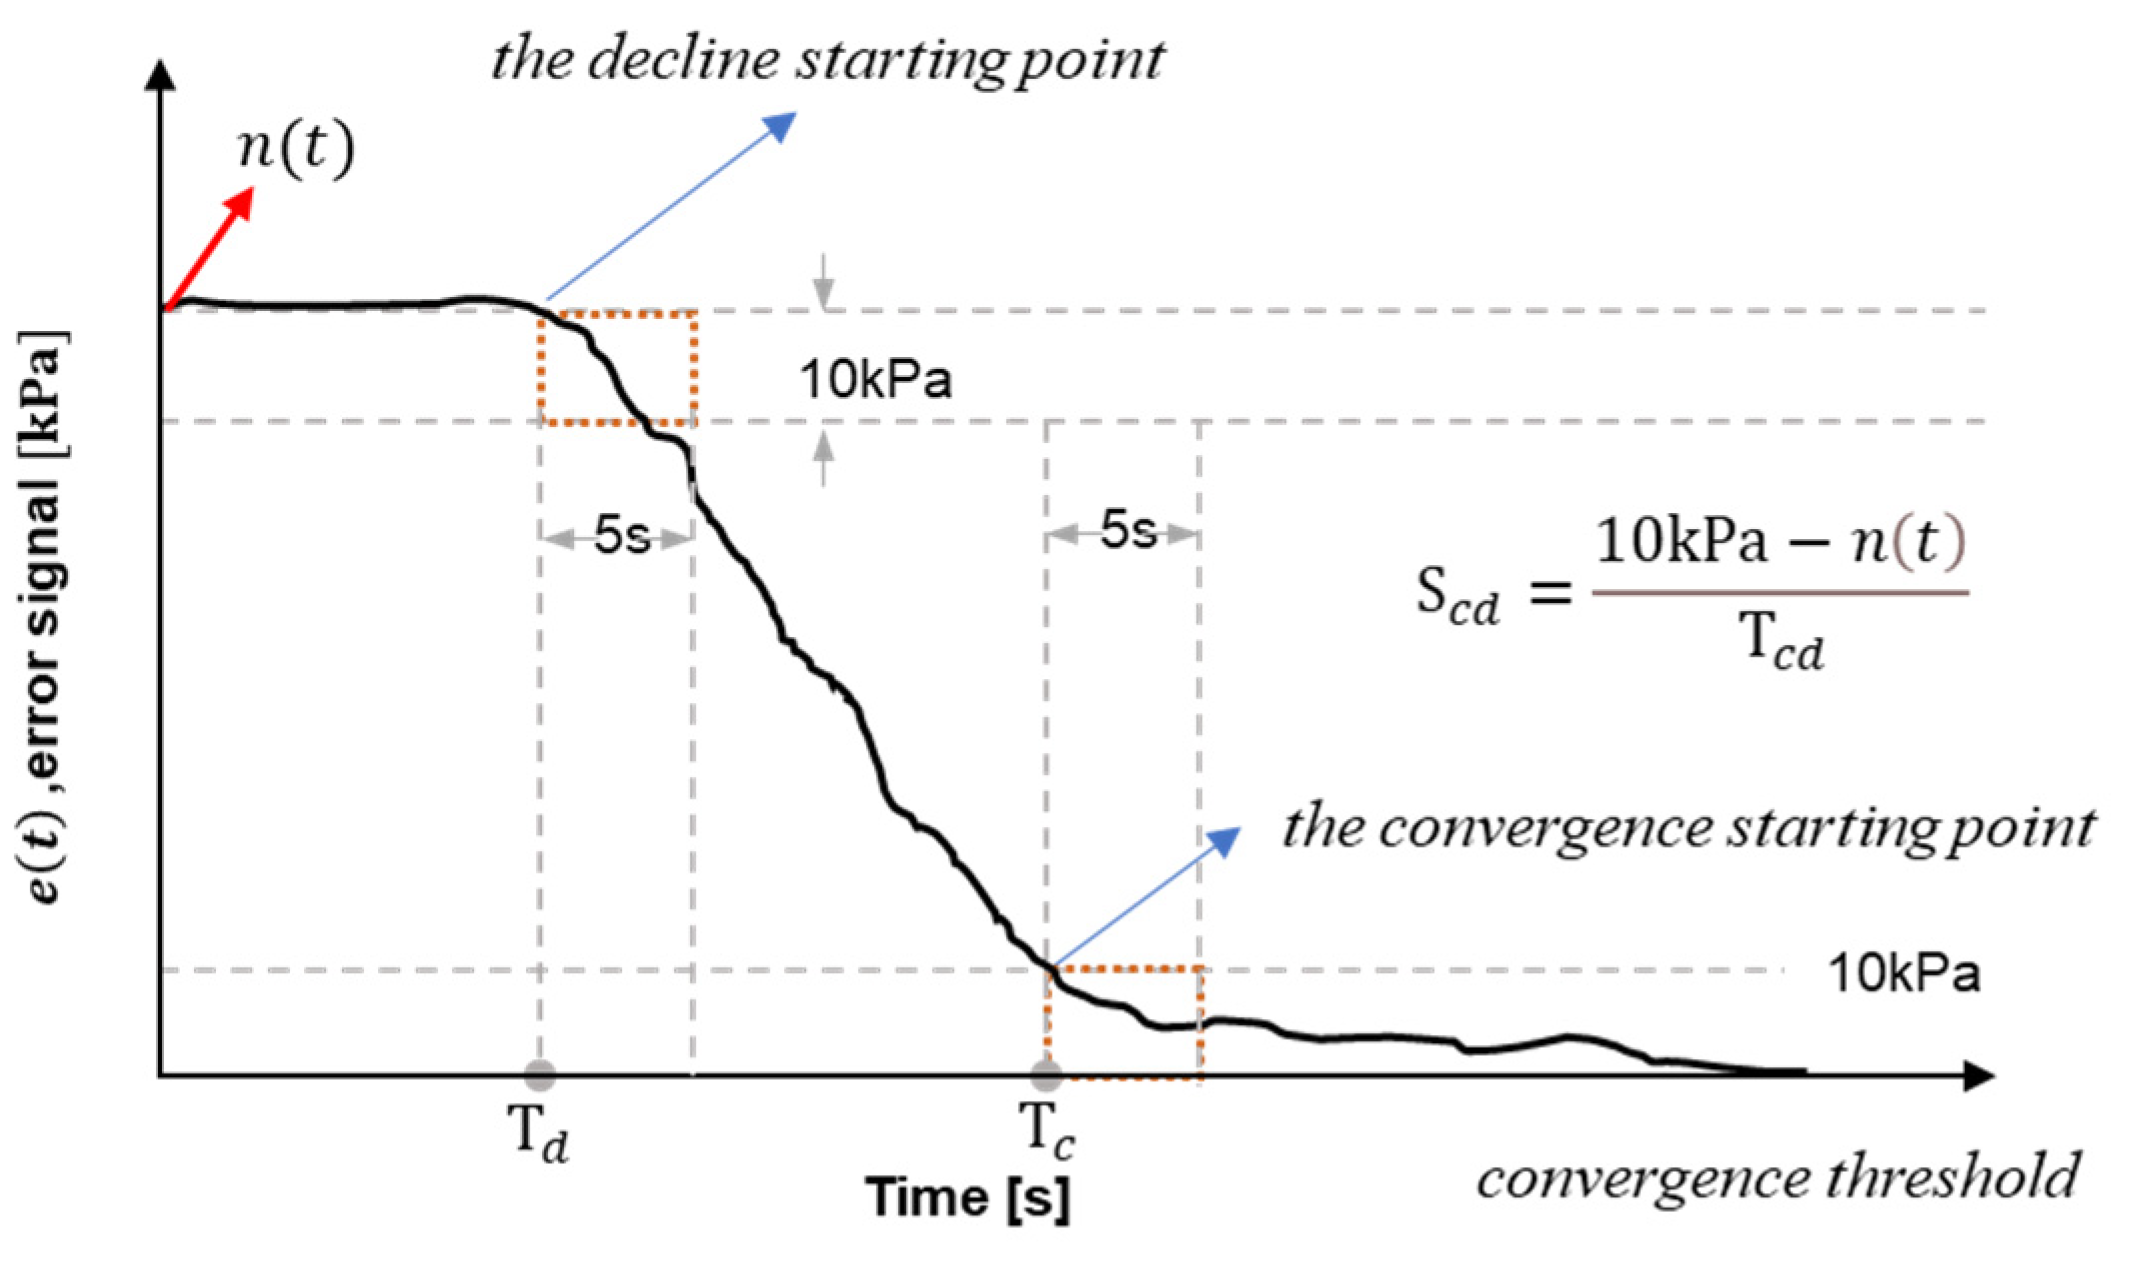
2.3.3. Convergence Condition

The algorithm convergence condition is further defined in the section. In the PID control experiment, the e(t) is generally observed by modulating the parameters to analyze the most suitable parameters for the expected target value n(t). m1, m2, and m3 in Figure 5a are used for denoting the pressure above 40 kPa changing with time. For instance, m3 shows a 15.5 kPa rise per second, m2 reveals a 8.5 kPa rise per second, and m1 appears at a 5 kPa rise per second. It also reveals that the PWM output could have the pressure rise 10 kPa within 2 s when the PID parameter is modulated to a stable stage. From another point of view, when the parameter could have the algorithm converge, the e(t) in this system could control it under 10 kPa within 2 s.
Aiming at the monitoring time interval of the e(t) getting into the convergence state at least higher than 2 s, the monitoring time interval is set to 5 s in our experiment. That is, when the e(t) could be inhibited in the minimal convergence error amount of 10 kPa in 5 s intervals, the experiment achieves the convergence condition. It would be easier to comprehend from the curve in Figure 6. When the pressure of e(t) starts to drop below the convergence critical threshold (10 kPa), the change maintaining below 10 kPa in 5 s is observed. When it conforms to the condition within 5 s, the time point dropping down to 10 kPa is called the convergence time (Tc), also the convergence starting point.
When the PID algorithm is executed, it would appear distinct fall trend due to different target values n(t). In this case, the convergence condition in the previous paragraph is defined; that is, when the e(t) starts to be lower than the n(t), the observation would be continued for 5 s. When e(t) is lower than n(t) in the 5 s, it is called the decline time (Td), i.e., the decline starting point. To compare the convergence condition under different parameters, the convergence and decline intervals (Tcd) of e(t) is defined as the time difference between Tc and Td. The convergence and decline slope (Scd) is subtracting the target value n(t) from the minimal convergence error amount (10 kPa) and then divided by Tcd, as the equation in Figure 6. Incidentally, the e(t) convergence change curve presented in Figure 6 is the data collected continuously for 0.1 s, and then reproduced with the data of 1 s after averaging 10 points.

3. Results

3.1. Effects under Different Target Values

To verify the effect of the PID control algorithm on the micro air pump, the experimental design and software planning are preceded according to the system architecture in Figure 3. A micro spray gun is added on the back of the micro air pump but exhausted by not pressing the switch of the micro-spray gun. According to the data explanation in Section 2.3.2, the micro spray gun is suitable for the application to exhaust volume above 40 kPa. n(t) is therefore set to 40, 50, 60, 70, 80, 90, and 100 kPa as the target value for the algorithm.
The PID controller could generally acquire the close parameters through trial and error. First, according to the experience, merely Kp is added to the system. Kp is set as the minimum to observe the convergent tendency of e(t). If the system response is slow, increase the Kp value, otherwise decrease the Kp value to obtain the range suitable for the experimental parameters. So, with these rules of thumb, we finally set the differential gain adjustable parameter Kd to 0, the integral gain adjustable parameter Ki is set to 0.1, and the proportional gain adjustable parameter Kp is modulated to 0.1, 0.05, 0.01, and 0.005 to observe the convergence condition.
Figure 7 shows the condition of e(t) being continuously monitored for 100 s when the target value n(t) is set to 60 kPa, and the PID parameters are set with four Kp values. The smaller e(t) reveals the closer y′(t) from the pressure sensor to the target value n(t). According to the convergence condition described in Section 2.3.3, the PID algorithm monitors the stability when e(t) gets in the minimal convergence error amount (10 kPa). From Figure 7, it is discovered that the decline point Td could be achieved in about 2–3 s when the Kp is set to 0.1. However, the e(t) is hard to achieve the convergence condition in a short period; it takes about 96 s to drop down to the convergence critical threshold (10 kPa). Strictly speaking, the parameter has the system approach the divergence. The other three Kp values reach the convergence condition; when Kp is 0.05, 0.01, and 0.005, the Tc appears at 9 s, 27 s, and 52 s, respectively. Such a result reveals that the fastest speed to achieve the convergence critical threshold appears when Kp is set to 0.05.
The experimental data are organized in Figure 8. The x-coordinate in Figure 8a is the target value n(t) with the PID algorithm. In this case, the selection of Kp indeed presents distinct effects on Tc, under the same target value. Kp being 0.005, compared with 0.05 and 0.01, appears longer convergence time; when Kp is 0.1, signal oscillation appears at 60 kPa and 70 kPa, without being stably adapted. Furthermore, the convergence time Tc, relative to the target pressure, is out of proportion, and, even when n(t) is 60 kPa, Tc is longer than Kp being set to 0.005. In this case, when Kp is set to 0.1, n(t) should be above 80 kPa to really conform to the convergence condition; it could be viewed from the blue round in Figure 8a. In Figure 8b, convergence decline slope Scd is applied to present the difference under a different target value. It is discovered that the Scd change to the convergence situation of each target value is not big, when Kp is 0.005 and 0.01, maximally dropping the e(t) amount about 7.8 kPa per second. When Kp is 0.05, as shown in Figure 8b, the slope of Scd increases with the increase of n(t), which means that the algorithm can achieve a convergence effect at a similar time when n(t) is between 40 and 100 kPa. As shown in the orange triangle in Figure 8a, the overall Tc are very close.

3.2. Effects under Pulse-like Variables

When using a micro spray gun, pressing down the switch for spraying paint results in dropping pressure in the pipe, with a change of about 30 kPa. In this case, a pulse-like sequence variable, target value n(t), is regarded as the target to understand the adaption of PID parameters to different pressure changes. It simulates two target amounts, 65 kPa, and 95 kPa, in the time interval as the alternate output. The sequence data, according to the software planning, would change the n(t) of the system at 20, 40, and 60 s, as the switch between 65 kPa and 95 kPa of the grey curve in Figure 9.
Since better convergence appears on Kp being 0.05, the intervals ±0.02 and ±0.04 are selected for observing the effect of such Kp on pulse-like sequence data, while Ki remains 0.1 and Kd remains 0. From Figure 9, five curves show the results of tracing the target value with the PID control technology, when Kp is 0.01, 0.03, 0.05, 0.07, and 0.09.
In the first 20 s, n(t) as 65 kPa is the target of PID when the micro air pump is just started; it is discovered that the system appears to overshoot when Kp is 0.09. The result is similar to Figure 8a in that oscillation is more easily appear when Kp is 0.1 and n(t) is under 70, it is hard to get into the region of convergence. When Kp is 0.01, it is difficult to catch the target value of 65 kPa in the first 20 s, due to the relatively smaller value. The convergence effect could be achieved at about 10 s with the other three parameters of Kp being 0.03, 0.05, and 0.07; that is, the rising speed and the effect of overshoot, when Kp appears 0.05 ± 0.02, are more acceptable. Overall, the overshoot and time for rising to the target value under Kp being 0.05 show better adaptability on 20 s after the system startup.
After 20 s, the target value n(t) is programmed to 95 kPa and the standard of convergence is soon achieved when Kp is 0.09, as it is close to 0.1. According to the observation of Figure 8a, it would get into the region of convergence soon when Kp is 0.1 and n(t) is above 90. The experimental result with the parameters is therefore reasonable. When Kp is 0.09 and the system is modulated to a steady state, it would not appear unstable error variation as in the starting, even when the target value is changed to 65 kPa after 40 s. When Kp is 0.01, although it takes a long time to keep up with the target value n(t), it has begun to catch up gradually, but e(t) is still much larger than other parameters. With the rest three parameters, e.g., Kp = 0.03, 0.05, and 0.07, the change is stable along with the target value and the convergence is achieved within a short period. Furthermore, after 20 s and the overshoot phenomenon as in the system starting does not appear when Kp are 0.05 and 0.07.

3.3. Effects of PID Convergence

As the system architecture in Figure 3, when pressing down the switch on the spray gun, the spray nozzle starts to spray air and immediately reduces the air pressure in the pipe. To have the air maintain certain output, the system would enhance the exhaust volume of the micro air pump through the PID algorithm, i.e., enhancing the percentage of PWM.
Figure 10a shows the pressure change y′(t) before/after pressing the switch of the micro spray gun. The experimental parameters selected Kp to be 0.05, Ki remained at 0.1, and Kd is 0. The grey line in Figure 10a shows the system locking the target value n(t) on 65 kPa. In this case, the system, after starting, would catch up with the set target value n(t) according to the parameters set by PID. The result reveals to catch up to the target value at about 10 s. When the time achieves 20 s, the switch of the micro spray gun, as the green arrow indicated in Figure 4b, is pressed. It is discovered that the pressure, after pressing the switch, immediately drops about 25 kPa, and PID would control output after the system detects the pressure change. As a result, when the pressure is reduced, PID would increase the percentage of PWM to enhance the exhaust output volume to maintain the pressure at the target value of 65 kPa. Figure 10a shows that it takes about 10 s, after pressing down the switch, to have the pressure return the target value. The process could be viewed through the change in PWM modulation. Figure 10b displays the PWM change after pressing down the switch of the micro spray gun. When the system achieves stability, the PWM modulation value does not appear to large changes, e.g., PWM stably maintains 70% after starting for 10–20 s, as the red dotted double arrows in Figure 10b. When the spray gun switch is pressed at 20 s, PWM starts to increase the output percentage; after 30 s, PWM almost remains at 95%, without much modulation, as the black dotted arrow in Figure 10b.

4. Discussions

Aiming at the experiment results, three points are discussed.
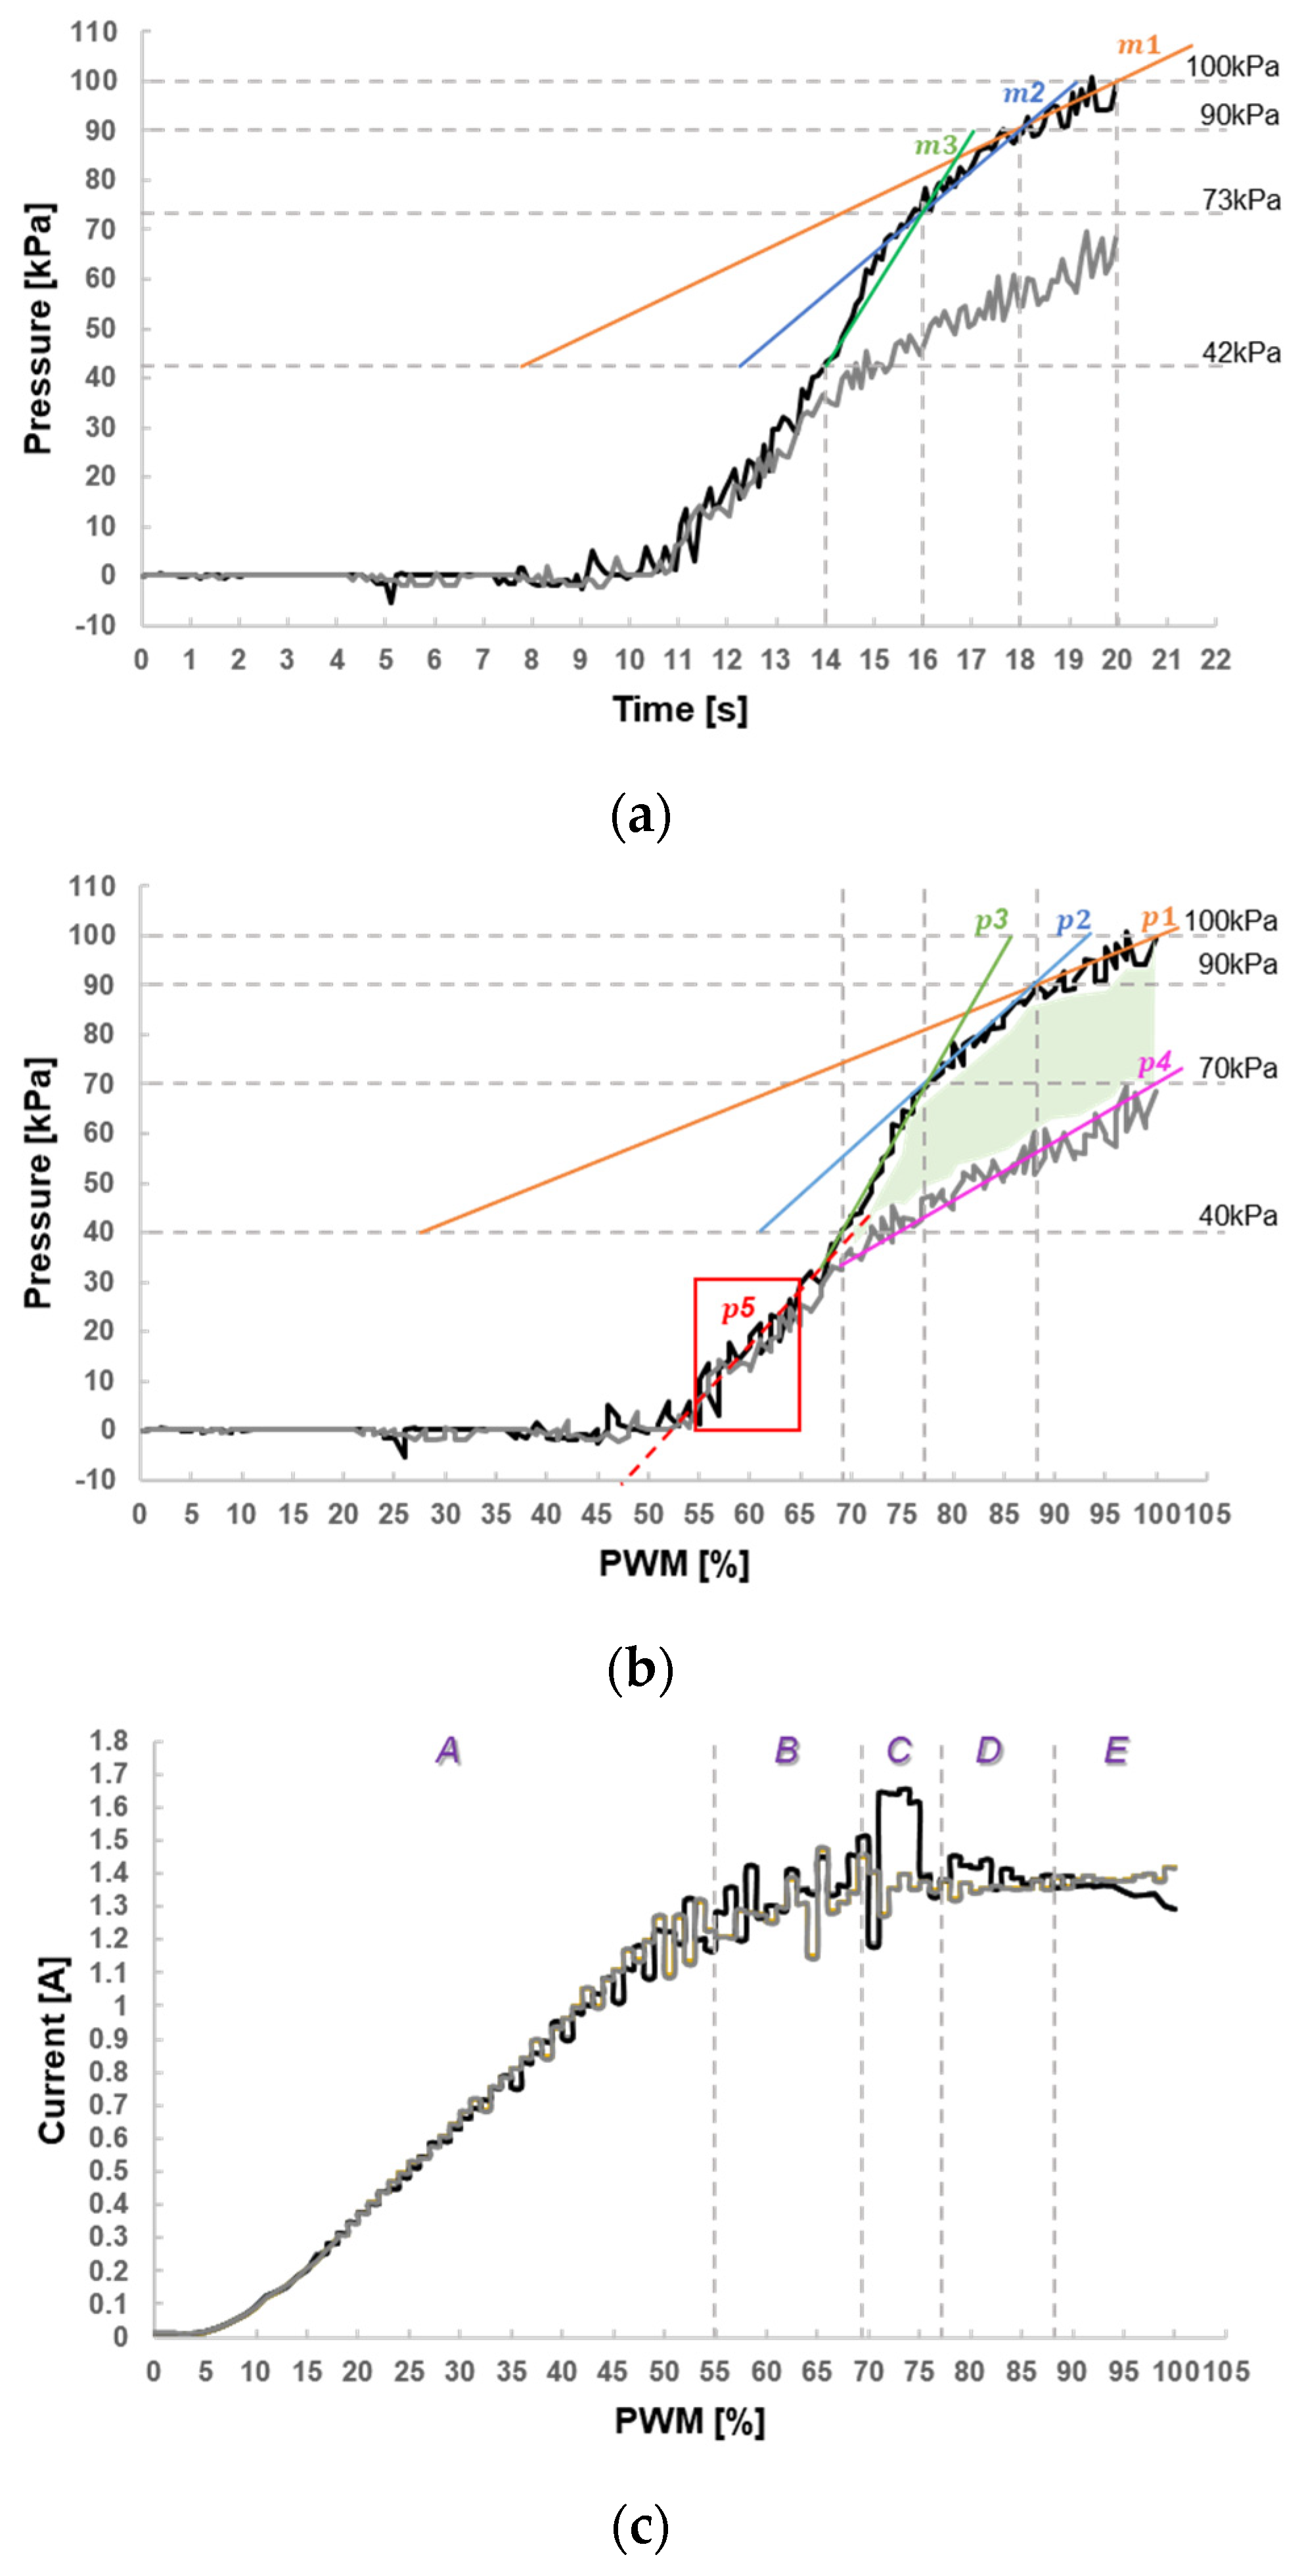
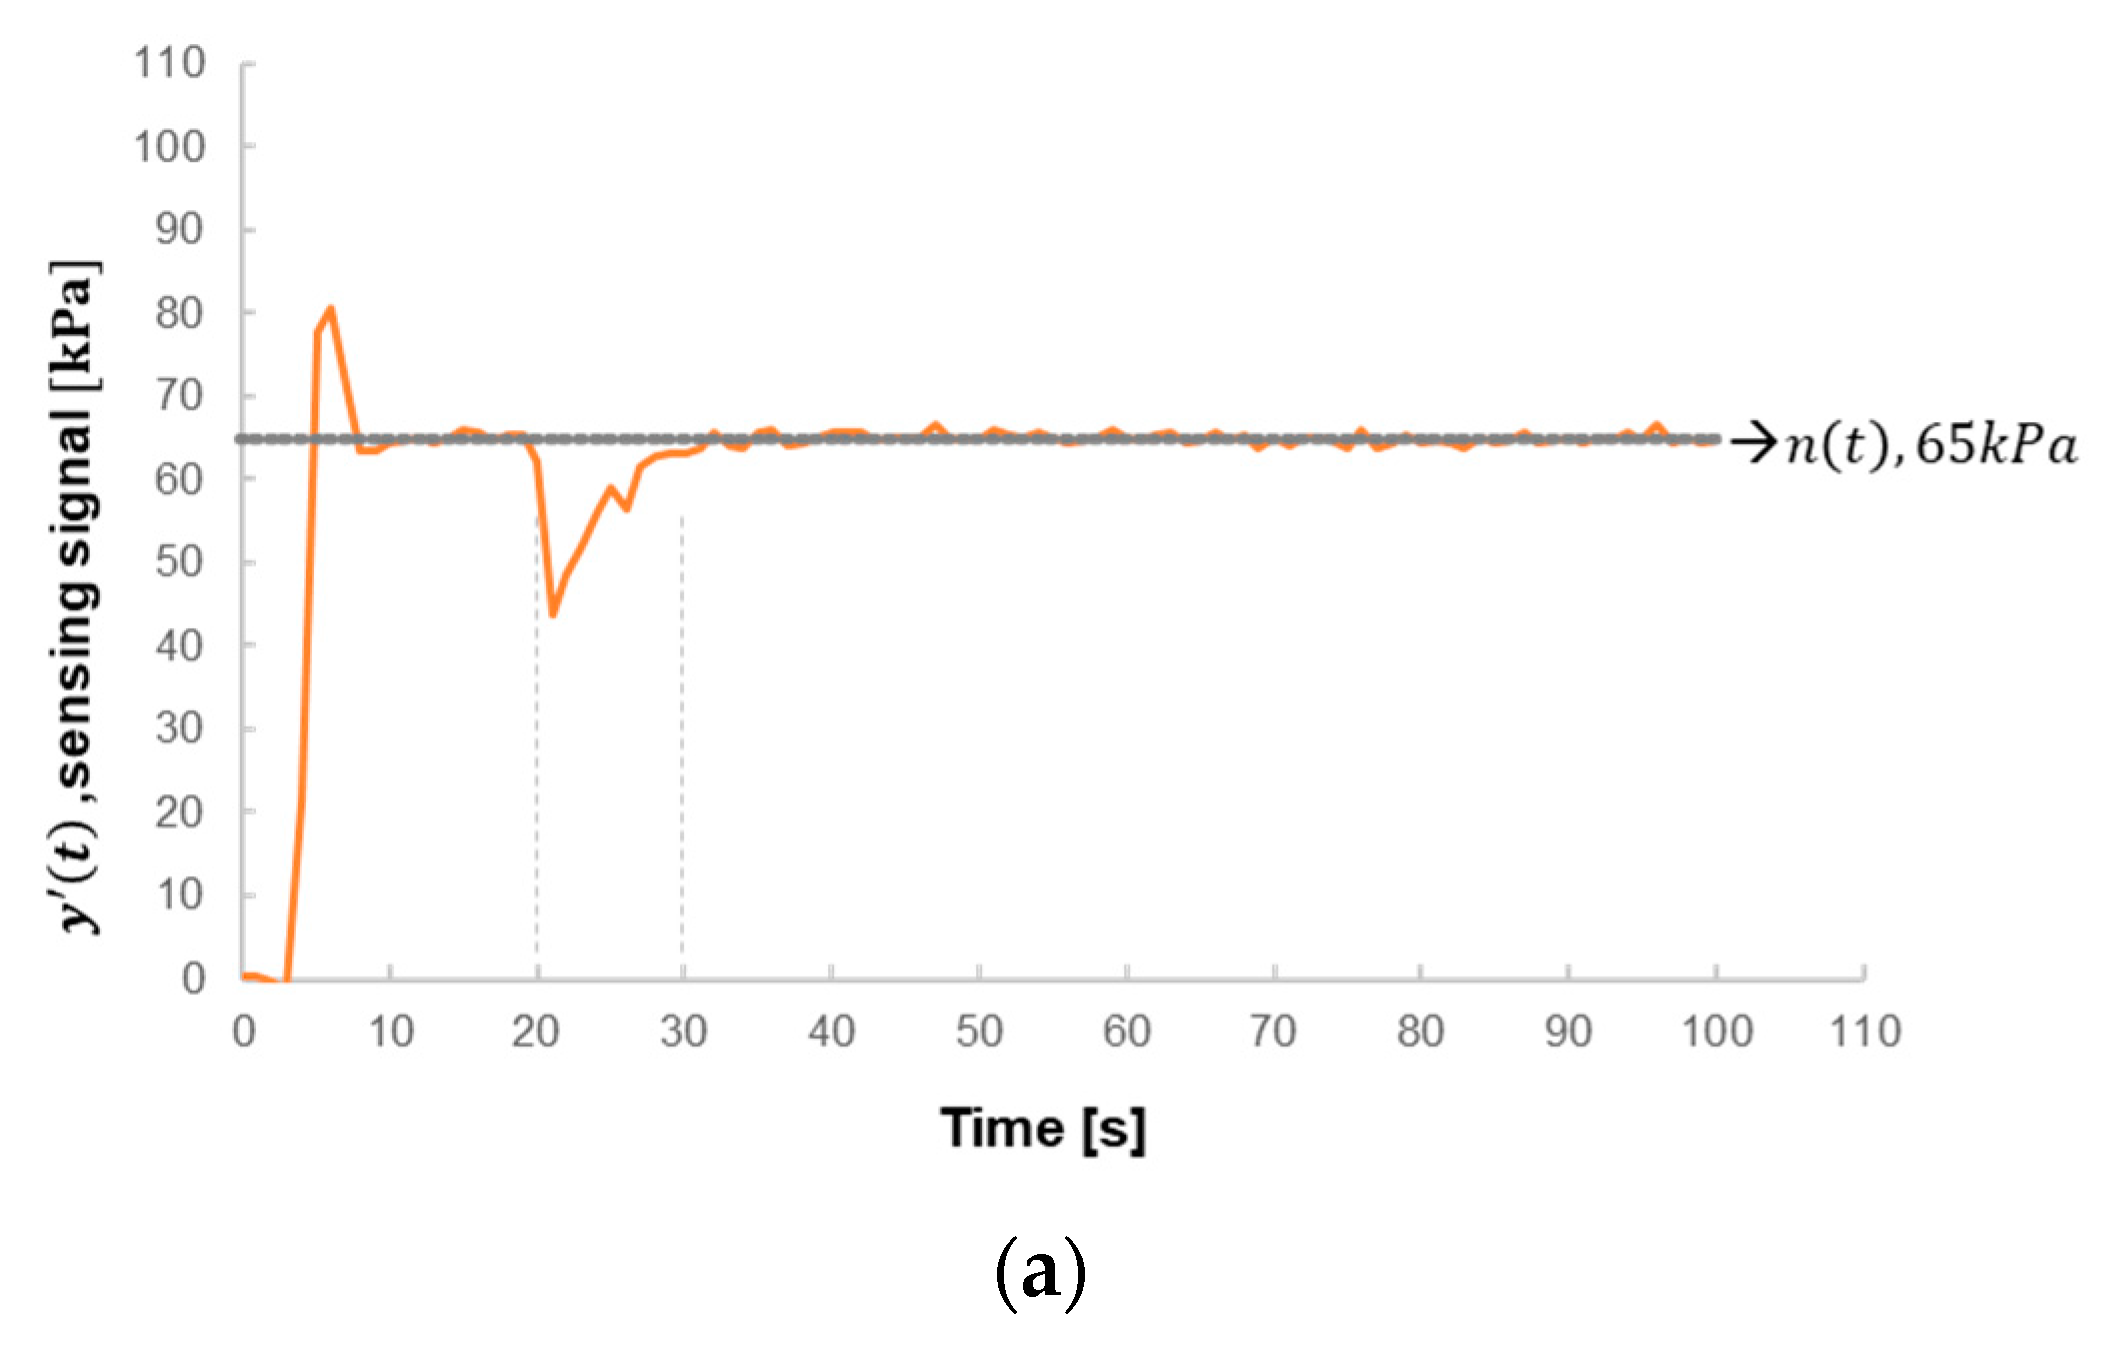
  • The experimental data reveal that the internal structure of the micro air pump presents certain effects on the control response, rather than simply a linear state. Consequently, the experiment results shown in Figure 5a could verify the better pressure output range of the micro air pump above 40 kPa. The exhaust, when the spray gun is pressed, results in dropping pressure in the pipe to influence the overall pressure output. In this case, the maximal pressure sensed is about 70 kPa when PWM is modulated to the maximal 100%, with the difference of about 30 kPa from the spray gun not being pressed. In the experiment in Section 3.3, the preset target value of 65 kPa would drop down to 40 kPa after pressing the spray gun. The low pressure during paint spray would affect the spray quality and result in the irregular operation of the motor, due to the unstable air pump, damaging the life. Automatic control technology could effectively change the exhaust output volume and stabilize the operation of the air pump. This study verifies the driving module and algorithm control technology of the automatic system. The experiment results after pressing the spray gun proves that proper parameter modulation allows the system design to return the target pressure within a specified period.
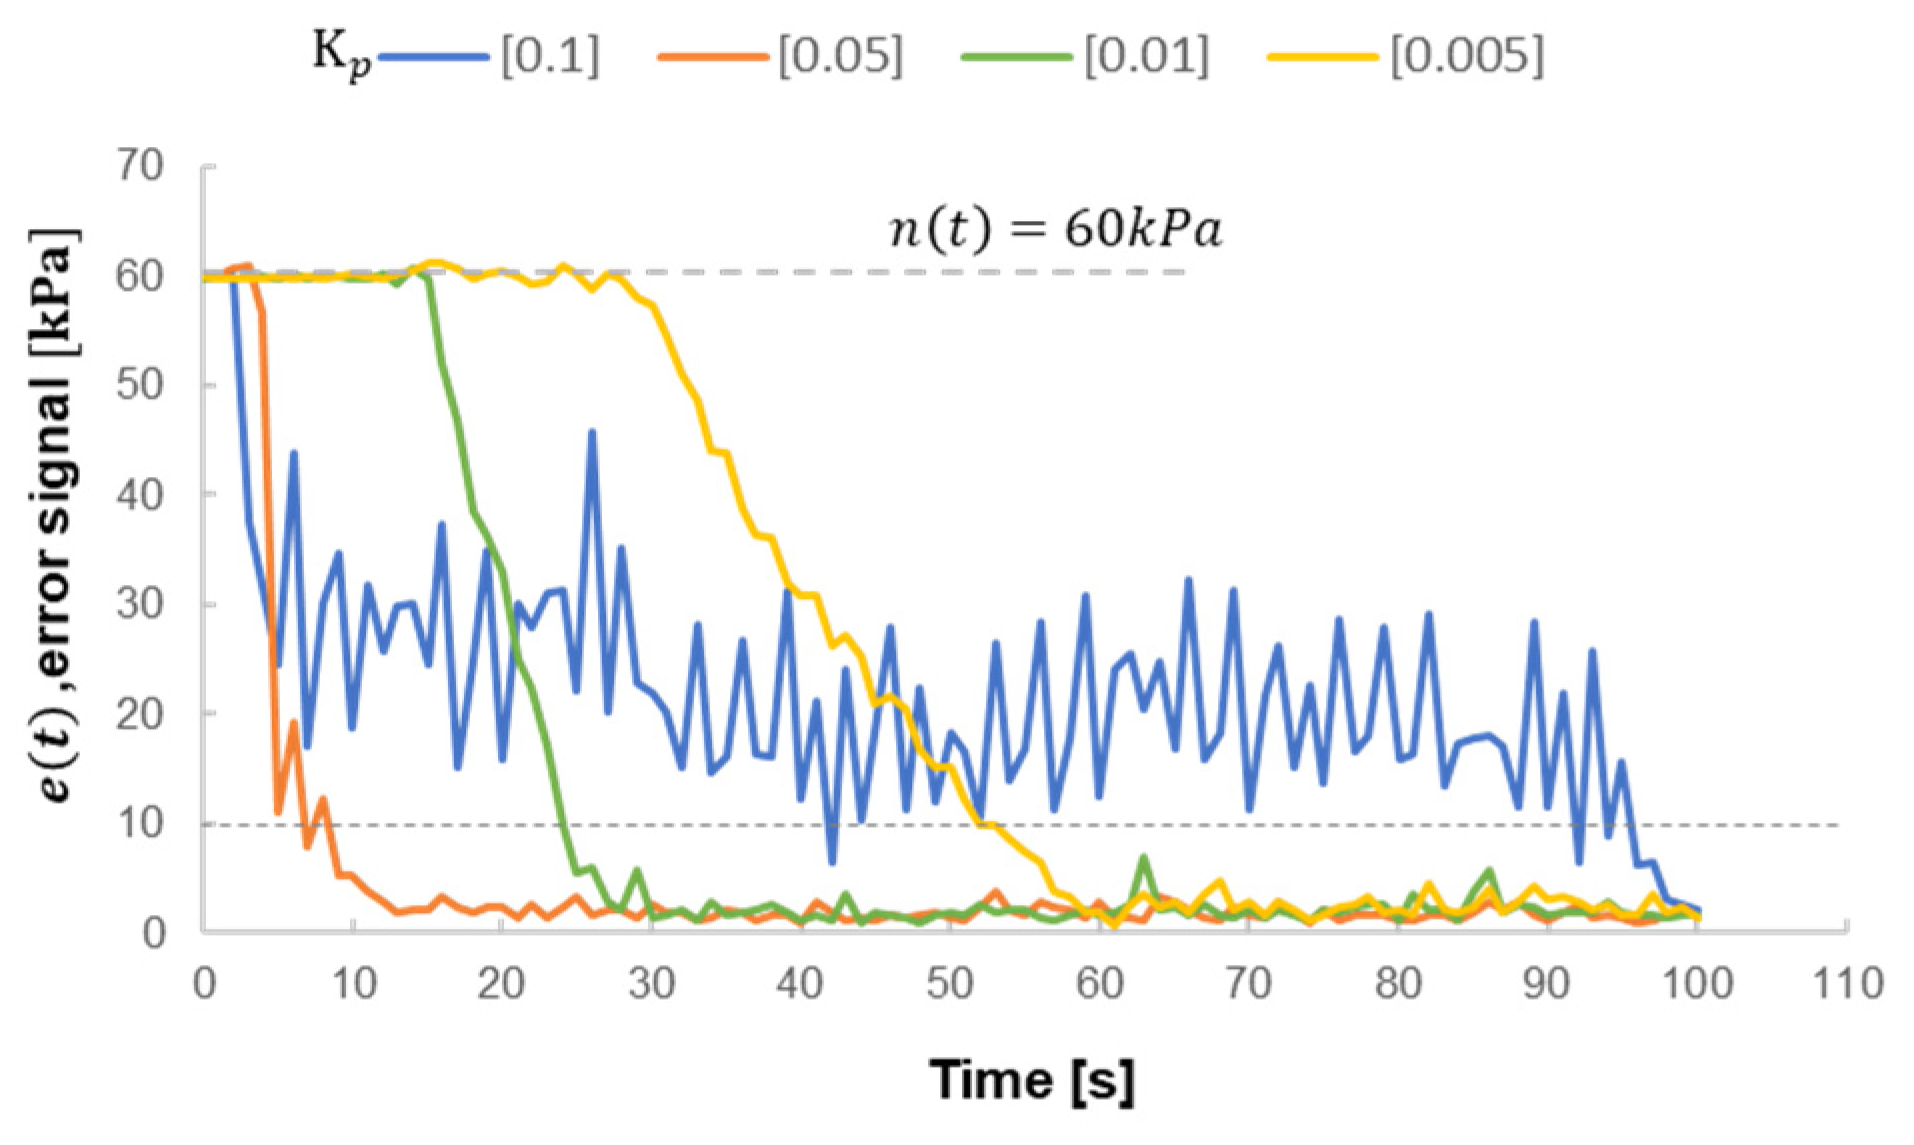
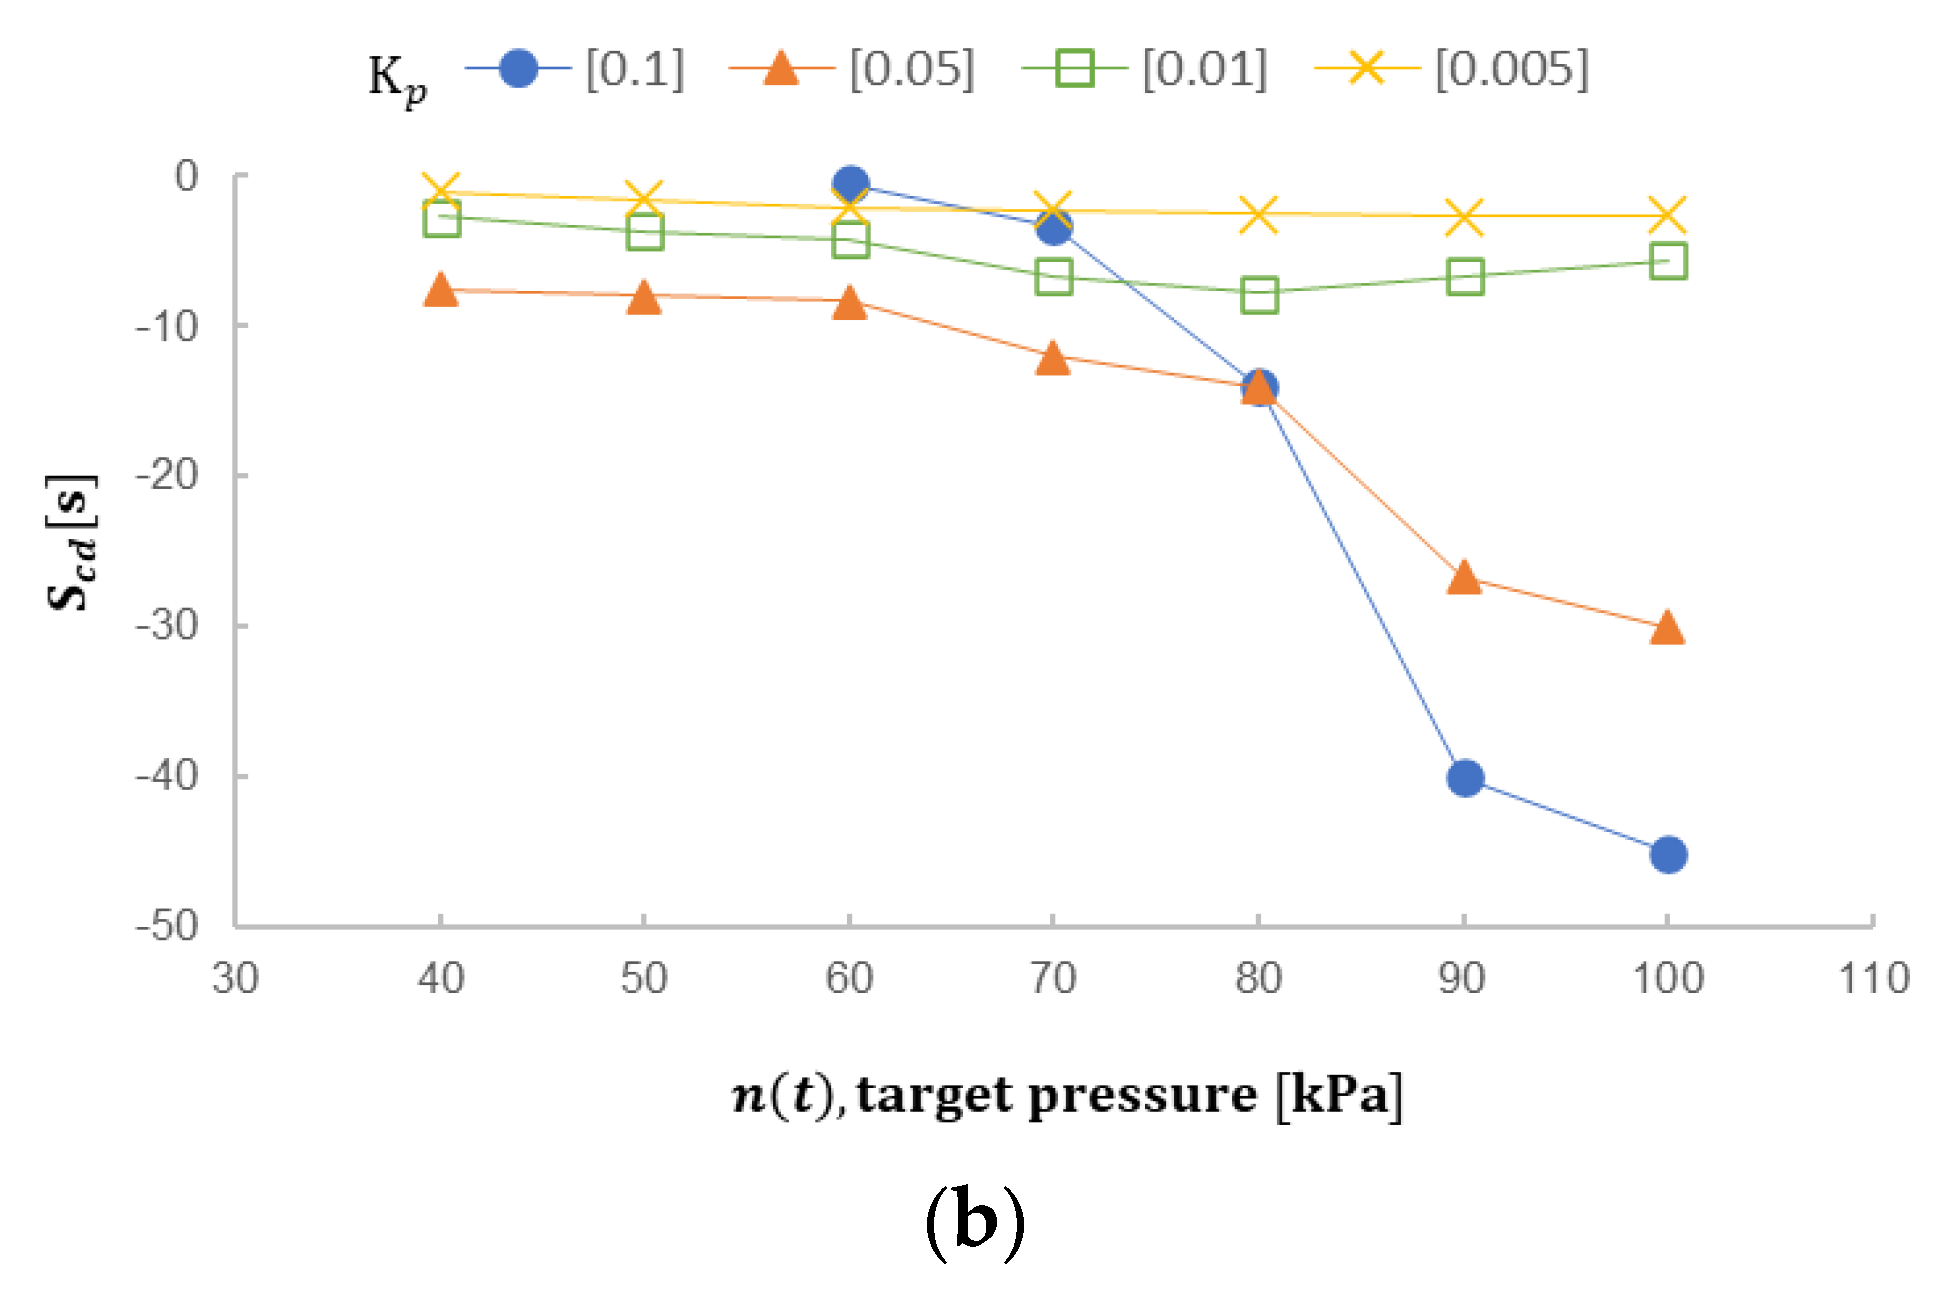
  • The proportional gain adjustable parameter Kp determines the ratio of the output response to the error signal. In general, increasing Kp will increase the responsiveness of the control system, but if the proportional gain is too large, the process variable will start to oscillate. If Kp is increased further, the vibration will become larger and larger, and the system will become unstable, and even uncontrollable vibration may occur. As the result in Figure 7, Kp = 0.1 is obviously a larger value in this experiment; under the same target value n(t), the error is comparatively difficulty to be controlled in the convergence range. Perhaps, Kp appears faster convergence time and convergence speed when n(t) is above 80 kPa with several larger target values n(t), as in Figure 8a. Nevertheless, the higher instability results in n(t) being 60 and 70 kPa, the convergence time being largely prolonged, and the convergence time, with n(t) being 60 kPa, is even longer than it when Kp is 0.005. Particularly, it could not get into the convergence condition when n(t) is 40 kPa and 50 kPa. Such applications would cause several unpredictable errors and even non-practical ones.
    When smaller Kp is selected, the error signal is less sensitive and the response to the target signal being suddenly interfered with or appearing larger variable would be too slow and the output control signal is not large enough to catch up with the variable quantity. As in Figure 9, the target value n(t) in the moment of conversion at 65 kPa and 95 kPa, when Kp is 0.01, does not cause system instability or divergence, but the speed to catch up with the target value is indeed slower. In real applications, it is difficult to predict or limit users to stably press the spray gun so that the pressure variable would happen at any time. The pulse-like target variable experiment planned in Section 3.2 is used for coping with such pressure variables with proper parameter settings so that the micro spray gun system could be normally operated.
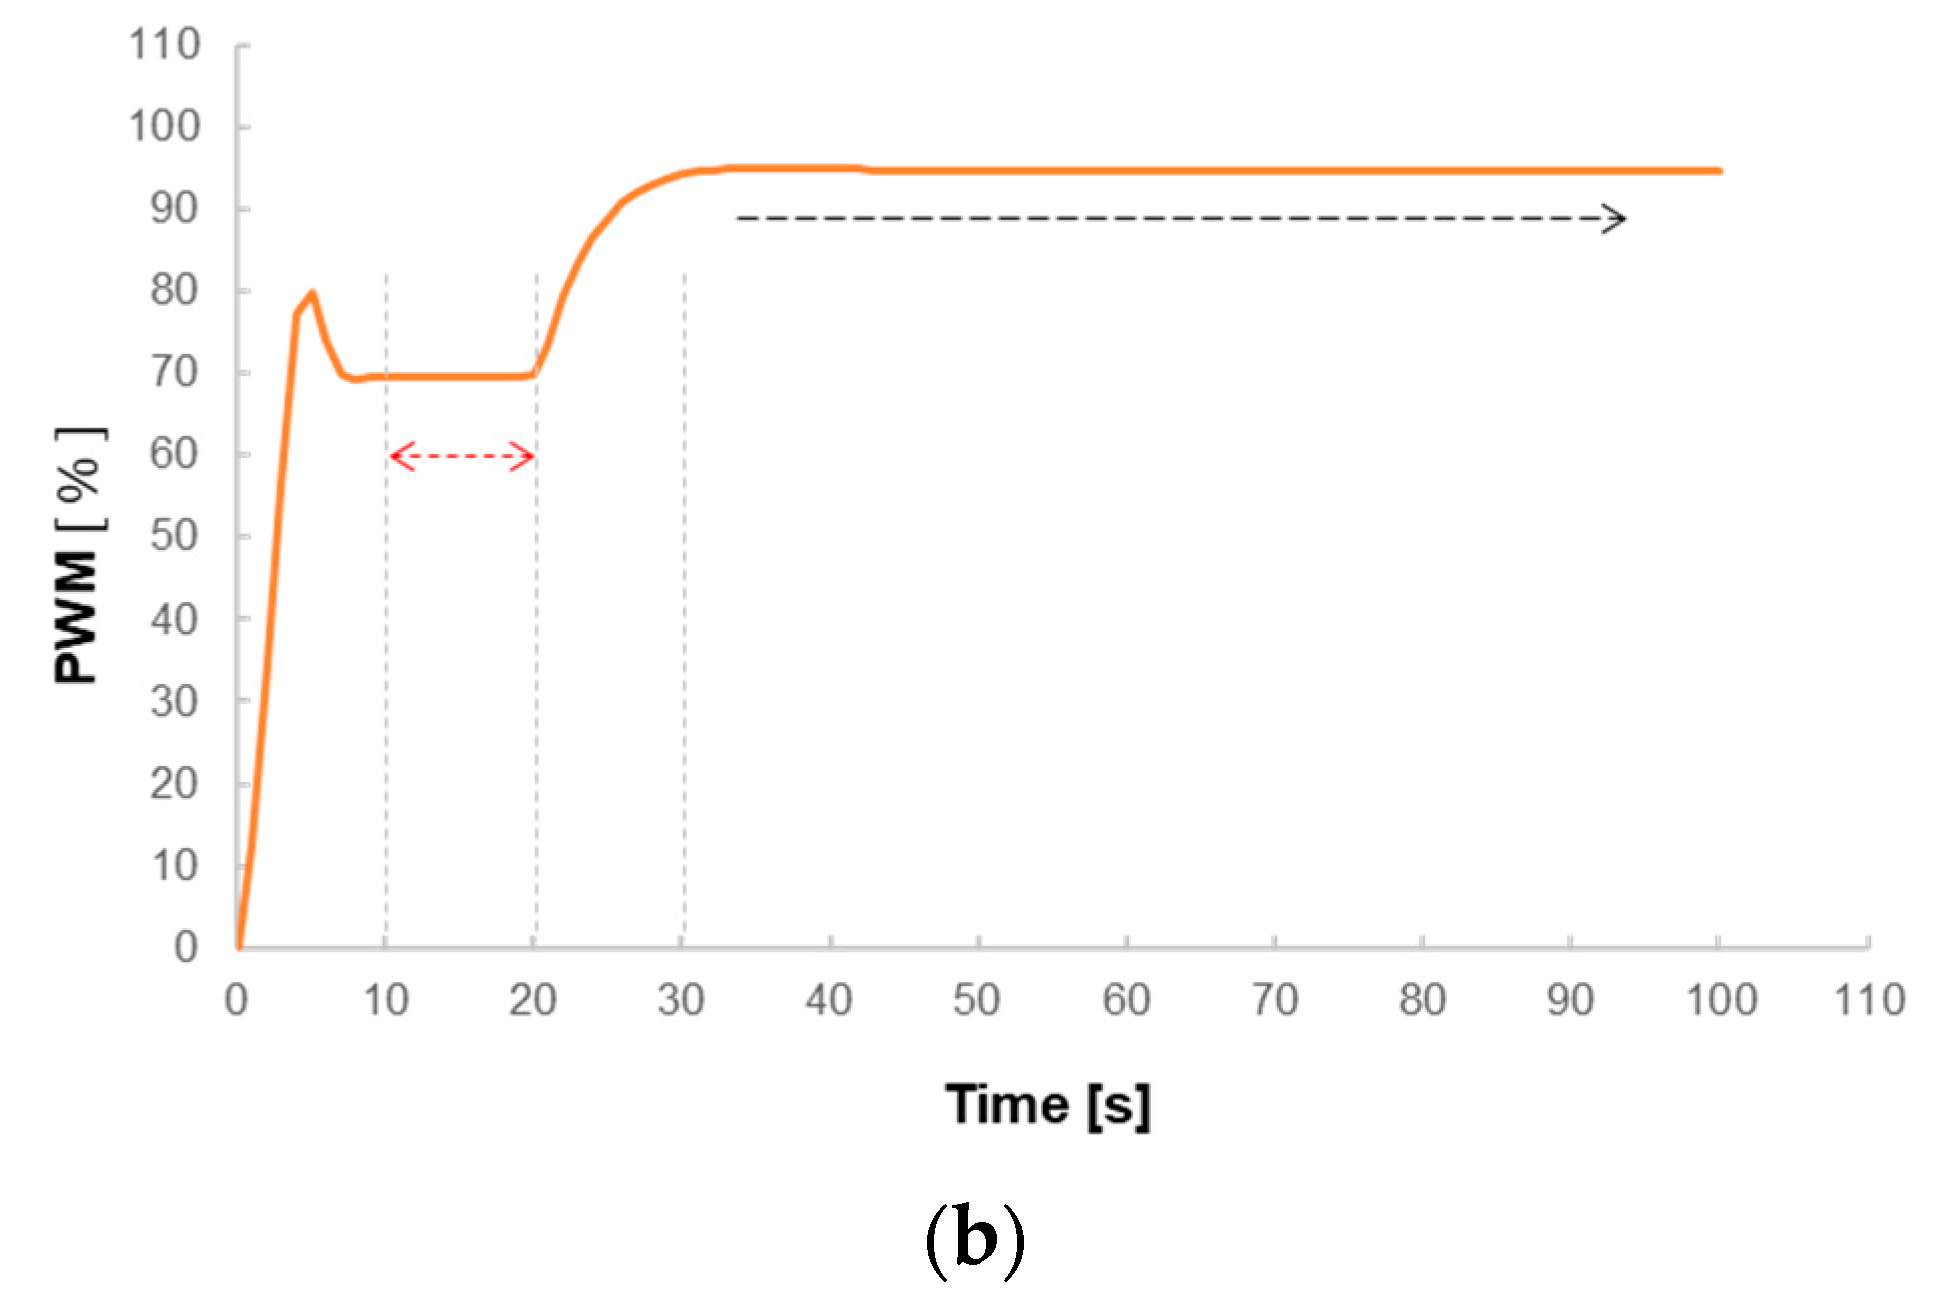
  • After pressing the micro spray gun, the pressure of the feedback signal immediately drops to have the PID system make larger output modulation. It reveals the same operation idea of pulse-like variable target value; but the pressure disturbance in the pipe, after pressing the spray gun, cannot be predicted. Figure 10a shows that y′(t), after returning the target value, still appears slight fluctuation. However, the PID output control could have the PWM stably increase, without overshoot of the system, Figure 10b. It is therefore considered that Kp being set to 0.05 could effectively catch up with the target within a short period, and selecting proper Ki could accelerate the system approaching the target and eliminate the steady state error on Kp.

5. Conclusions

The micro spray gun (airbrush) is primarily used for fine art drawing, and the quality of the spraying depends on the accuracy and stability of the air pressure. However, traditional mechanical regulation may not always meet the necessary requirements. Our study introduces the PID method for the first time to improve the spray quality, even without an air receiver. The experiment results show that, under a proper selection of Kp and Ki, the target pressure changes within 30 kPa could achieve the convergence condition in 10 s. The results as well show that the instant pressure difference of 25 kPa after spraying could be increased to the target pressure in 10 s.
Consequently, the entire system architecture design could realize the adaptive micro sprayer, effectively reduces wear, and enhances the service life. The system architecture designed in this study would provide the reference for the realization of miniaturized micro-controller in the future to achieve the goal of adaptive portable micro spray gun equipment.

Author Contributions

Conceptualization, J.-H.L. and C.-H.C.; methodology, C.-H.C.; software, J.-H.L.; validation, S.-T.T.; formal analysis, S.-T.T.; investigation, C.-H.C.; resources, J.-H.L.; data curation, S.-T.T.; writing—original draft preparation, C.-H.C.; writing—review and editing, J.-H.L. and S.-T.T.; visualization, J.-H.L.; supervision, S.-T.T.; project administration, S.-T.T.; funding acquisition, J.-H.L. All authors have read and agreed to the published version of the manuscript.

Funding

This research received no external funding.

Conflicts of Interest

The authors declare no conflict of interest.

References

  1. Sudduth, K.A.; Borgelt, S.C.; Hou, J. Performance of a chemical injection sprayer system. Appl. Eng. Agric. 1995, 11, 343–348. [Google Scholar] [CrossRef] [Green Version]
  2. Erkan, U.; Huseyin, G.; First, K. A review of electrostatic spraying for agricultural applications. J. Agric. Mach. Sci. 2016, 12, 229–233. [Google Scholar]
  3. Liu, Z.B. High-Precision Spray Gun Spraying Control System Based on Linear Regulation. China Patent CN113019732A, 2021. [Google Scholar]
  4. Giles, D.K.; Bensalem, E. Spray droplet velocity and energy in intermittent flow from hydraulic nozzles. J. Agric. Eng. Res. 1992, 51, 101–112. [Google Scholar] [CrossRef]
  5. Deng, W.; Zhao, C.; Chen, L.; Wang, X. Comparison of spray characteristics for three types of variable spray. J. Agric. Eng. Res. 2016, XLVII 512, 148–156. [Google Scholar] [CrossRef] [Green Version]
  6. Grella, M.; Gioelli, F.; Marucco, P.; Zwertvaegher, I.; Mozzanini, E.; Mylonas, N.; Nuyttens, D.; Balsari, P. Field assessment of a pulse width modulation (PWM) spray system applying different spray volumes: Duty cycle and forward speed effects on vines spray coverage. Precis. Agric. 2022, 23, 219–252. [Google Scholar] [CrossRef]
  7. Orti, E.; Cuenca, A.; Perez, M.; Torregrosa, A.; Ortiz, C.; Rovira-Mas, F. Preliminary evaluation of a blast sprayer controlled by pulse-width-modulated nozzles. Sensors 2022, 22, 4924. [Google Scholar] [CrossRef] [PubMed]
  8. Maski, D.; Durairaj, D. Effects of electrode voltage, liquid flow rate, and liquid properties on spray chargeability of an air-assisted electrostatic-induction spray-charging system. J. Electrost. 2010, 68, 152–158. [Google Scholar] [CrossRef]
  9. Chen, S.; Yin, D.; Wei, X.; Pei, W. Design and simulation of variable weed spraying controller based on adaptive neural fuzzy inference system. J. Drain. Irrig. Mach. Eng. 2011, 29, 272–276. [Google Scholar]
  10. Patel, M.K.; Ghanshyam, C.; Kapur, P. Characterization of electrode material for electrostatic spray charging: Theoretical and engineering practices. J. Electrost. 2013, 71, 55–60. [Google Scholar] [CrossRef]
  11. Sasaki, R.S.; Teixeira, M.M.; Fernandes, H.C.; Paulo, M.; Denílson, E.R.; Cleyton, B. Parameters of electrostatic spraying and its influence on the application efficiency. Rev. Ceres 2013, 60, 474–479. [Google Scholar] [CrossRef]
  12. Shilkrot, R.; Maes, P.; Paradiso, J.A.; Zoran, A. Augmented airbrush for computer aided painting. ACM Trans. Graph. 2015, 34, 1–11. [Google Scholar] [CrossRef]
  13. Mohamed, A.A.S. An Investigation into the History of the Airbrush and the Impact of the Conservation Treatment of Airbrushed Canvas Paintings. Ph.D. Thesis, Northumbria University, Newcastle upon Tyne, UK, 2016. [Google Scholar]
  14. Chen, Y.C. Study on the Airbrush Makeup Applied to the Whole Fashion Design Combining with the Concept of Multi-Media. Master’s Thesis, Department of Cosmetics Science, Vanung University, Taoyuan, Taiwan, 2022. [Google Scholar]
  15. Lin, J.H.; Tang, S.T.; Chen, C.H.; Cheng, Y.T.; Tai, C.C.; Lin, M.H. The Prototype Design and Verification of Intelligent Variable Output Control Apply on Micro-spray Gun Simulation Platform. In Proceedings of the 2022 International Conference on Fuzzy Theory and Its Applications (iFUZZY), Garden Villa, Kaohsiung, Taiwan, 3–5 November 2022. [Google Scholar]
  16. Yan, H. Diaphragm Air Pump. China Patent CN201714643U, 2011. [Google Scholar]
  17. Jalnekar, R.M.; Jog, K.S. Pulse-width-modulation techniques: A review. IETE J. Res. 2020, 46, 175–183. [Google Scholar] [CrossRef]
  18. Li, Y.; Ang, K.H.; Chong, G.C.Y. Patents, software and hardware for PID control—An overview and analysis of the current art. IEEE Control Syst. Mag. 2006, 26, 42–54. [Google Scholar]
  19. Lopez-Gomez, J.; Vargas-Trevino, M.A.D.; Vergara-Limon, S.; Vargas-Trevino, M.; Gutierrez-Gutierrez, J.; Palomino-Merino, A.D.; Martinez-Solis, F.; Felix-Beltran, O. Influence of PWM torque control frequency in DC motors by means of an optimum design method. IEEE Access 2020, 8, 80691–80706. [Google Scholar] [CrossRef]
  20. Zhang, R.; Gao, L.X. Research on motor control and simulation based on PID and internet of things system. Microprocess. Microsyst. 2021, 80, 103602. [Google Scholar] [CrossRef]
Figure 1. Picture and side shot of a micro electric air pump.
Machines 11 00354 g001
Figure 2. The basic architecture of the PID control unit.
Machines 11 00354 g002
Figure 3. PID control test architecture of micro air pump.
Machines 11 00354 g003
Figure 4. Micro air pump and micro spray gun configuration. (a) Picture of micro air pump fixed on the plastic mat material and the I/O contact layout. (b) Picture of micro spray gun and the schematic diagram of exhaust switch start. The green arrow stands for pressing down the switch, and the blue arrow reveals pressing the switch to the back of the spray gun.
Machines 11 00354 g004aMachines 11 00354 g004b
Figure 5. Numerical change of pressure sensor in the micro air pump operating process without PID control algorithm. (a) The cross plot of time and pressure sensor value, PWM duty ratio, (b) The cross plot of PWM duty ratio and pressure sensor value. (c) The cross plot of PWM duty ratio and current value.
Machines 11 00354 g005
Figure 6. Definition points of convergence condition aiming at PID control algorithm observing error amount.
Machines 11 00354 g006
Figure 7. The changing trend of each error amount e(t), when target value n(t) is set to 60 kPa, and set PID parameter Kp = 0.1, 0.05, 0.01, and 0.005.
Machines 11 00354 g007
Figure 8. When Kp = 0.1, 0.05, 0.01, and 0.005, (a) The different n(t) values and the corresponding convergence time Tc and (b) The different n(t) values and the corresponding convergence decline slope Scd.
Machines 11 00354 g008aMachines 11 00354 g008b
Figure 9. The grey line indicates a pulse-like curve simulating the target value n(t) in 65 kPa and 95 kPa, and converged at 20, 40, and 60 s. Output pressure y′(t) under PID parameter Kp = 0.1, 0.05, 0.01, and 0.005.
Machines 11 00354 g009
Figure 10. When the PID parameter is set Kp = 0.05, Ki = 0.1, Kd = 0, (a) The sensed pressure change, and (b) The change in PID modulating PWM output, before and after pressing down the micro spray gun.
Machines 11 00354 g010aMachines 11 00354 g010b
Disclaimer/Publisher’s Note: The statements, opinions and data contained in all publications are solely those of the individual author(s) and contributor(s) and not of MDPI and/or the editor(s). MDPI and/or the editor(s) disclaim responsibility for any injury to people or property resulting from any ideas, methods, instructions or products referred to in the content.

