Article

Flow and Performance of the Disk Cavity of a Marine Gas Turbine at Varying Nozzle Pressure and Low Rotation Speeds: A Numerical Investigation

1
Department of Energy and Power Engineering, Tsinghua University, Beijing 100084, China
2
College of Hydraulic Science and Engineering, Yangzhou University, Yangzhou 225009, China
3
Harbin Marine Boiler and Turbine Research Institute, Harbin 150078, China
*
Authors to whom correspondence should be addressed.
Machines 2023, 11(1), 68; https://doi.org/10.3390/machines11010068
Submission received: 30 November 2022 / Revised: 20 December 2022 / Accepted: 21 December 2022 / Published: 5 January 2023
(This article belongs to the Special Issue Optimization and Flow Characteristics in Advanced Fluid Machinery)

Abstract

:
In marine gas turbines, variations in rotational speed occur all the time. To ensure adequate cooling effects on the turbine blades, the valves need to be adjusted to change the pressure upstream of the pre-swirl nozzle. Changing such pressure will have significant effects on the local or overall parameters, such as core swirl ratio, temperature, flow rate coefficient, moment coefficient, axial thrust coefficient, etc. In this paper, we studied the flow characteristics within the pre-swirl system of a marine gas turbine at low rotational speed by varying the pressure at the pre-swirl nozzle. The corresponding global Reynolds number ranged from Re = 2.3793 × 10⁵ to 9.5172 × 10⁵. The flow in the rotor-stator cavities was analyzed to find the effects of nozzle pressure on the radial velocity, core swirl ratio, and pressure. According to the simulation results, we introduced a new leakage flow term into the formulary in the references to calculate the values of K between the inner seal and the pre-swirl nozzle. The matching characteristics between the pre-swirl nozzle and the inclined receiving hole was predicted. Performance of the pre-swirl system was also analyzed, such as the pressure drop, through-flow capacity, and cooling effects. After that, the moment coefficient and the axial thrust coefficient were predicted. This study provides some reference for designers to better design the pre-swirl system.

1. Introduction

With the continuous development of marine gas turbines, the demand for high performance and long service life are constantly growing. Effective cooling of the turbine blade and rotor without significantly increasing the amount of cooling air are important components that are always popular research subjects. They require insight into the flow in a pre-swirl disk cavity in the secondary air system.
The pre-swirl nozzle is the core component in the pre-swirl disk cavity. It provides the cooling air with large tangential velocity by twisting it. The jet flow is mixed with the cavity flow downstream of the nozzle. The difference in tangential velocity between the air and the disk then becomes small. Normally, the relative total temperature at the receiving hole inlet is used to estimate the cooling performance of delivered air on the turbine blade. With a relatively smaller tangential velocity difference, the cooling performance is improved. Meanwhile, the excessive amount of pre-swirl jet flow mixes with the cavity flow and may cause some problems, such as excessive pressure losses, axial thrust, disk frictional losses, etc. Over the past decades, a lot of related studies have been conducted to solve these problems. The scholars found three key parameters for the above parameters, namely through flow rate ( C w ), circumferential Reynolds number (Re), and axial gap width (G).
In recent decades, a great number of studies have been conducted on rotor-stator cavities, in particular on the pre-swirl system. EL-Oun and Owen [1] developed a theoretical model of adiabatic efficiency, which represents the level of temperature reduction capacity, based on the Reynolds analogy. Chew et al. [2,3] developed a basic model to calculate the temperature of the blade cooling air through experiments and numerical simulations. Ciampoli and Chew [4] put forward an automatic design method for a pre-swirl nozzle with CFD (computational fluid dynamics).
To improve the performance of a pre-swirl nozzle, the impact of geometric parameters is studied, such as the radial position, swirl angle, inlet diameter, and channel shape [5,6,7,8,9]. In the following up studies, Lee et al. [10] optimized a vane-type pre-swirl nozzle to increase the through-flow rate and enhance the temperature reduction. The optimized model improved the span-wise uniformity of the flow path, achieving an increase in the discharged capacity by 2.57%. Yang et al. [11] illustrated the combined and separate influences of jet impingement and air entrainment on the flow and heat transfer within the rotor-stator cavity. Liu et al. [12,13,14,15] modified the nozzle geometry, lead angle, and aspect ratio to optimize the performance of a pre-swirl system. Hu et al. [16] carried out numerical simulations to study the flow characteristics, temperature drop, and specific entropy increment for the pre-swirl system with a different radial angle for the pre-swirl nozzle. Lin et al. [17] investigated the impact of flow rate and speed of rotation on the flow dynamics in the rotor-stator cavity with the pre-swirl jet flow at a low radius.
In terms of heat transfer, Cheng et al. [18] used numerical calculations to analyze the effects of three different inlet pre-swirl ratios and turbulence coefficients on the heat transfer characteristics in the pre-swirl disk cavity. Liu et al. [19,20] put forward a vane-hole shape pre-swirl nozzle. They demonstrated its advantage by comparing the pressure losses and temperature reduction with those of the vane nozzle. Zhao et al. [21], Wu et al. [22], and Wang et al. [23,24] studied the heat transfer in the rotor-stator cavity and revealed the mechanism of heat transfer of such a cavity.
The application of CFD during the optimal design of a turbomachine is the focus of numerical simulation nowadays [25]. In the numerical simulation of the rotor-stator cavity, many scholars tried different simulation methods to investigate the mechanism of flow and heat transfer. Damavandi et al. [26] studied the flow in a rotor–stator cavity with a curved rotor disk using the LES (large eddy simulation) technique. Liao et al. [27] used the conjugate CFD to investigate the flow and heat transfer in the rotor–stator cavity. They compared the results with steady-state simulation and experimental results. Jia et al. [28] proposed a numerical model for the ingestion of hot main flow into a rotor–stator cavity model, considering the rotor vibration. The results show that the sealing effectiveness at the outer rim seal increases due to the vibration of the rotor; meanwhile, the amplitudes of the pressure fluctuation decrease in the sealing gap. Schroeder et al. [29,30] presented an experimental investigation of centripetal leakage flow with and without pre-swirl in the rotor–stator cavities by analyzing the results from two test rigs. The influences of Re, G, and C w on the radial pressure distribution, axial thrust, and frictional torque are presented. Onori et al. [31] used the proper orthogonal decomposition (POD) method to estimate the results from LES to identify a set of orthonormal basis functions for the Galerkin projection of the Navier–Stokes equations.
Besides the pre-swirl nozzle, there are a number of significant influences on the pre-swirl system. Lin et al. [32] revealed the heat transfer mechanism and energy conversion characteristics with the influences of many factors, such as the seal flow, friction, and work performed by either the rotating or the stationary parts. He et al. [33] and Shi et al. [34] focused on the effect of flow rate on cavity flow. Zhao et al. [35] numerically investigated the impact of blade fracture on cavity flow with a centrifugal superposed flow with the non-axis-symmetry boundary conditions. When the turbine blade fractures, the velocity obviously changes in the downstream region at a high radius, especially when the local Reynolds number, Reφ, is large. Ren et al. [36] designed and performed an experimental investigation to determine the flow characteristics in a rotor–stator cavity with a large gap ratio and inlet at a low radius. The results indicate that the flow in the rotor–stator cavity is still dominated by circumferential motion. However, the velocity increases with the increase of radial position. In different axial positions, the velocity distribution is different. When the cavity flow approaches the rotor, it becomes uneven.
In a marine gas turbine, it is more and more important to widen its operating conditions, even below 20% of the rated speed of rotation. Therefore, the secondary air system is required to work at a small speed of rotation, even around 20% of the rated value. Therefore, it is very important to check whether the secondary air system is functional. In addition, in a marine gas turbine, there are some valves to adjust the pressure at the inlet of the pre-swirl nozzle, aiming to improve the performances at off-design conditions, especially at a small speed of rotation (below 50% maximum rotating speed). It is also possible that the performance of the pre-swirl system is improved if we bleed the cooling air from the later stage of the compressor.
Hence, this paper uses the CFD method to investigate the pressure (70% to 140% of the design values) at the pre-swirl nozzle on the flow characteristics and overall performance of the pre-swirl system. The ranges of the speed of rotation are from 12.5% to 50% of the maximum speed of rotation of the gas turbine. The flow characteristics, performance of the pre-swirl system, disk frictional losses, and axial thrust are predicted. The results can expand knowledge and provide a reference for designers to better consider the effects of pressure at the nozzle inlet on performance at a small speed of rotation.

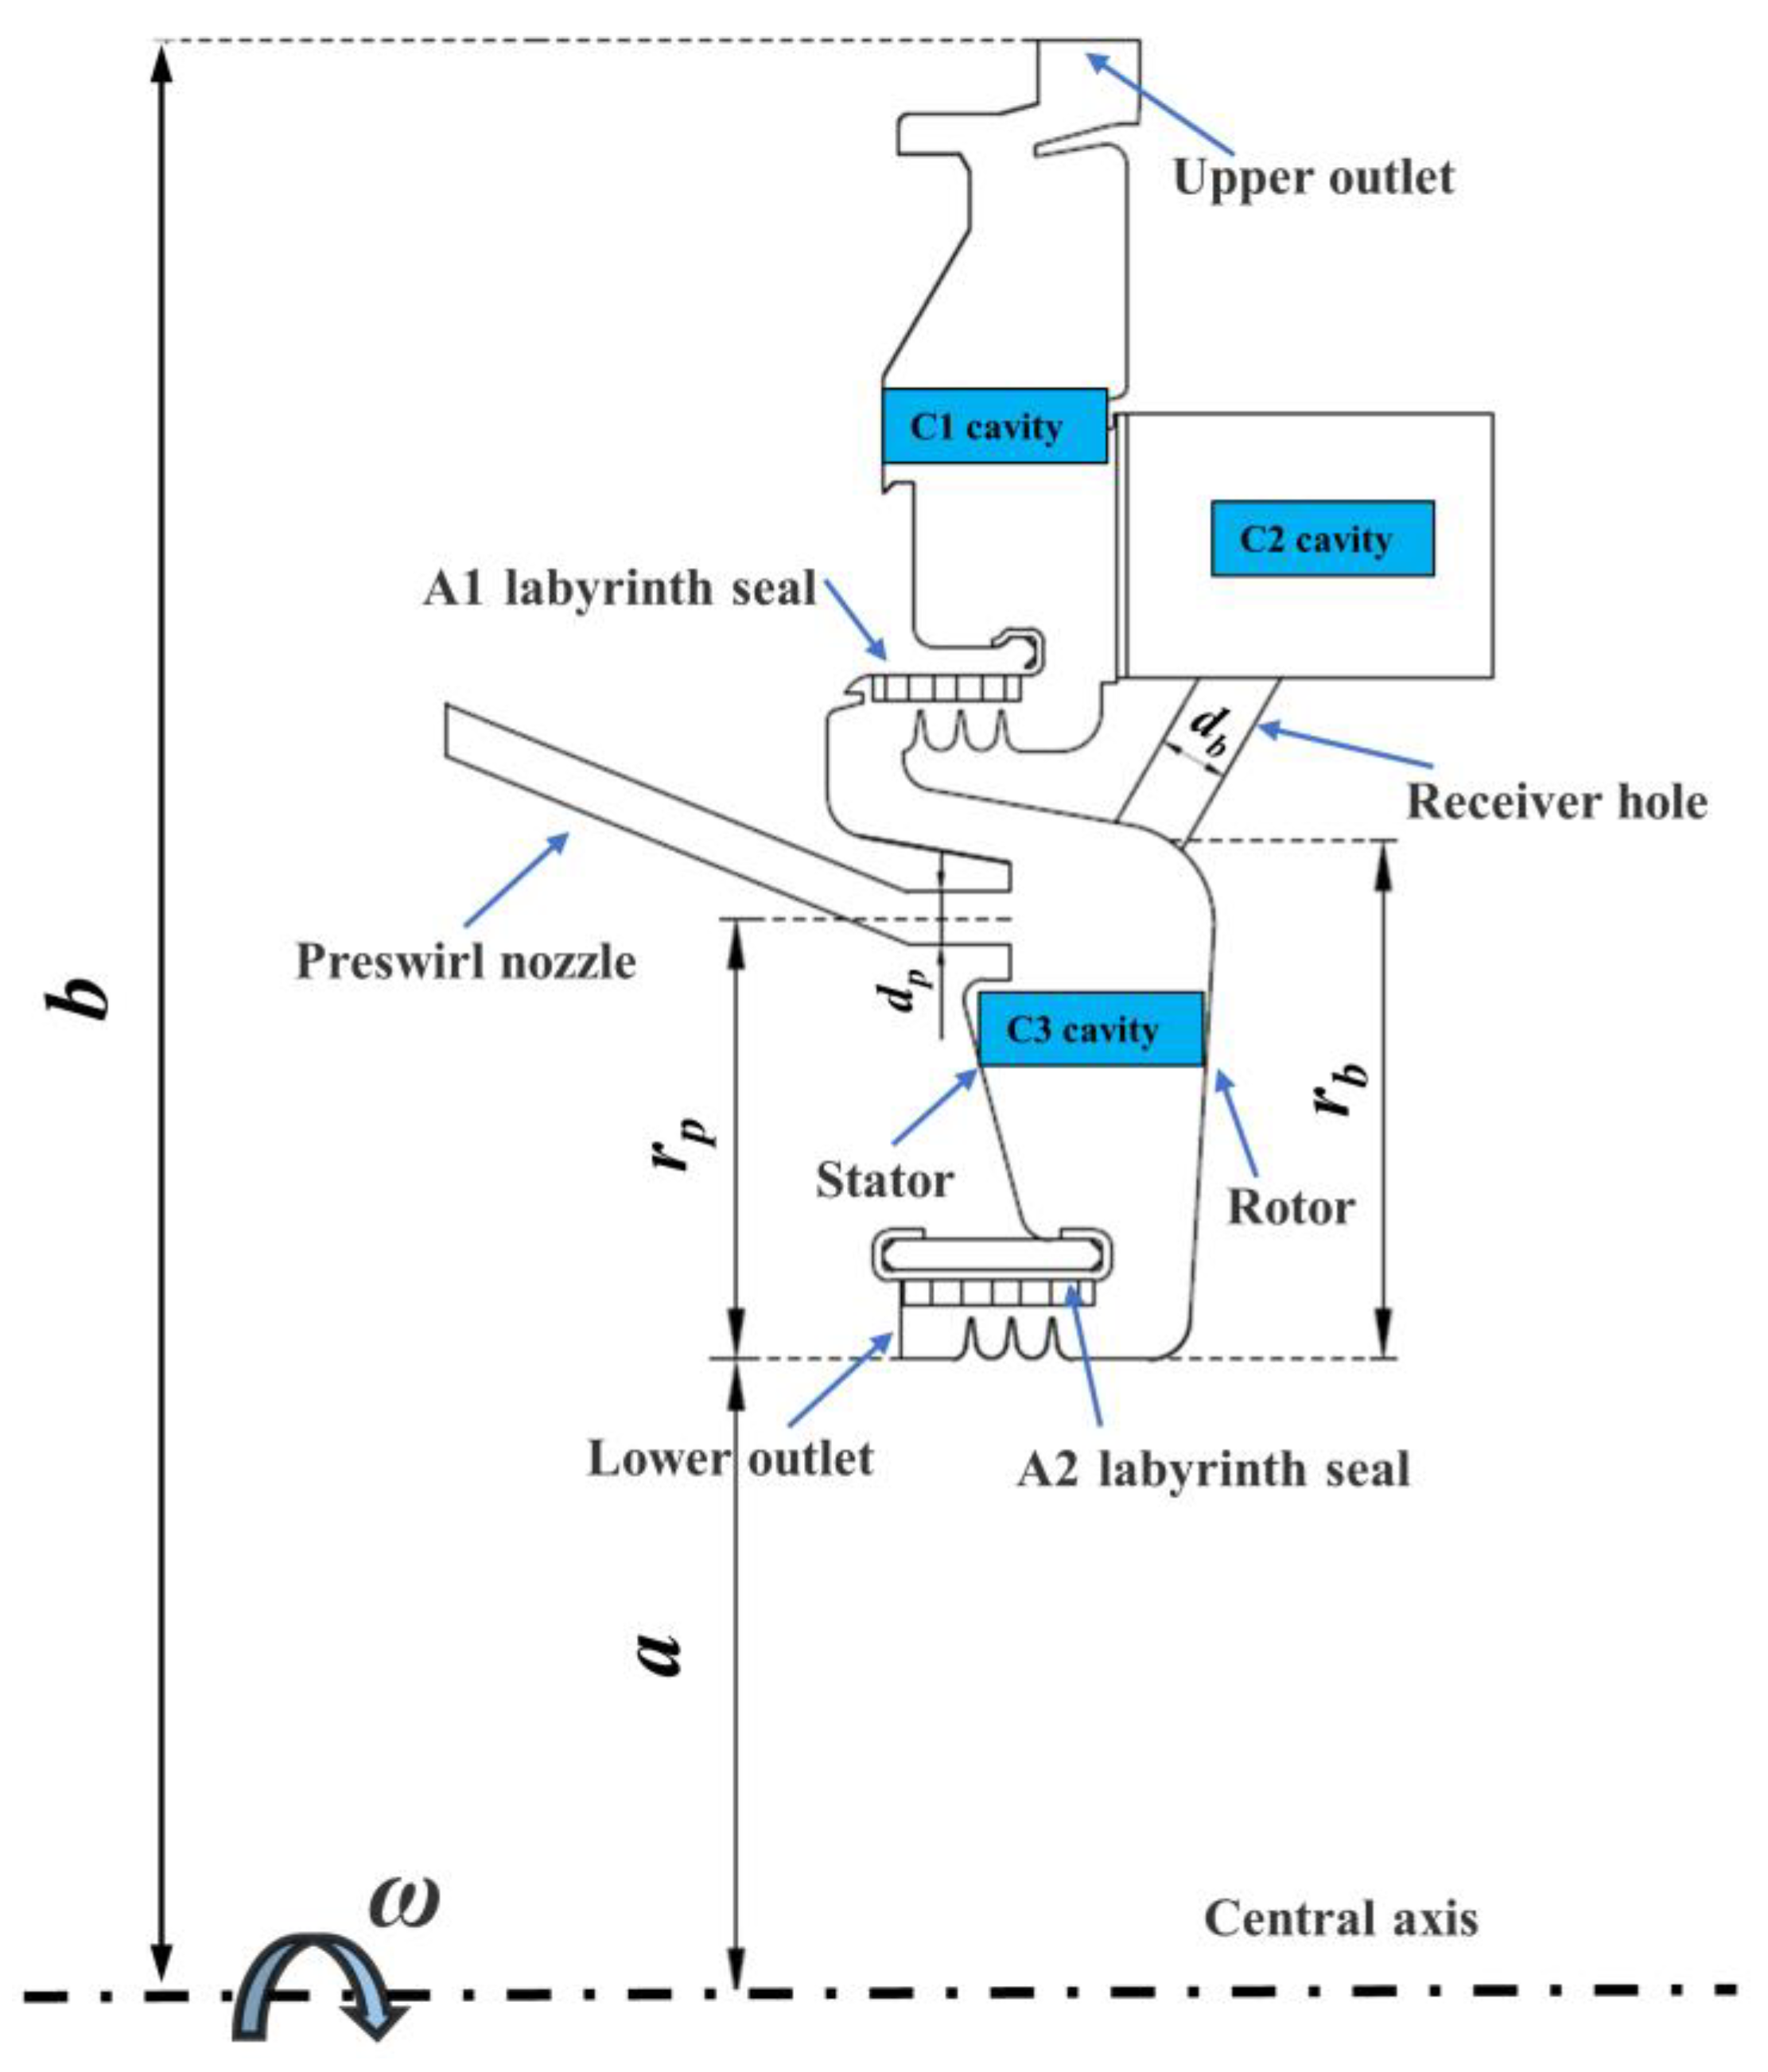
2. Definitions of Main Parameters

Global circumferential and local circumferential Reynolds number Re:
R e = ω b 2 ν
where b stands for the outer radius of the disk, ω is the angular velocity of the disk, and ν represents the kinematic viscosity.
Local circumferential and local circumferential Reynolds number Re:
R e φ = ω r 2 ν
where r is the radial coordinate.
Discharge coefficient of the receiving hole:
C d = m m i
where m is the actual mass flow rate and mi is the isentropic mass flow rate.
The ideal mass flow rate of a long orifice:
m i = A p o u t R T 1 * ( p o u t p i n * ) 1 / k 2 k k 1 R T 1 * [ 1 ( p o u t p i n * ) ( k 1 ) / k ] + 2 ( U 2 V 2 φ U 1 V 1 φ ) V 2 φ 2
where A is the nozzle outlet area, R is the air constant, and its value is 287. T1* is the inlet total temperature. k is the adiabatic exponent of gas, and its value is 1.4. pout is the static pressure at the outlet. V1φ is the circumferential velocity of the gas inlet. V2φ is the circumferential velocity of the gas outlet. U1 is the circumferential velocity of the disc inlet. U2 is the circumferential velocity of the disc outlet.
Local flow rate coefficient:
C q r = Q R e φ 0.2 2 π ω r 3
where Q is the volumetric through-flow rate.
Axial thrust coefficient:
C F = a b 2 π ( p b p ) r ρ ω 2 b 4 d r
where a is the hub radius, p represents the pressure, pb stands for the pressure at r = b, and ρ is the density of air.
Moment coefficient:
C M = 2 | M | ρ ω 2 b 5
where M is the friction torque.
Pressure coefficient:
C p = p * ( x = 1 ) p * ( x )   ;   x = r b   ;   p * = p ρ ω 2 b 2
where x is the non-dimensional radial coordinate and p* represents the non-dimensional pressure.
Non-dimensional temperature T * :
T * = T T m i n T m a x T m i n
where T is the temperature, Tmax is the maximum temperature in the cavity, Tmin is the minimum temperature in the cavity, cp is the isobaric-specific heat capacity, and its value is 1.039. Tout* is the relative total temperature at the outlet of receiving hole. Tin* is the total temperature at the inlet of the pre-swirl nozzle.
Non-dimensional temperature drop
T * = c p ( T i n * T o u t * ) 0.5 ( ω r b ) 2
where cp is the isobaric-specific heat capacity, and its value is 1.039. Tout* is the relative total temperature at the outlet of receiving hole. Tin* is the total temperature at the inlet of the pre-swirl nozzle.

3. Numerical Simulation Set-Ups

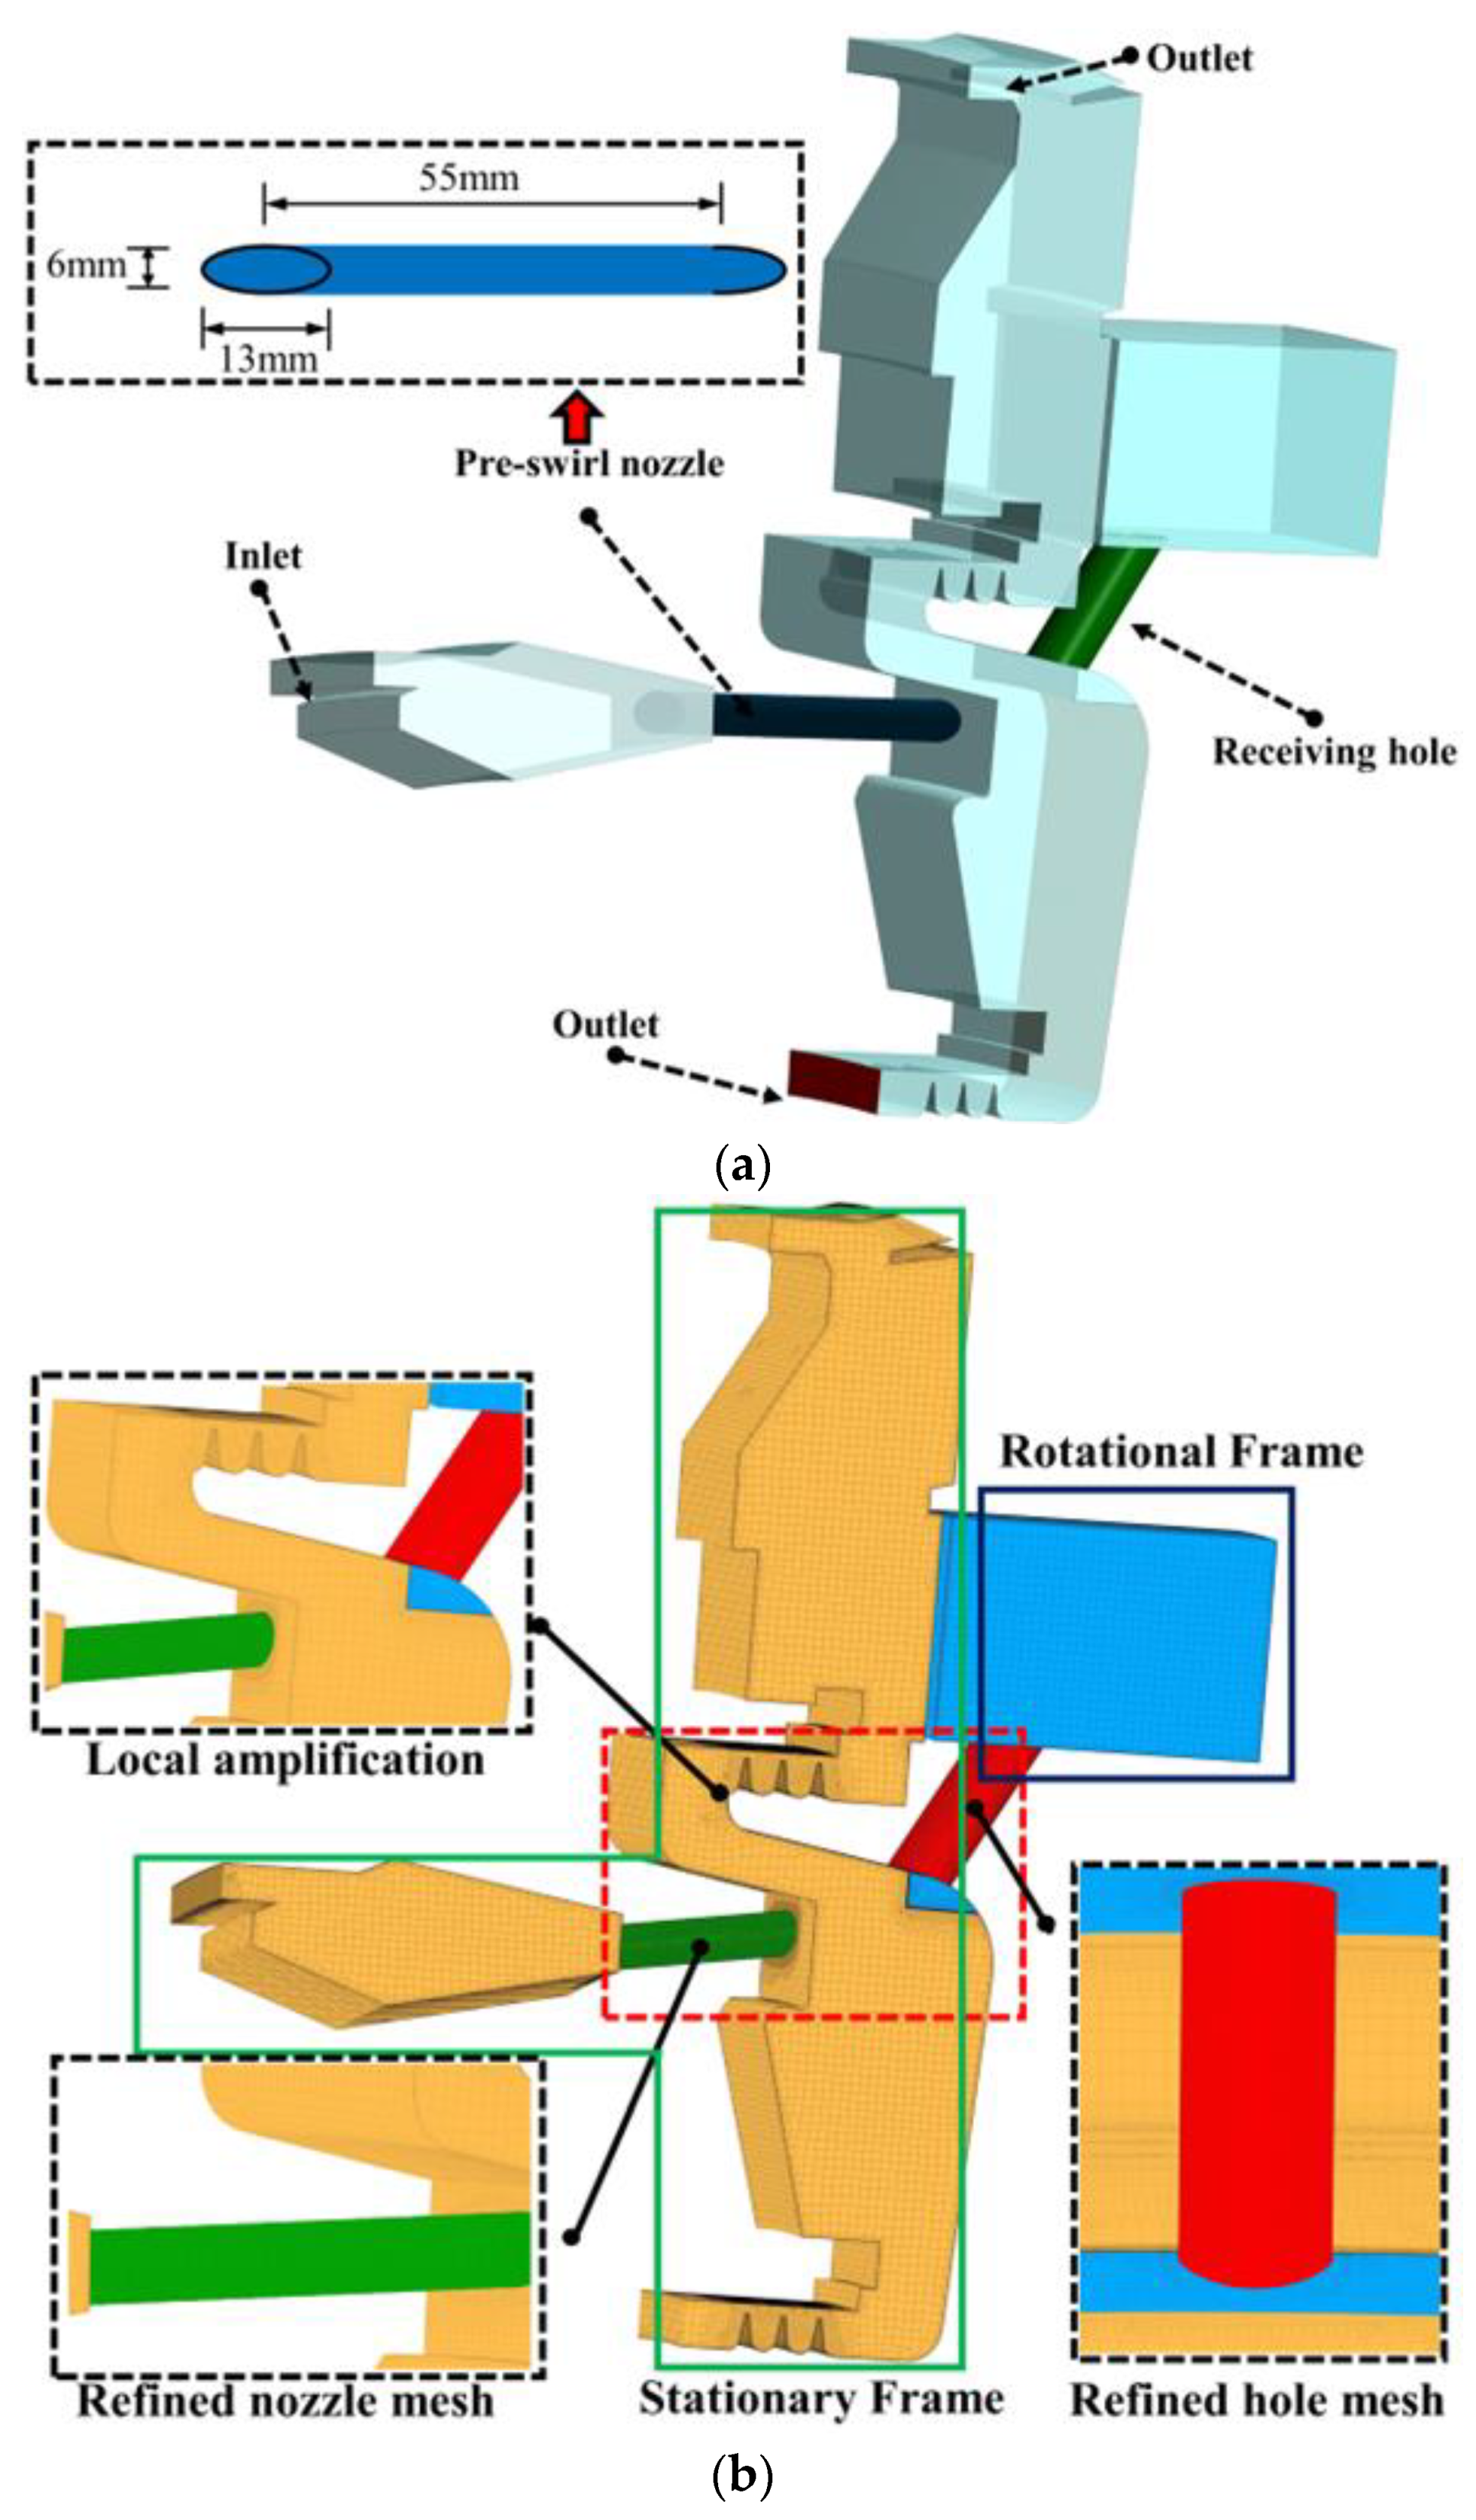
3.1. Domains for Numerical Simulation

The model in this study is shown in Figure 1. It includes three cavities, noted as C1 to C3 cavities. The C1 cavity is a typical rotor–stator cavity with centrifugal through-flow. The C2 cavity is a co-rotating cavity, which is a simplification of the flow path to the rotor blade. The C3 cavity is a pre-swirl cavity, which is the main research object. The main geometric parameters are shown in Table 1. The pre-swirl nozzle is on the stator, which is slightly below the receiving hole in the radial direction. The cooling air enters the C3 cavity in the form of pre-swirl jet flow and mixes with the gas in the disk cavity. Then, the essential flow enters the receiving hole, while the minor flow goes through the A1 labyrinth seal into the C1 cavity. It finally leaves the C1 and interacts with the hot main flow at the upper outlet.

3.2. Turbulence Model and Boundary Conditions

Because of the axial symmetry of the C3 cavity, a segment of 4 degrees was modeled, shown in Figure 2. The ANSYS CFX 14.0 was used for numerical simulation. The simulation type was set as a steady state. Some researchers, such as Barabas et al. [37] and the authors’ group [38,39], found that the simulation results from the shear stress transport SST k-ω turbulence model in combination with the scalable wall functions are in good agreement with the measured pressure in a rotor–stator cavity with air. The deviations of the pressure measurement are less than 1%. Hence, in this study, the same turbulence model and wall functions were used. The turbulent numeric was set as second-order upwind. The mesh was generated by NUMECA FINE OPEN, which is characterized by unstructured mesh dominated by hexahedrons. The thickness of the grids in the near wall regions decreases until the values of y+ are less than 1, which satisfies the requirement from the SST k-ω turbulence model. The walls in contact with air were set as non-slip walls. The pressure and temperature at each branch and the temperature of the stator were set according to the values from the designers. The heat transfer coefficient of the rotor and the labyrinth seal was set according to the values from conjugate heat transfer. The flow was selected as air ideal gas, and the physical properties, such as specific heat, were from the database. The convergence criteria were set as 10−5 in max type. We conducted 40 simulations with different relative total pressure p i n ,   t o t a l (made non-dimensional by dividing those at the design value for each speed of rotation) at the nozzle inlet and speed of rotation, shown in Table 2. The “−30% design pressure” is equal to p i n ,   t o t a l = 0.7 , while “+40% design pressure” is equal to p i n ,   t o t a l = 1.4 .

3.3. Numerical Method Validation

In this paper, we measured the static pressure in the disk cavity of a marine gas turbine at four speeds of rotation, which are close to those in Table 2. The speed of rotation was modified to the same value during the validation of the numerical method. The mesh was modified until the maximum difference between simulation results and experimental data was less than 4.3%. The total grid count was 28.23 million. Hence, the numerical simulation setups are considered reasonable.

4. Results and Discussion

4.1. Flow Characteristics

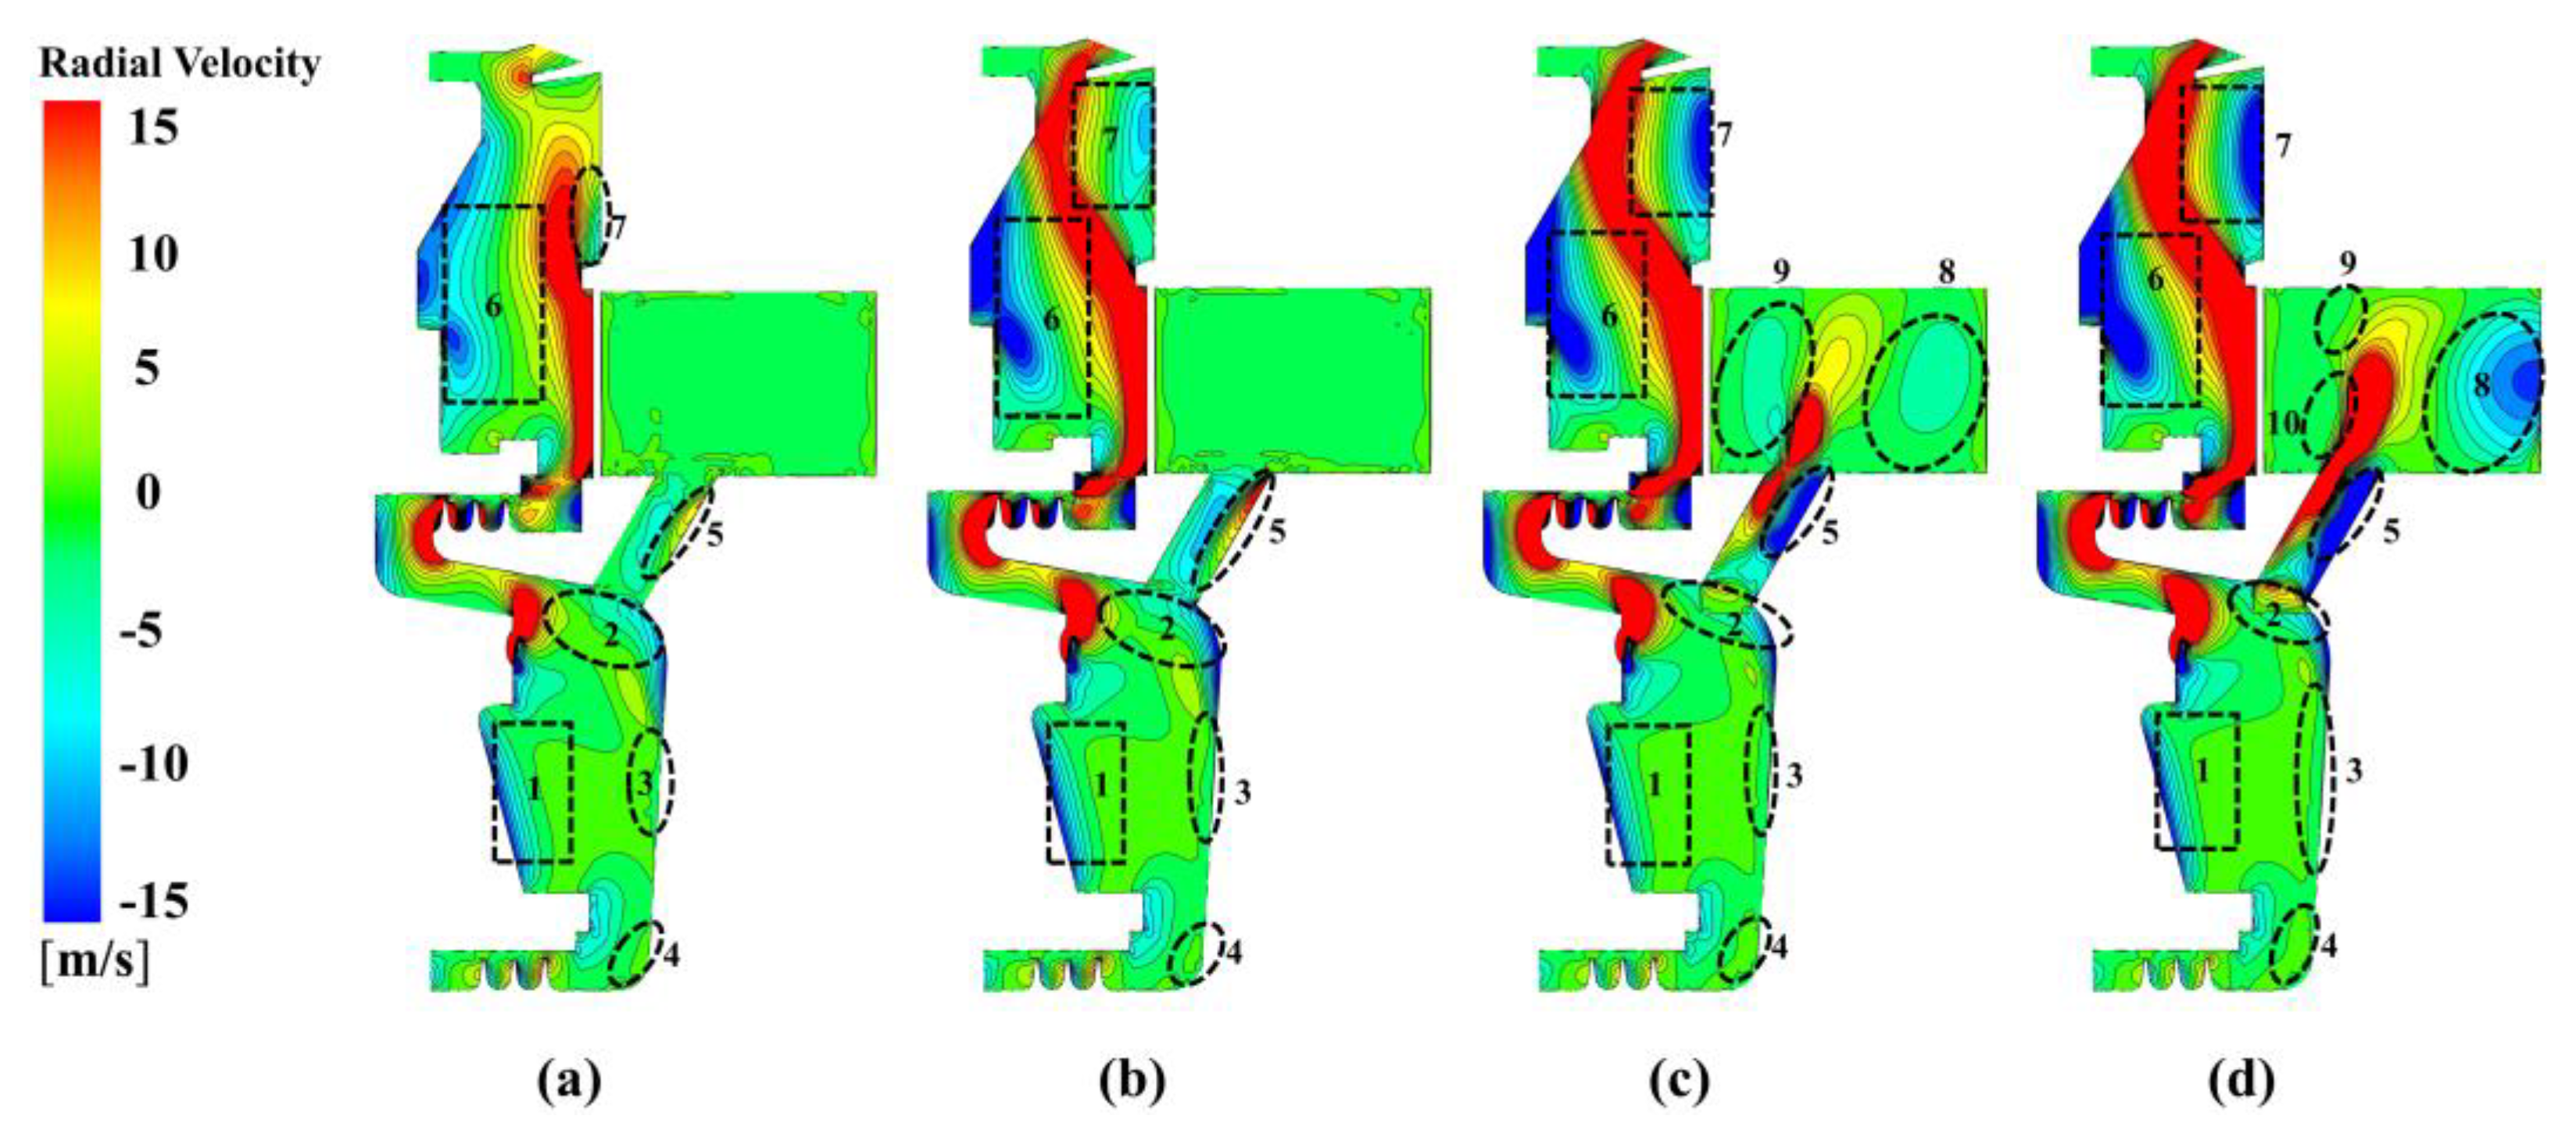
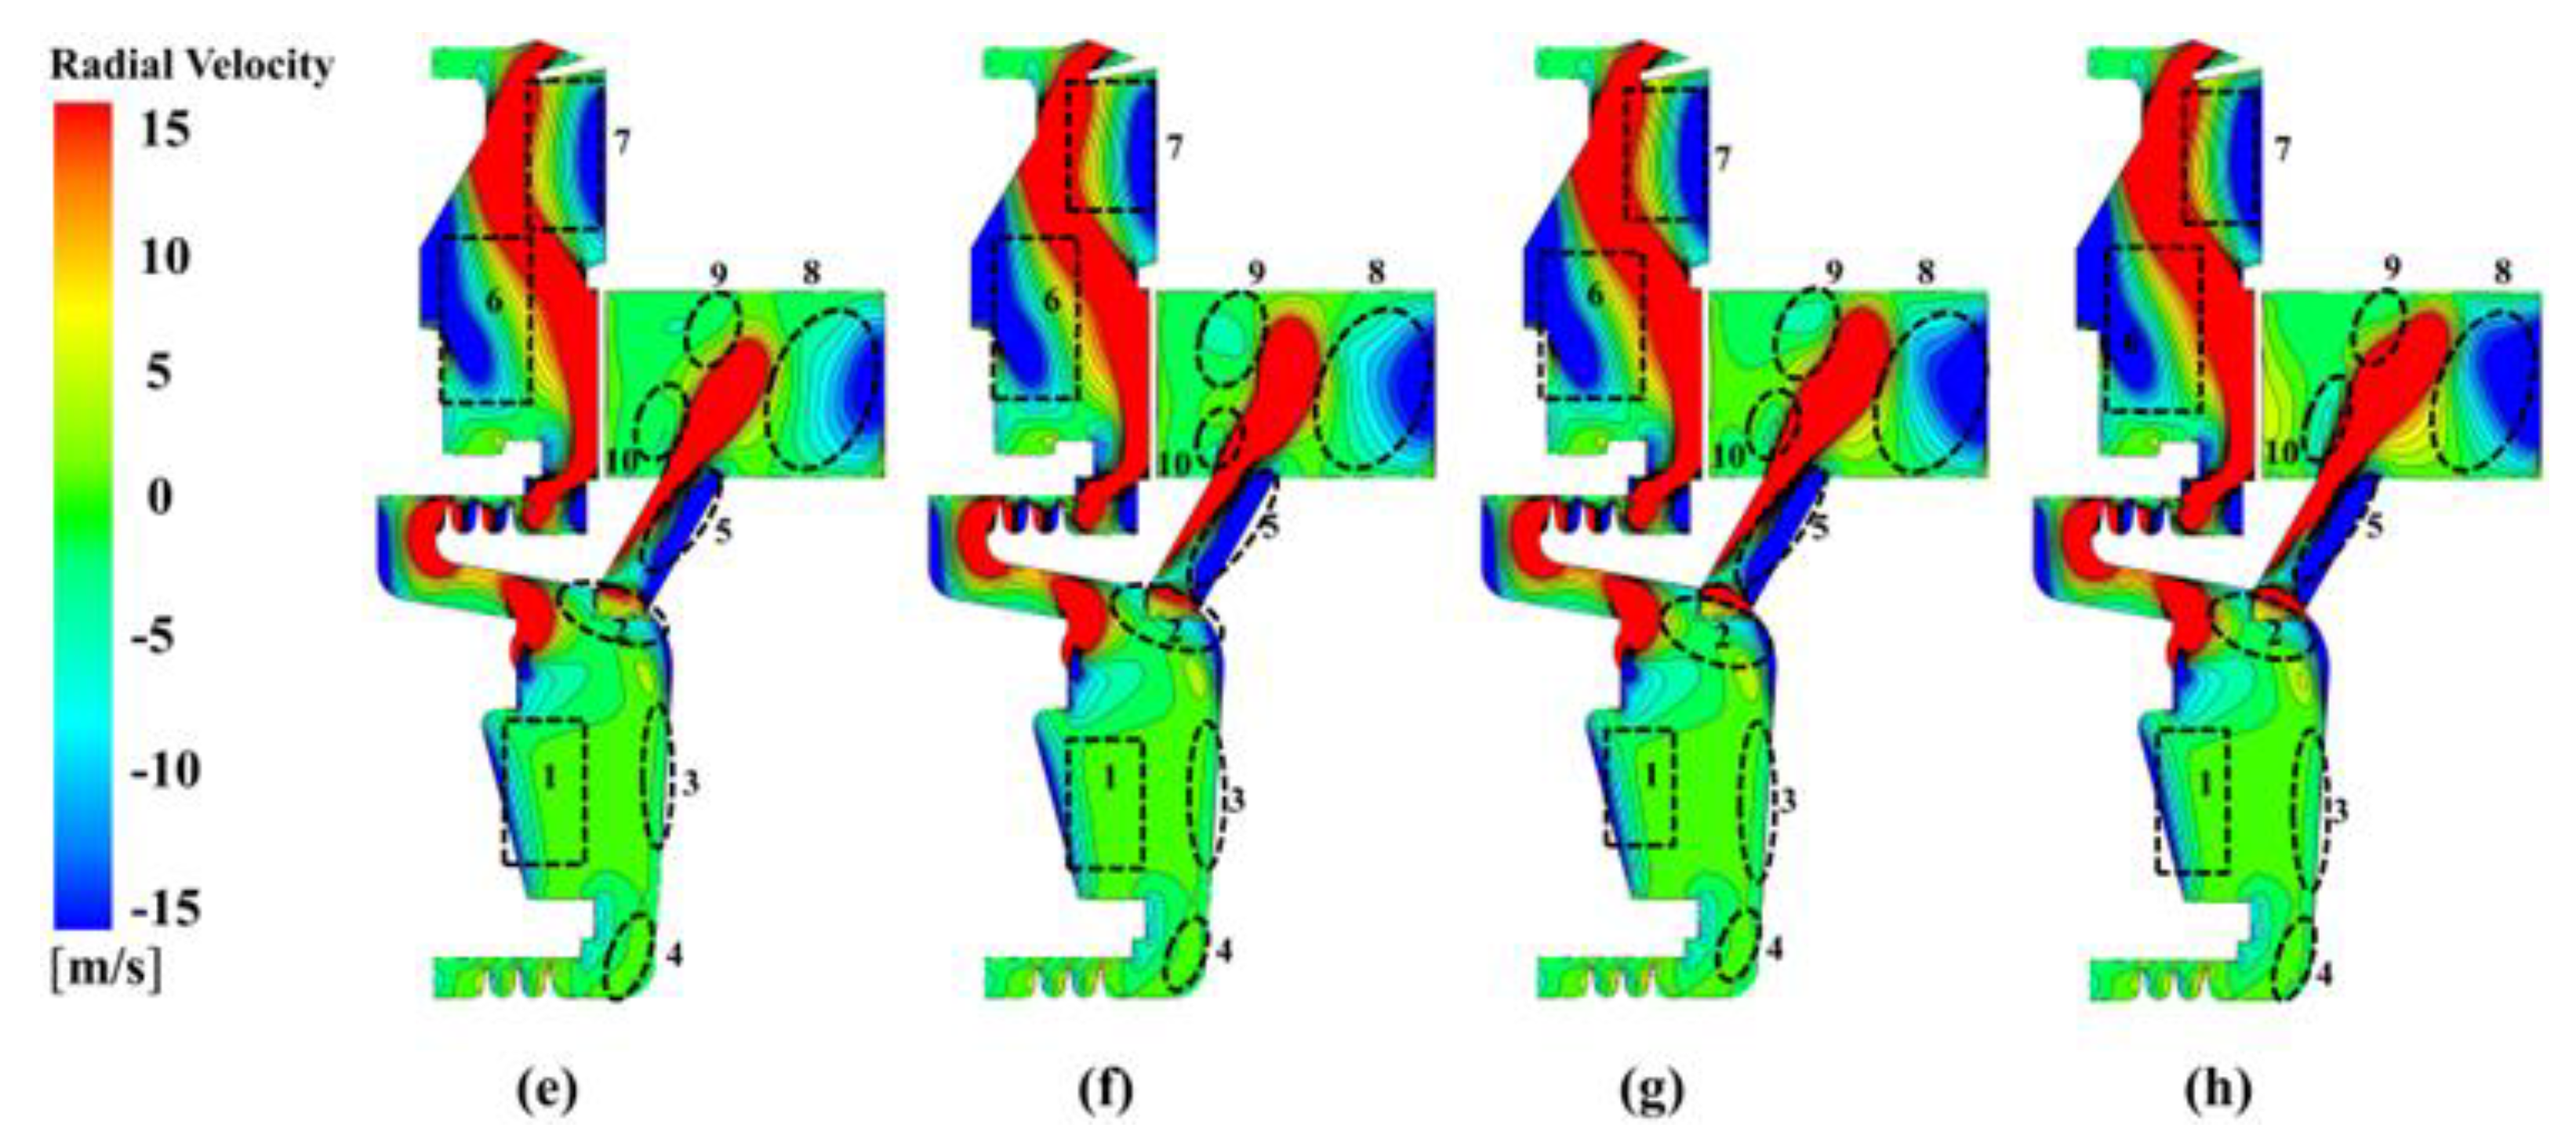
4.1.1. Radial Velocity Distribution

The radial velocity is important in finding the circulation of air in a rotor–stator cavity. With different nozzle inlet pressures at Re = 9.5172 × 10⁵, the distribution of radial velocity on the meridional section is shown in Figure 3. In the C3 cavity, the flow in region 1 and region 4 (near the rotor) mainly moves radial outward. On the other hand, it flows toward the shaft below the nozzle in region 3. At the entrance of receiving hole, there is a vortex (see the region with different flow directions in region 2). In the receiving hole, we can see that there is a backflow area (region 5). Its scope enlarges with increasing p i n ,   t o t a l at p i n ,   t o t a l 0.9 . The results indicate that the flow resistance is large in such a region. In the C1 cavity, there are two backflow areas, namely region 6 and region 7. The backflow in region 6 is a typical flow distribution near the stator, while the backflow in region 7 is related to the change of rotor shape and the existence of a rim seal. In the C2 cavity, there is a backflow area (region 8), although the C2 cavity is co-rotating. This is attributed to the formation of a vortex in this region due to the strong jet flow. The distributions of radial pressure are similar for other speeds of rotation. The results show that the pre-swirl nozzle and receiving hole do not match well. Some modifications have to be made to improve performance at low rotation speeds.

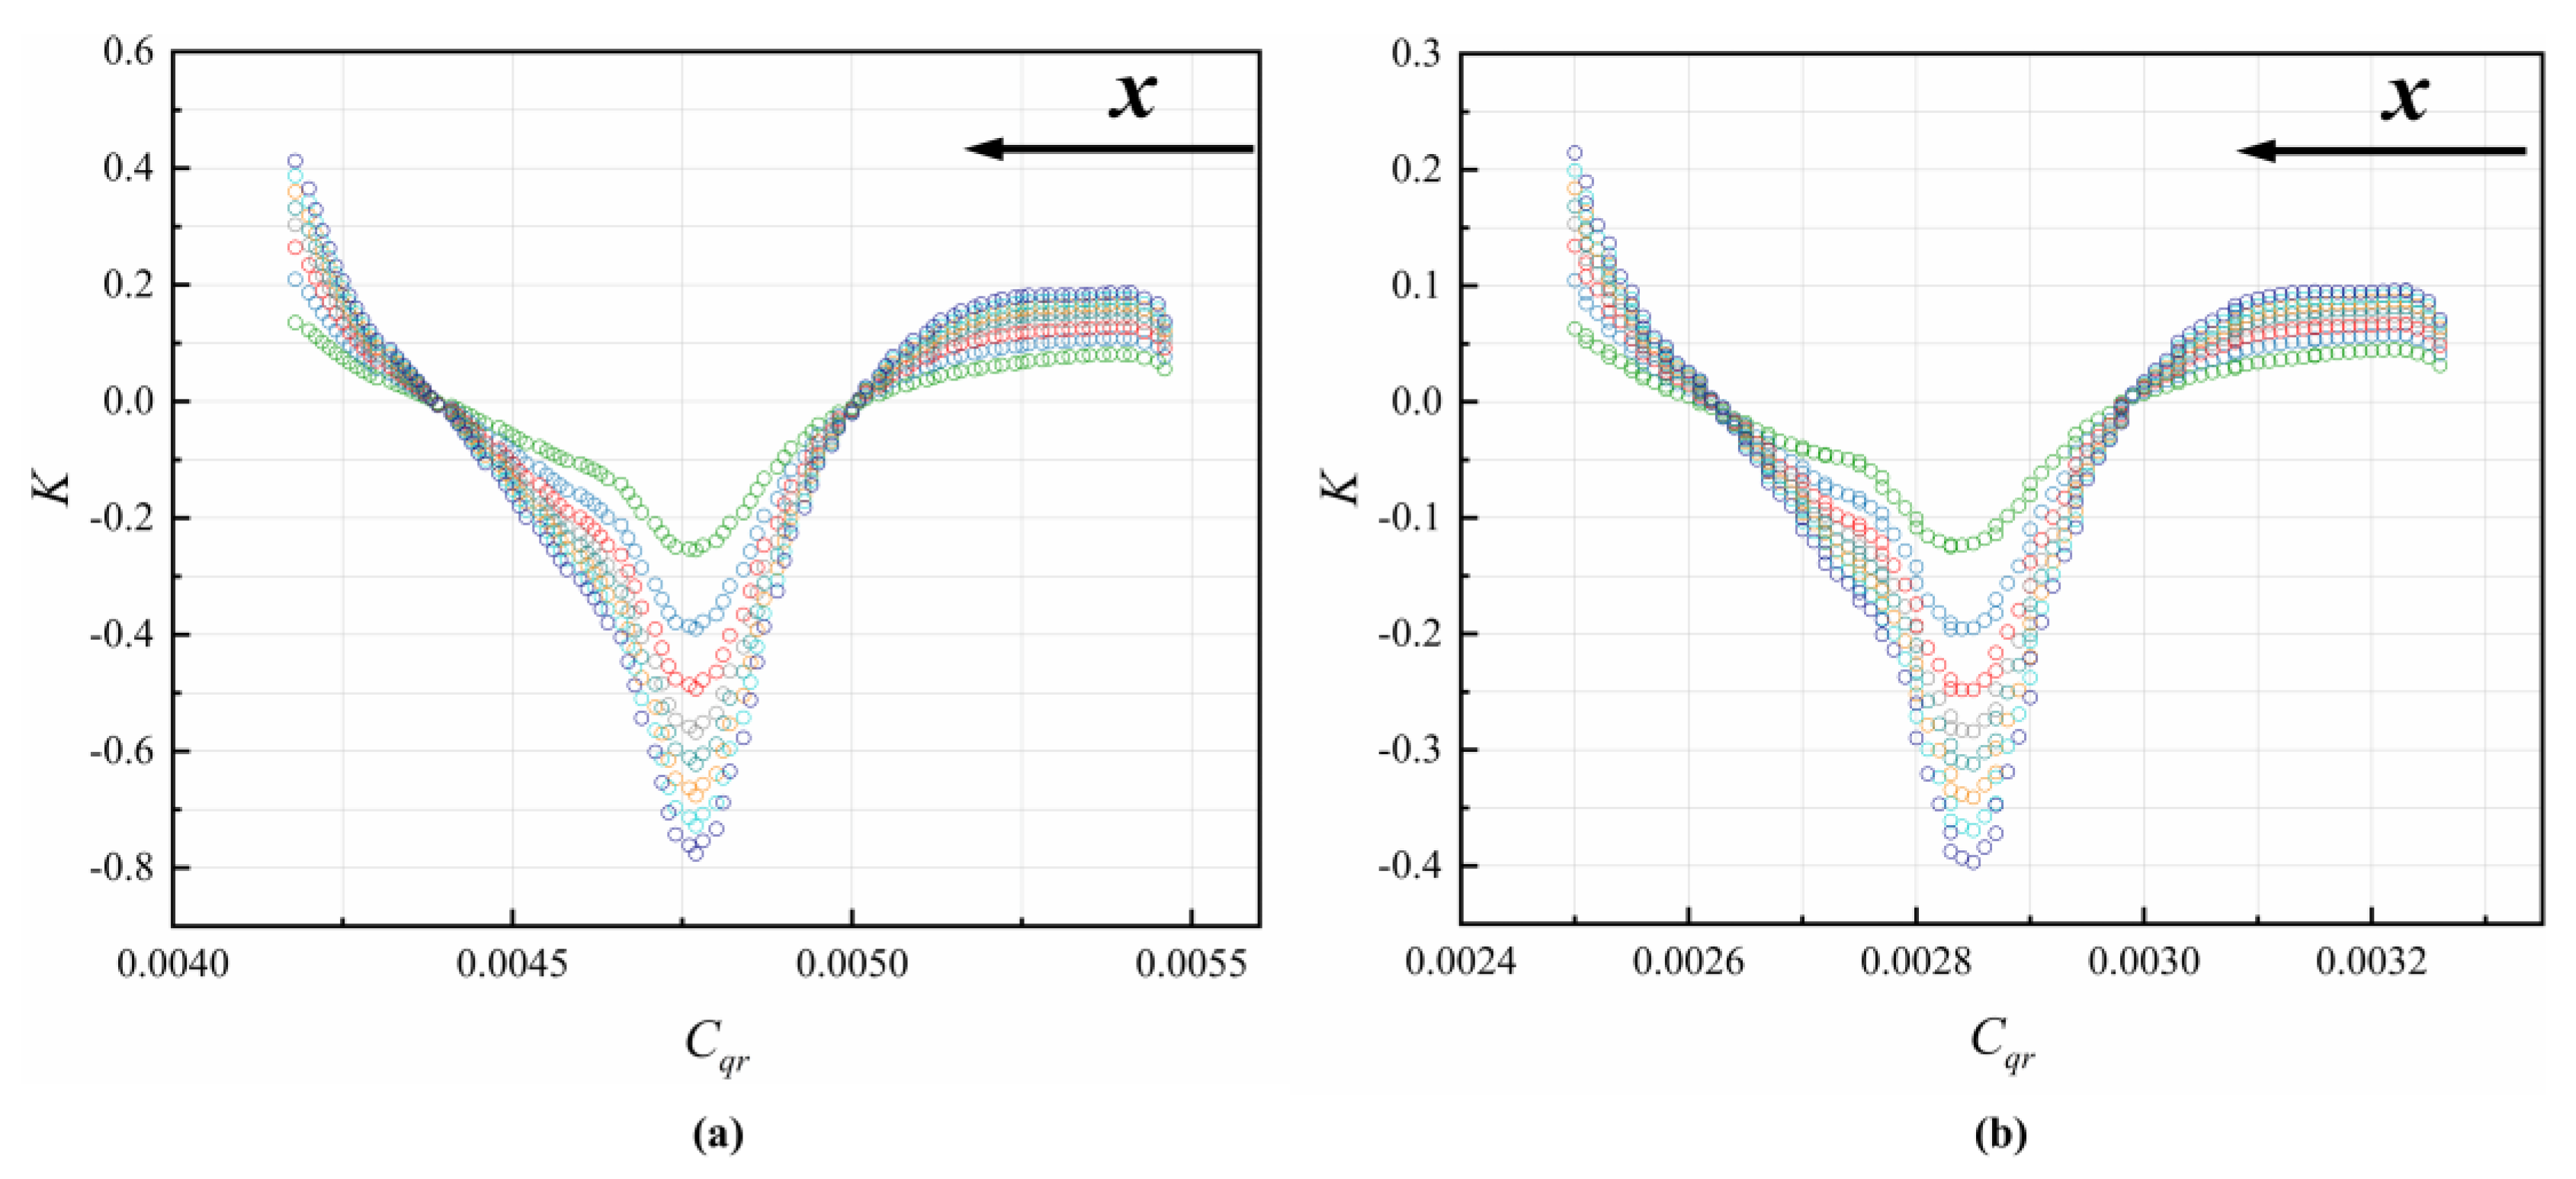
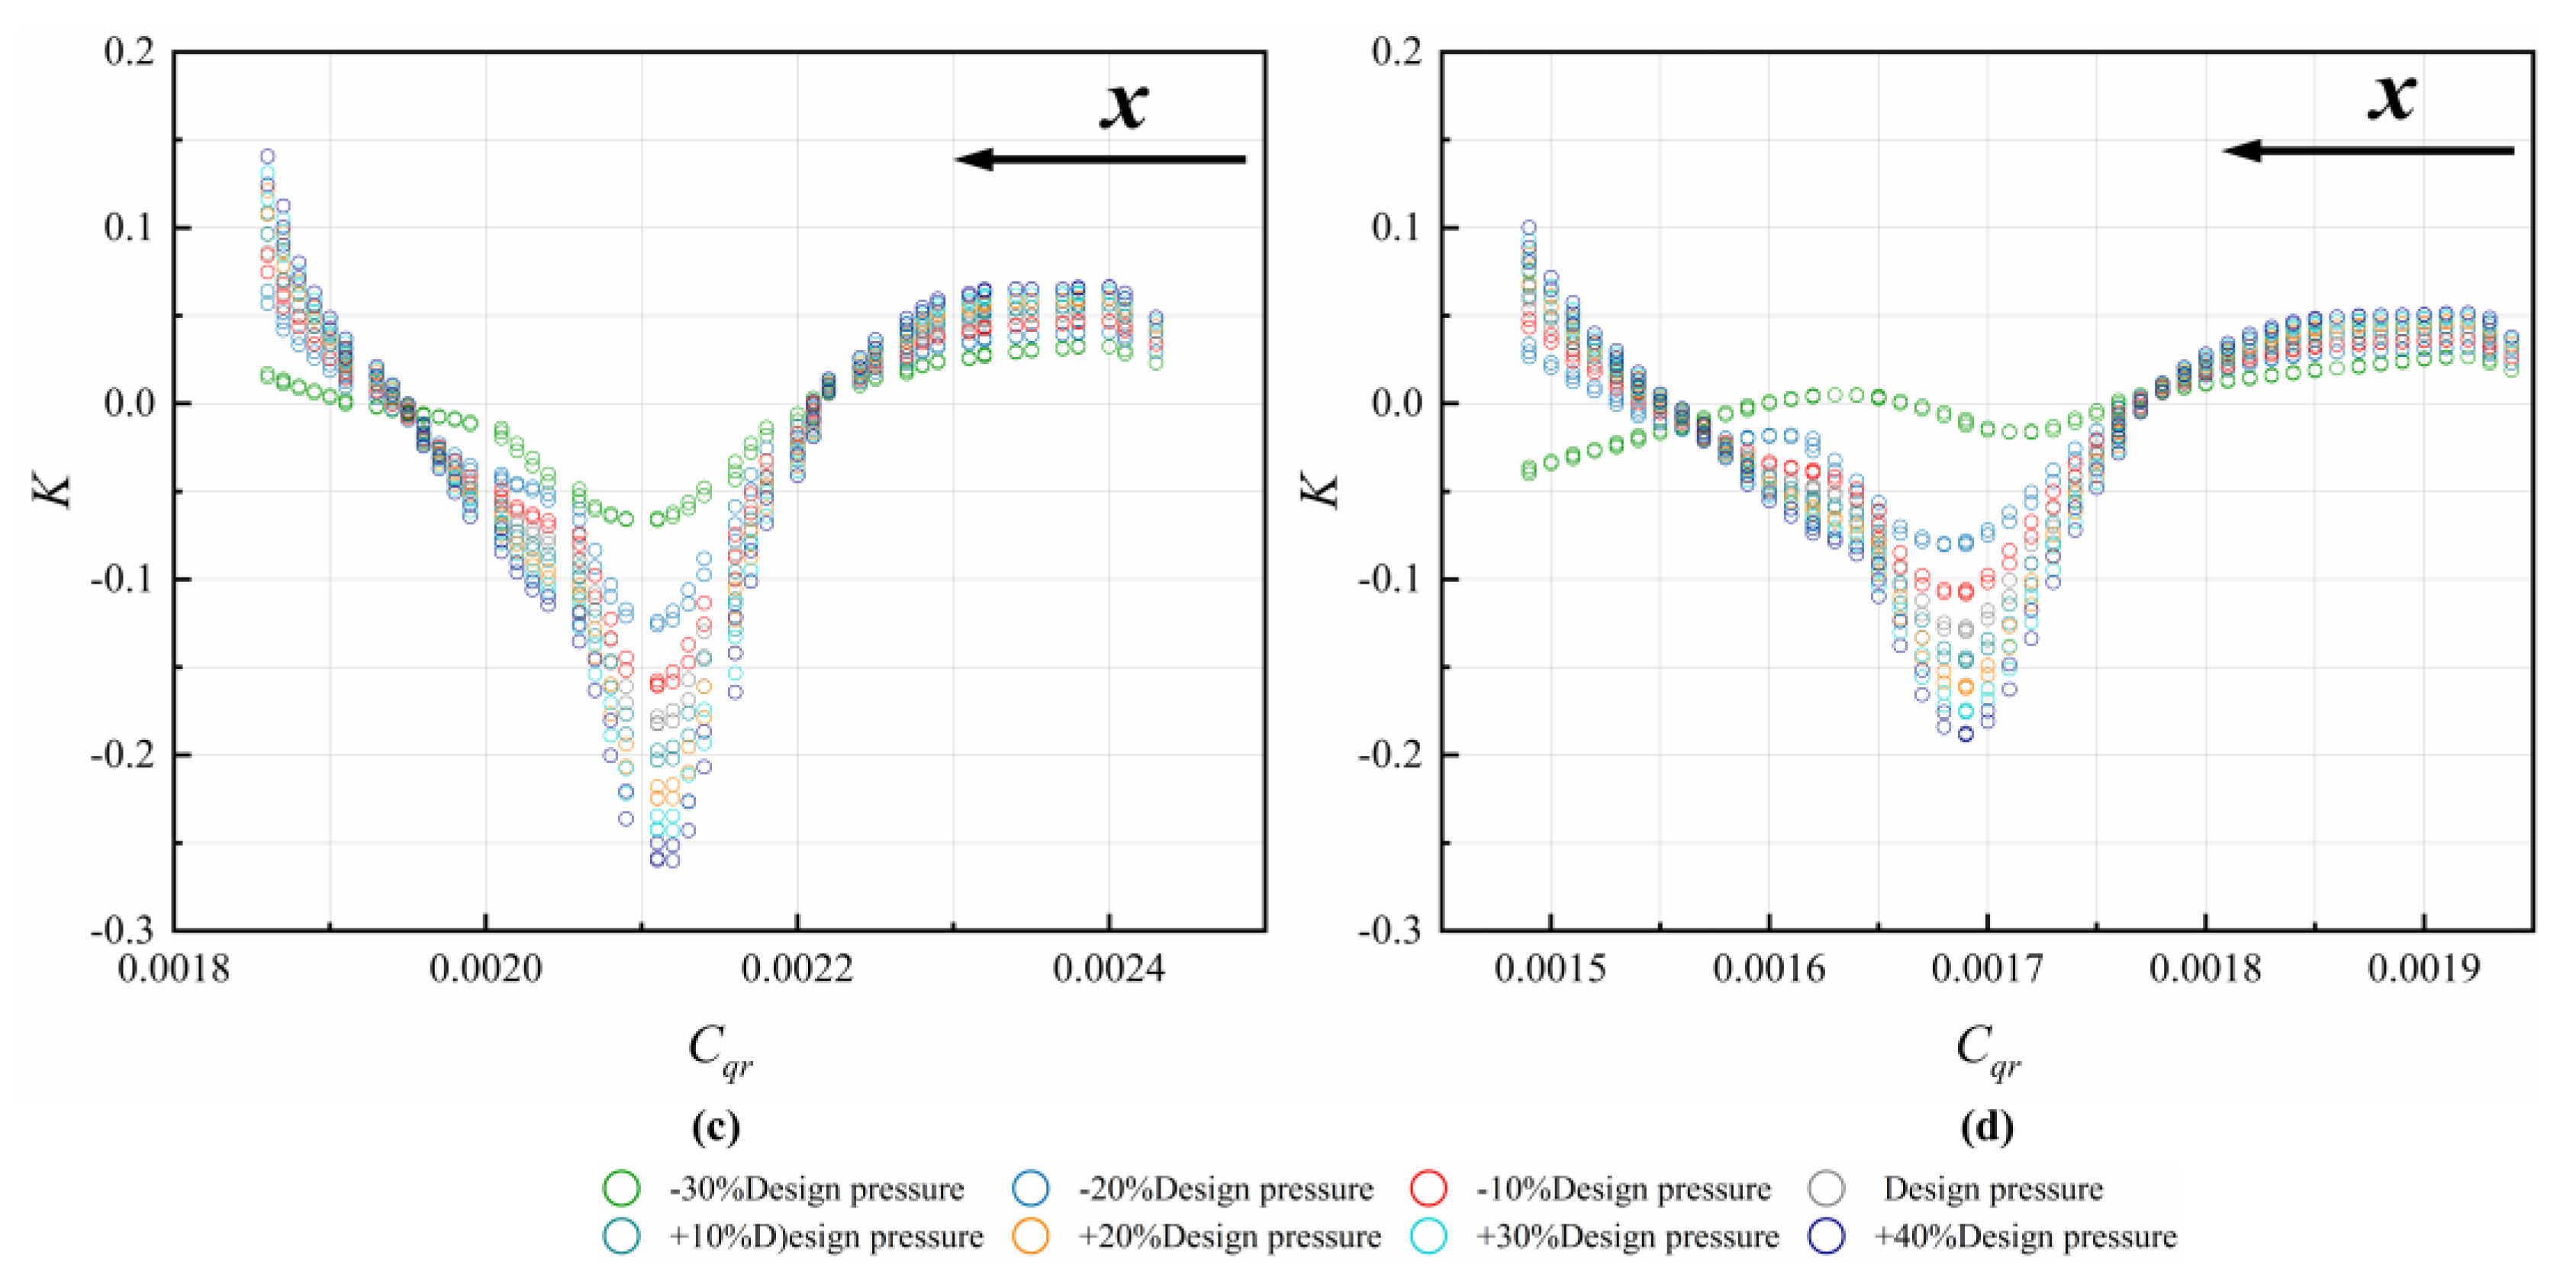
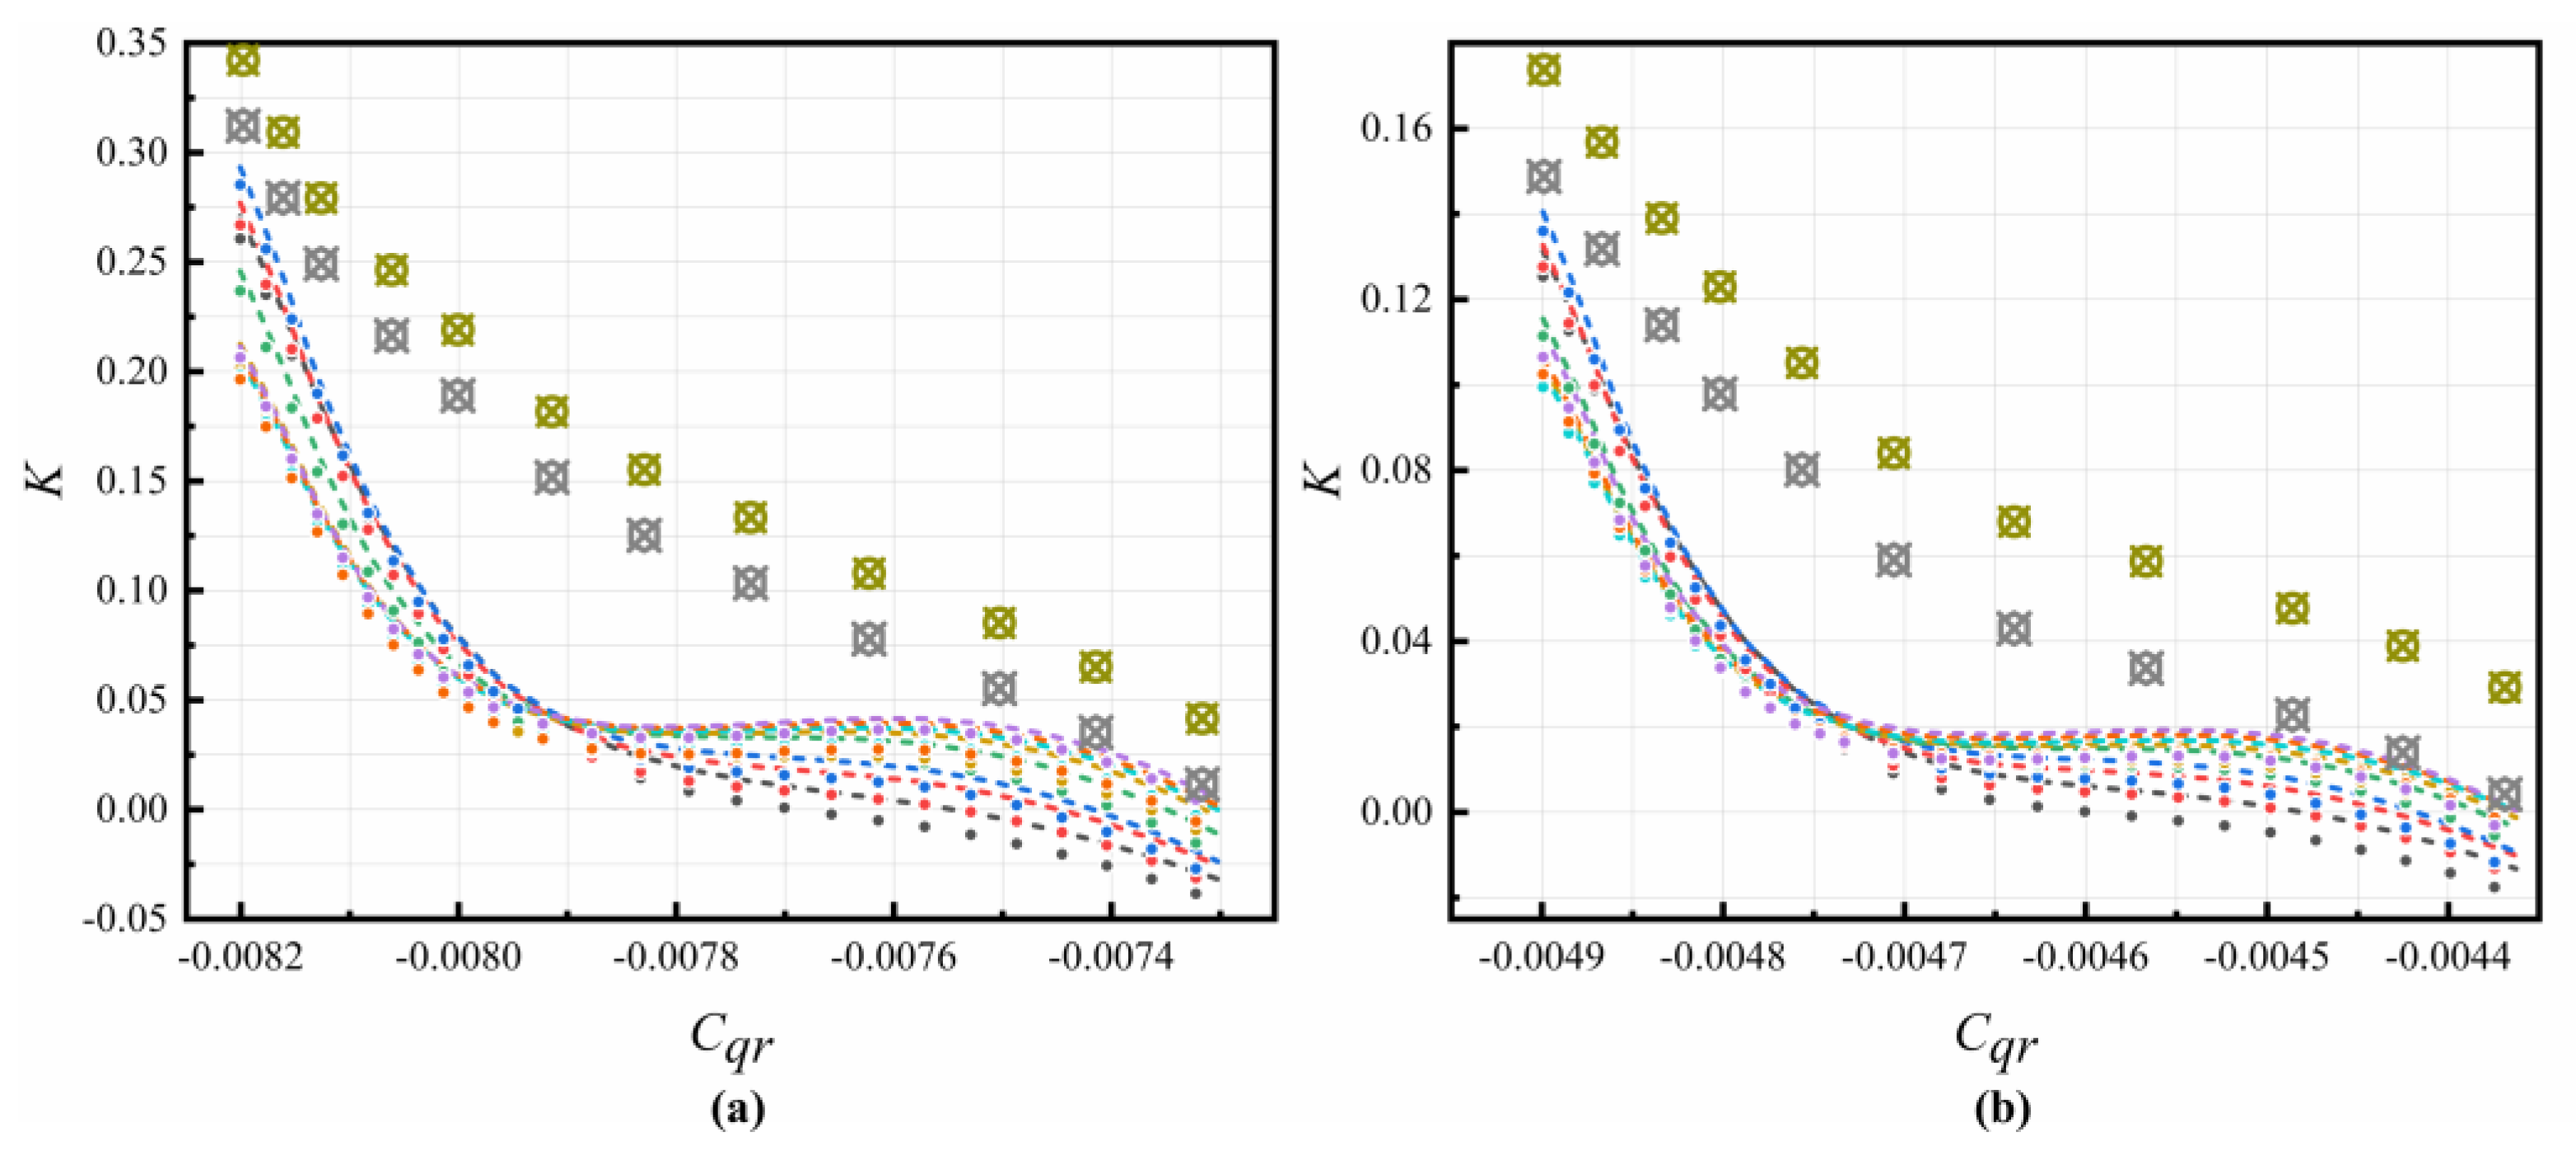
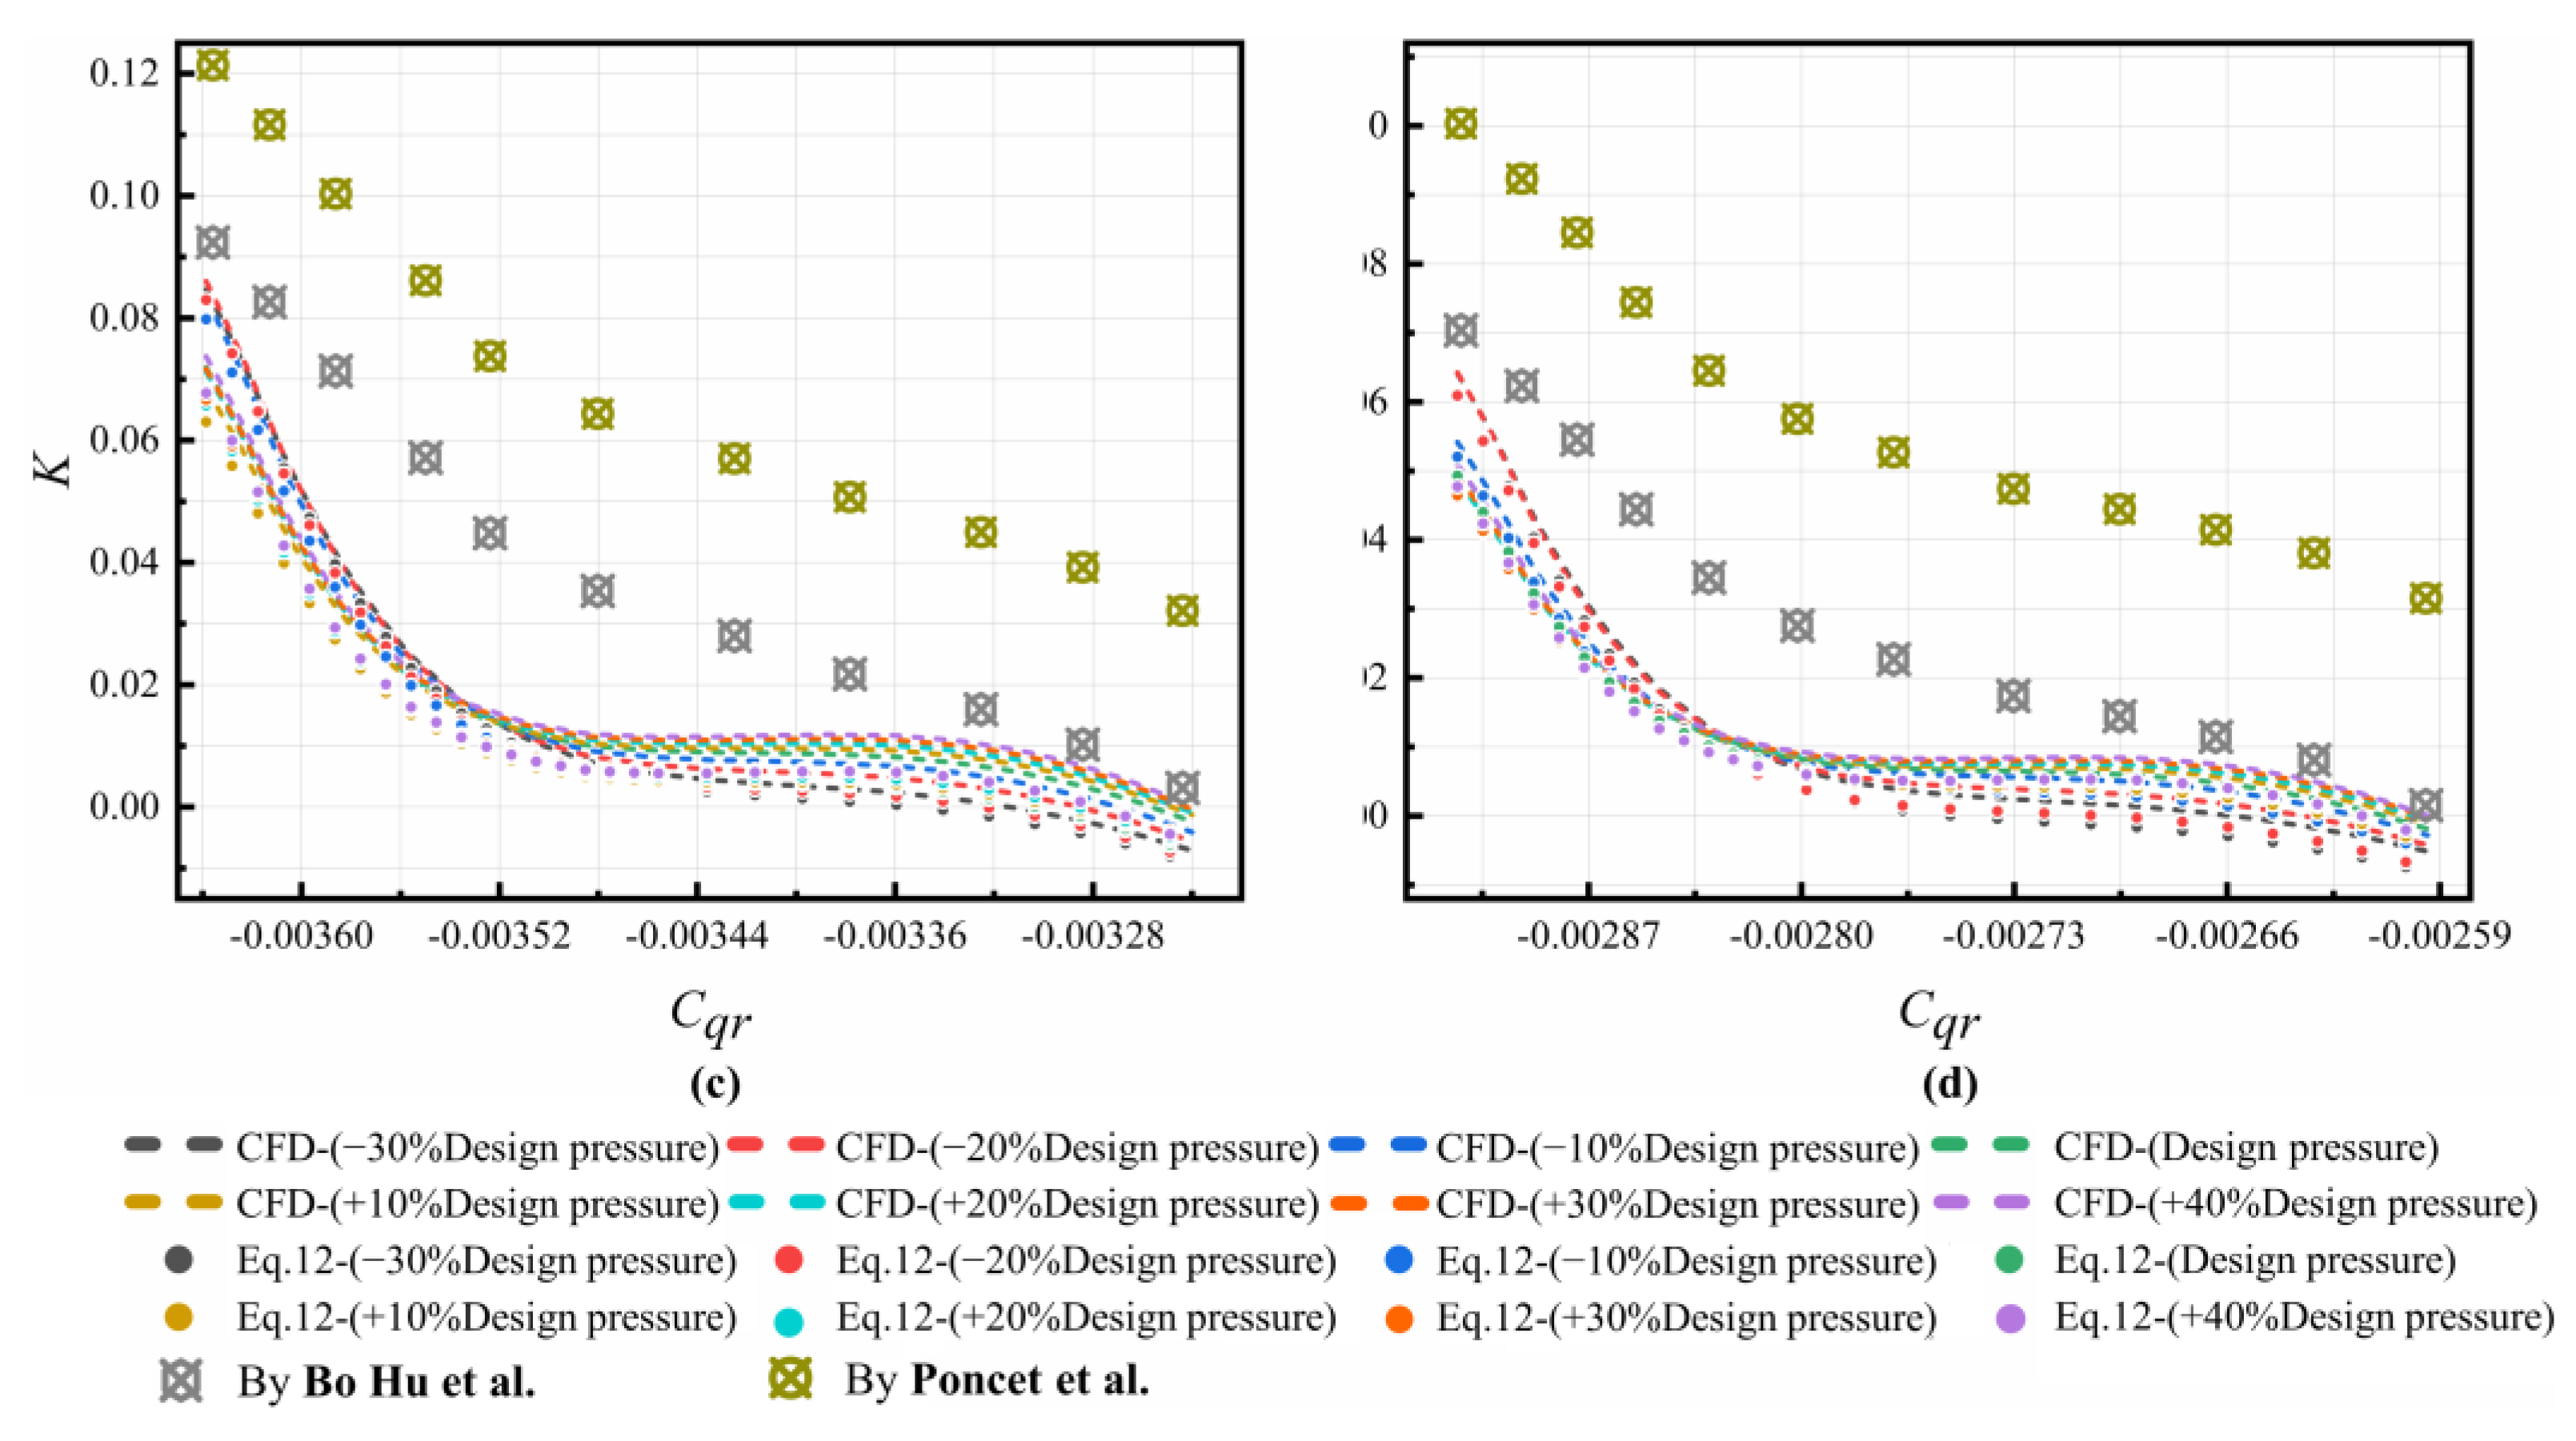
4.1.2. Core Swirl Ratio K

In order to predict the axial thrust, the pressure distribution along the radius of the disk should be estimated. In a typical rotor–stator cavity, the flow pattern changes as Cqr increases with either centrifugal or centripetal non-pre-swirl through-flow. The relationship between K and Cqr for different Re in the C1 cavity of this paper is shown in Figure 4. The values of K firstly decrease, then increase with increasing Cqr. The decreasing trend happens in the backflow area (mainly region 6 in Figure 3). With increasing p i n ,   t o t a l , the values of K in this area become small. The reason for this is that the leakage flow rate is larger with larger values of p i n ,   t o t a l . The work performed by the rotor on the volumetric flow drops. When x further increases, the values of K start to increase in most cases, except for cases where hot gas is ingested (see the radial velocity at the outer radius in Figure 3a) from the main flow passage through the rim seal.
The distribution of K in the C3 cavity is shown in Figure 5. Above the receiving hole, the results fit relatively well with Equation (11). Below the pre-swirl nozzle, a relatively large difference occurs. Therefore, we determined a leakage flow term ( 44.44 e 6.479 C q r   +   47.3 ) and extended the correlation in Ref. [40], which can be written in Equation (12). The results are compared in Figure 4. As Cqr increases, the values of K firstly significantly drop and almost remain the same. When Cqr further increases, the values of K gradually drop. The results from Equation (12) are in good agreement with those from numerical simulation with different p i n ,   t o t a l and different Re, compared with those in Refs. [38,39,40,41].
K = ( r p r i ) 2 K p + M r + M s m r i V φ , r = r i
K = ( r p r i ) 2 K p + M r + M s m r i V φ , r = r i + ( 44.44 e 6.479 C q r   +   47.3 )
where 2.3793 × 10⁵Re ≤ 9.5172 × 10⁵, 1.9191 MPa ≤ total inlet pressure ≤ 3.8381 MPa and G = 0.044.

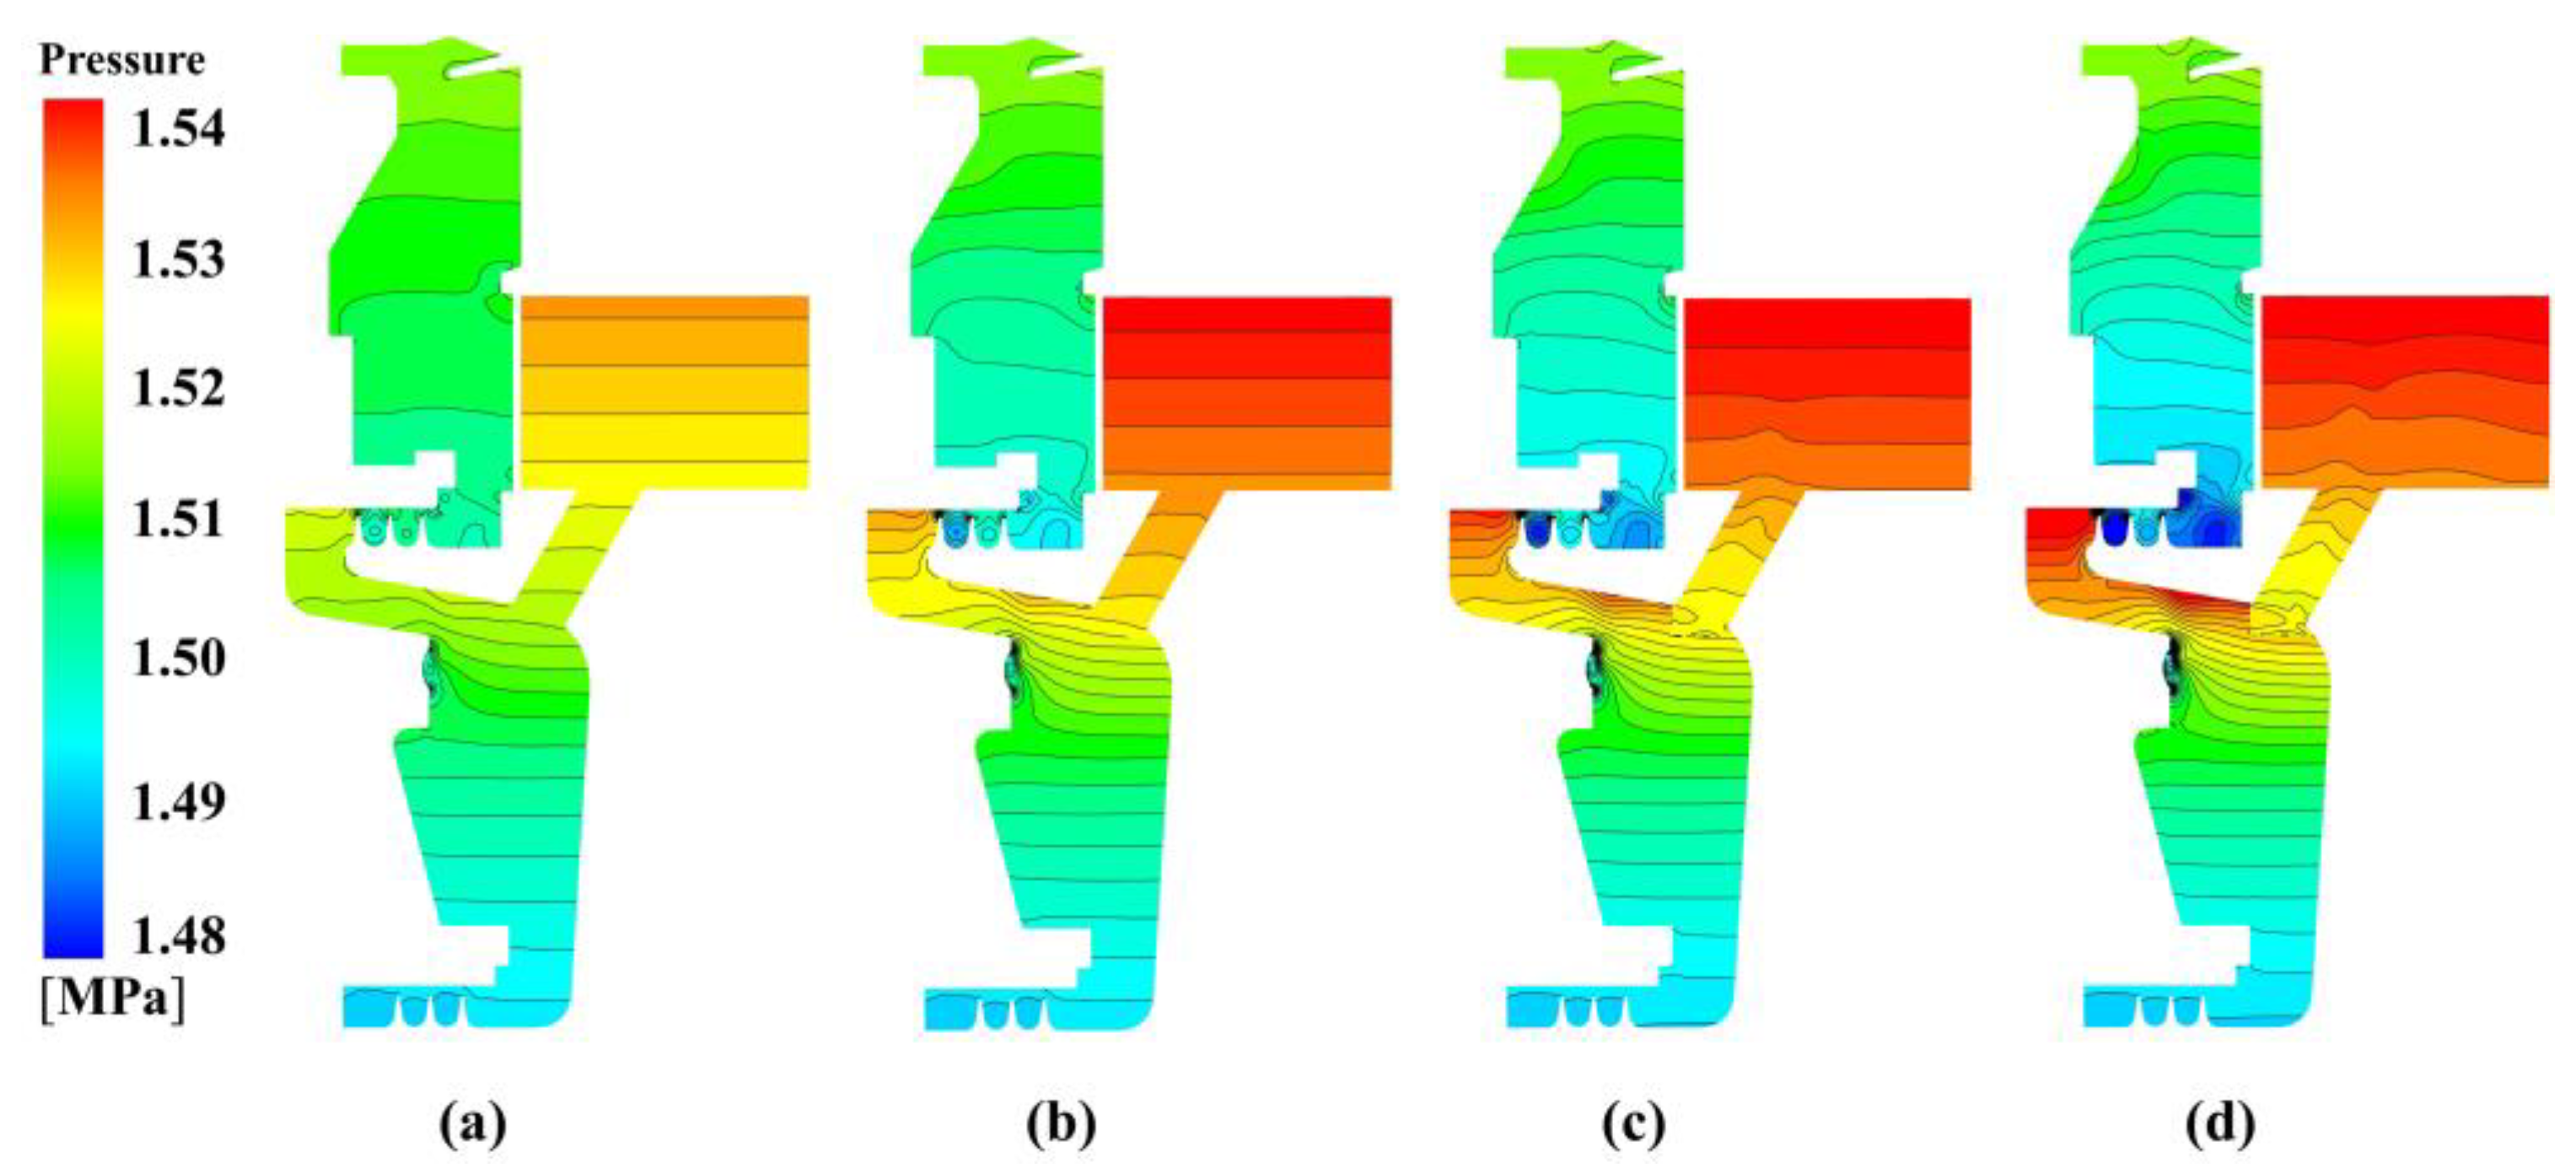
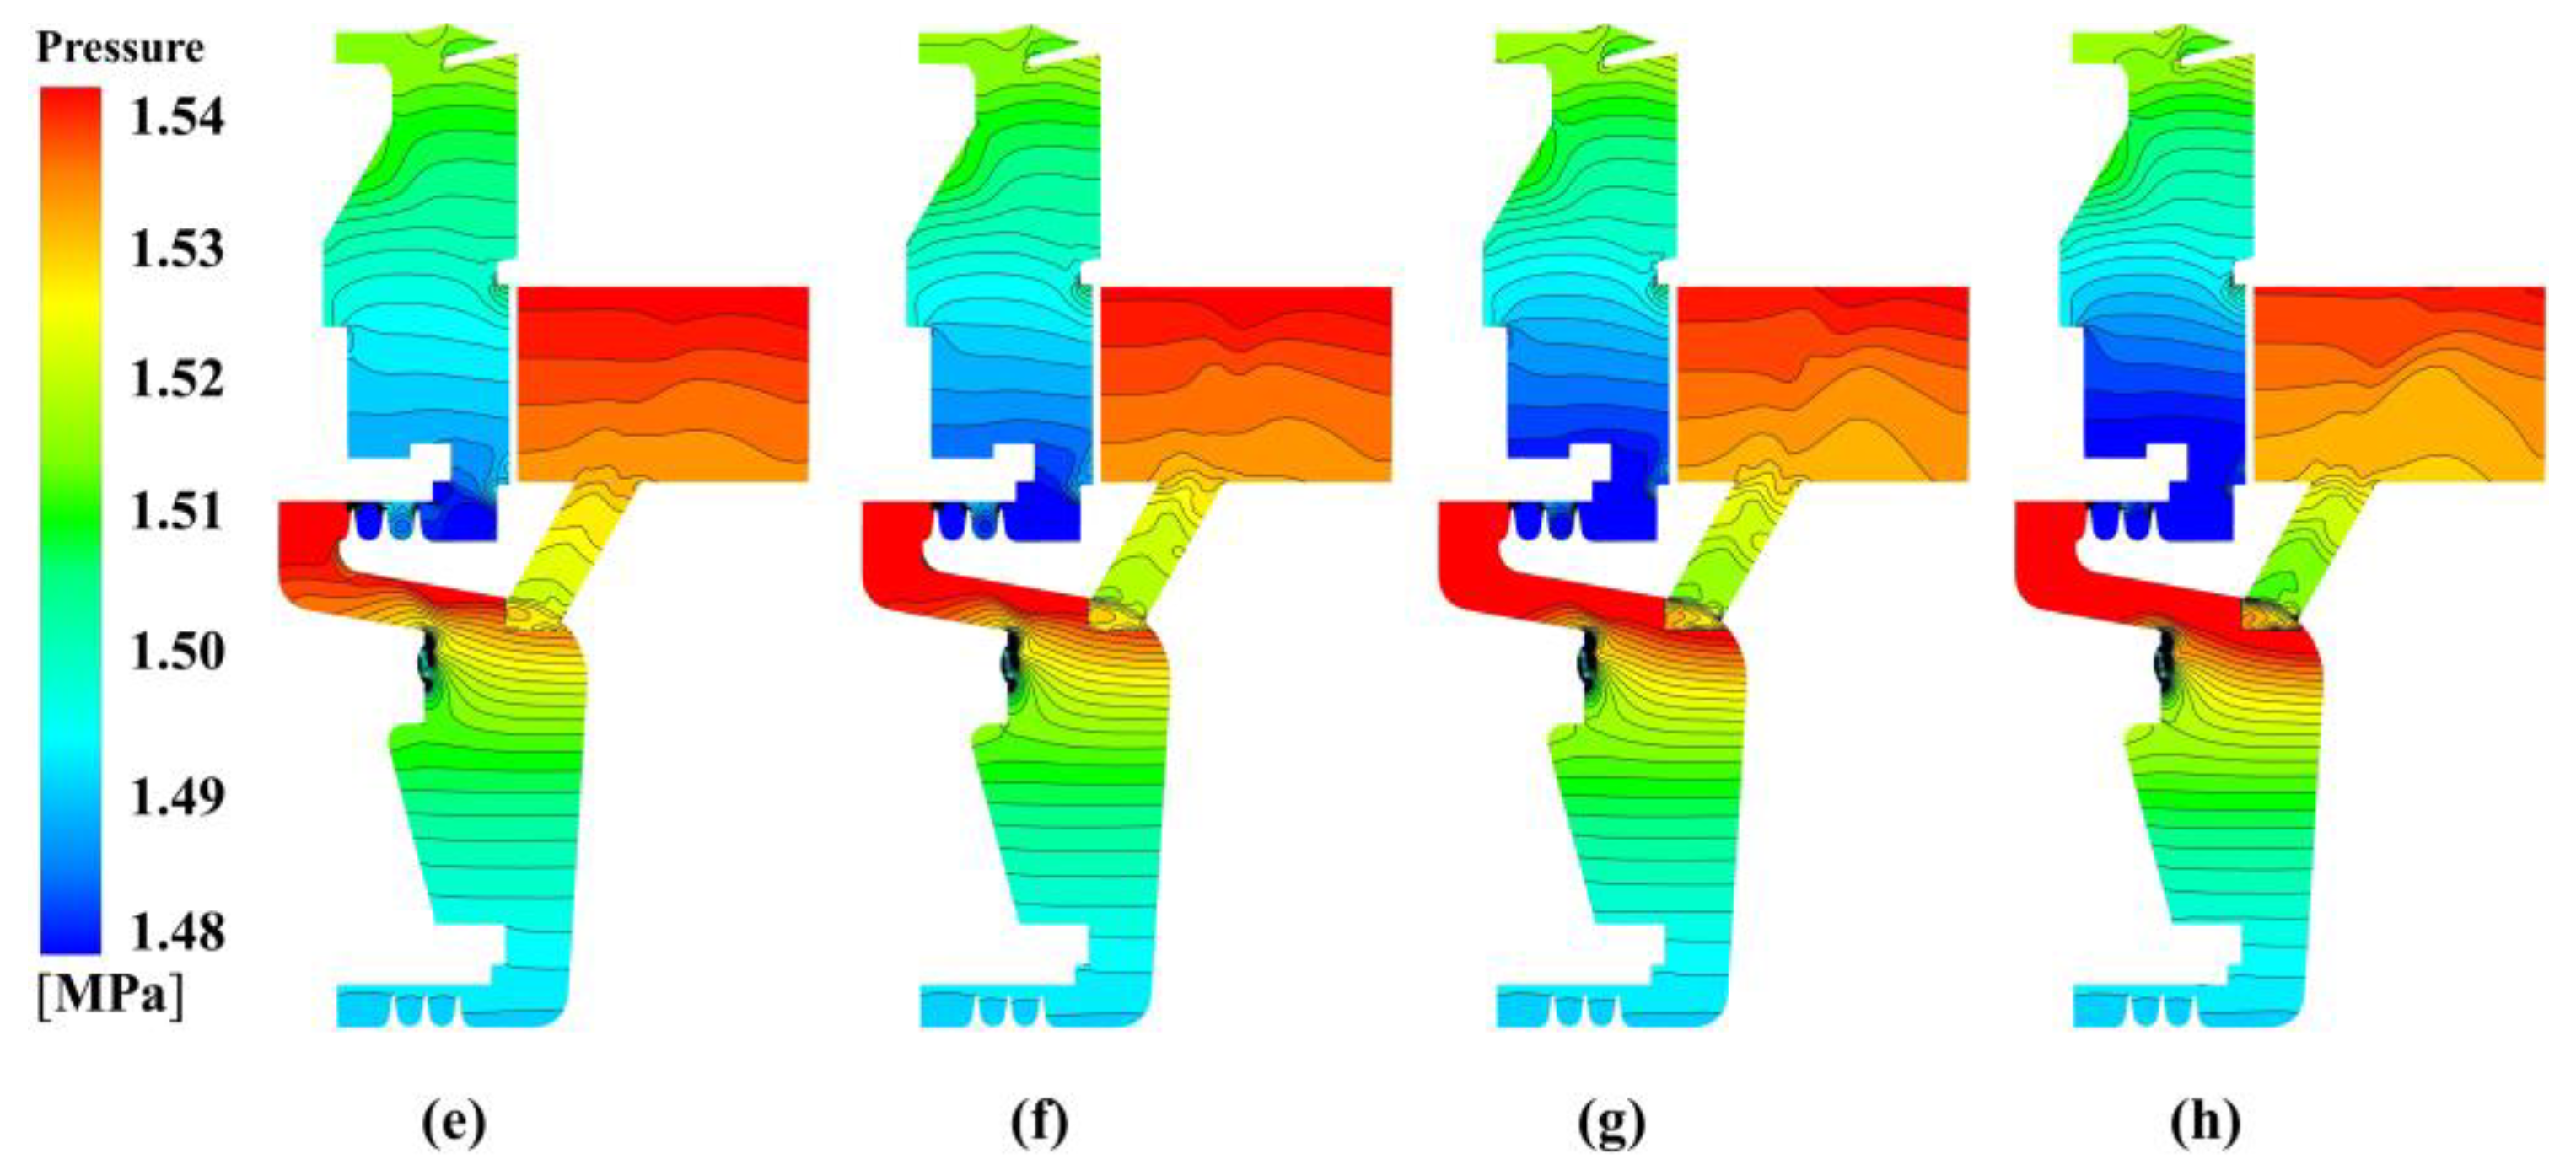
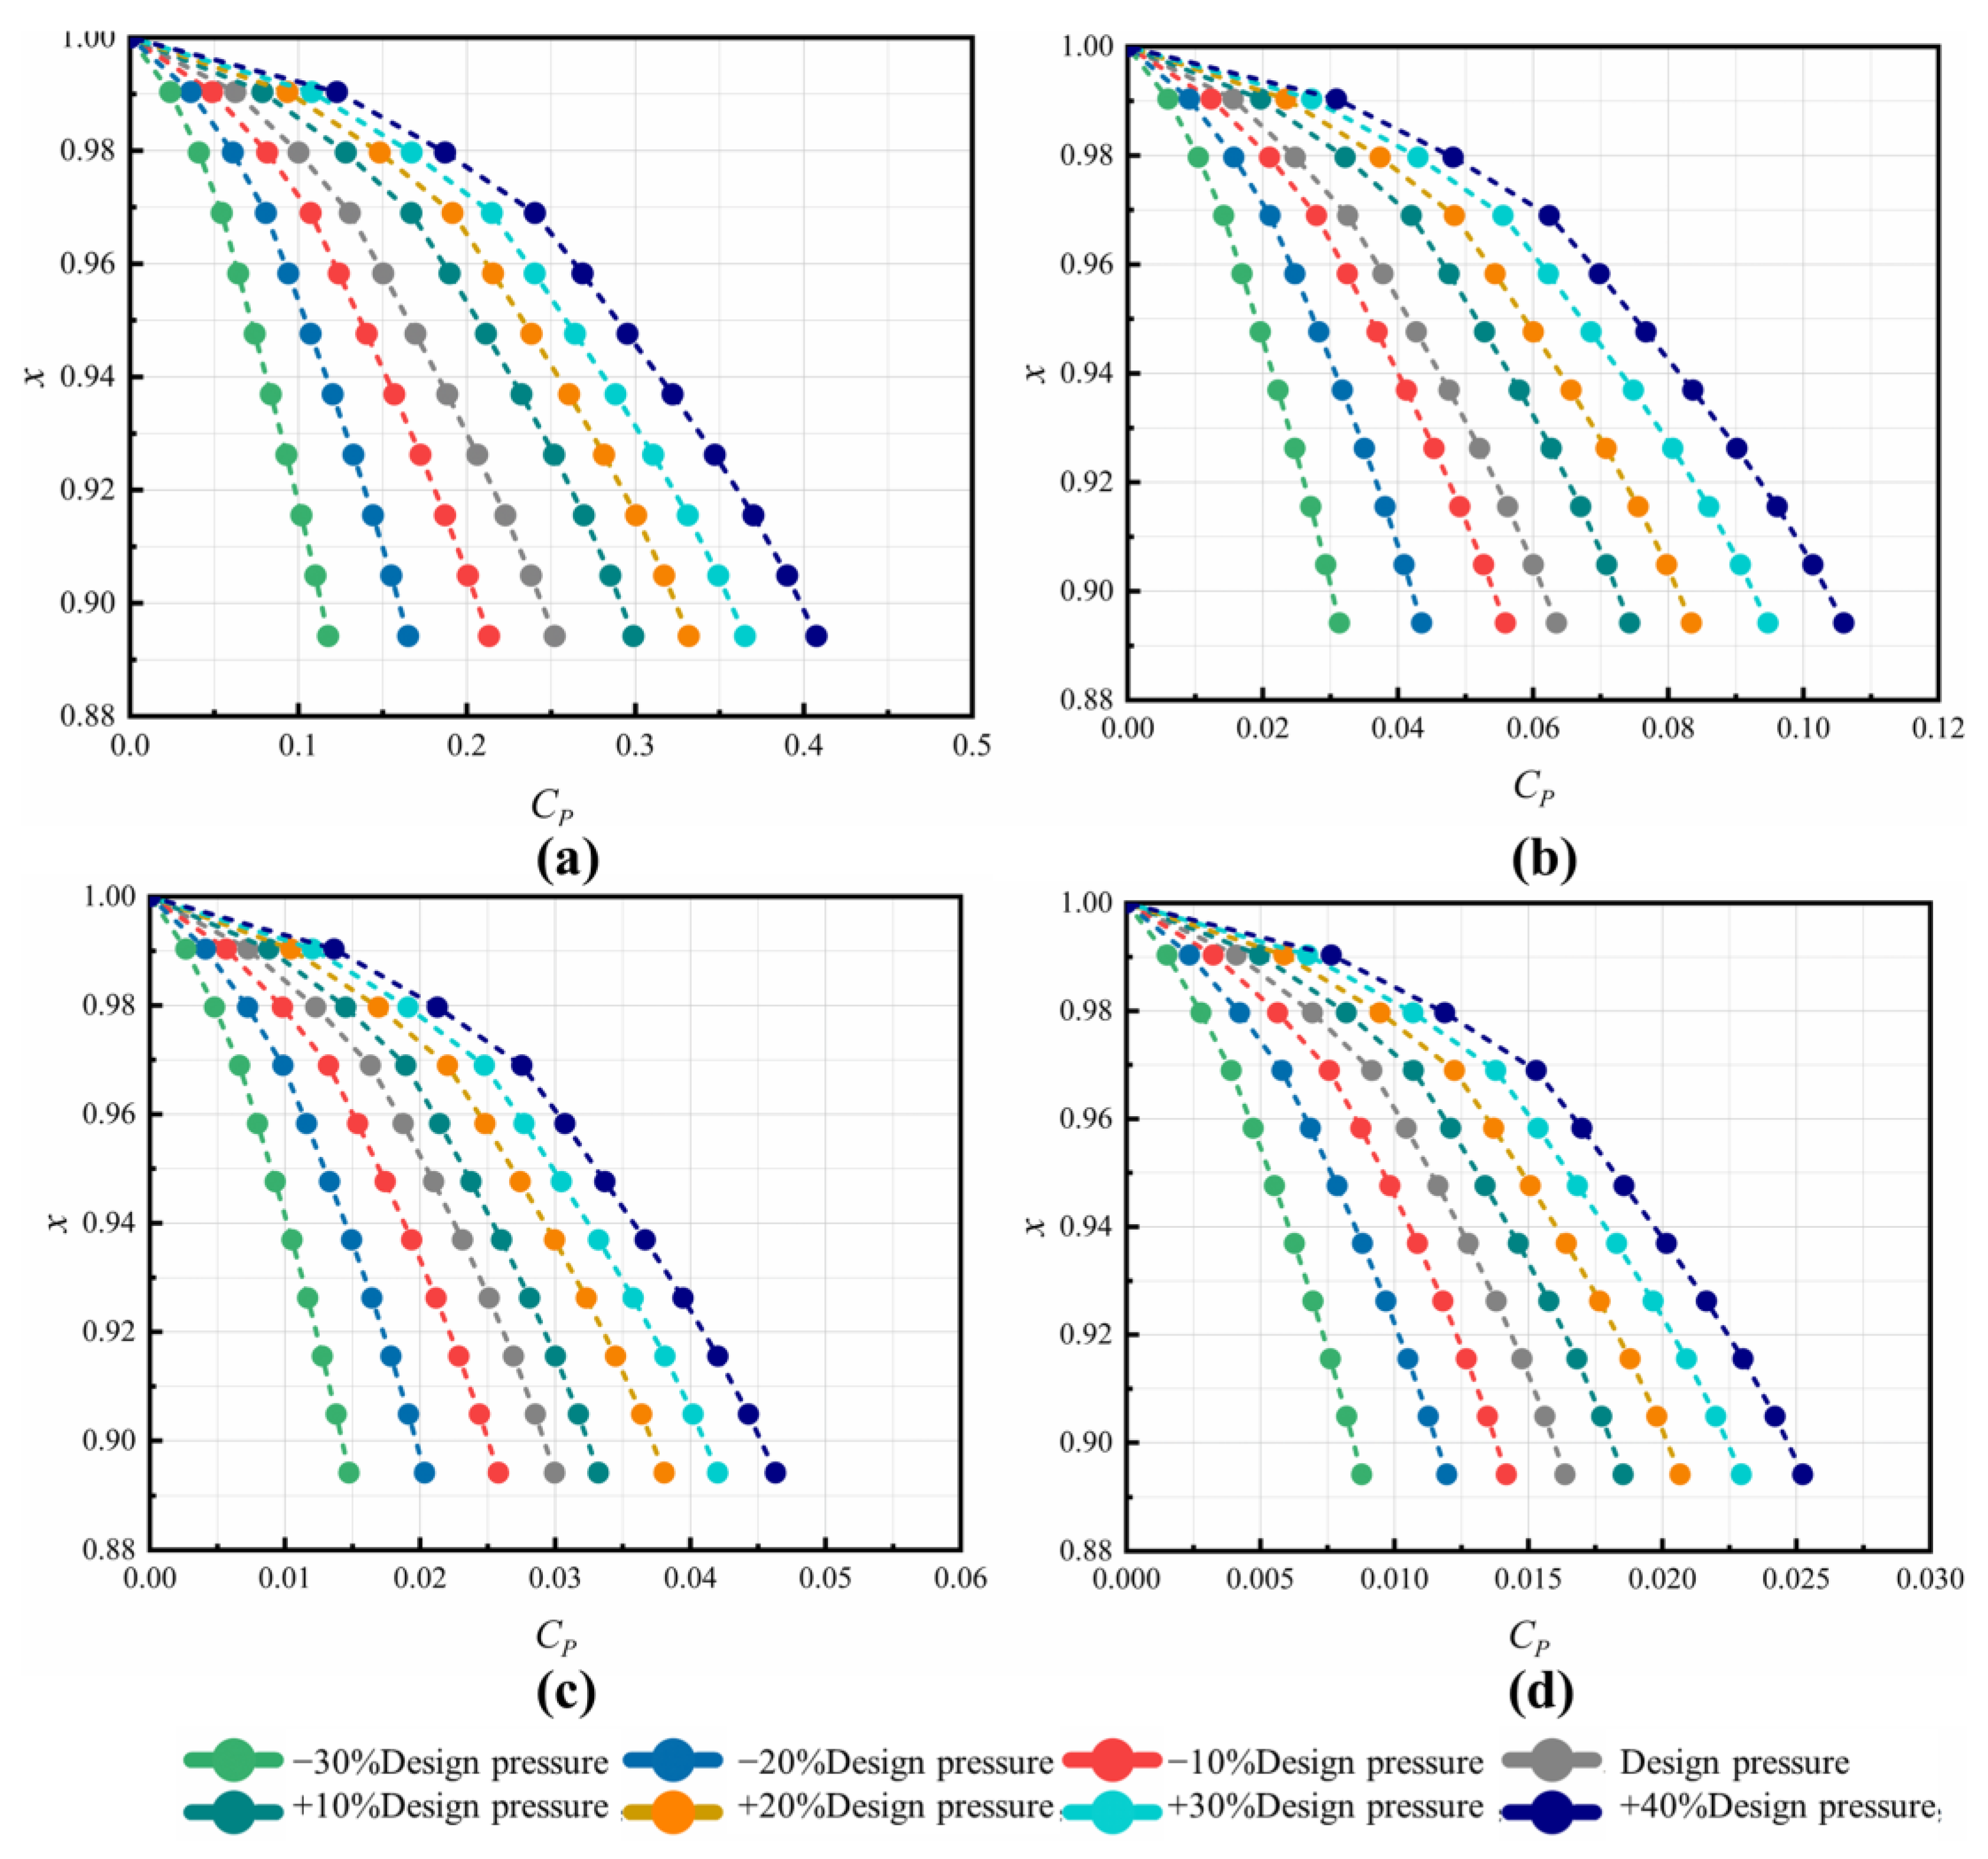
4.1.3. Pressure Coefficient Cp

The radial pressure distribution on the meridional section is depicted in Figure 6 for different inlet pressures at Re = 9.5172 × 10⁵ (at 0.5 times the maximum rotational speed). It can be seen that the pressure in the C3 cavity rises with increasing p i n ,   t o t a l . Near the inlet of receiving hole, there is a relatively high-pressure zone for p i n ,   t o t a l 1 . The rise of p s also results in the increase of the pressure gradient from the pre-swirl nozzle to the outer labyrinth seal in C3. The high-pressure zone enlarges as p i n ,   t o t a l increases. Conversely, the pressure at the outlet of the receiving hole minimally changes. In the downstream C1 cavity, there is a low-pressure zone downstream of the inner labyrinth seal. The scope of the zone increases with increasing p i n ,   t o t a l . With a larger pressure difference at either side of the labyrinth seal, the leakage flow rate is expected to increase.
Since the axial thrust is an important parameter for the safe operation of a gas turbine, the radial distribution of pressure coefficient Cp was compared. The reference pressure was taken at the radius of labyrinth A1 from numerical simulation. Since the pressure drop is radial inwards, the values of the pressure coefficient Cp are positive, as depicted in Figure 7. In all the cases, the increasing trend of Cp towards the shaft are similar. The parameter Cp is positively correlated with p s at each Re. When the Reynolds number is large, the Cp increases with the nozzle inlet pressure, but the increments are small, and the effect of increasing p s on Cp is relatively weak. The flow below the pre-swirl nozzle is mainly controlled by the strong swirl flow in the C3 cavity and the pressure ratio is less influenced by p i n ,   t o t a l at this point. The larger values of p s cause the more severe pressure difference along the disk.

4.2. Performances of Pre-Swirl System

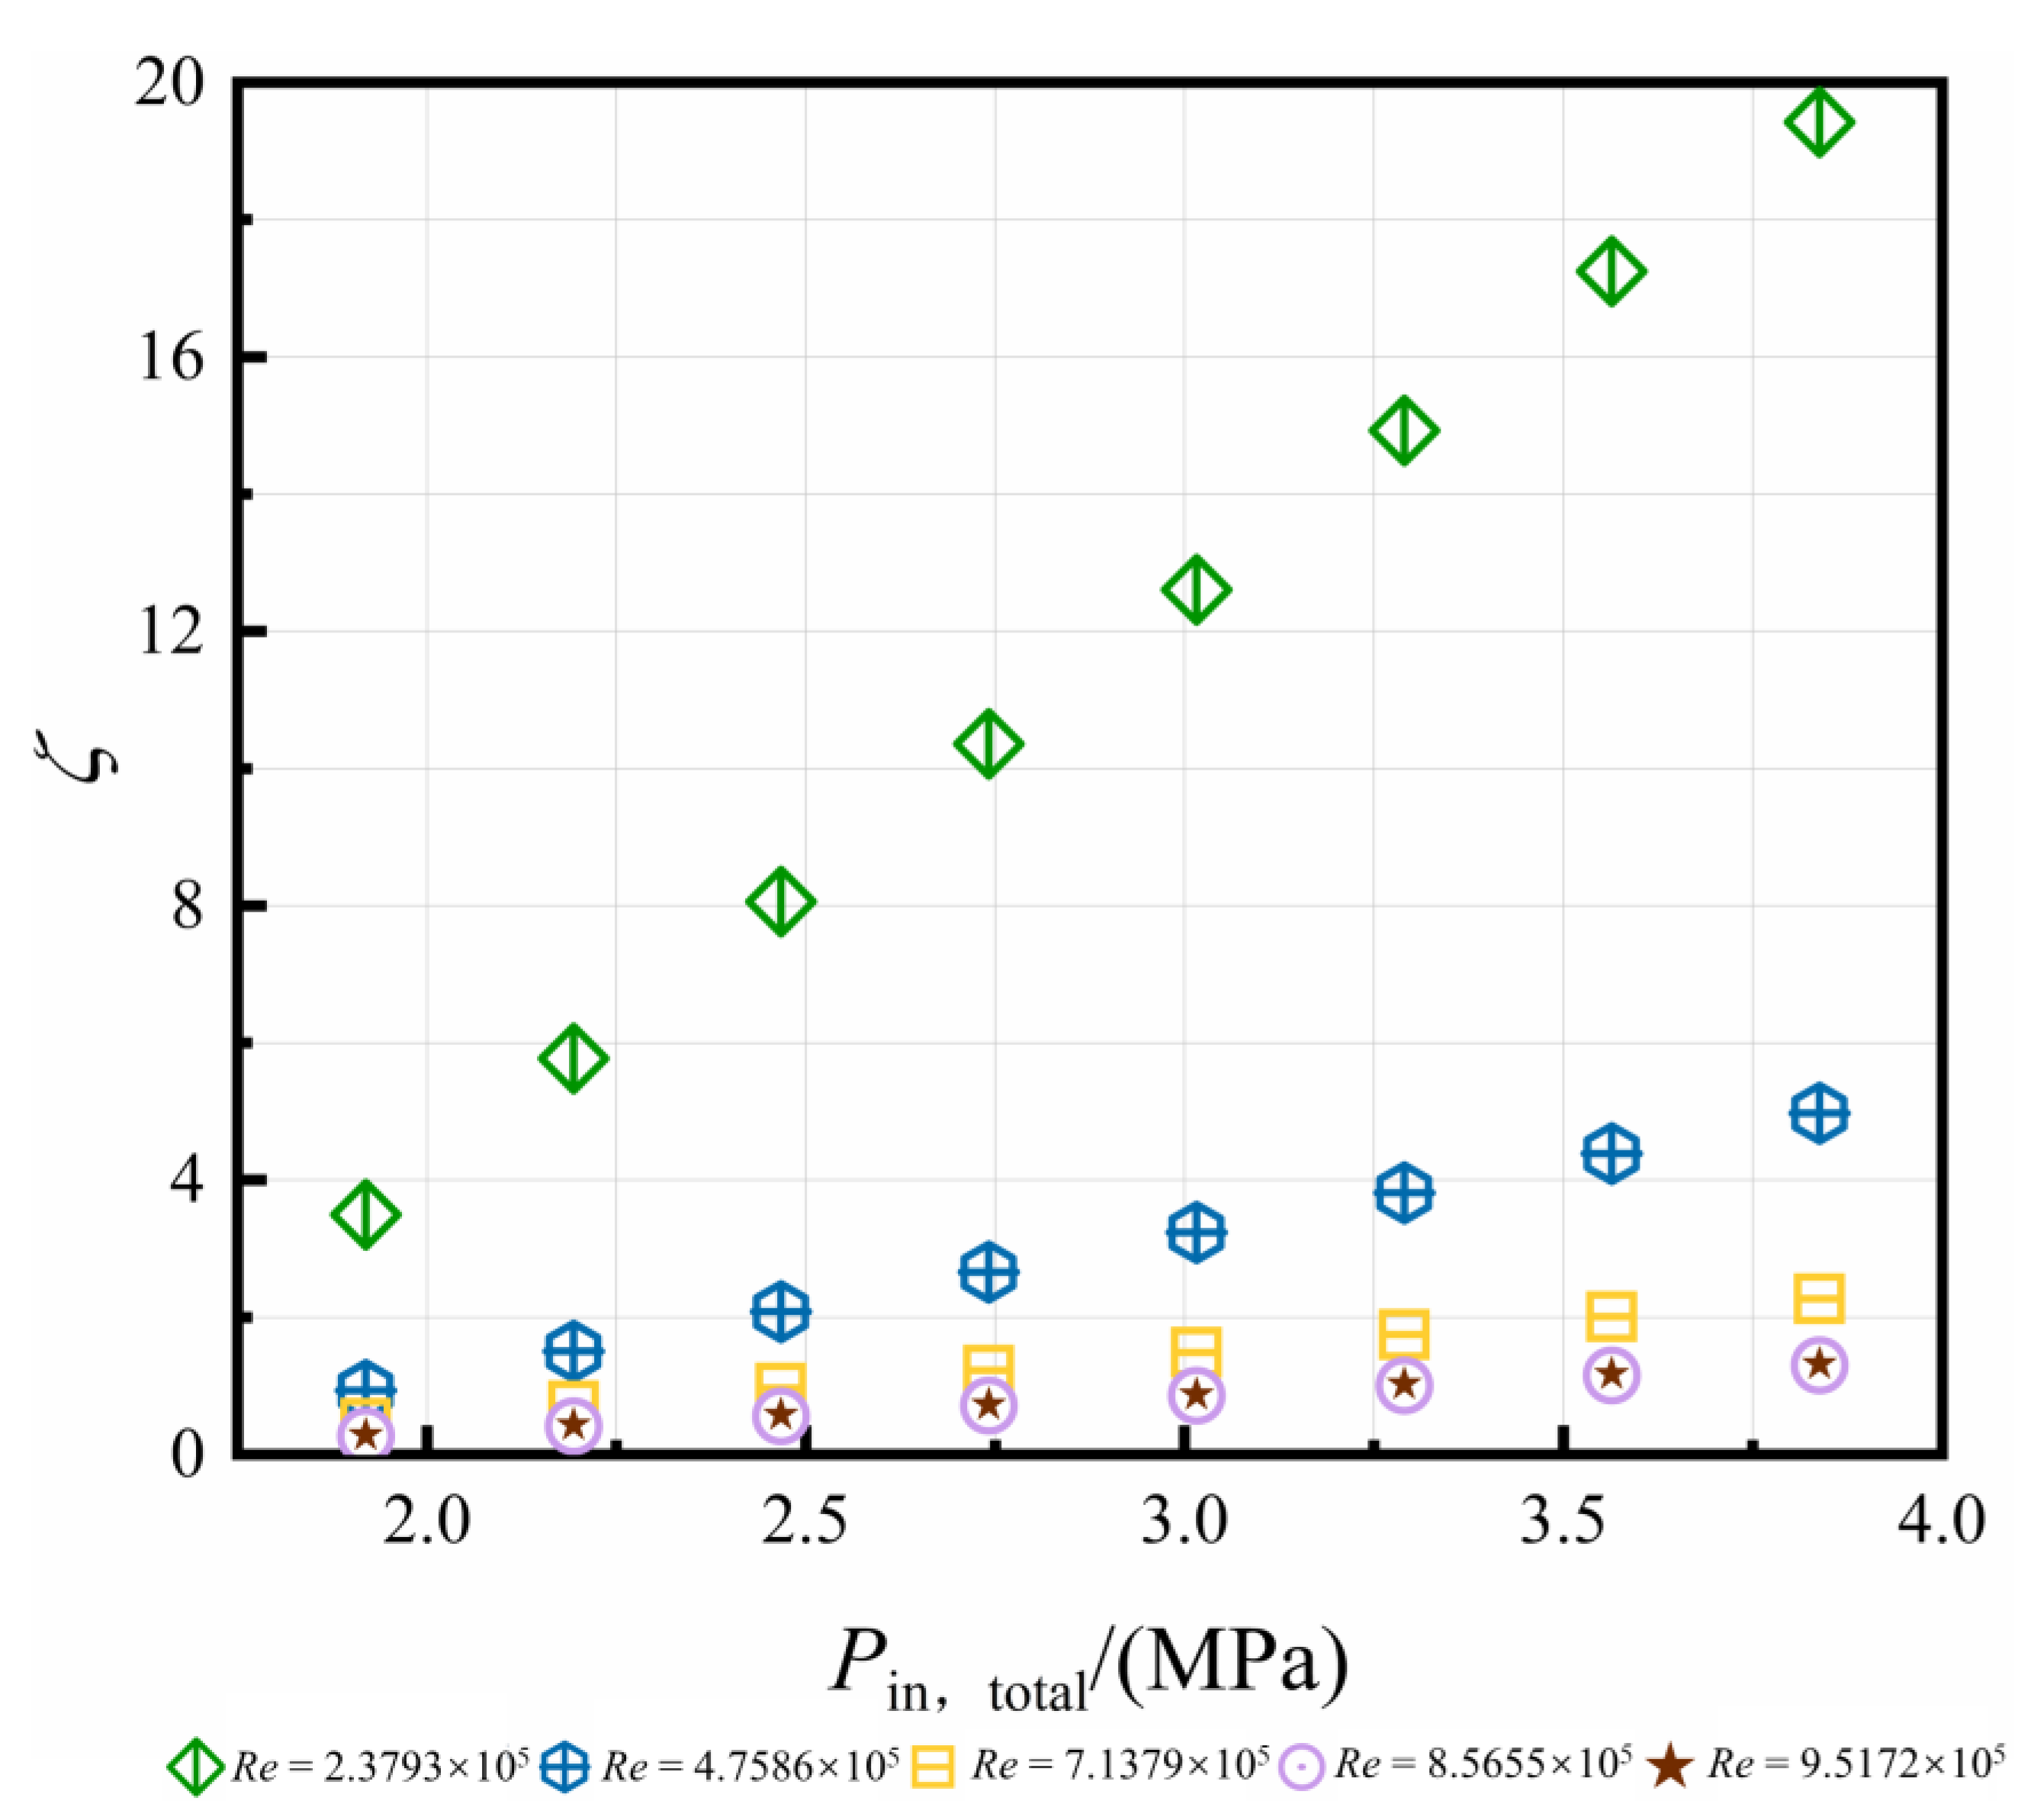
4.2.1. Non-Dimensional Pressure Drop

In this paper, we estimate the non-dimensional pressure drop ζ to predict the capacity of cooling air delivery. It is defined in Equation (13). The variation of ζ are plotted in Figure 8. The values of ζ increase with the total pressure p i n ,   t o t a l at the nozzle inlet. With the increase of Re, the dominant rotation is strong in C3, and the values of ζ are less influenced by p i n ,   t o t a l . When Re reaches the maximum value (9.5172 × 10⁵), the increment rate of ζ is less than 2%.
ζ = P i n * P o u t * 1 2 ρ ω 2 r p 2
where Pn,t is the total pressure at the pre-swirl nozzle, Pr is the static pressure at the receiving hole, Pin* is the total pressure at the inlet, and Pout* is the total pressure at the outlet.

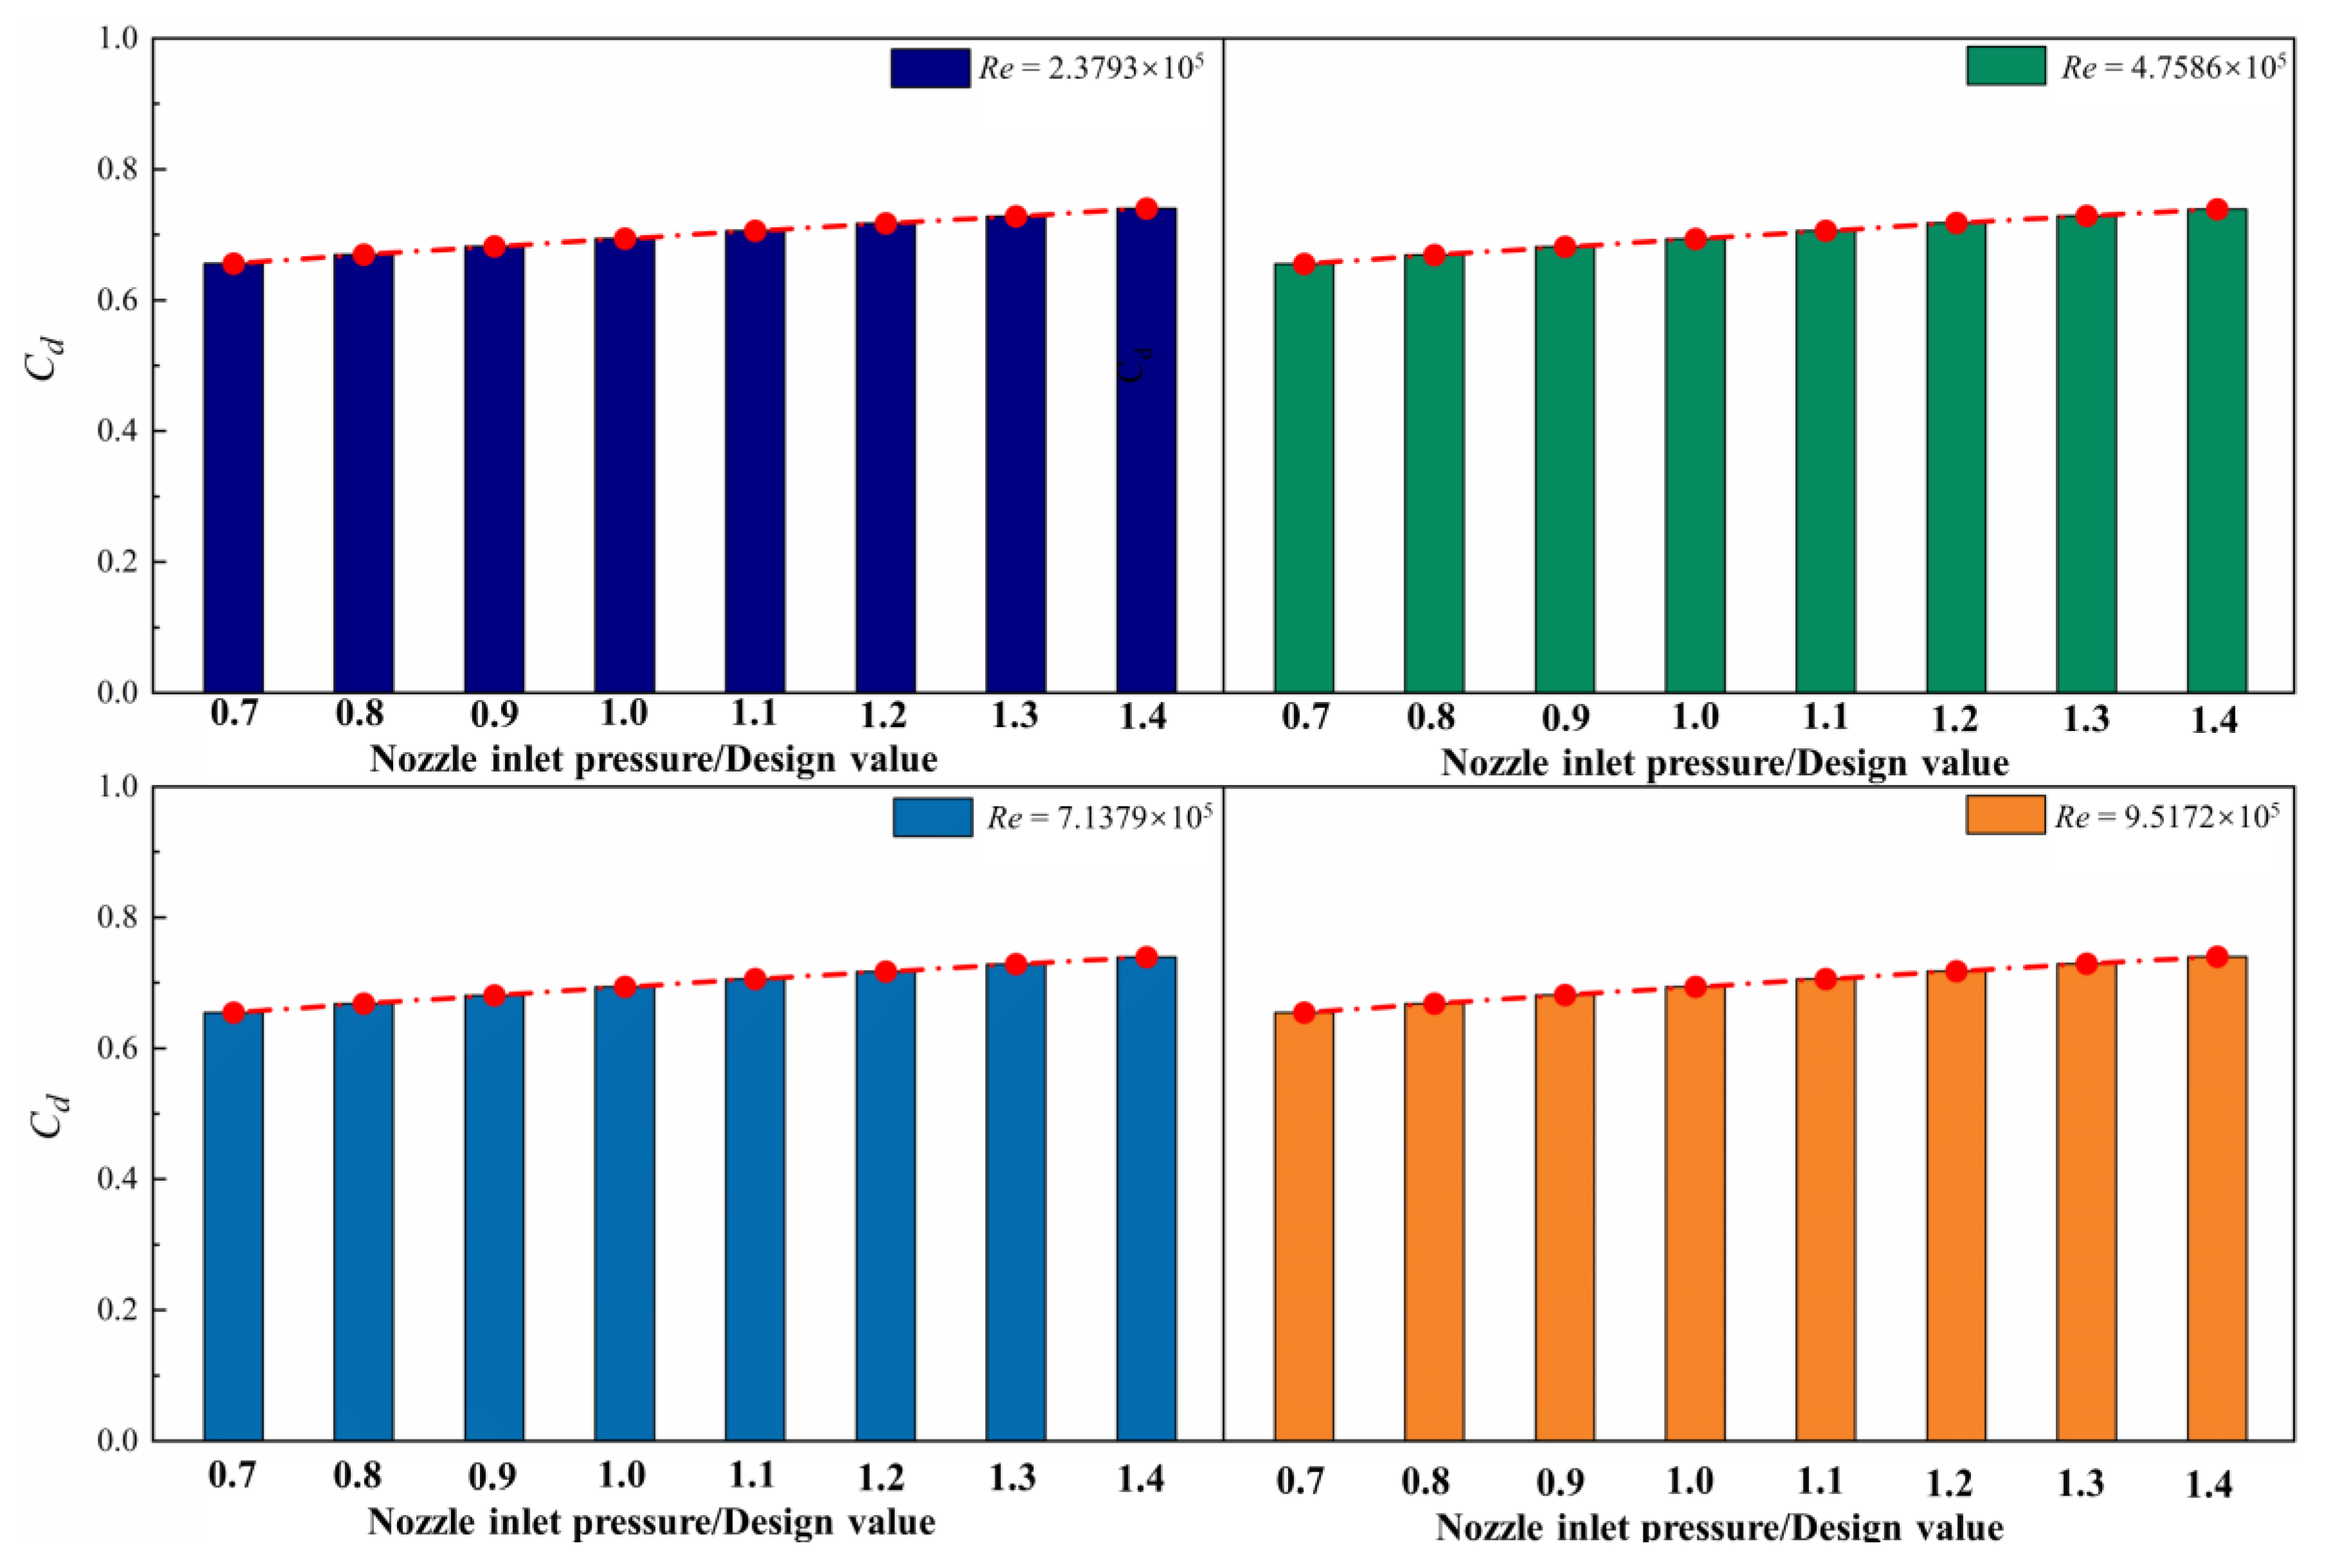
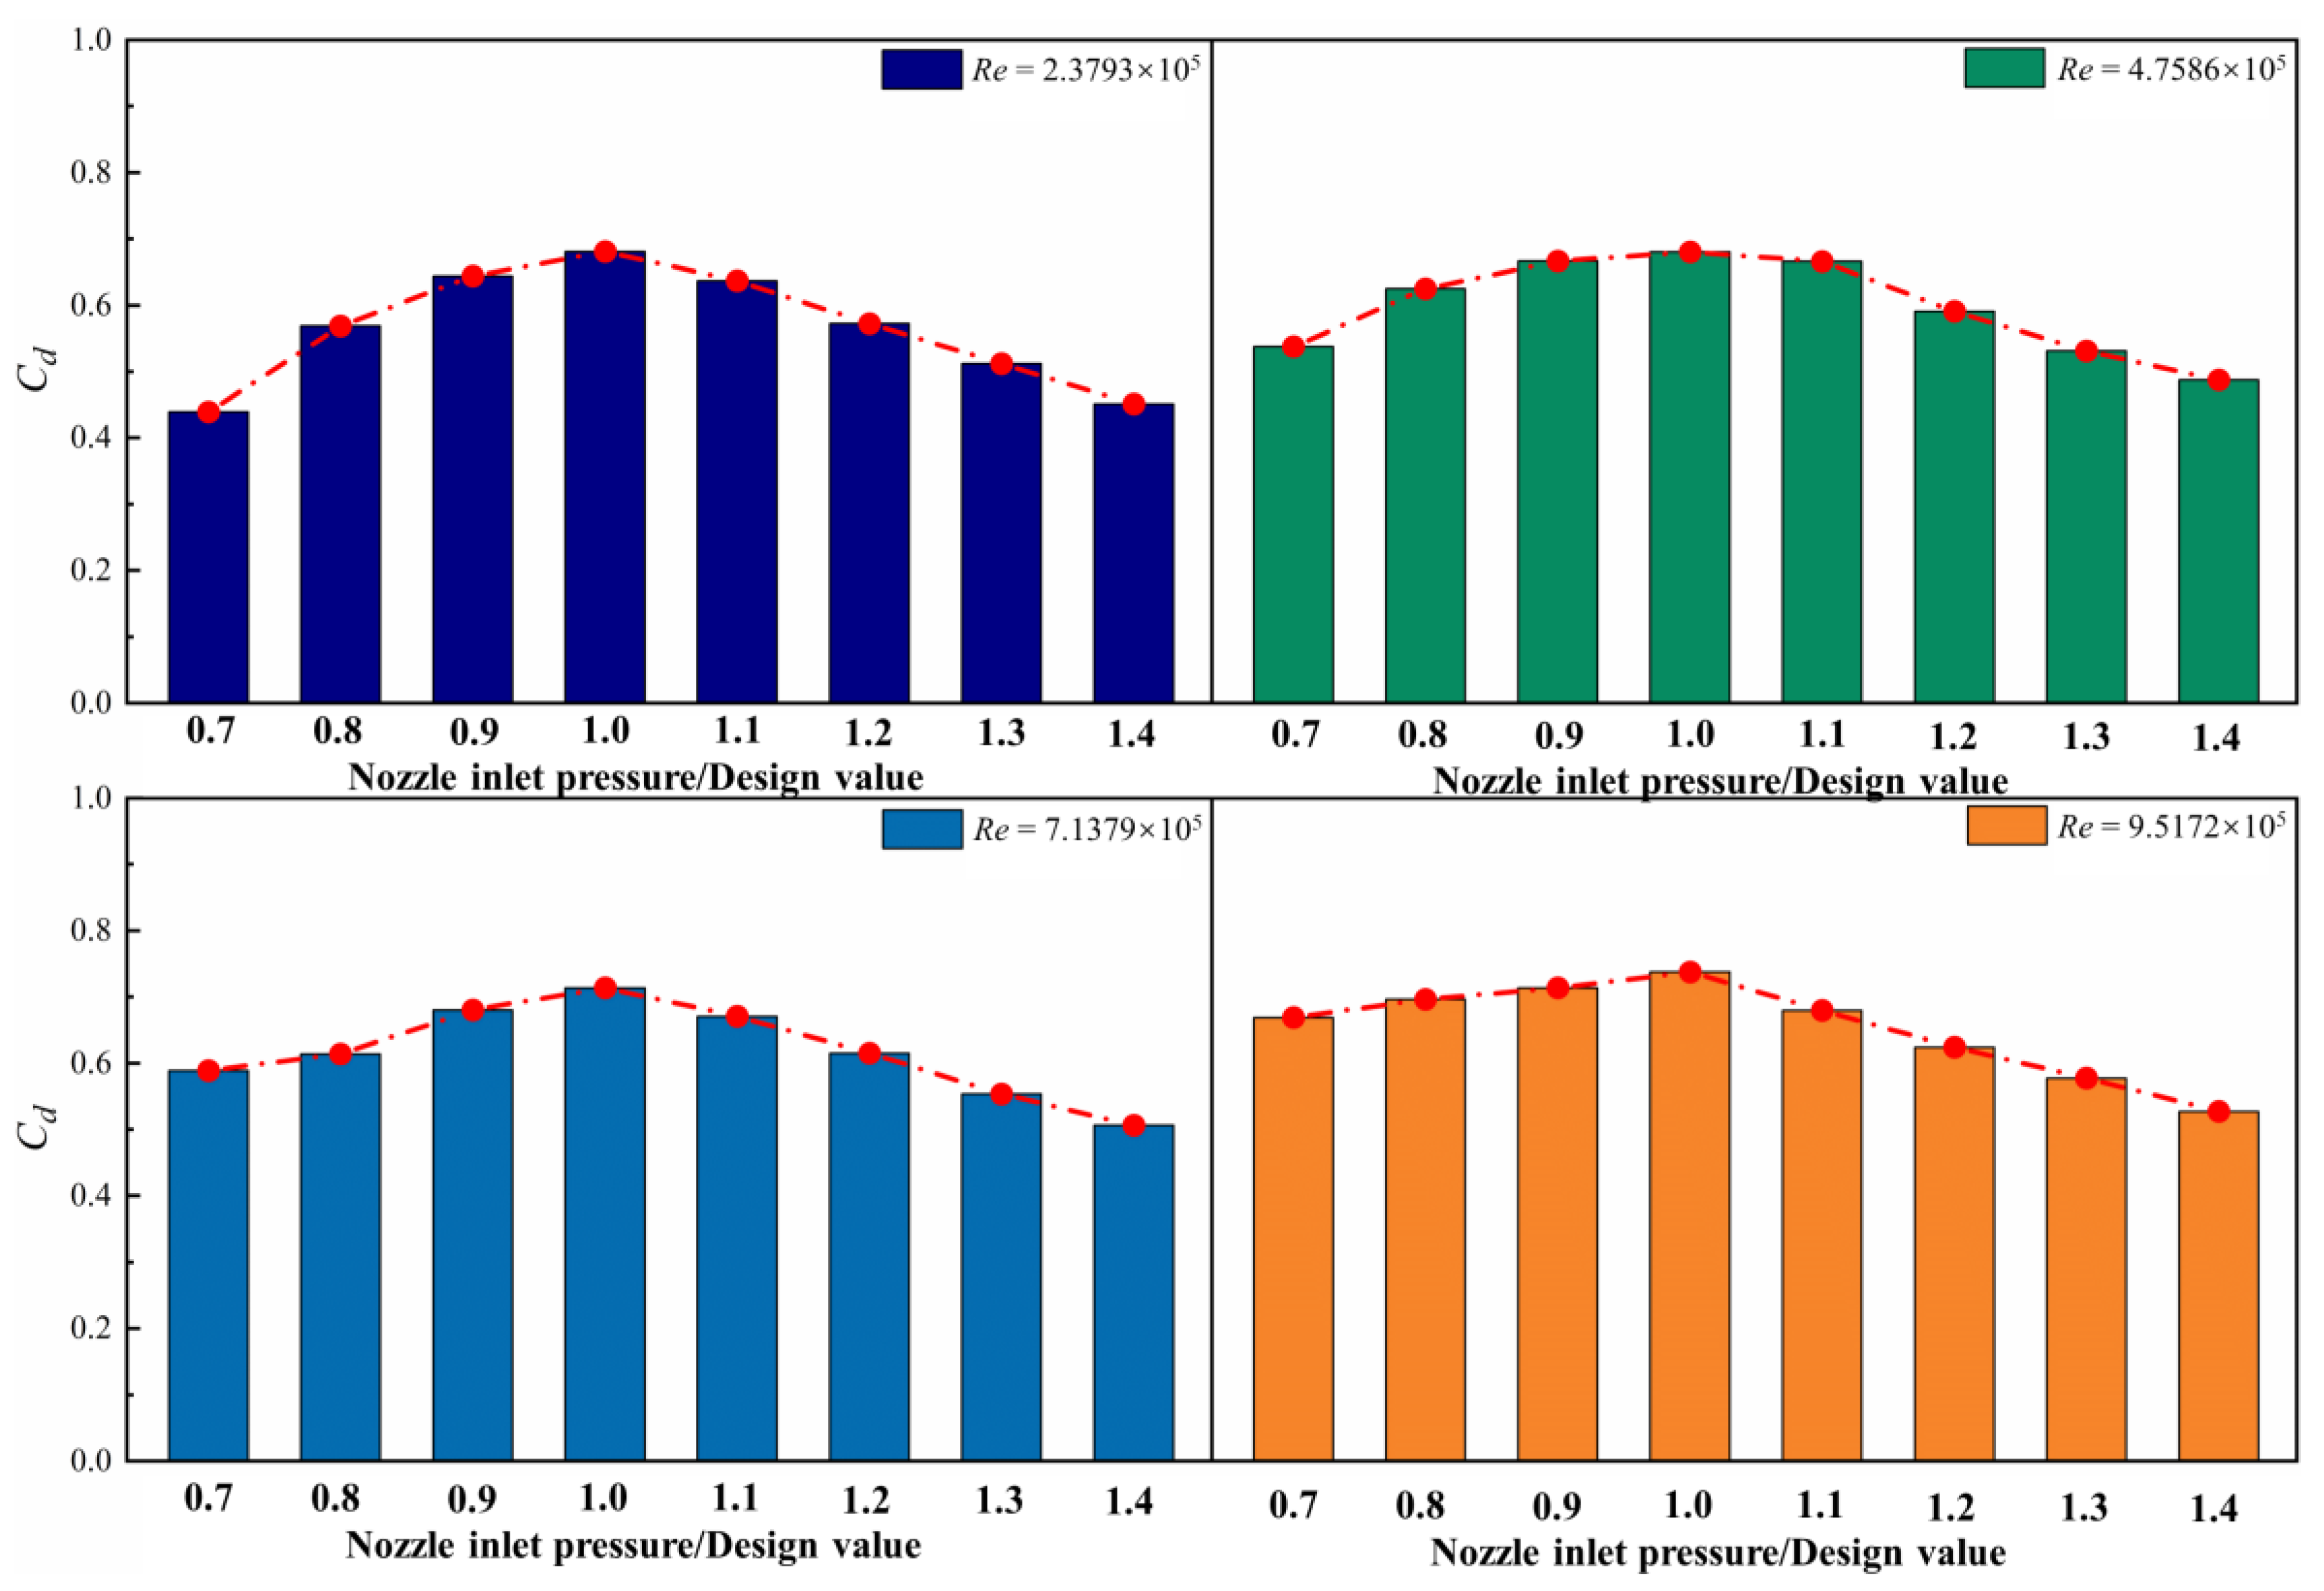
4.2.2. Through-Flow Capacity of Nozzle and Receiving Hole

The total pressure distribution in the mid-section of the pre-swirl nozzle at Re = 9.5172 × 10⁵ is depicted in Figure 9. It shows that as the pin,total continues to increase, there is a significant increase in the pressure, and the values of total pressure near the wall are larger than those near the center of the flow passage, which indicates that there is more flow resistance in the wall region.
The pressure distribution of each section at different axial positions of the pre-swirl nozzle with either maximum or minimum pin,total is shown in Figure 10. The circumferential velocity of airflow increases due to rotation. The pressure of the whole pre-swirl nozzle decreases along the flow direction. It is obvious that the through-flow capacity of the nozzle is good in the range of pin,total. For other Re, the trends are similar.
Figure 11 reflects the variation of C d versus p i n ,   t o t a l for the pre-swirl nozzle at four different Reynolds numbers. These values show an increasing trend versus p i n ,   t o t a l . The maximum relative increment is up to 2% when Re increases from 2.39 × 10⁵ to 9.5172 × 10⁵ at a fixed p i n ,   t o t a l .
In Figure 12, the total pressure distribution in the mid-section of the receiving hole at Re = 9.5172 × 10⁵ is shown. The receiving hole is a long orifice since the gas reattaches to the wall after a flow separation near the inlet. In the separation area, the values of pressure are large, which is represented by the red color. With increasing p i n ,   t o t a l , the scope of the separation area enlarges. In the rest of the area, the values of pressure drop, indicating better through-flow capacity.
The static pressure distribution of each section at different axial positions of the receiving hole with either maximum or minimum pin,total is shown in Figure 13. The values of pressure increase along the passage of the receiving hole. At the same axial position, the pressure is large with an increase in pin,total. At the minimum pin,total, there is a region with large pressure. When the air flows through the passage of the receiving hole, the pressure violently fluctuates. At the outlet, the pressure reaches the maximum value, which indicates the most flow resistance.
The variations of the receiving hole flow rate coefficient versus p i n ,   t o t a l are depicted in Figure 14. The values of C d ranges from 0.43 to 0.73. It increases first and then decreases with increasing p i n ,   t o t a l at a fixed Re. There is an optimal value of p i n ,   t o t a l , where the best through-flow rate can be achieved. The values increase up to 13.5% with increasing Re.

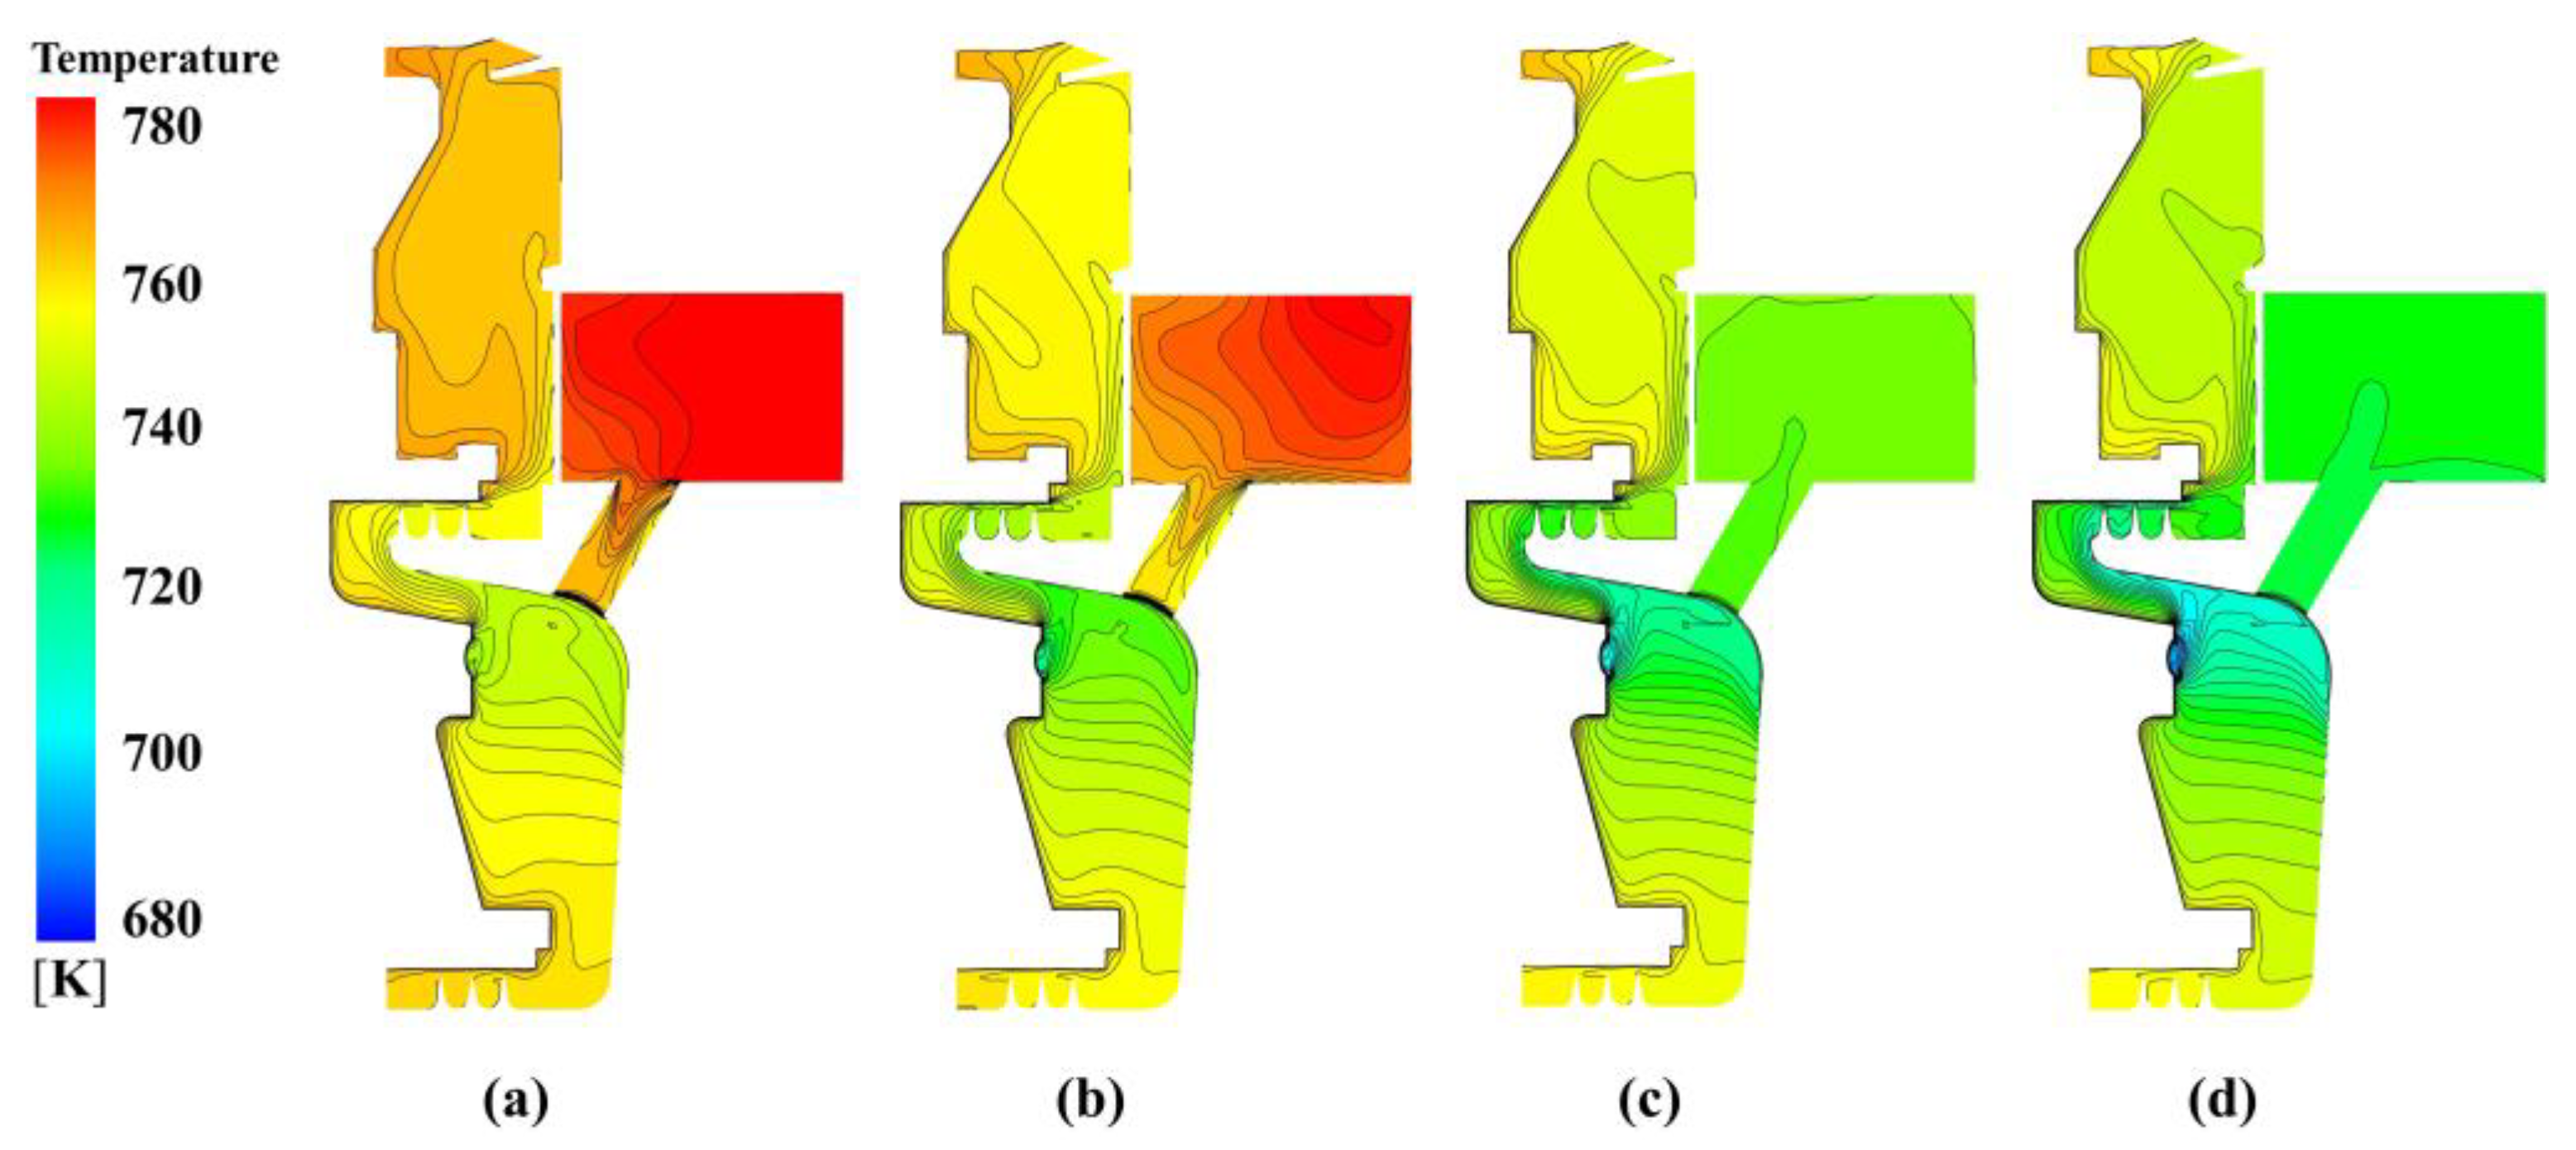
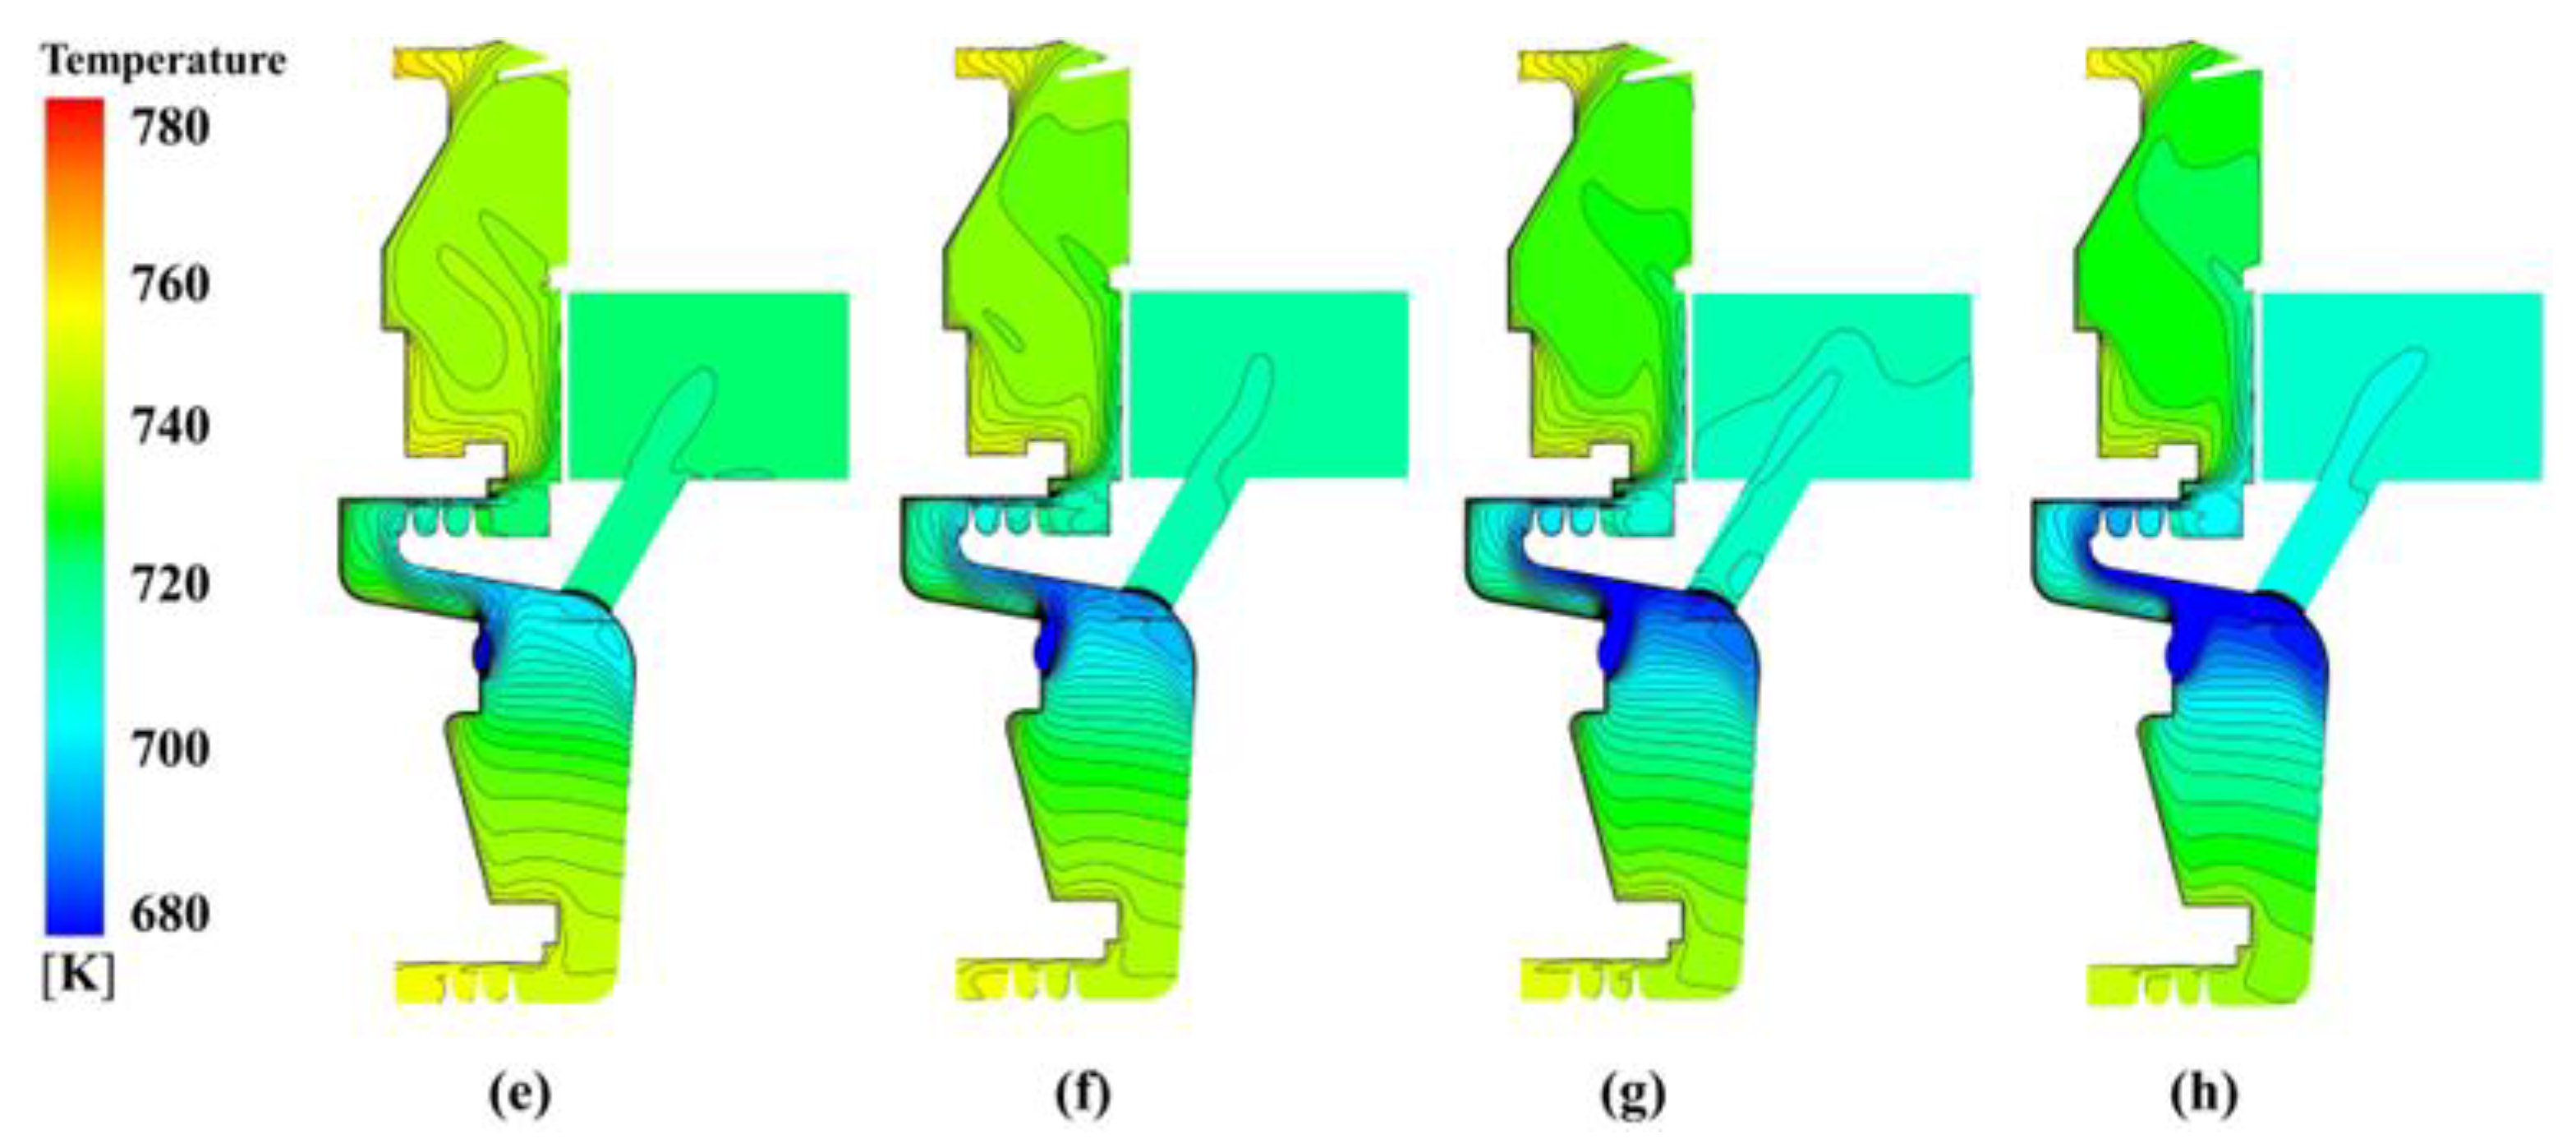
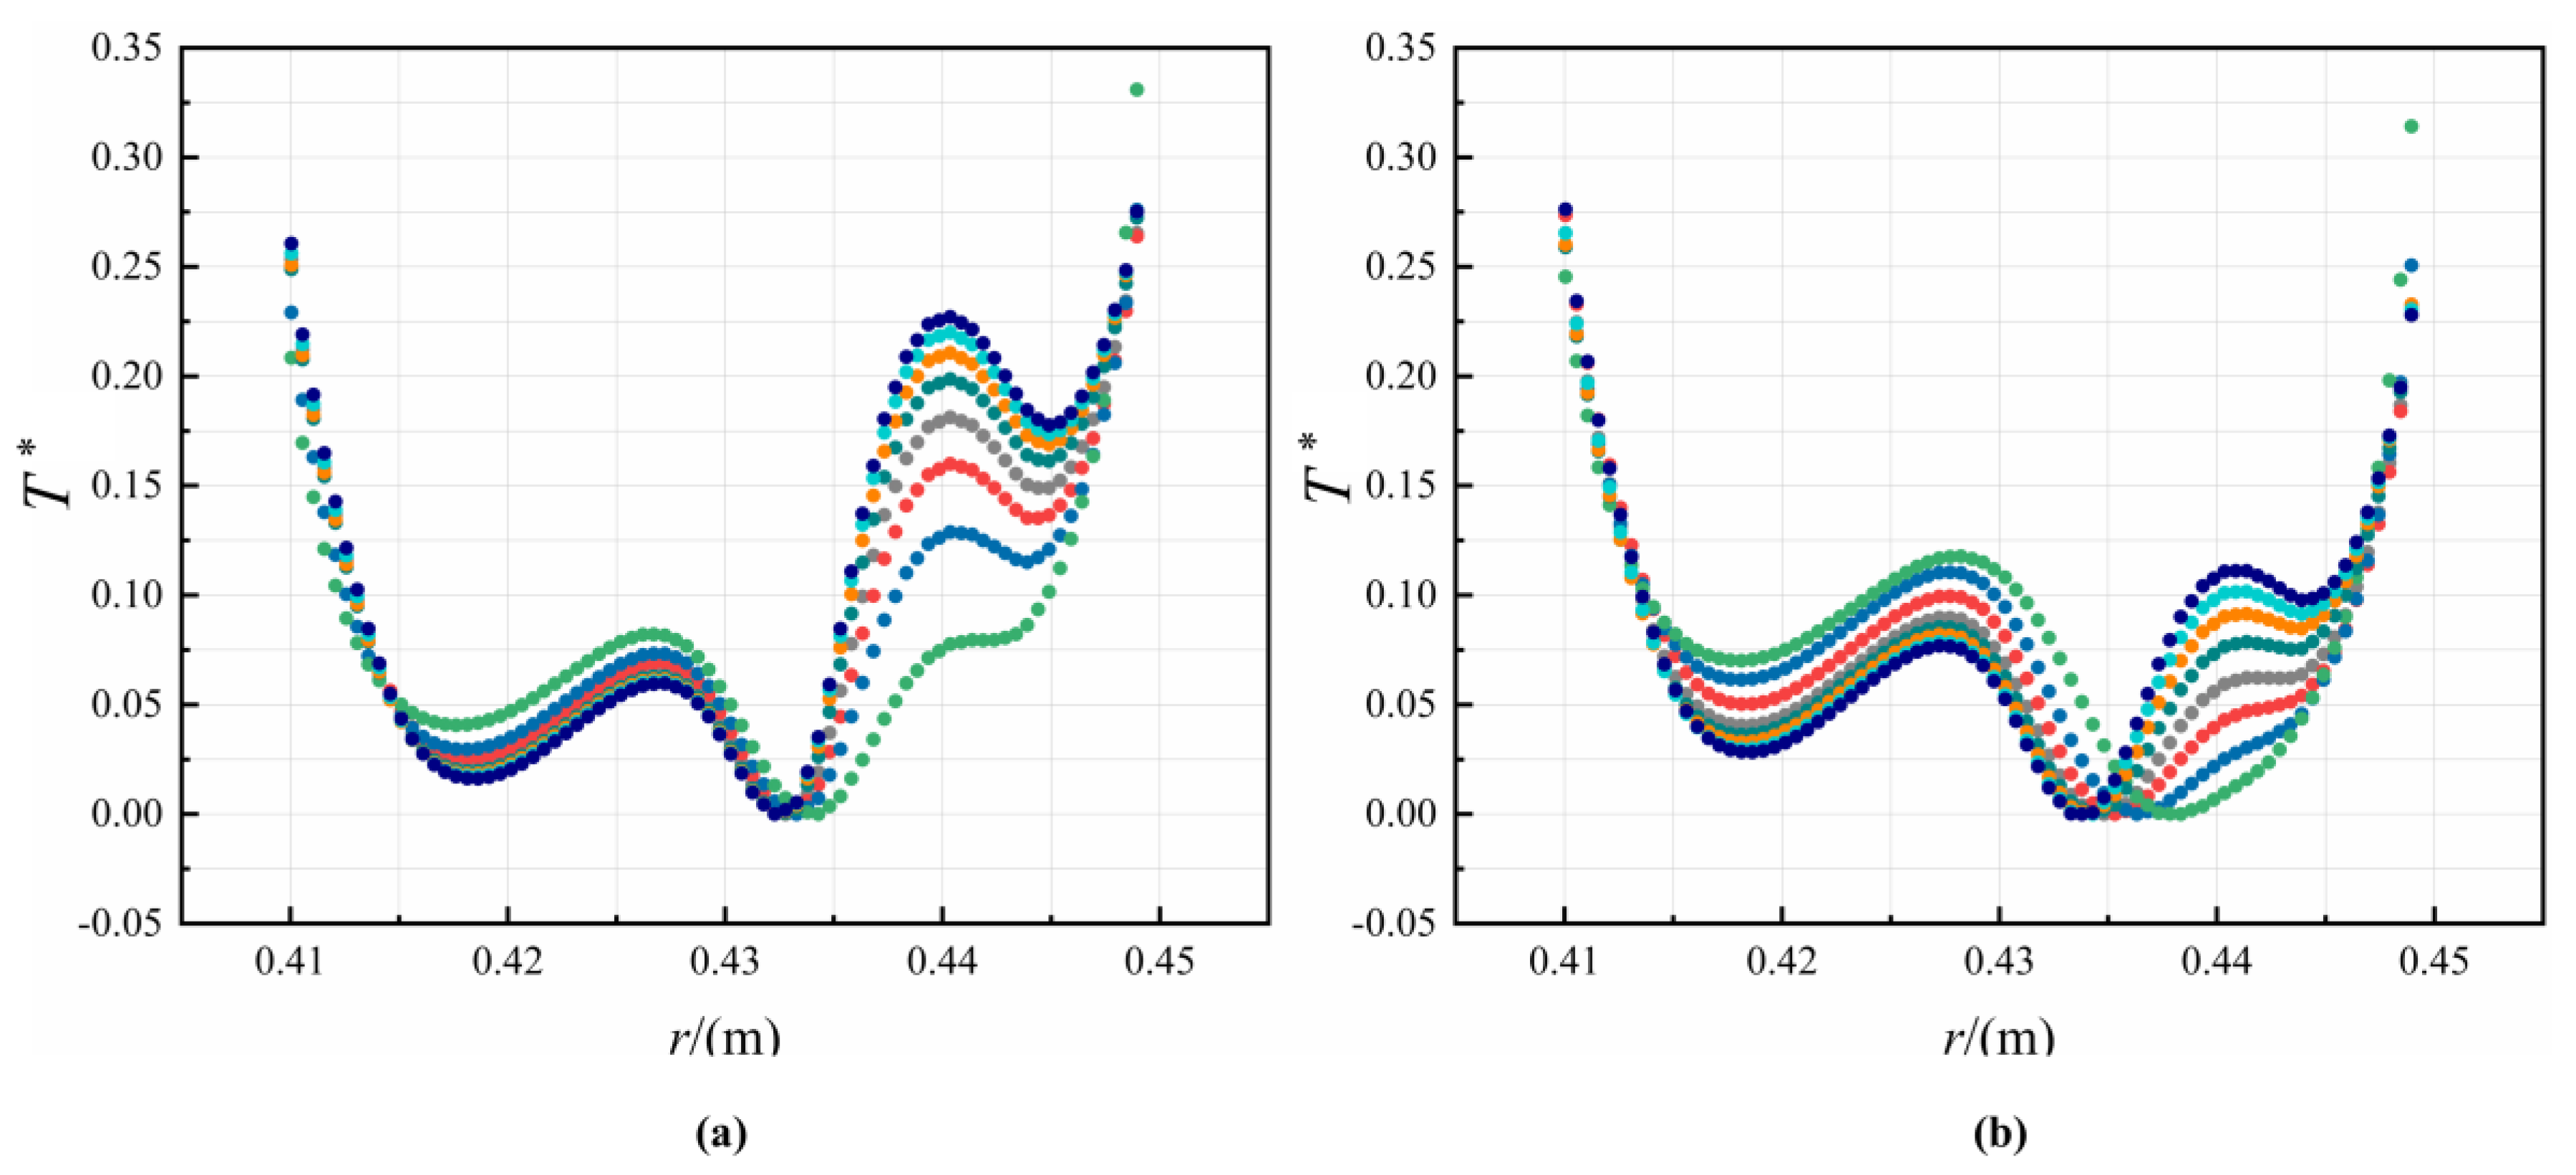
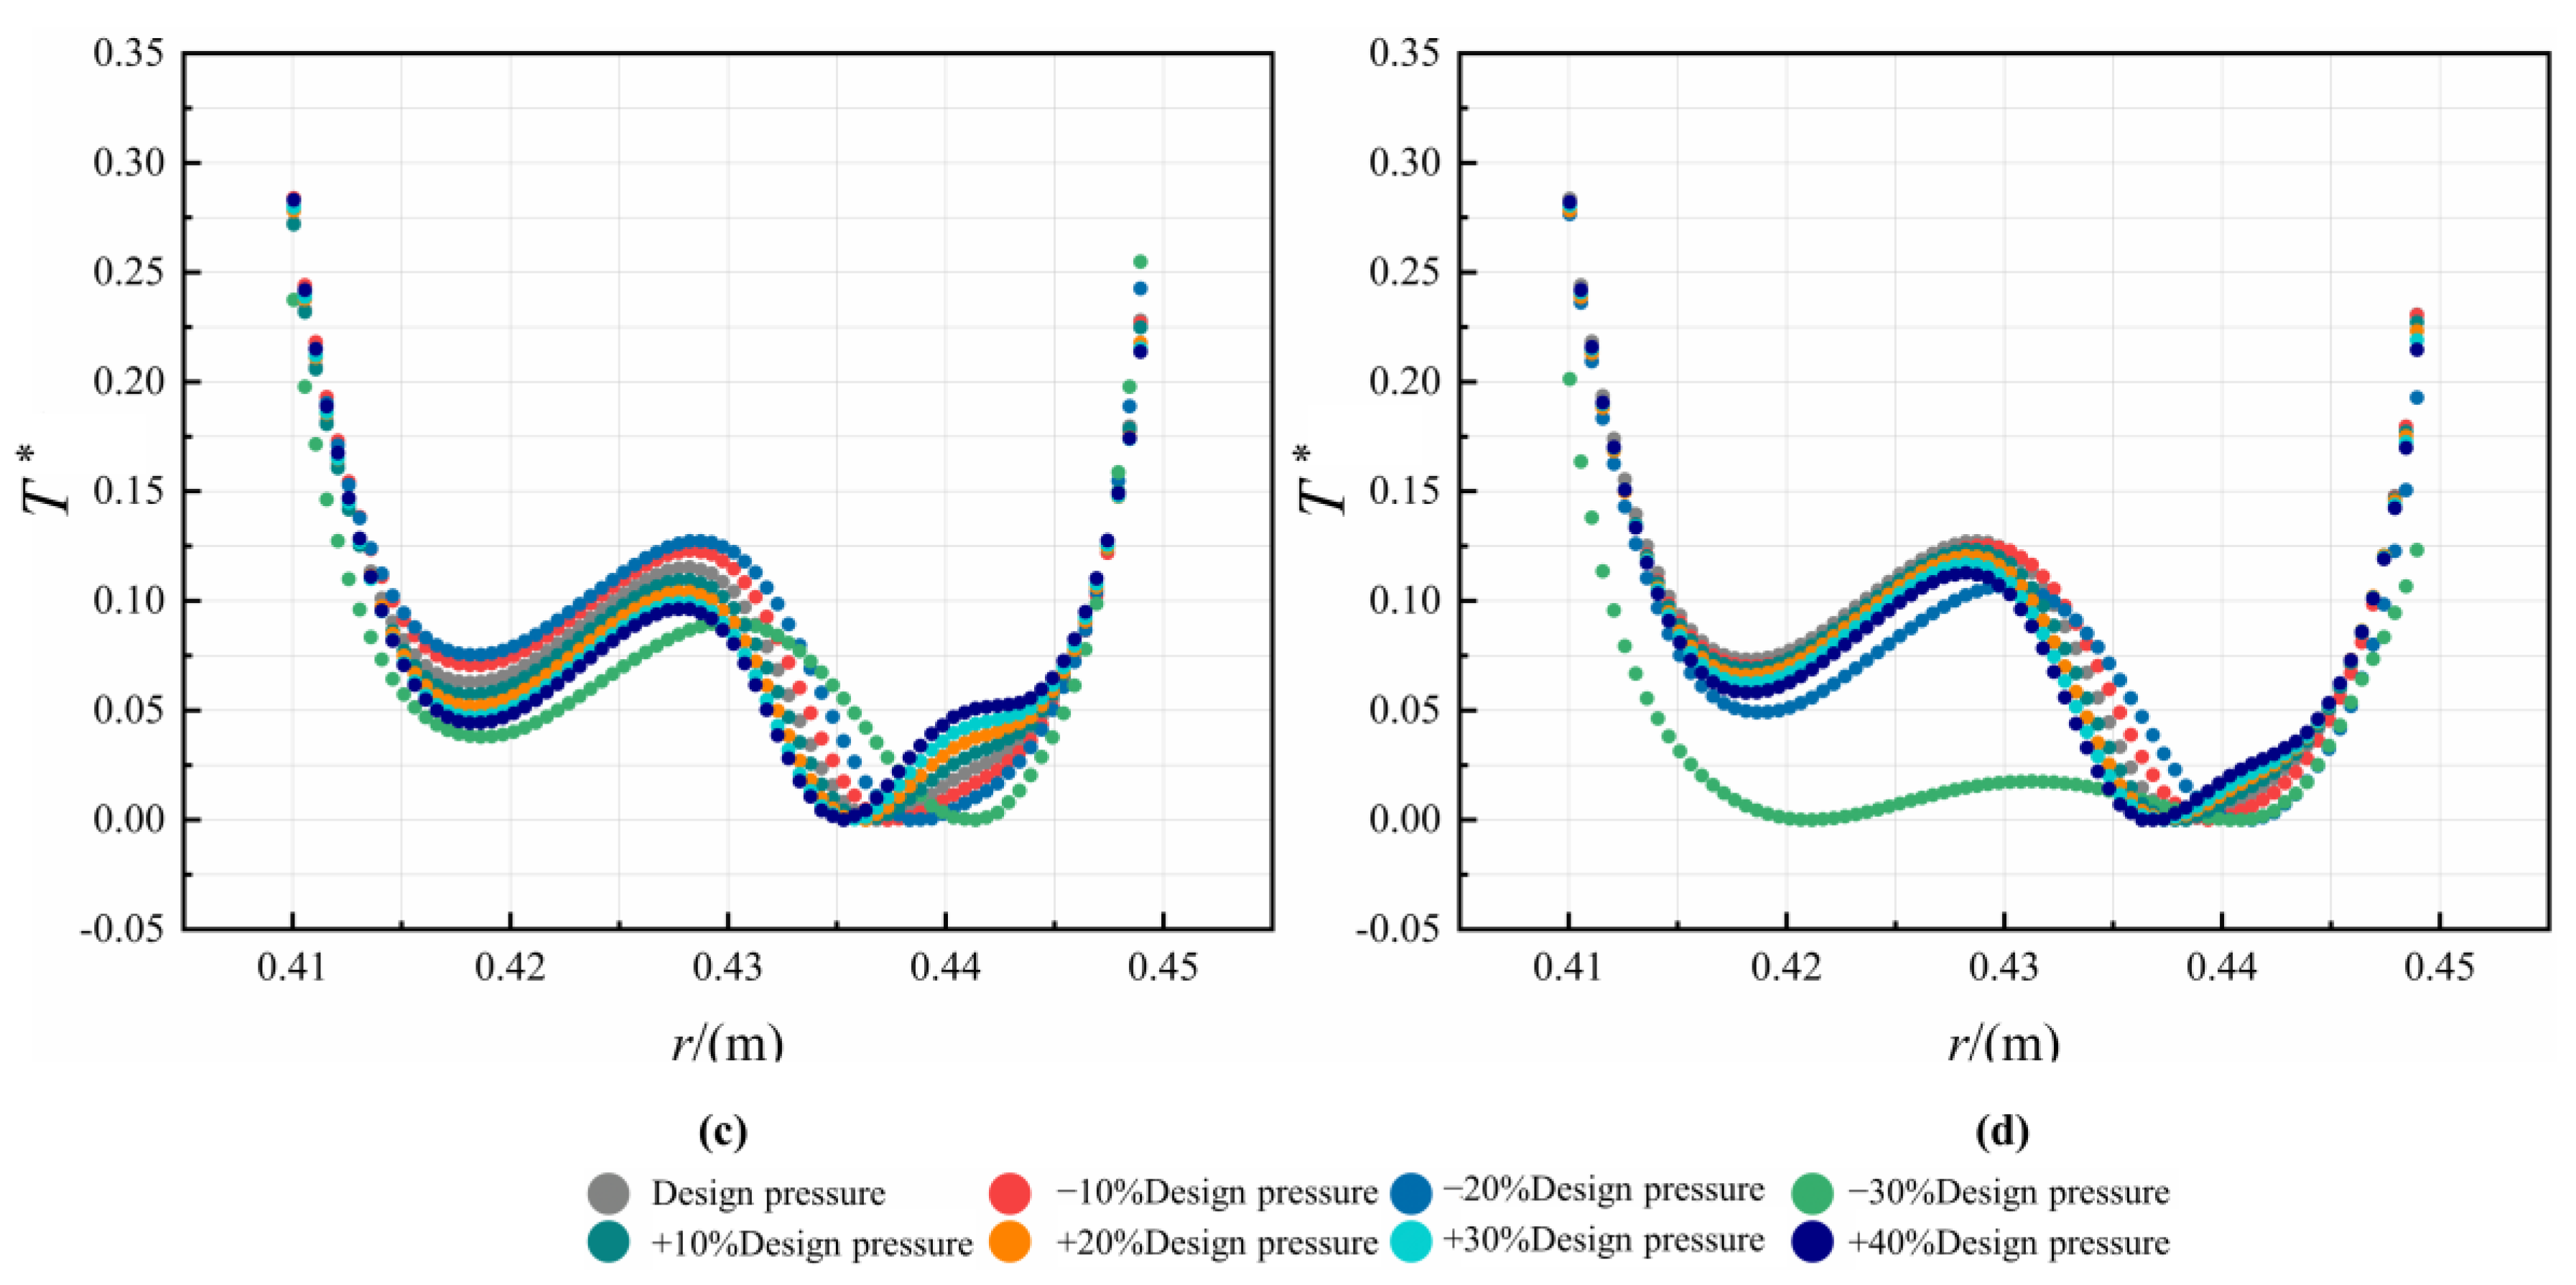
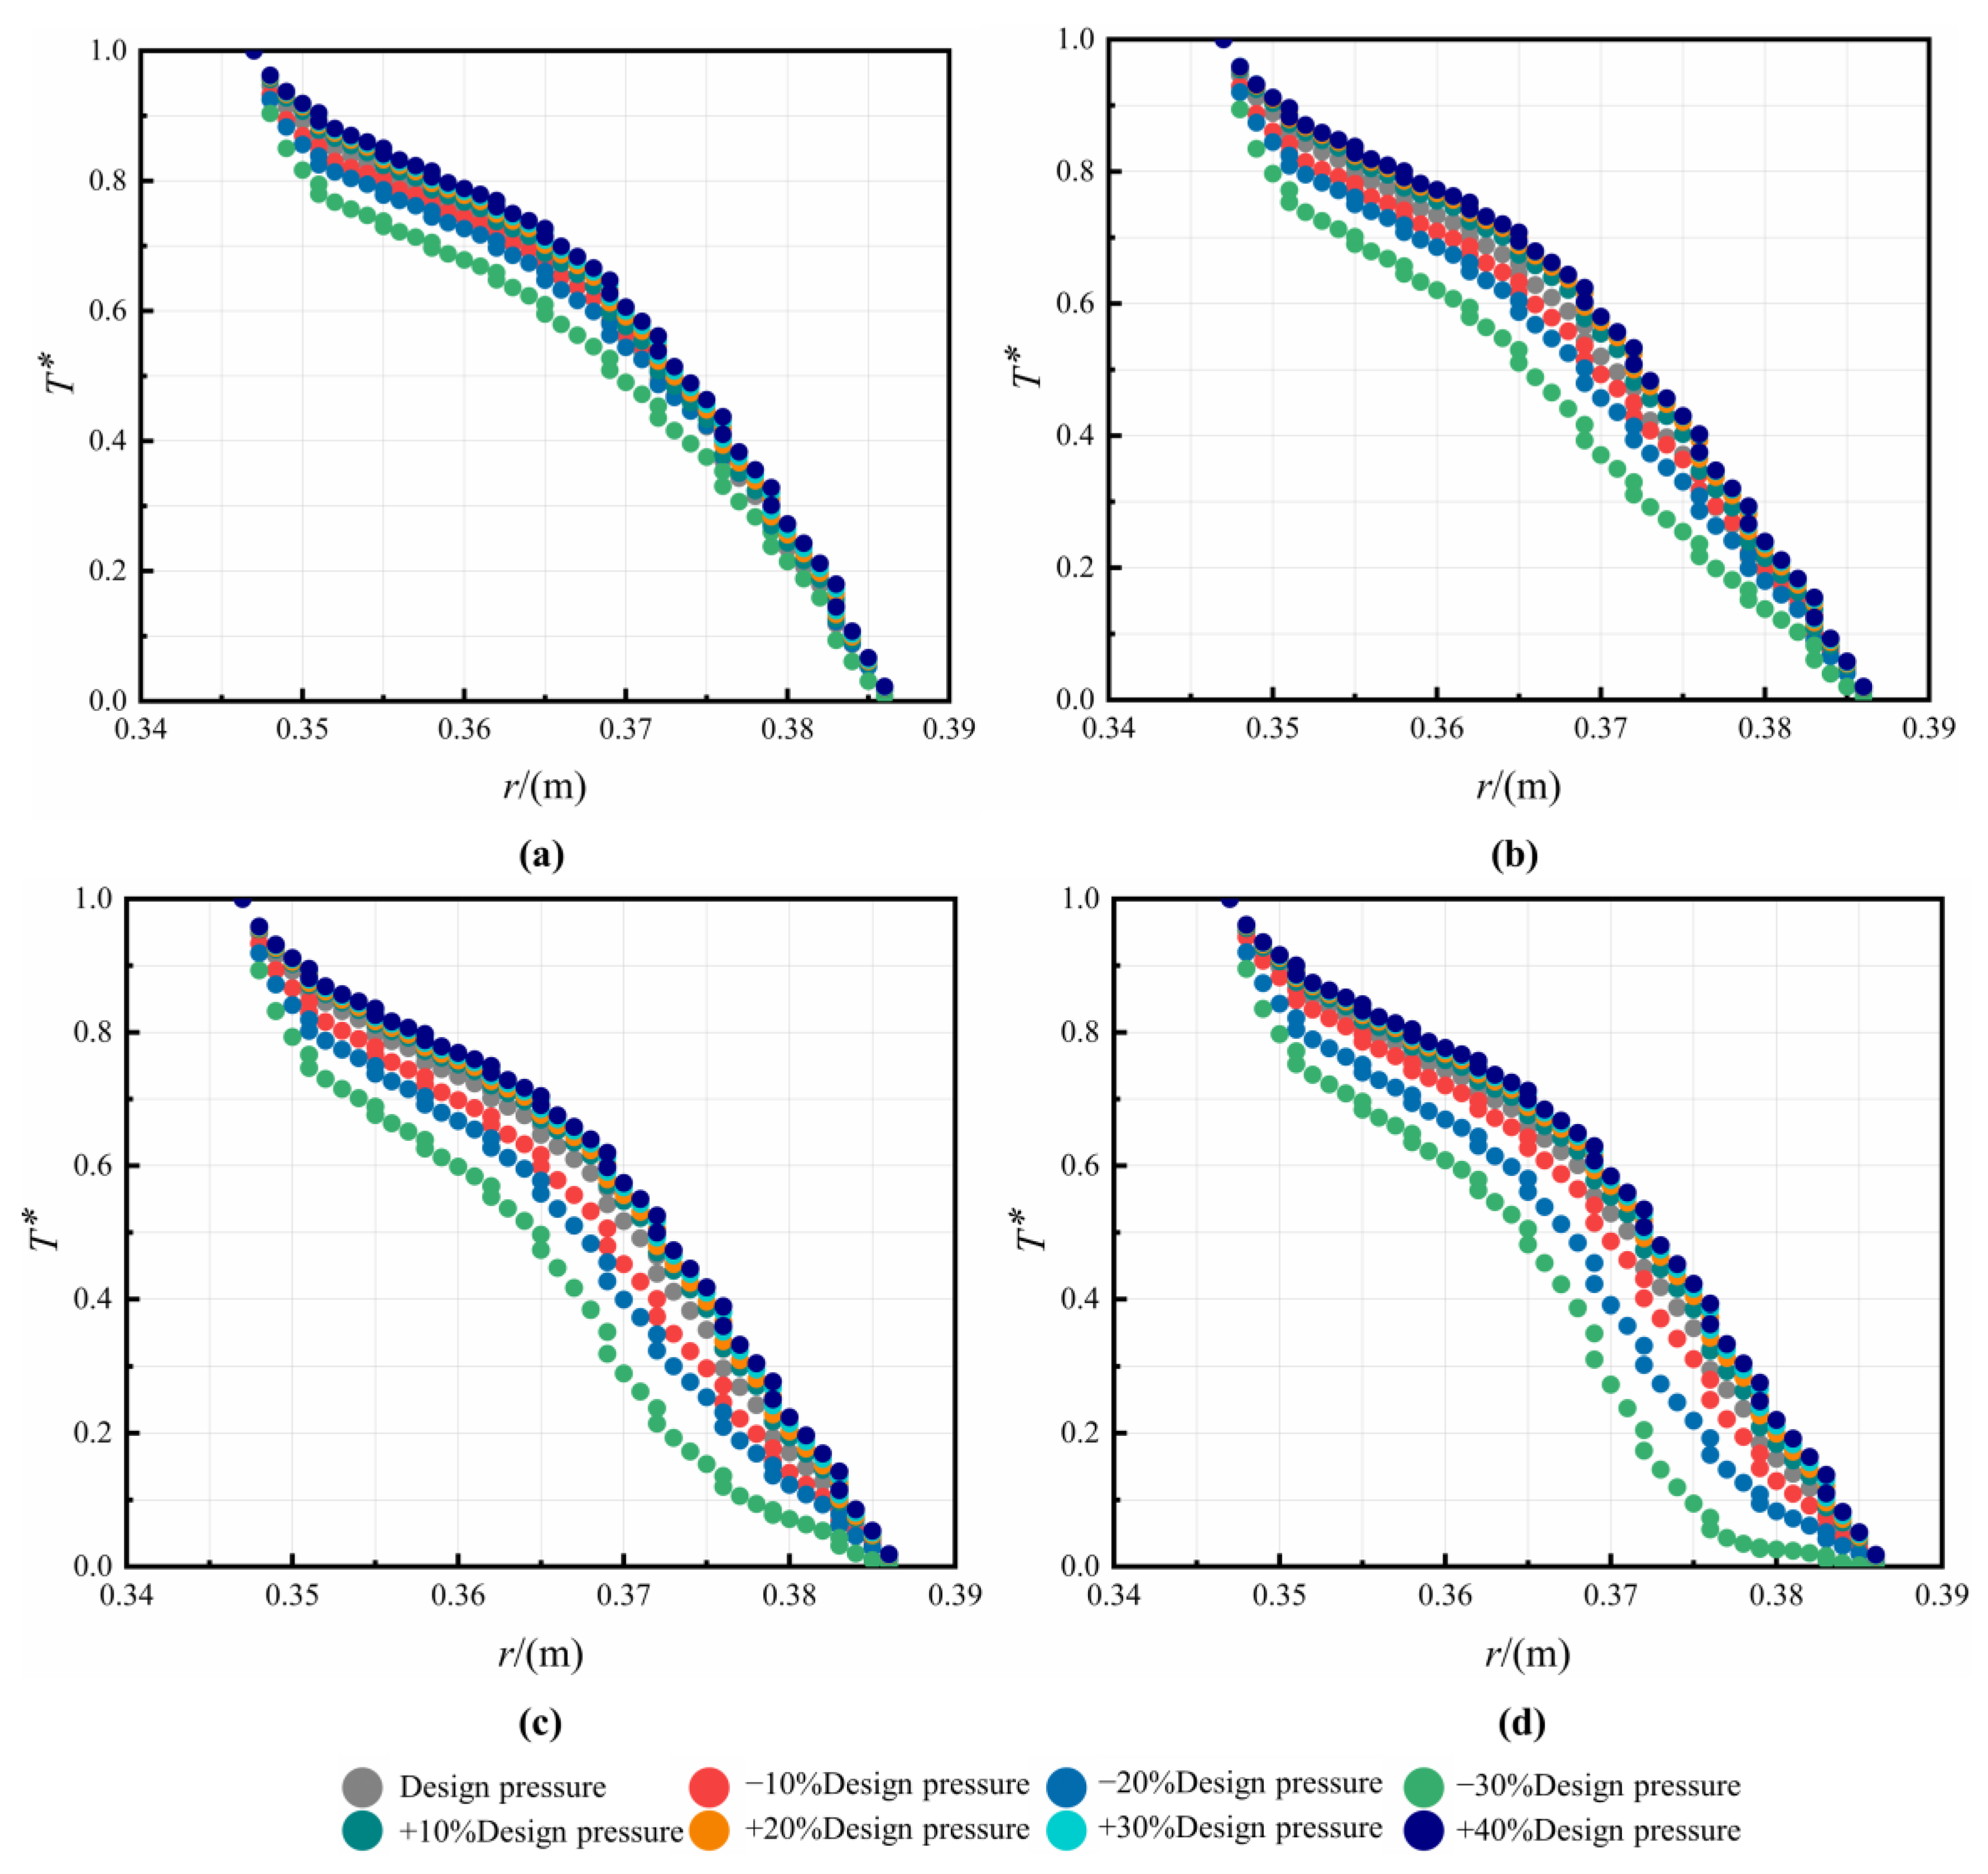
4.2.3. Cooling Effects of the Cavity Flow

The temperature distribution on the meridional surface at different inlet pressures for Re = 9.5172 × 10⁵ is depicted in Figure 15. From the figure, the whole temperature in the cavity decreases with increasing p i n ,   t o t a l . In the C1 cavity, the effects of p i n ,   t o t a l on temperature becomes weaker when p i n ,   t o t a l exceeds 1.1. In the C3 cavity, there is a low-temperature region between the nozzle, receiving hole, and A2 labyrinth seal. It is a comprehensive influence of impingement cooling and swirl flow cooling. The temperature at the outlet of receiving hole drops with increasing p i n ,   t o t a l as well. This indicates that increasing p i n ,   t o t a l enhances the cooling effect on the turbine blade.
In Figure 16, the radial distribution of T* in the C1 cavity at different Re is depicted. It can be observed that T* in the C1 cavity has a general tendency to fall and then rise along the radial direction, and there is a low-temperature zone in the middle section of the cavity. As the nozzle inlet pressure increases, T* is negatively correlated at the high and low radius of the C1 cavity, but a positive correlation in the middle section, and the variation is greater in this area. When the speed increases, the relative velocity between the rotor and the gas decreases, this reduces the heat transfer effect of the gas on the rotor and causes an upward shift of the low-temperature zone. The temperature in the C3 cavity decreases in the radial direction, as shown in Figure 17. When the pre-swirl jet flow enters the C3 cavity, it is mixed with the cavity flow and then impinges on the rotor. With the increase of Re, the change of T* is small. On the other hand, the values of T* decrease up to 21.4% when the p i n ,   t o t a l decreases. This can be explained by the more intense impingement cooling and swirl flow cooling.
The change of ∆T* is plotted versus p i n ,   t o t a l in Figure 18. For different Re, the values of ∆T* increase with increasing p i n ,   t o t a l , which indicates better cooling performances. When the nozzle inlet pressure is fixed, the values of ∆T* decrease with the increase of Re.

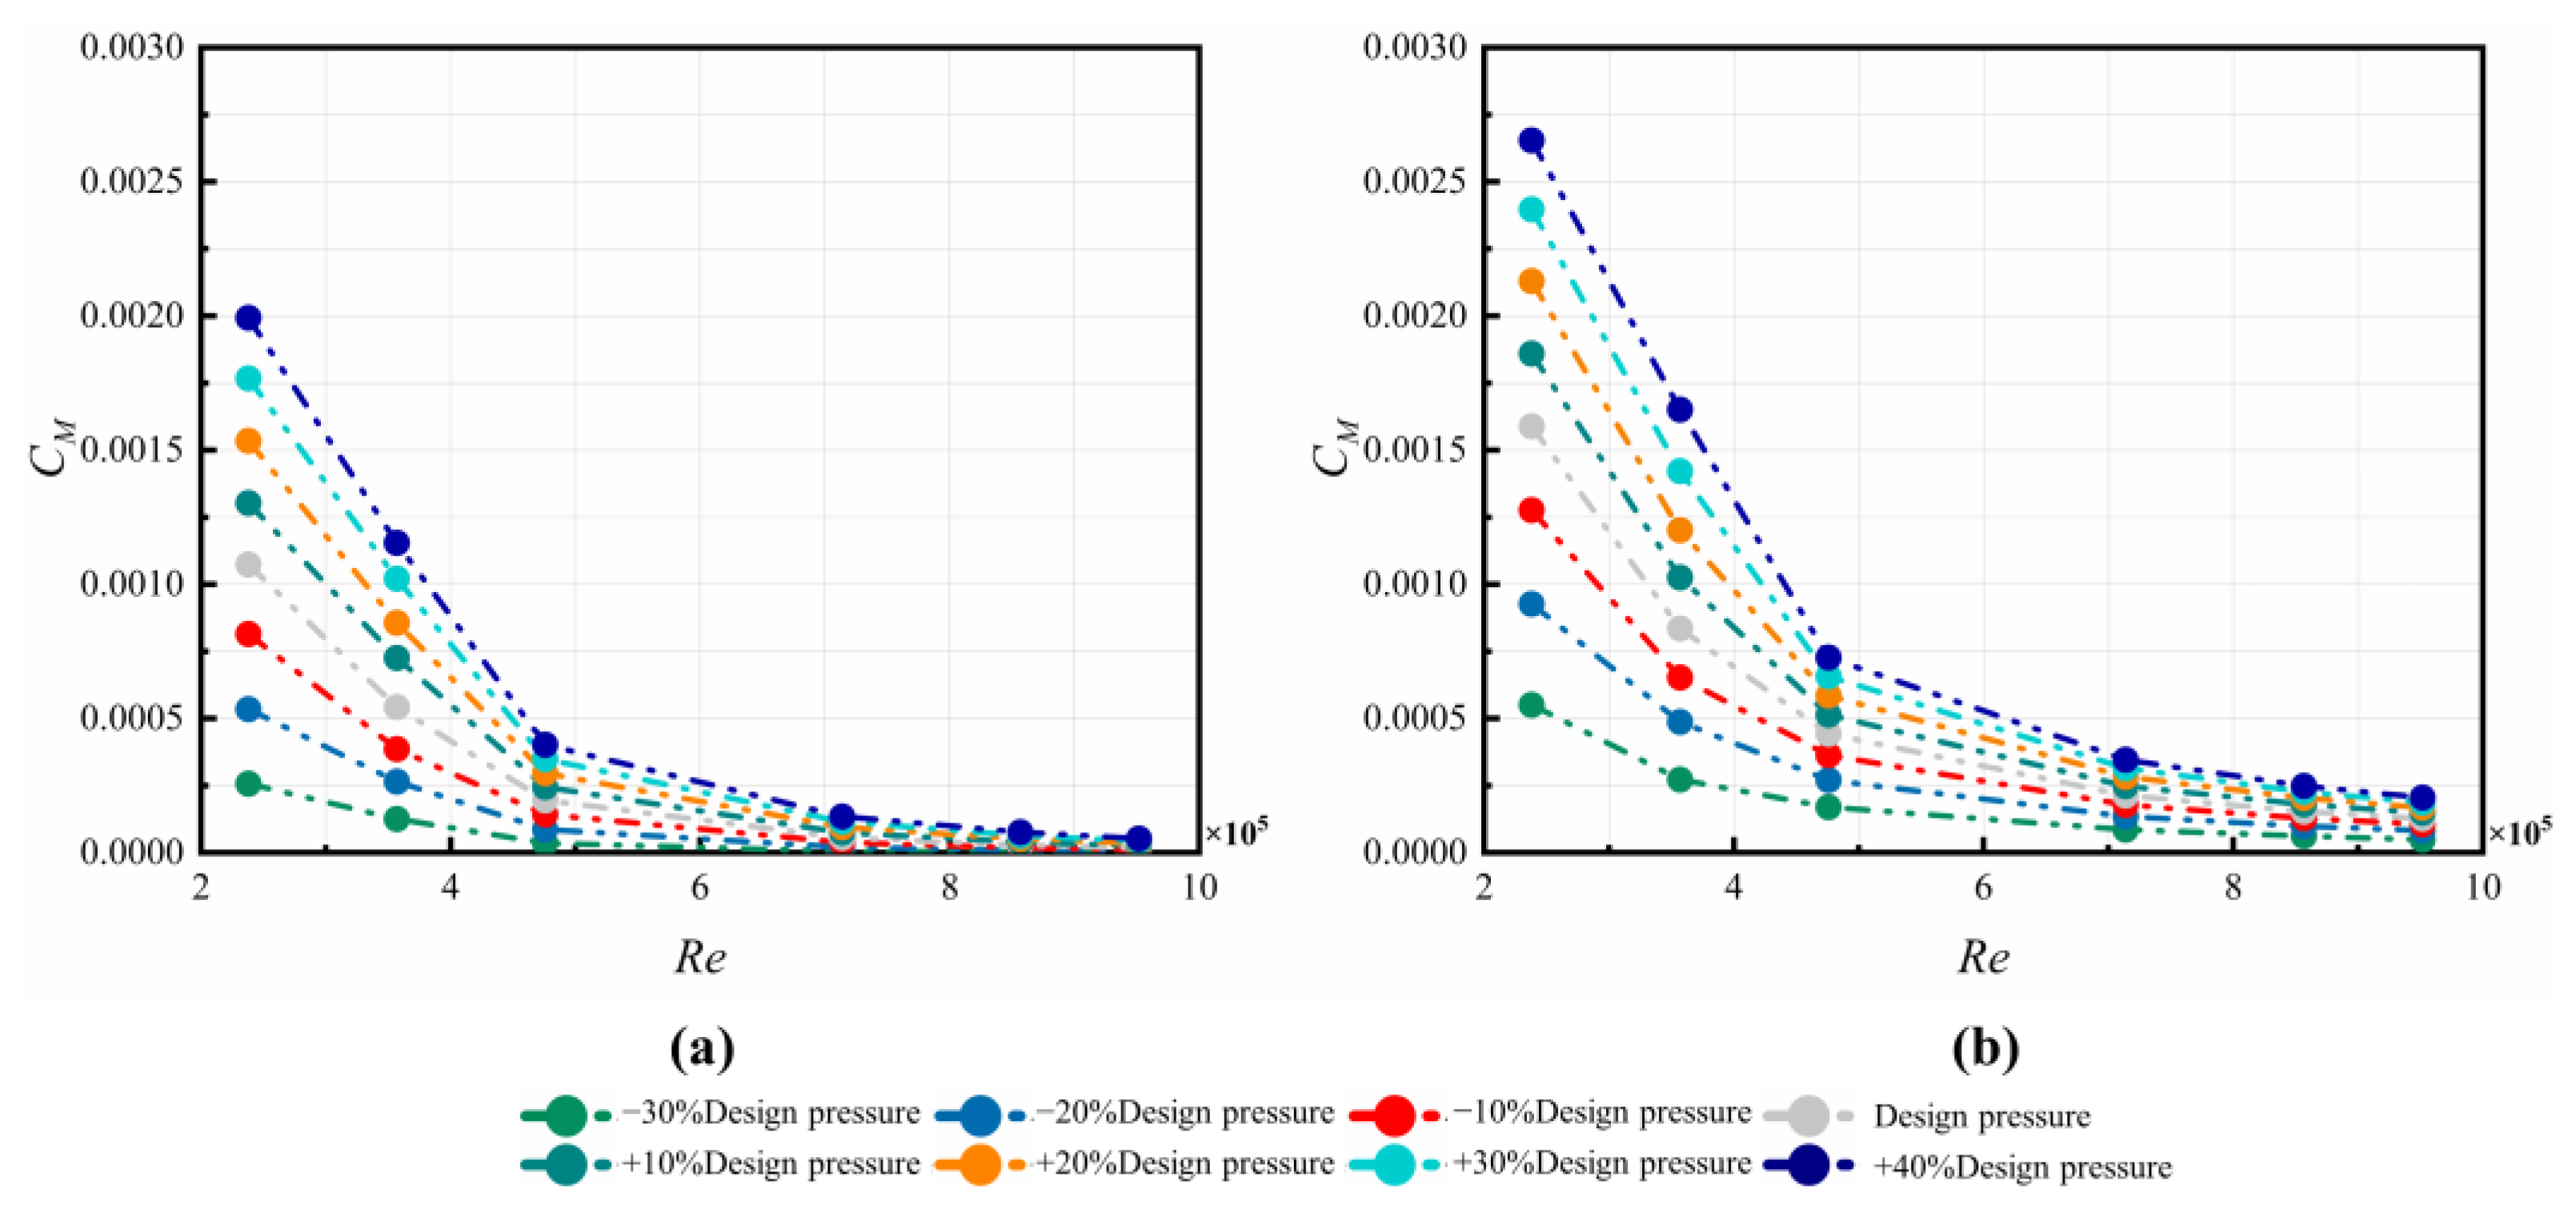
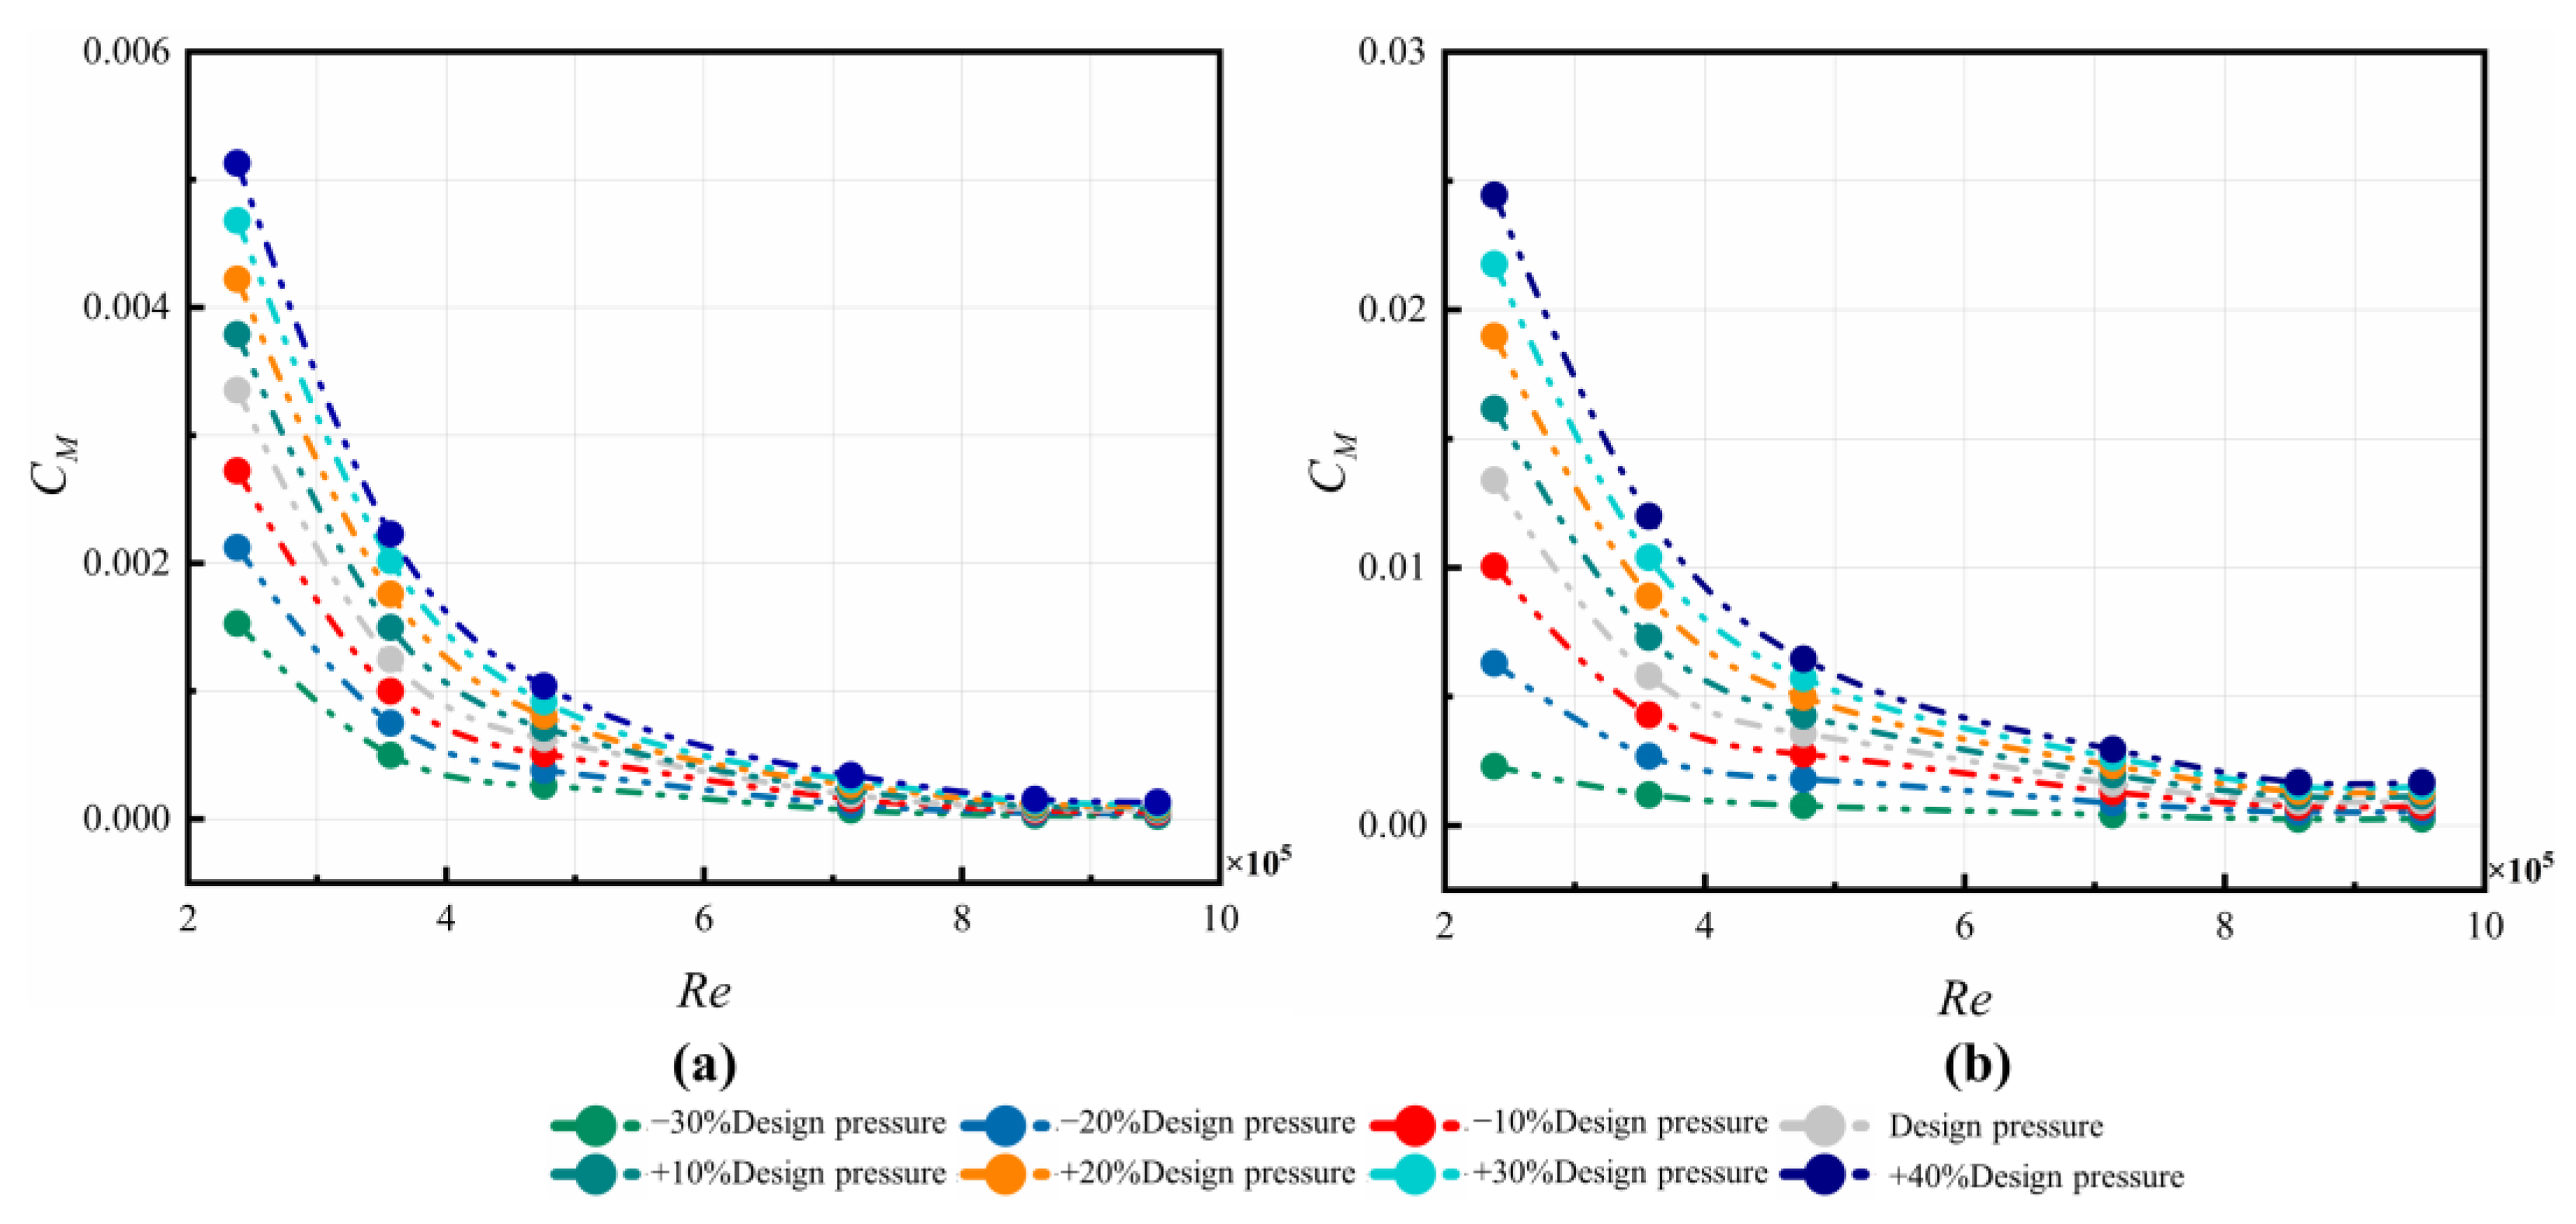
4.2.4. Moment Coefficient CM

The moment coefficients of the C1 cavity are compared in Figure 19 with increasing Re. The decreasing trend is similar to the experimental results by Hu et al. [38,39]. The results also show that the flow resistance on the stationary wall is larger than those on the rotor, which should not be neglected. Meanwhile, the variation of p i n ,   t o t a l has a larger influence on the values of CM on the stationary wall than those on the rotor.
Figure 20 shows the variation of different inlet pressures in the C3 cavity on the moment coefficients of the rotor and stator, respectively. It can be observed that the CM values of the rotor decrease as Re increases. The trend is similar to the trend of the rotor–stator cavity with either centrifugal or centripetal through-flow [38,39]. Meanwhile, the moment coefficient of the stator is up to 75% larger than that of the rotor. With increasing p i n ,   t o t a l , the values of C M obviously rise. This is because more work has to be performed on the cavity flow by the rotating disk with a more mass flow rate through the nozzle. With regard to the stator, the tangential velocity increases with increasing p i n ,   t o t a l , which contributes to larger wall shear stress. Unlike those on the stator, the values of C M on the rotor are almost not influenced by p i n ,   t o t a l at the maximum value of Re. The parameter of C M on the stator are more sensitive to p i n ,   t o t a l than those on the rotor.

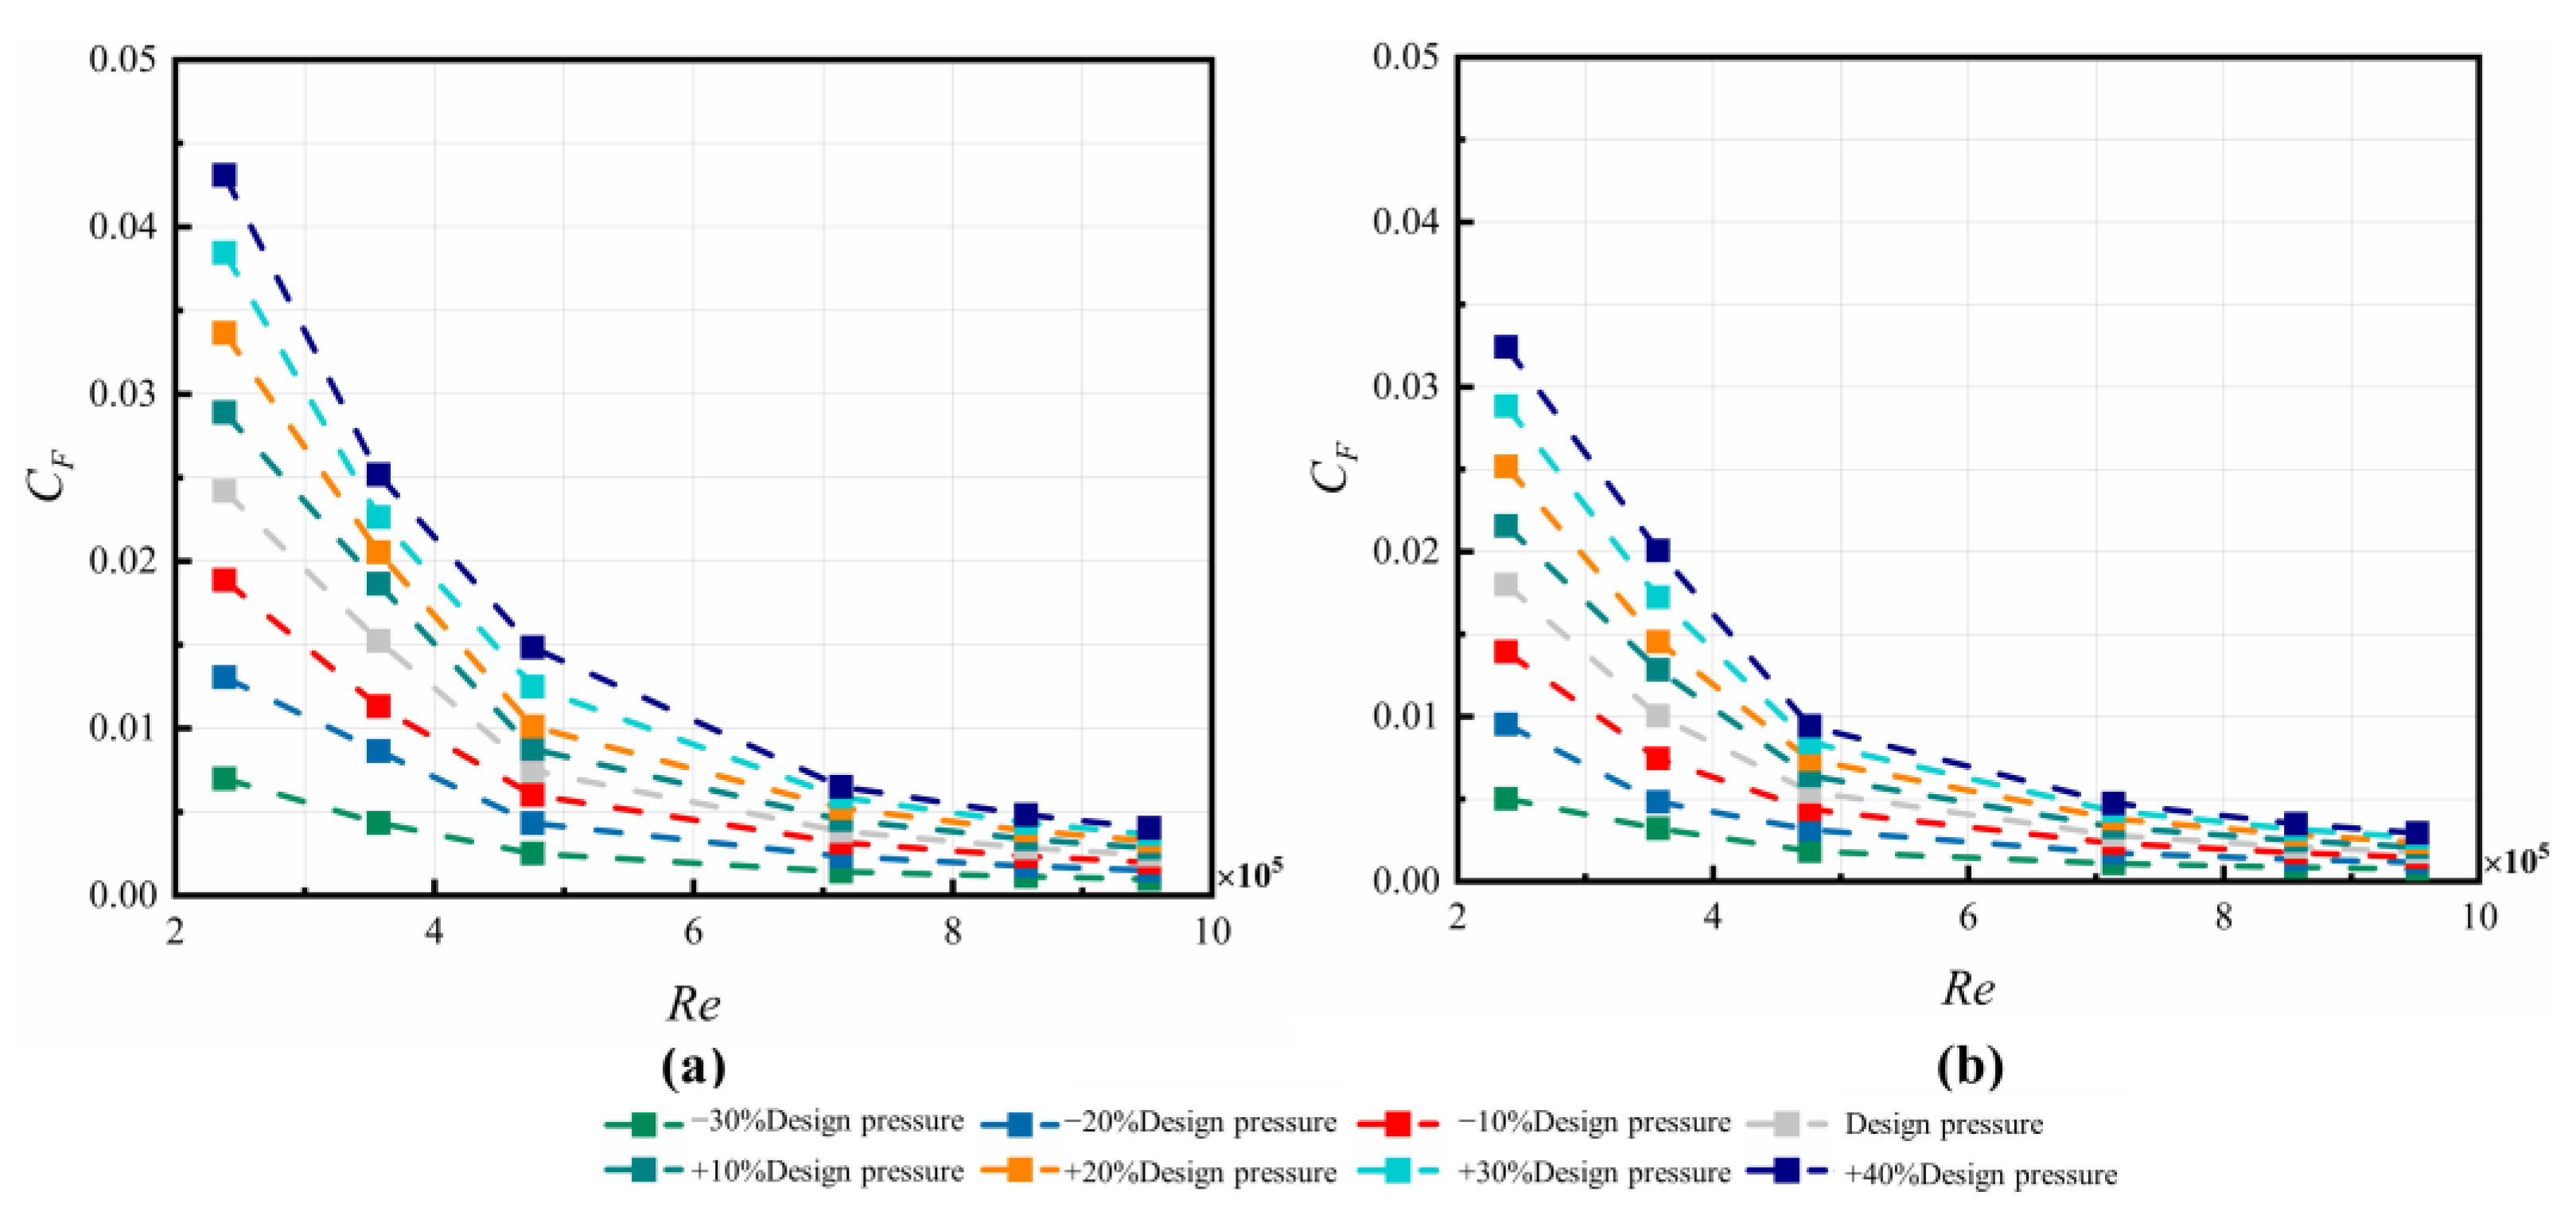
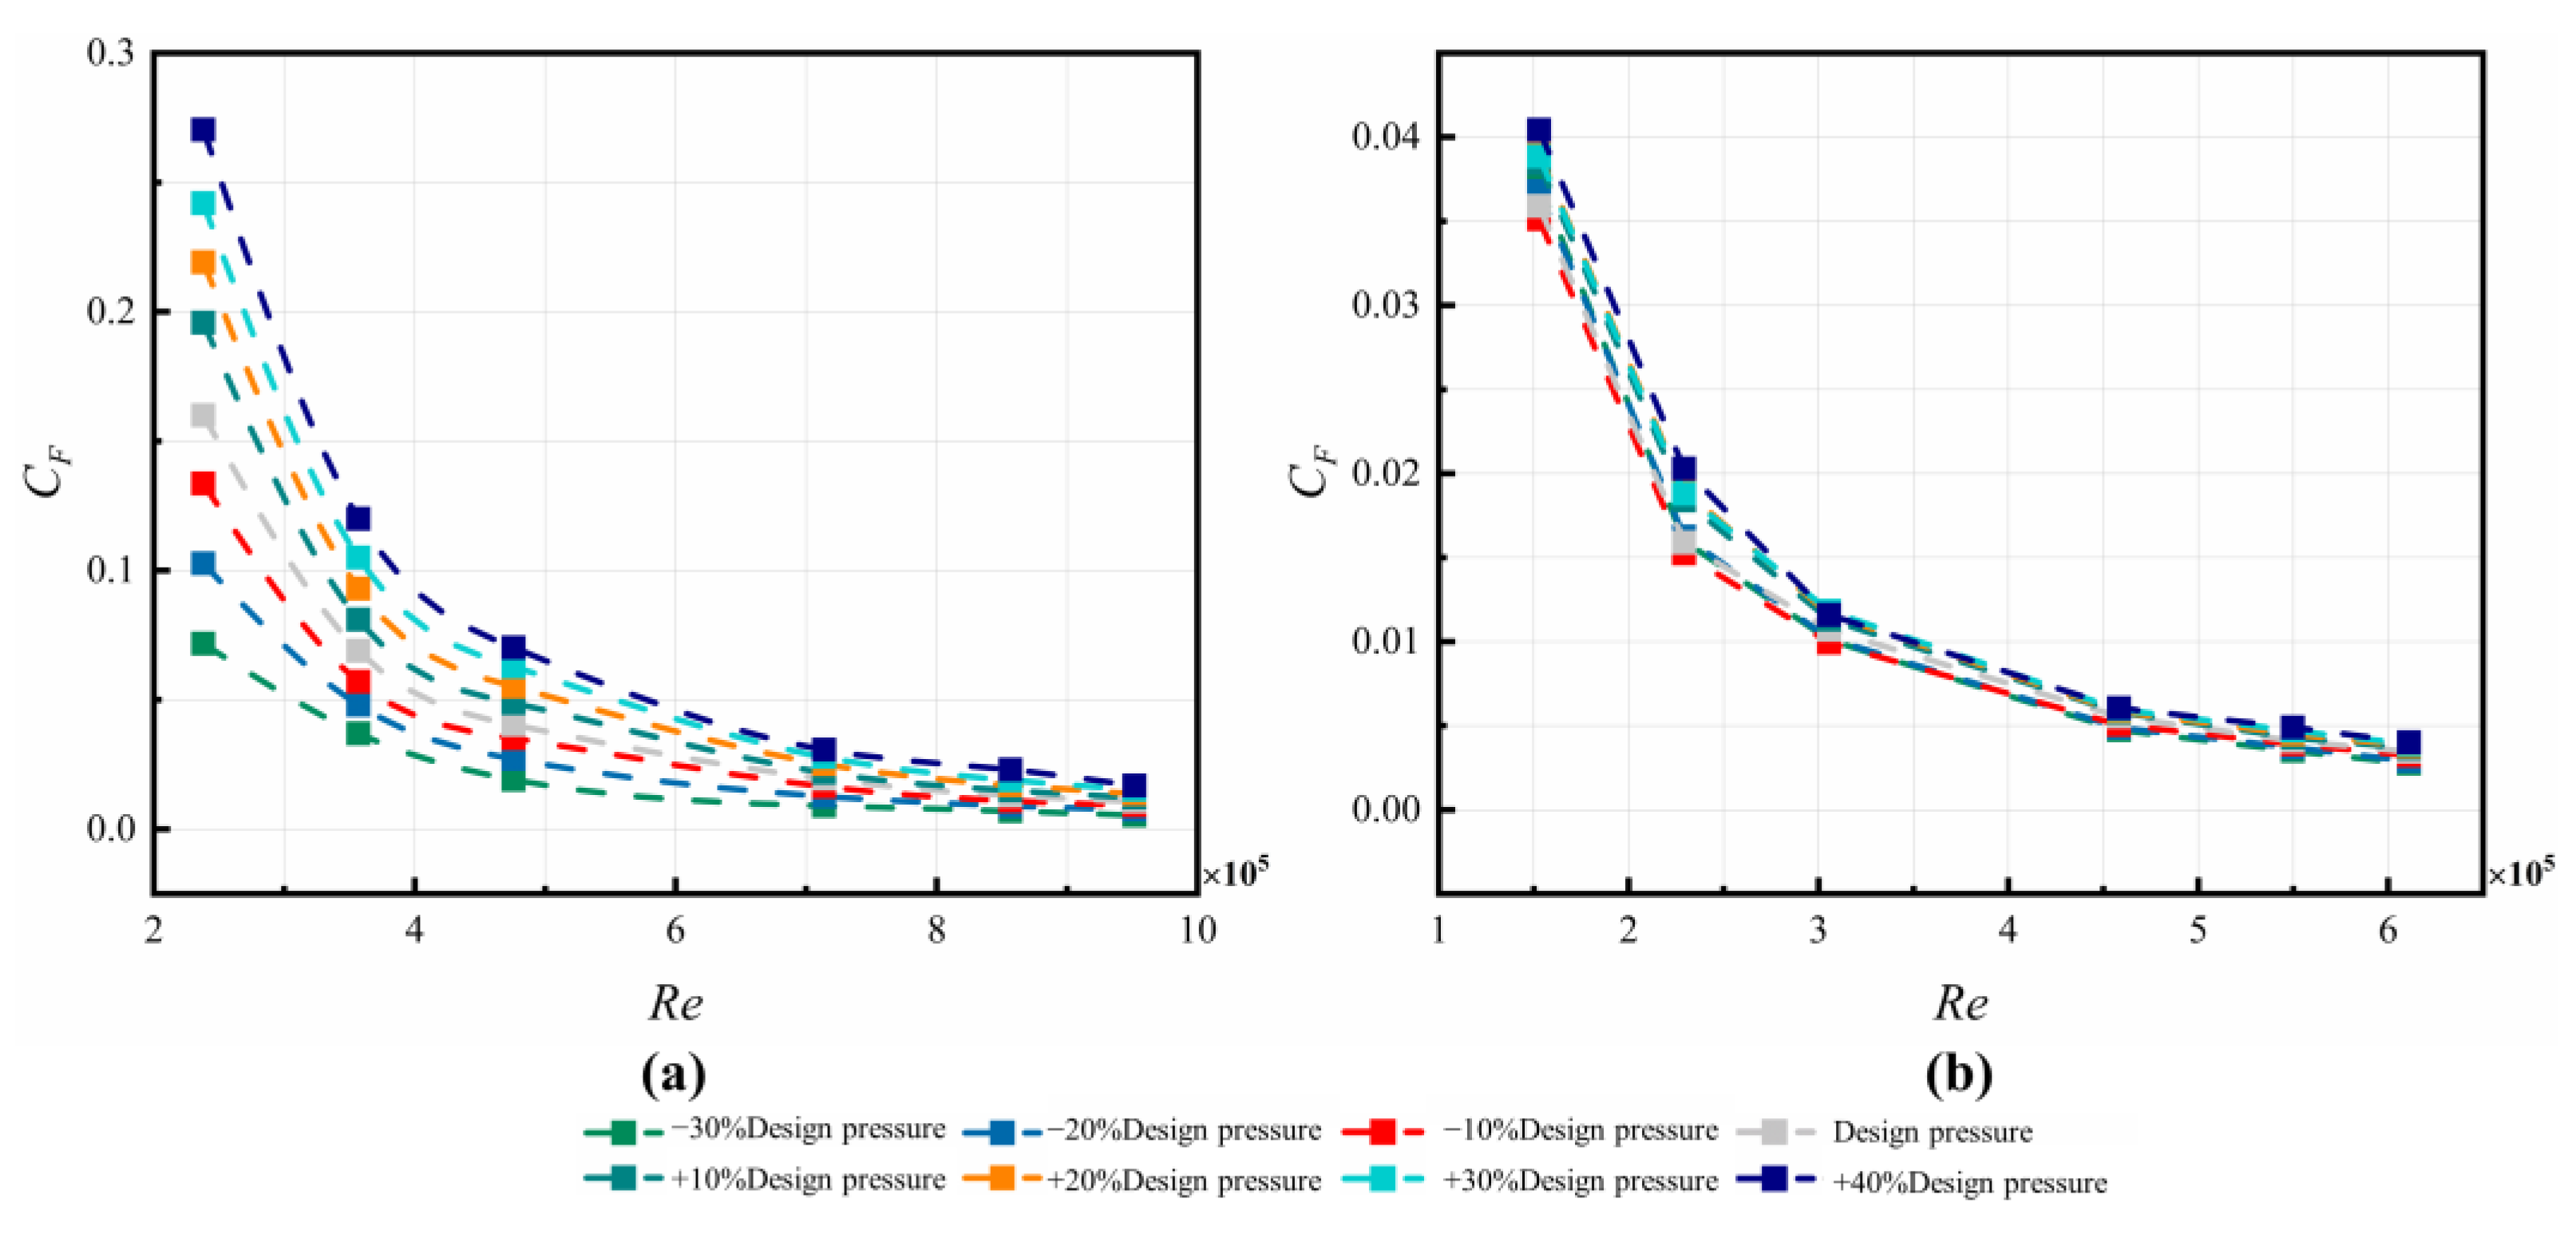
4.2.5. Axial Thrust Coefficient CF

The variations of CF in the C1 cavity are depicted in Figure 21. The values drop with increasing Re or with increasing p i n ,   t o t a l . The variations of CF in the C3 cavity for different Re and different p i n ,   t o t a l are made in Figure 22. As for the rotor, the CF decreases with increasing Re, with an average reduction of 73%; meanwhile, it increases with increasing p i n ,   t o t a l . Increasing p i n ,   t o t a l results in the rise of CF on both the rotor and the stator, although the influence is much weaker on the stator.

5. Conclusions

In this paper, the influence of p i n ,   t o t a l (70−140% of design values) on the flow characteristics and performance of a disk cavity at Re = 2.3793 × 10⁵ to 9.5172 × 10⁵ are numerically studied. Some conclusions are as follows:
  • To better predict the distribution of K between the inner seal and nozzle, the empirical formula for K in the literature was extended by adding a leakage flow term.
  • The variation of T* in the pre-swirl rotor–stator cavity is mainly influenced by convective heat transfer and impingement cooling. As the nozzle inlet pressure increases, T* is negatively correlated at both the high and low radii of the C1 cavity. The values of T* in the C3 cavity decrease along the radial direction, with a relative increment of up to 21.4% for different inlet pressures.
  • The current disk cavity shows relatively good performance at low speeds of rotation. Firstly, the flow rate coefficient of the receiving hole is not positively correlated with p i n ,   t o t a l . Increasing p i n ,   t o t a l may cause excessive flow resistance due to the backflow in the receiving hole. Secondly, the pre-swirl system has a good cooling effect on the C3 cavity at low rotation speeds. Thirdly, when the p i n ,   t o t a l values exceed the design values, the performance of the pre-swirl system decreased, which lowered the cooling ability of the turbine blades.
  • The moment coefficient and axial thrust coefficient show decreasing trend as Re increases. Increasing p i n ,   t o t a l causes the rise of CM and CF, which cause additional frictional losses and have a negative influence on the bearing systems.

Author Contributions

Conceptualization, B.H. and C.W.; methodology, Y.Y.; software, Y.Y.; validation, M.W., B.H. and Y.L.; formal analysis, Y.Y.; investigation, B.H.; resources, M.W.; data curation, Y.L.; writing—original draft preparation, Y.Y.; writing—review and editing, B.H.; visualization, M.W.; supervision, C.W.; project administration, Y.L.; funding acquisition, B.H. All authors have read and agreed to the published version of the manuscript.

Funding

This study is supported by the National Science and Technology Major Project (J2019-IV-0022-0090) and Natural Science Foundation of China No. 52206047.

Data Availability Statement

Data on the analysis and reporting results during the study can be obtained by contacting the authors.

Conflicts of Interest

The authors declare no conflict of interest.

Nomenclature

ANozzle outlet area, m2
ArRotor surface area, m2
AsStator surface area, m2
AHub radius, m
BOuter radius of the disk, m
CdFlow rate coefficient
CFAxial thrust coefficient
CMMoment coefficient
CpPressure coefficient
cpIsobaric specific heat capacity
CqrLocal flow rate coefficient
dbReceiving hole diameter, m
dpNozzle hole diameter, m
KCore swirl ratio
KpCore swirl ratio at nozzle
KAdiabatic exponent of gas, k = 1.4
MFriction torque, N·m
MrRotor surface torque
MsStator surface torque
MActual mass flow rate, kg/s
miIsentropic mass flow rate, kg/s
pPressure, Pa
pbPressure at r = b, Pa
pin*Total pressure at inlet, Pa
pn,tTotal pressure at the pre-swirl nozzle, Pa
poutStatic pressure at outlet, Pa
pout*Total pressure at outlet, Pa
prStatic pressure at the receiving hole, Pa
p*Non-dimensional pressure
QVolumetric through-flow rate, m3/s
RAir constant, R = 287
ReGlobal circumferential Reynolds number
ReφLocal circumferential Reynolds number
RRadial coordinate, m
rbReceiving hole to position, m
rpNozzle radial position, m
sAxial gap of the front cavity, m
TTemperature, K
T*Non-dimensional temperature
T*Non-dimensional temperature drop
T1*Inlet total temperature, K
Tin*Total temperature at the inlet of the pre-swirl nozzle, K
Tout*Relative total temperature at the main outlet of the system, K
TmaxMaximum temperature in the cavity, K
TminMinimum temperature in the cavity, K
V1φInlet tangential velocity, m/s
V2φOutlet tangential velocity, m/s
xNon-dimensional radial coordinate, x = r/b
Vφ,r=riTangential velocity at r = ri m/s
Greek symbols
ρDensity of air, kg/m3
μAerodynamic viscosity, N·s/m2
υKinematic viscosity, m2/s
ζNon-dimensional pressure drop
θInlet angle of pre-swirl nozzle,°
ωAngular velocity of the disk, rad/s
Subscripts
xcircumferential
yradial
zaxial

References

  1. El-Oun, Z.; Owen, J. Pre-Swirl Blade-Cooling Effectiveness in an Adiabatic Rotor-Stator System. J. Turbomach. 1989, 111, 522–529. [Google Scholar] [CrossRef]
  2. Chew, J.; Hills, N.; Khalatov, S.; Scanlon, T.; Turner, A. Measurement and Analysis of Flow in a Pre-Swirled Cooling Air Delivery System. In Proceedings of the Turbo Expo: Power for Land, Sea, and Air, Atlanta, GA, USA, 16–19 June 2003. [Google Scholar] [CrossRef]
  3. Chew, J.; Ciampoli, F.; Hills, N.; Scanlon, T. Pre-Swirled Cooling Air Delivery System Performance. In Proceedings of the Turbo Expo: Power for Land, Sea, and Air, Reno-Tahoe, NV, USA, 6–9 June 2005. [Google Scholar] [CrossRef]
  4. Ciampoli, F.; Chew, J.; Shahpar, S.; Willocq, E. Automatic Optimization of Pre-swirl Nozzle Design. J. Eng. Gas Turbines Power 2007, 129, 387–393. [Google Scholar] [CrossRef]
  5. Lewis, P.; Wilson, M.; Lock, G.; Owen, J. Effect of Radial Location of Nozzles on Performance of Pre-Swirl Systems. In Proceedings of the Turbo Expo: Power for Land, Sea, and Air, Berlin, Germany, 9–13 June 2008. [Google Scholar] [CrossRef]
  6. Javiya, U.; Chew, J.; Hills, N.; Scanlon, T. A Comparative Study of Cascade Vanes and Drilled Nozzle Designs for Pre-Swirl. In Proceedings of the Turbo Expo: Turbine Technical Conference and Exposition, Vancouver, BC, Canada, 6–10 June 2011. [Google Scholar] [CrossRef]
  7. Zhang, F.; Wang, X.; Li, J. Numerical investigation of flow and heat transfer characteristics in radial pre-swirl system with different pre-swirl nozzle angles. Int. J. Heat Mass Transf. 2016, 95, 984–995. [Google Scholar] [CrossRef]
  8. Zhang, F.; Wang, X.; Li, J. Numerical investigation on the flow and heat transfer characteristics in radial pre-swirl system with different fillet radius at the junction of inlet cavity and nozzle. Appl. Therm. Eng. 2016, 106, 1165–1175. [Google Scholar] [CrossRef]
  9. Lee, H.; Lee, J.; Kim, D.; Cho, J. Optimization of pre-swirl nozzle shape and radial location to increase discharge coefficient and temperature drop. J. Mech. Sci. Technol. 2019, 33, 4855–4866. [Google Scholar] [CrossRef]
  10. Lee, J.; Lee, H.; Park, H.; Cho, G.; Kim, D.; Cho, J. Design optimization of a vane type pre-swirl nozzle. Eng. Appl. Comput. Fluid Mech. 2021, 15, 164–179. [Google Scholar] [CrossRef]
  11. Yang, X.; Ren, Z.; Li, X.; Ren, J.; Ligrani, P. Flow and heat transfer characteristics in a pre-swirl rotor-stator cavity. Int. J. Therm. Sci. 2022, 172, 107271. [Google Scholar] [CrossRef]
  12. Liu, G.; Gong, W.; Wu, H.; Pang, L.; Lin, A. Theoretical and experimental evaluation of temperature drop and power consumption in a cover-plate pre-swirl system for gas turbine cooling. Case Stud. Therm. Eng. 2021, 27, 101221. [Google Scholar] [CrossRef]
  13. Liu, G.; Zang, L.; Li, B.; Feng, Q. Investigation on Flow Characteristics and Temperature Drop of an Aerodynamic-Hole Typed Pre-Swirl Nozzle. J. Propuls. Technol. 2013, 34, 390–396. (In Chinese) [Google Scholar] [CrossRef]
  14. Liu, G.; Li, B.; Jiang, Z.; Zang, L. Effect of Pre-Swirl Angle on Flow Characteristics of Pre-Swirl Nozzle. J. Propuls. Technol. 2012, 33, 7. [Google Scholar] [CrossRef]
  15. Liu, G.; Zang, L.; Wu, W.; Feng, Q. Numerical Simulations on the Flow Characteristics of the Pre-Swirl Nozzles with Different Length-to-Diameter Ratios. J. Propuls. Technol. 2013, 34, 644–650. (In Chinese) [Google Scholar] [CrossRef]
  16. Hu, W.; Wang, S.; Mao, S. Numerical Study on Influence of pre-swirl nozzle radial angles on pre-swirl Characteristic. J. Aerosp. Power 2019, 34, 8. (In Chinese) [Google Scholar] [CrossRef]
  17. Lin, L.; Tan, Q.; Wu, K. Study of Flow Dynamics in Rotor-Stator Cavity with Low Radius Pre-swirl Inlet. J. Propuls. Technol. 2016, 37, 8. (In Chinese) [Google Scholar] [CrossRef]
  18. Cheng, S.; Gao, T.; Li, J. Numerical Study on Flow and Heat Transfer Characteristics in Rotor-Stator Cavity of Circular Hole Pre-swirl Nozzle. J. Eng. Therm. Energy Power 2016, 31, 59–66. (In Chinese) [Google Scholar] [CrossRef]
  19. Liu, Y.; Liu, G.; Wu, H.; Tian, S. Numerical Investigation on Flow characteristics of a Vane Shaped Hole Pre-swirl Nozzle. J. Propuls. Technol. 2016, 37, 7. (In Chinese) [Google Scholar] [CrossRef]
  20. Liu, Y.; Liu, G.; Kong, X.; Wang, Y. Experimental Testing and Numerical Analysis on Flow Characteristics and Cooling Performance for Two Vane Pre-Swirl Nozzles. J. Propuls. Technol. 2019, 10. (In Chinese) [Google Scholar] [CrossRef]
  21. Zhao, L.; Liu, G.; Wu, H.; Feng, Q.; Zheng, L. Experimental Investigation on the Temperature Drop of a Cover-plate Pre-swirl System. J. Eng. Thermophys. 2020, 41, 8. (In Chinese) [Google Scholar]
  22. Wu, H.; Feng, Q.; Liu, G.; Wang, Y. Entropy analysis of a Cover-Plate Pre-Swirl System. J. Propuls. Technol. 2016, 37, 2048–2054. (In Chinese) [Google Scholar] [CrossRef]
  23. Wang, S.; Zhu, Q.; Luan, H.; Zhang, Y. Experimental study on heat transfer in rotor-stator cavity with high-positioned pre-swirl inflow. J. Aerosp. Power 2007, 22, 1216–1221. (In Chinese) [Google Scholar] [CrossRef]
  24. Wang, S.; Zhu, Q.; Zhang, Y.; Luan, H.; Huang, A. Numerical studies of heat transfer in a rotor-stator cavity with different radial positions of pre-swirl inlet. J. Aerosp. Power 2007, 22, 1227–1232. (In Chinese) [Google Scholar] [CrossRef]
  25. Wang, C.N.; Yang, F.C.; Nguyen, V.T.T.; Vo, N.T. CFD analysis and optimum design for a centrifugal pump using an effectively artificial intelligent algorithm. Micromachines 2022, 13, 1208. [Google Scholar] [CrossRef]
  26. Damavandi, M.; Nejat, A. Flow Characteristics of Curved Rotor Stator Systems Using Large Eddy Simulation. Flow Turbul. Combust. 2019, 103, 111–140. [Google Scholar] [CrossRef]
  27. Liao, G.; Liu, L.; Zhang, F.; E, J.; Chen, J. A comparison of numerical investigations on the flow and heat transfer characteristics in the rotor-stator cavity. Appl. Therm. Eng. 2019, 162, 114231. [Google Scholar] [CrossRef]
  28. Jia, X.; He, L.; Zhang, H. Effect of turbine rotor disc vibration on hot gas ingestion and rotor-stator cavity flow. Aerosp. Sci. Technol. 2020, 98, 105719. [Google Scholar] [CrossRef]
  29. Schröder, T.; Dohmen, H.; Brillert, D.; Benra, F. Impact of Leakage Inlet Swirl Angle in a Rotor–Stator Cavity on Flow Pattern, Radial Pressure Distribution and Frictional Torque in a Wide Circumferential Reynolds Number Range. Int. J. Turbomach. Propuls. Power 2020, 5, 7. [Google Scholar] [CrossRef]
  30. Schröder, T.; Schuster, S.; Brillert, D. Experimental Investigation of Centrifugal Flow in Rotor–Stator Cavities at High Reynolds Numbers > 108. Int. J. Turbomach. Propuls. Power 2021, 6, 13. [Google Scholar] [CrossRef]
  31. Onori, M.; Hills, N. Reduced order modelling for a rotor-stator cavity using proper orthogonal decomposition. Comput. Fluids 2021, 216, 104818. [Google Scholar] [CrossRef]
  32. Lin, A.; Liu, G.; Wang, X.; Feng, Q. Comprehensive evaluations on performance and energy consumption of pre-swirl rotor–stator system in gas turbine engines. Energy Convers. Manag. 2021, 244, 114440. [Google Scholar] [CrossRef]
  33. He, Z.; Zhou, J.; Yang, C.; Li, B.; Qian, J. Unsteady numerical investigation on gas ingestion into the rotor-stator disk cavities of a 1.5-stage turbine. Aeronaut. J. 2022, 126, 1–18. [Google Scholar] [CrossRef]
  34. Shi, J.; Zhao, Z.; Song, W.; Jin, Y.; Lu, J. Numerical simulation analysis of flow characteristics in the cavity of the rotor-stator system. Eng. Appl. Comput. Fluid Mech. 2022, 16, 501–513. [Google Scholar] [CrossRef]
  35. Zhao, G.; Qiu, T.; Liu, P. Influence of Blade Fracture on the Flow of Rotor-Stator Systems with Centrifugal Superposed Flow. Aerospace 2022, 9, 106. [Google Scholar] [CrossRef]
  36. Ren, H.; Zhang, J.; Cheng, H.; Chai, J.; Fu, S. Experimental Investigation on Flow Characteristics in a Turbine Rotor-Stator Cavity with Inlet at Low Radius. J. Appl. Fluid Mech. 2022, 15, 73–84. [Google Scholar] [CrossRef]
  37. Barabas, B.; Clauss, S.; Schuster, S.; Benra, F.K.; Dohmen, H.J.; Brillert, D. Experimental and numerical determination of pressure and velocity distribution inside a rotor-stator cavity at very high circumferential Reynolds numbers. In Proceedings of the 11th European Conference on Turbomachinery Fluid Dynamics and Thermodynamics, Madrid, Spain, 23–27 March 2015. [Google Scholar]
  38. Hu, B.; Brillert, D.; Dohmen, H.; Benra, F. Investigation on the flow in a rotor-stator cavity with centripetal through-flow. Int. J. Turbomach. Propuls. Power 2017, 2, 18. [Google Scholar] [CrossRef] [Green Version]
  39. Hu, B.; Brillert, D.; Dohmen, H.; Benra, F. Investigation on thrust and moment coefficients of a centrifugal turbomachine. Int. J. Turbomach. Propuls. Power 2018, 3, 9. [Google Scholar] [CrossRef] [Green Version]
  40. Poncet, S.; Chauve, M.; Legal, P. Turbulent rotating disk flow with inward throughflow. J. Fluid Mech. 2005, 522, 253–262. [Google Scholar] [CrossRef]
  41. Poncet, S.; Chauve, M.; Schiestel, R. Batchelor versus Stewartson flow structures in a rotor-stator cavity with throughflow. Phys. Fluids 2005, 17, 075110. [Google Scholar] [CrossRef]
Figure 1. Sketch of pre-swirl rotor–stator cavity.
Machines 11 00068 g001
Figure 2. Domains and grids for numerical simulation. (a) Domains for numerical simulation; (b) Grids for numerical simulation.
Machines 11 00068 g002
Figure 3. Distribution of radial velocity at Re = 9.5172 × 10⁵ at different nozzle pressure: (a) −30% design pressure, (b) −20% design pressure, (c) −10% design pressure, (d) design pressure, (e) +10% design pressure, (f) +20% design pressure, (g) +30% design pressure, and (h) +40% design pressure.
Machines 11 00068 g003aMachines 11 00068 g003b
Figure 4. Radial distribution of core swirl ratio in C1 cavity at different Re: (a) Re = 2.3793 × 10⁵, (b) Re = 4.7586 × 10⁵, (c) Re = 7.1379 × 10⁵, and (d) Re = 9.5172 × 10⁵.
Machines 11 00068 g004aMachines 11 00068 g004b
Figure 5. Comparison of core swirl ratio in C3 cavity at: (a) Re = 2.3793 × 10⁵, (b) Re = 4.7586 × 10⁵, (c) Re = 7.1379 × 10⁵, and (d) Re = 9.5172 × 10⁵ [38,39,40,41].
Machines 11 00068 g005aMachines 11 00068 g005b
Figure 6. Pressure distribution of pre-swirl cavity at Re = 9.5172 × 10⁵ with different nozzle pressure: (a) −30% design pressure, (b) −20% design pressure, (c) −10% design pressure, (d) -design pressure, (e) +10% design pressure, (f) +20% design pressure, (g) +30% design pressure, and (h) +40% design pressure.
Machines 11 00068 g006aMachines 11 00068 g006b
Figure 7. Radial distribution of pressure coefficients in C3 cavity at different Re: (a) Re = 2.3793 × 10⁵, (b) Re = 4.7586 × 10⁵, (c) Re = 7.1379 × 10⁵, and (d) Re = 9.5172 × 10⁵.
Machines 11 00068 g007
Figure 8. Distribution of ζ at different Re.
Machines 11 00068 g008
Figure 9. Distribution of total pressure at the middle section in the pre-swirl nozzle at Re = 9.5172 × 10⁵ with different nozzle pressure: (a) −30% design pressure, (b) −20% design pressure, (c) −10% design pressure, (d) -design pressure, (e) +10% design pressure, (f) +20% design pressure, (g) +30% design pressure, and (h) +40% design pressure.
Machines 11 00068 g009
Figure 10. Pressure distribution in the pre-swirl nozzle at different axial positions (Re = 9.5172 × 10⁵).
Machines 11 00068 g010
Figure 11. Distribution of flow rate coefficients of pre-swirl nozzle at different Re.
Machines 11 00068 g011
Figure 12. Distribution of total pressure on the middle section of receiving hole at Re = 9.5172 × 10⁵ with different nozzle pressure: (a) −30% design pressure, (b) −20% design pressure, (c) −10% design pressure, (d) design pressure, (e) +10% design pressure, (f) +20% design pressure, (g) +30% design pressure, and (h) +40% design pressure.
Machines 11 00068 g012
Figure 13. Pressure distribution in the receiving hole at different axial positions (Re = 9.5172 × 10⁵).
Machines 11 00068 g013
Figure 14. Distribution of C d for receiving hole at different Re.
Machines 11 00068 g014
Figure 15. Temperature distribution of pre-swirl cavity at Re = 9.5172 × 10⁵ with different nozzle pressure: (a) −30% design pressure, (b) −20% design pressure, (c) −10% design pressure, (d) design pressure, (e) +10% design pressure, (f) +20% design pressure, (g) +30% design pressure, and (h) +40% design pressure.
Machines 11 00068 g015aMachines 11 00068 g015b
Figure 16. Radial distribution of non-dimensional temperature in C1 cavity for different Re: (a) Re = 2.3793 × 10⁵, (b) Re = 4.7586 × 10⁵, (c) Re = 7.1379 × 10⁵, and (d) Re = 9.5172 × 10⁵.
Machines 11 00068 g016aMachines 11 00068 g016b
Figure 17. Radial distribution of non-dimensional temperature in C3 cavity for different Re: (a) Re = 2.3793 × 10⁵, (b) Re = 4.7586 × 10⁵, (c) Re = 7.1379 × 10⁵, and (d) Re = 9.5172 × 10⁵.
Machines 11 00068 g017
Figure 18. Distribution of ∆T* at different Re.
Machines 11 00068 g018
Figure 19. Variations of CM in C1 cavity at different p i n ,   t o t a l and Re on: (a) rotor and (b) stator.
Machines 11 00068 g019
Figure 20. Variations of CM in C3 cavity at different p i n ,   t o t a l and Re on: (a) rotor and (b) stator.
Machines 11 00068 g020
Figure 21. CF distribution in the C1 cavity at different p i n ,   t o t a l and Re on the (a) rotor and (b) stator.
Machines 11 00068 g021
Figure 22. CF distribution in C3 cavity at different p i n ,   t o t a l and Re on the (a) rotor and (b) stator.
Machines 11 00068 g022
Table 1. Main geometric parameters.
ParameterValues
Hub radius a/b0.736
Outer radius of the disk b/b1
Axial gap of the front cavity s/b0.044
Diameter of air inlet channel dp/b0.011
Intake angle θ (°)20
Radius of inlet center rp/b0.096
Diameter of outlet channel db/b0.015
Radius of outlet center rb/b0.115
Table 2. Main parameters of different simulations.
Inlet Pressure of the Pre-Swirl NozzleRotational Speed/Maximum One
  • −30% design pressure
  • 12.5%
2.
−20% design pressure
2.
25%
3.
−10% design pressure
3.
37.5%
4.
Design pressure
4.
45%
5.
+10% design pressure
5.
50%
6.
+20% design pressure
7.
+30% design pressure
8.
+40% design pressure
Disclaimer/Publisher’s Note: The statements, opinions and data contained in all publications are solely those of the individual author(s) and contributor(s) and not of MDPI and/or the editor(s). MDPI and/or the editor(s) disclaim responsibility for any injury to people or property resulting from any ideas, methods, instructions or products referred to in the content.

