Article

Obstacle Detection by Autonomous Vehicles: An Adaptive Neighborhood Search Radius Clustering Approach

1
School of Automotive and Transportation Engineering, Hefei University of Technology, Hefei 230009, China
2
Discipline of Engineering and Energy, Murdoch University, Perth, WA 6150, Australia
3
School of Electrical Engineering and Automation, Hefei University of Technology, Hefei 230009, China
*
Author to whom correspondence should be addressed.
Machines 2023, 11(1), 54; https://doi.org/10.3390/machines11010054
Submission received: 22 November 2022 / Revised: 28 December 2022 / Accepted: 29 December 2022 / Published: 2 January 2023

Abstract

:
For autonomous vehicles, obstacle detection results using 3D lidar are in the form of point clouds, and are unevenly distributed in space. Clustering is a common means for point cloud processing; however, improper selection of clustering thresholds can lead to under-segmentation or over-segmentation of point clouds, resulting in false detection or missed detection of obstacles. In order to solve these problems, a new obstacle detection method was required. Firstly, we applied a distance-based filter and a ground segmentation algorithm, to pre-process the original 3D point cloud. Secondly, we proposed an adaptive neighborhood search radius clustering algorithm, based on the analysis of the relationship between the clustering radius and point cloud spatial distribution, adopting the point cloud pitch angle and the horizontal angle resolution of the lidar, to determine the clustering threshold. Finally, an autonomous vehicle platform and the offline autonomous driving KITTI dataset were used to conduct multi-scene comparative experiments between the proposed method and a Euclidean clustering method. The multi-scene real vehicle experimental results showed that our method improved clustering accuracy by 6.94%, and the KITTI dataset experimental results showed that the F1 score increased by 0.0629.

1. Introduction

Key technologies for autonomous driving can be outlined in three parts: perception; planning; and control. As autonomous driving technology evolves, lidar is becoming the key detection unit for the perception systems of autonomous vehicles, due to its ability to precisely detect range and angle information. The function of perception systems based on 3D lidar is to achieve obstacle detection from disordered point clouds: the obstacle detection results have been shown to directly influence the precision of motion planning and decision making [1,2,3,4,5,6]. Existing 3D point cloud processing methods are problematic, because they select improper clustering thresholds, which result in low detection accuracy; therefore, obstacle detection based on lidar is a promising prospect.
Obstacle detection methods based on lidar can be mainly classified as two types: point-cloud-clustering-based methods [7,8,9,10,11] and deep-learning-based methods [12,13].
The 3D point cloud data collected by lidar are in the form of discrete points, and these points, belonging to the same object, are distributed densely. Point cloud clustering groups together points that belong to the same obstacle, according to the three-dimensional coordinates and reflection intensity of the point cloud. There are four common point cloud clustering methods. Firstly, DBSCAN (Density-Based Spatial Clustering of Applications with Noise) is a density-based clustering method, which is suitable for point clouds of various shapes. Zhao et al. improved the traditional DBSCAN method, so as to obtain a dynamic clustering radius [14]. Wang et al. introduced the k-nearest neighbor concept, to calculate the clustering radius [15]. Although these methods could adjust the clustering threshold, compared to traditional DBSCAN, they did not consider the effect of minPts, and the presence of noise points reduced the clustering accuracy. Secondly, k-means is a clustering method that aims to divide the point cloud into k clusters. For the complex driving conditions of autonomous vehicles, it is impossible to specify the number of obstacles. Xia et al. proposed an improved k-means algorithm that could merge clusters with high similarity, and reduce over-segmentation; however, the initial value of k still needed to be set in advance [16]. In order to automatically set the value of k, Li et al. presented a method that took the number of locally dense regions ask; however, the process of searching for dense regions dramatically increased the computational burden, and reduced calculation speed. Moreover, the k-means method is not applicable to cluster point clouds with complex shapes [17]. Thirdly, the basic idea of the grid-based clustering method is that the 3D point cloud is divided into several 2D grids, and then the grids with similar attributes are connected. Wang et al. suggested an improved method based on grid mapping, which described moving obstacles using the grid conflict coefficient and the inconsistencies between multiple frames of the point cloud [18]. Xie et al. applied a multi-frame fusion method based on grid mapping, to detect moving obstacles, and used an obstacle template matching algorithm to detect static obstacles. Though this method could speed up obstacle detection, it was difficult to accurately distinguish adjacent obstacles, and large amounts of environmental information could be lost [19]. Fourthly, Euclidean clustering is a distance-based method: when the distance between two adjacent points is less than the given distance threshold, they are clustered into one cluster. This method is widely used in point cloud processing, because it can obtain good detection results for various objects. Yan et al. optimized the Euclidean clustering method, by the addition of a spatial distance threshold; however, the spatial distance threshold remained fixed [20]. Guo et al. introduced a weight coefficient, to redefine the calculation method of the clustering threshold, and adopted the octree structure to accelerate detection; nevertheless, the accuracy of obstacle detection was still not high [21]. To deal with the above problems, Wen et al. used features such as lidar angular resolution, to determine the adaptive threshold; however, the threshold was calculated based on the two-dimensional point cloud [22].
Many researchers have discovered that it is difficult to obtain satisfactory clustering results by applying only one clustering algorithm, and research on hybrid clustering algorithms has begun: for instance, grid mapping combined with the density-based clustering method [23], and the distance-based clustering method combined with the density-based clustering method [24]. However, these methods are too complex to guarantee real-time detection.
In recent years, deep learning models have been developed to process 3D point clouds for obstacle detection. A deep learning model called PointNet, which can directly take the origin 3D point cloud as input for detecting obstacles, has been developed by Ref. [25]. Aiming to make full use of local features to improve detection accuracy, Qi et al. put forward PointNet++ [26]. On the basis of this research, Shi S et al. also proposed a deep learning model called PointRCNN [27]. To obtain higher detection accuracy, a large number of training samples and computational resources are needed, to train the deep learning model; however, the computing resources of autonomous vehicles are limited, and it is difficult to deploy a deep learning framework effectively.
Current obstacle detection based on lidar mainly uses point cloud clustering methods. Setting clustering thresholds based on empirical values is a simple method, but it is difficult to accurately detect obstacles, such as pedestrians and vehicles with complex shapes [20,28]. Setting the point cloud clustering threshold based on the point cloud angle relationship is a method of determining the clustering threshold by considering the angle relationship between two adjacent points in the horizontal direction and the distance from the 3D point cloud to the lidar [22,23]. The point cloud is unevenly distributed in the vertical direction, and the distance between two adjacent points in the vertical direction increases steeply with the growth of the point cloud distance and pitch angle, so it is difficult to achieve accurate segmentation of the point cloud in the vertical direction by only determining the clustering threshold based on the angular relationship in the horizontal direction.
To solve the above problems, a new obstacle detection method, called adaptive neighborhood search radius clustering, is proposed in this paper. Based on the analysis of the irregular spatial distribution characteristics of the point cloud, we introduced the pitch angle of the point cloud, to determine the clustering threshold together with the horizontal angular resolution of lidar. We conducted comparative experiments, using the proposed method and the Euclidean clustering method [28], to validate the effectiveness of the proposed algorithm at improving detection accuracy.
The rest of the paper is organized as follows: in Section 2, the pre-processing and ground segmentation of the point cloud are discussed; in Section 3, the relationship between the clustering radius and the non-uniform spatial distribution of the point cloud, and the adaptive threshold clustering algorithm are presented; in Section 4, the proposed method is experimentally verified; finally, the whole paper is concluded in Section 5.

2. Data Pre-processing

2.1. Interference Points Removal

Interference points in the original point cloud will reduce the accuracy of obstacle detection. Points in the following three categories should be removed: (1) noise points caused by body vibration or electromagnetic interference, and outlier points caused by environmental factors such as falling leaves; (2) points far away from the lidar, as they are sparsely distributed and retain little environmental information; (3) points belonging to hanging obstacles. Filtering out these interference points will accelerate obstacle detection, and improve detection accuracy. To summarize, we only keep measurement points that satisfy the following conditions:
d m i n < x 2 + y 2 < d m a x
z < z m a x
where d m i n and d m a x are the minimum and maximum distance thresholds, respectively; d m a x is related to the effective detection distance of the lidar, and z m a x is the height threshold of a measurement point being judged as a hanging point. In this paper, d m i n , d m a x , and z m a x are set to be 2, 50 and 5 m.
Figure 1a shows the original point cloud without removing the interference points. After the removal of the above interference points, the pre-processed point cloud is obtained, as shown in Figure 1b.

2.2. Ground Segmentation

After removing the interference points, the remaining point cloud can be divided into two parts: the ground point cloud and the obstacle point cloud. The ground point cloud, which contains a large number of points, is only collected by scanning road surfaces. The obstacle point cloud typically consists of point cloud from cars, pedestrians, green spaces and buildings. Processing the ground point cloud will slow down detection speed, and shorten the decision-making time of the autonomous driving system. In addition, the existence of the ground point cloud will reduce the segmentation accuracy of the obstacle point cloud. Therefore, ground segmentation is required before obstacle detection.
Considering that the ground point cloud is evenly distributed, a ground segmentation algorithm that can be applied to the slope situation is used for ground segmentation, as follows [11]: firstly, three subspaces, including P 1 , P 2 and P 3 are separated along the direction of the vehicle driving from the point cloud P , after removal of the interference points; secondly, the points in subspace P i are rearranged in ascending order, to obtain P i * , and the sum of the height of the first N (50) points S u m H e i g h t and the average height A v e H e i g h t , respectively, are calculated; thirdly, every point p in P i * with a z-axis value less than A v e H e i g h t + Δ h is marked as an initial point and p is added into I n i t i a l S e t , while Δ h is the error threshold (1.6 m); finally, the plane fitting method, based on RANSAC, is applied separately, to extract the ground point cloud, P o n , using I n i t i a l S e t for each subspace:
a x + b y + c z + d = 0
C = i = 1 : n u m ( k i k ^ ) ( k i k ^ ) T
where a , b , c and d are the parameters of each subspace plane model, C is the covariance matrix, k i is the i t h point cloud in the seed point set k . As the low points are likely to be ground points, a set containing a certain number of lower points is selected to calculate the covariance matrix C. The dispersion of the seed set can be calculated by the singular value decomposition of C to obtain the normal vector of the ground plane in each subspace. The flow chart of the ground segmentation algorithm is shown in Algorithm 1.
Algorithm 1: Ground segmentation
Input: P (Point cloud)
Output: Pon (Ground point cloud), Poff (Obstacle point cloud)
1
2
3
4
5
6
7
8
9
10
11
12
13
14
15
16
17
18
19
   Split P into three sections along the direction of vehicle driving: P1, P2 and P3;
   Initialize Num, SumHeight, AveHeight, InitialSet;
   foreach pPoff do
             Pi is sorted by z - axis height value from lowest to highest to obtain Pi*;
       while Num < N do
             SumHeight = SumHeight + Pi*[num].z;
             Num = Num + 1;
       end
       AveHeight = SumHeight/N;
       foreach p  Pi* do
             if p.z <= AveHeight + h then
                  InitialSet = InitialSet {p};
             end
       end
       \\Use initial points for plane fitting;
       Pon = Pon ∪ PlaneFitting(InitialSet);
       Poff = P \ PlaneFitting(InitialSet);
   end
   return
The ground segmentation result is shown in Figure 2, while Figure 2a shows the ground point cloud, and Figure 2b shows the obstacle point cloud.

3. Adaptive Neighborhood Search Radius Clustering Algorithm

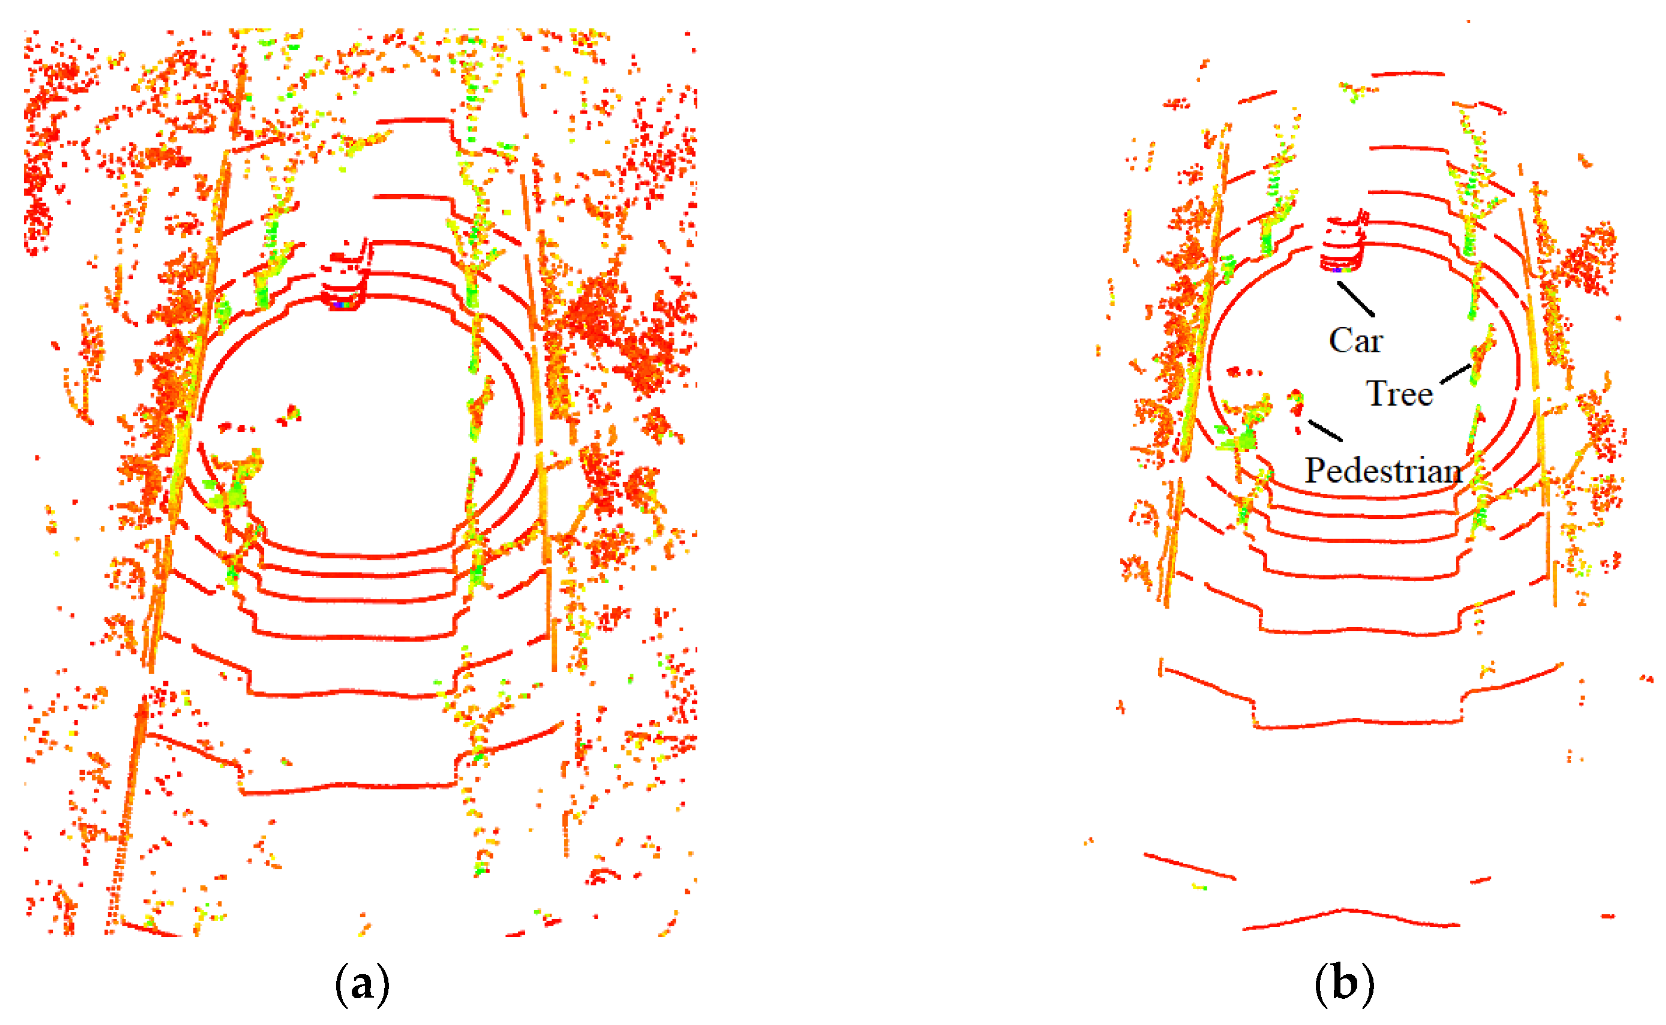
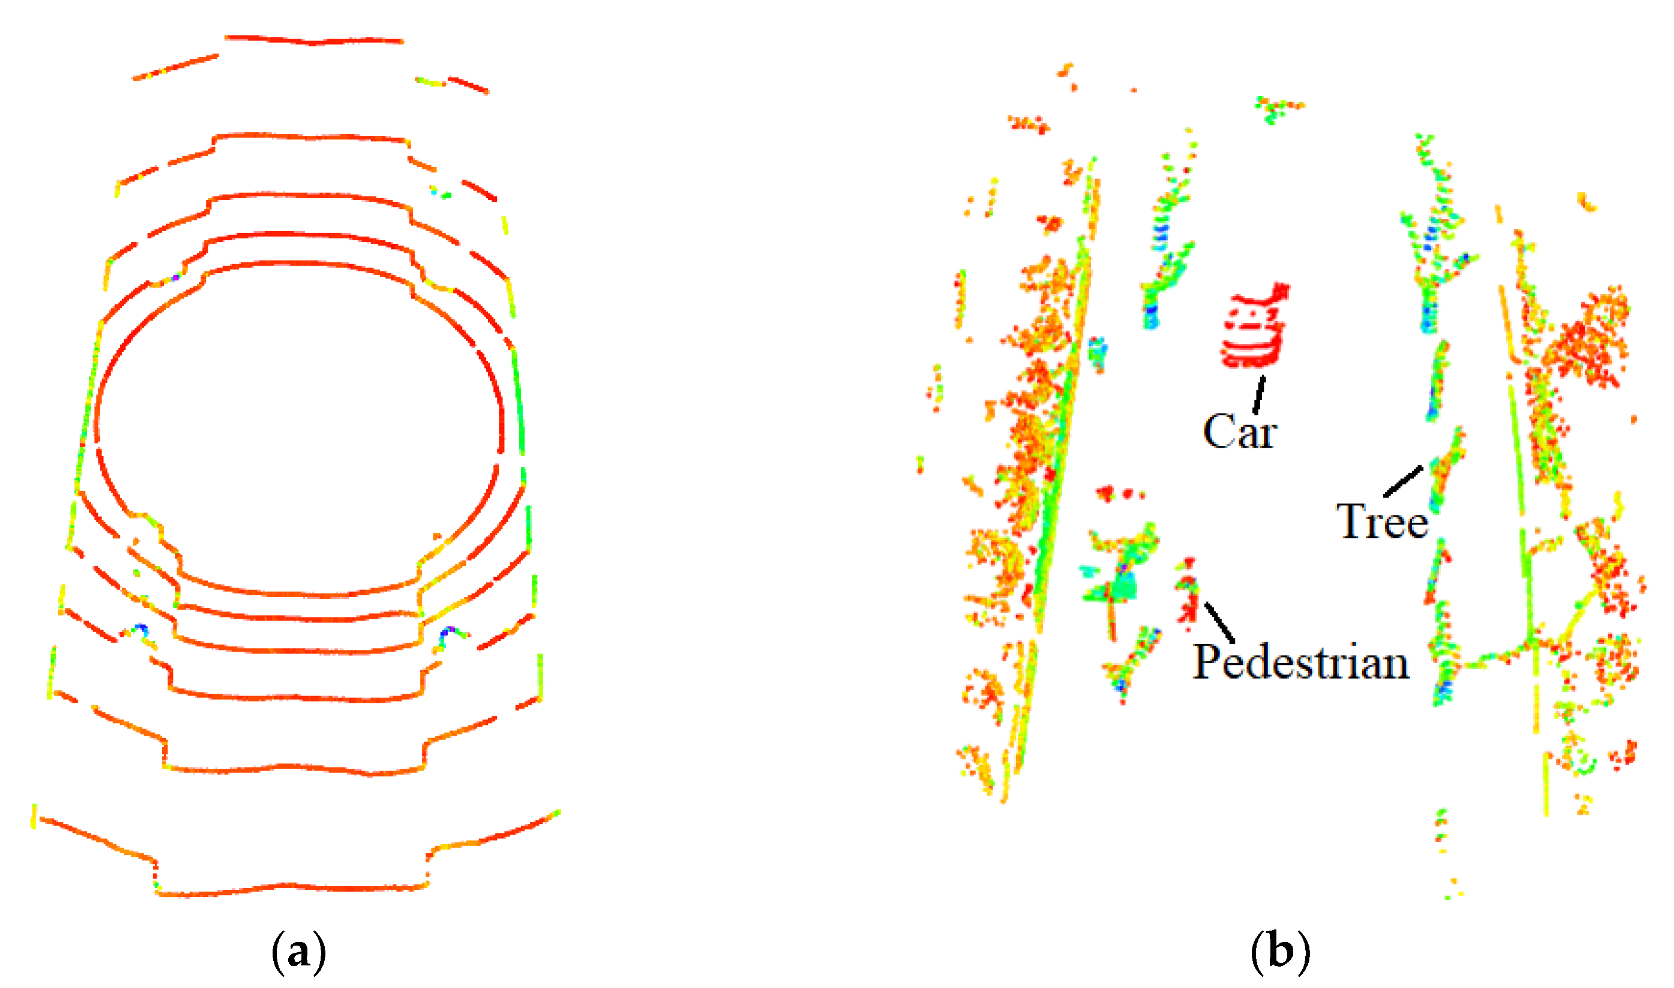
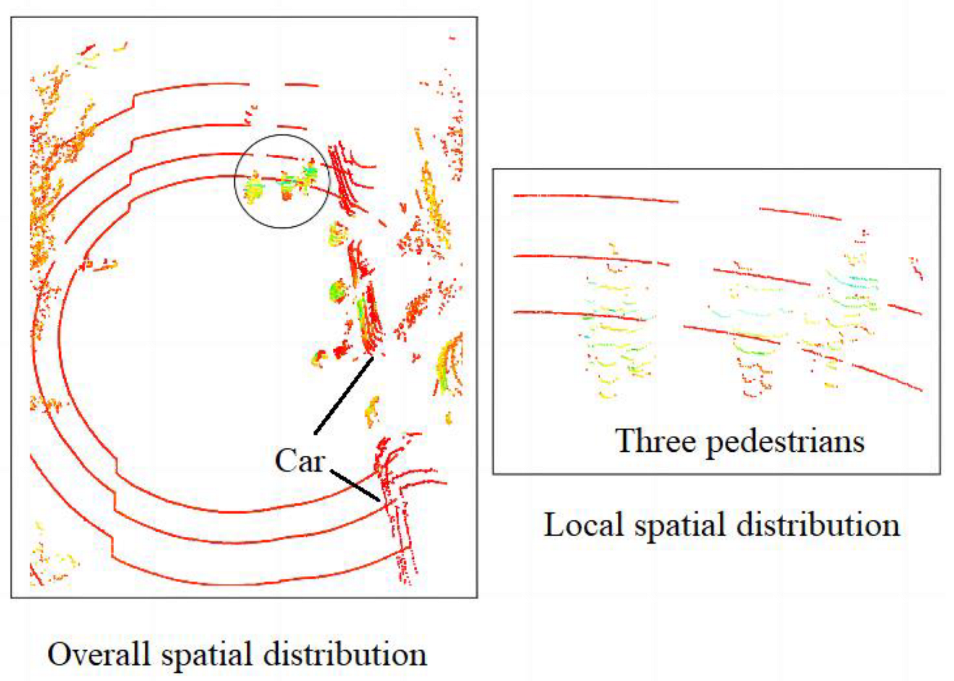
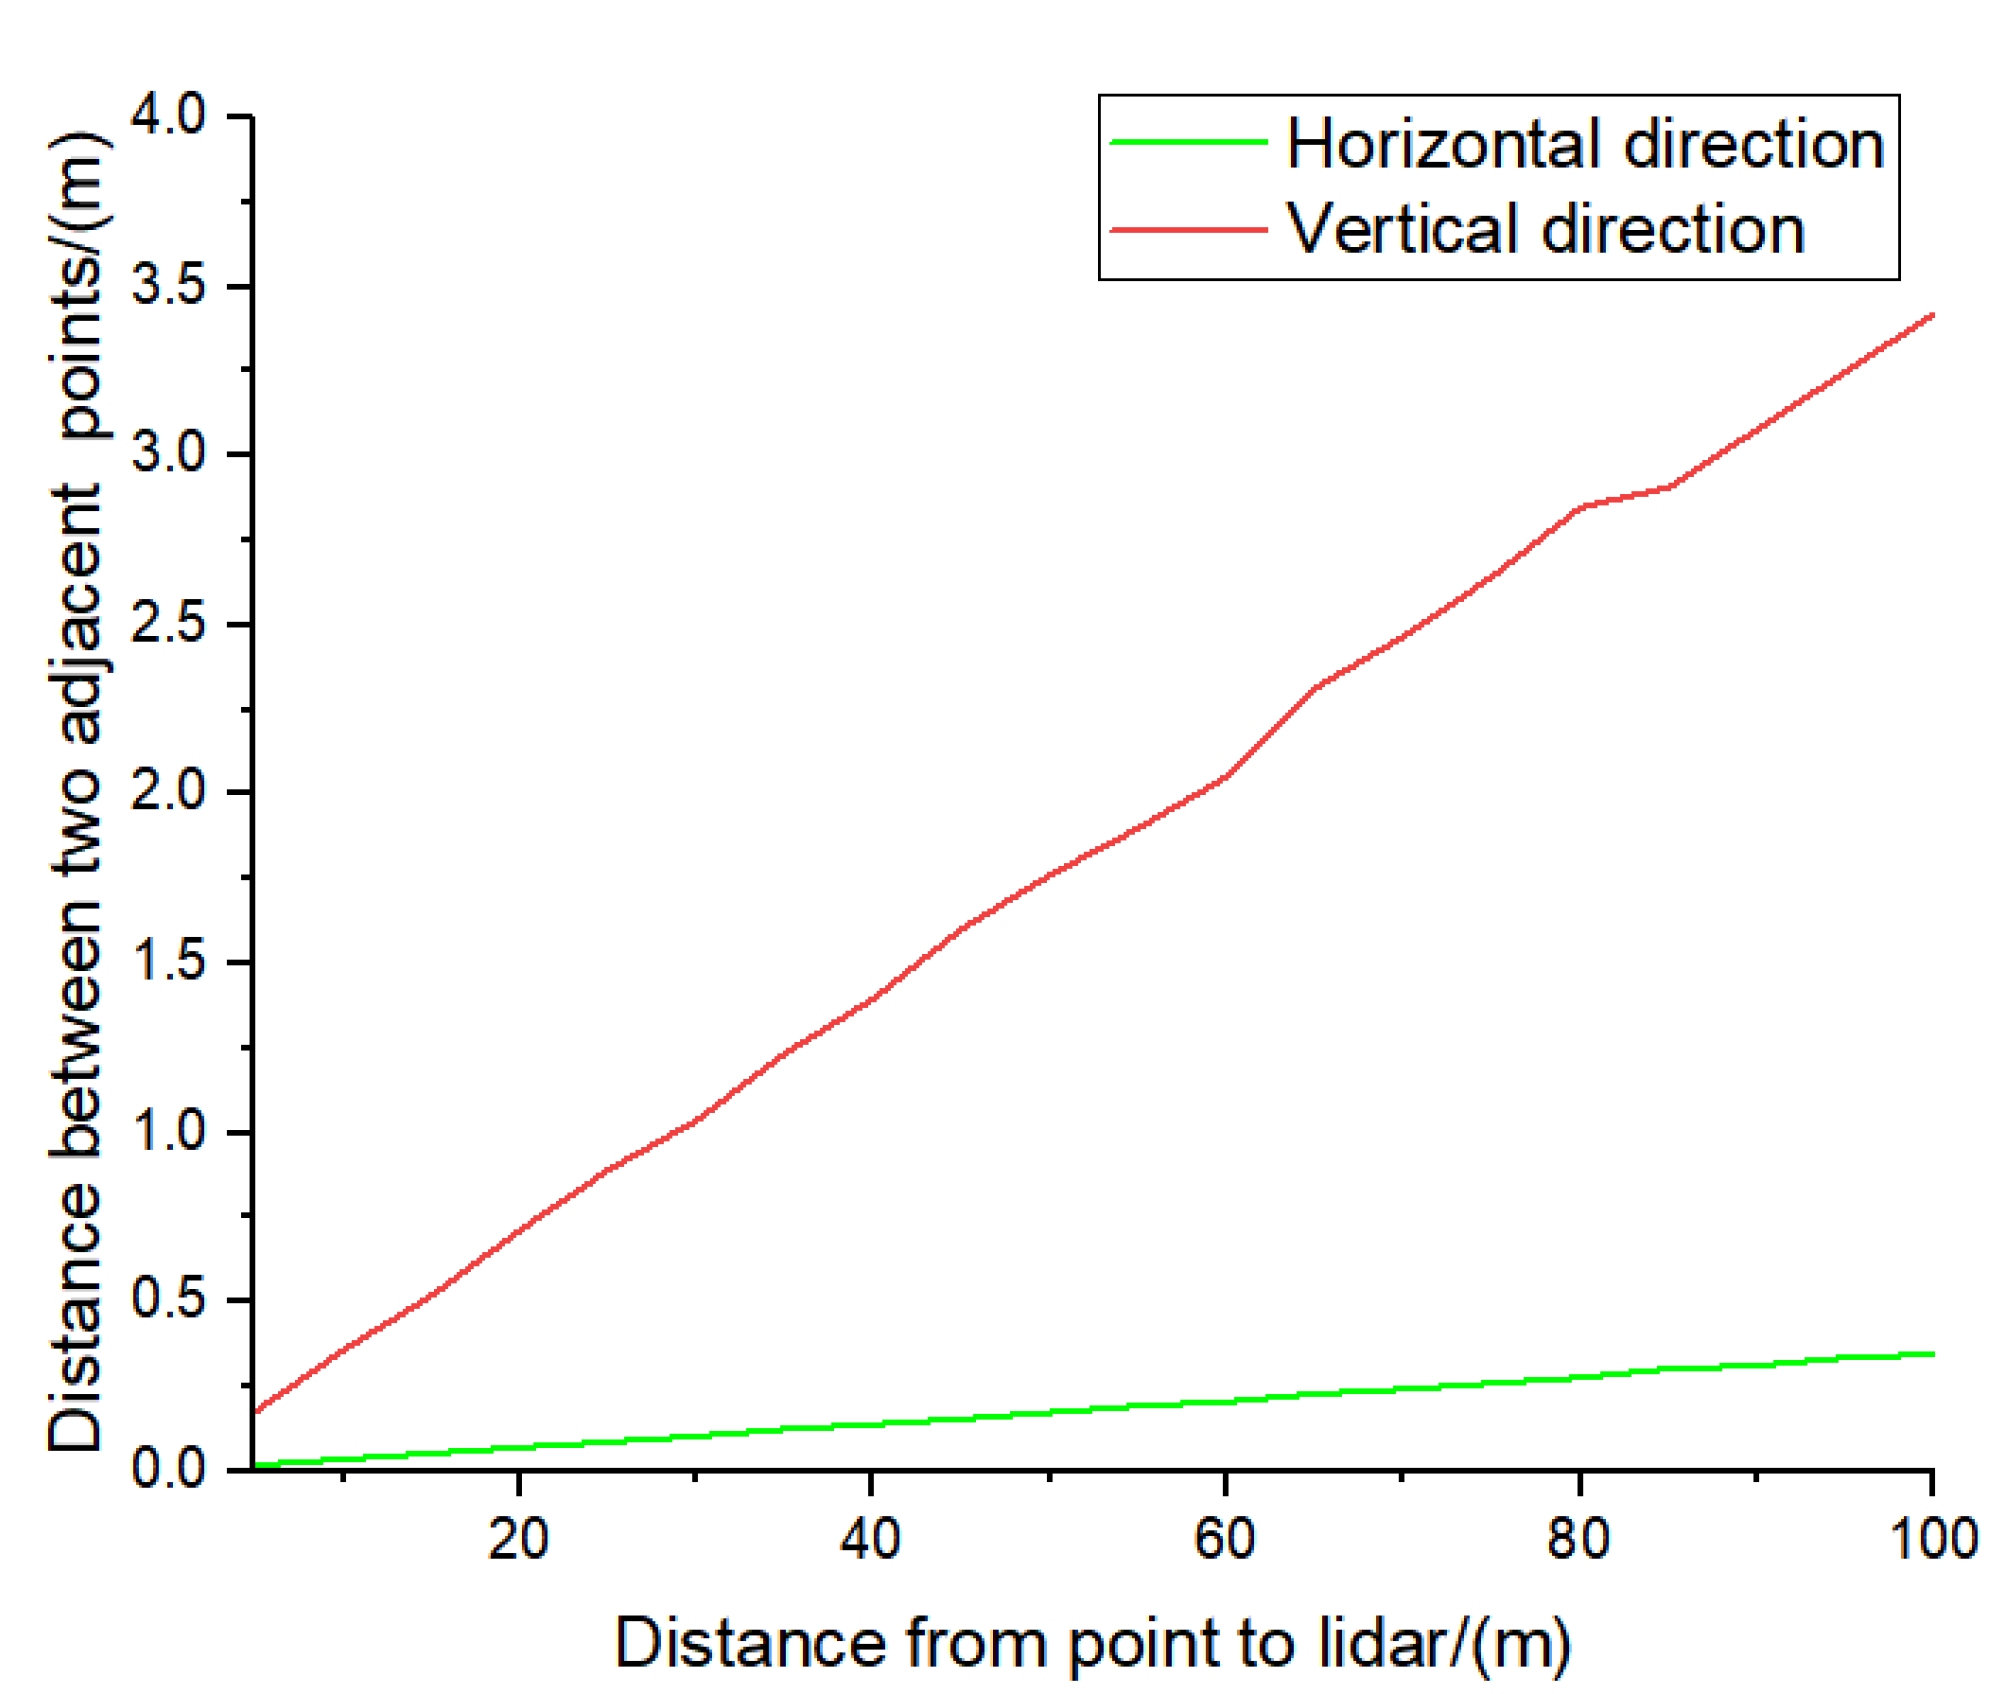
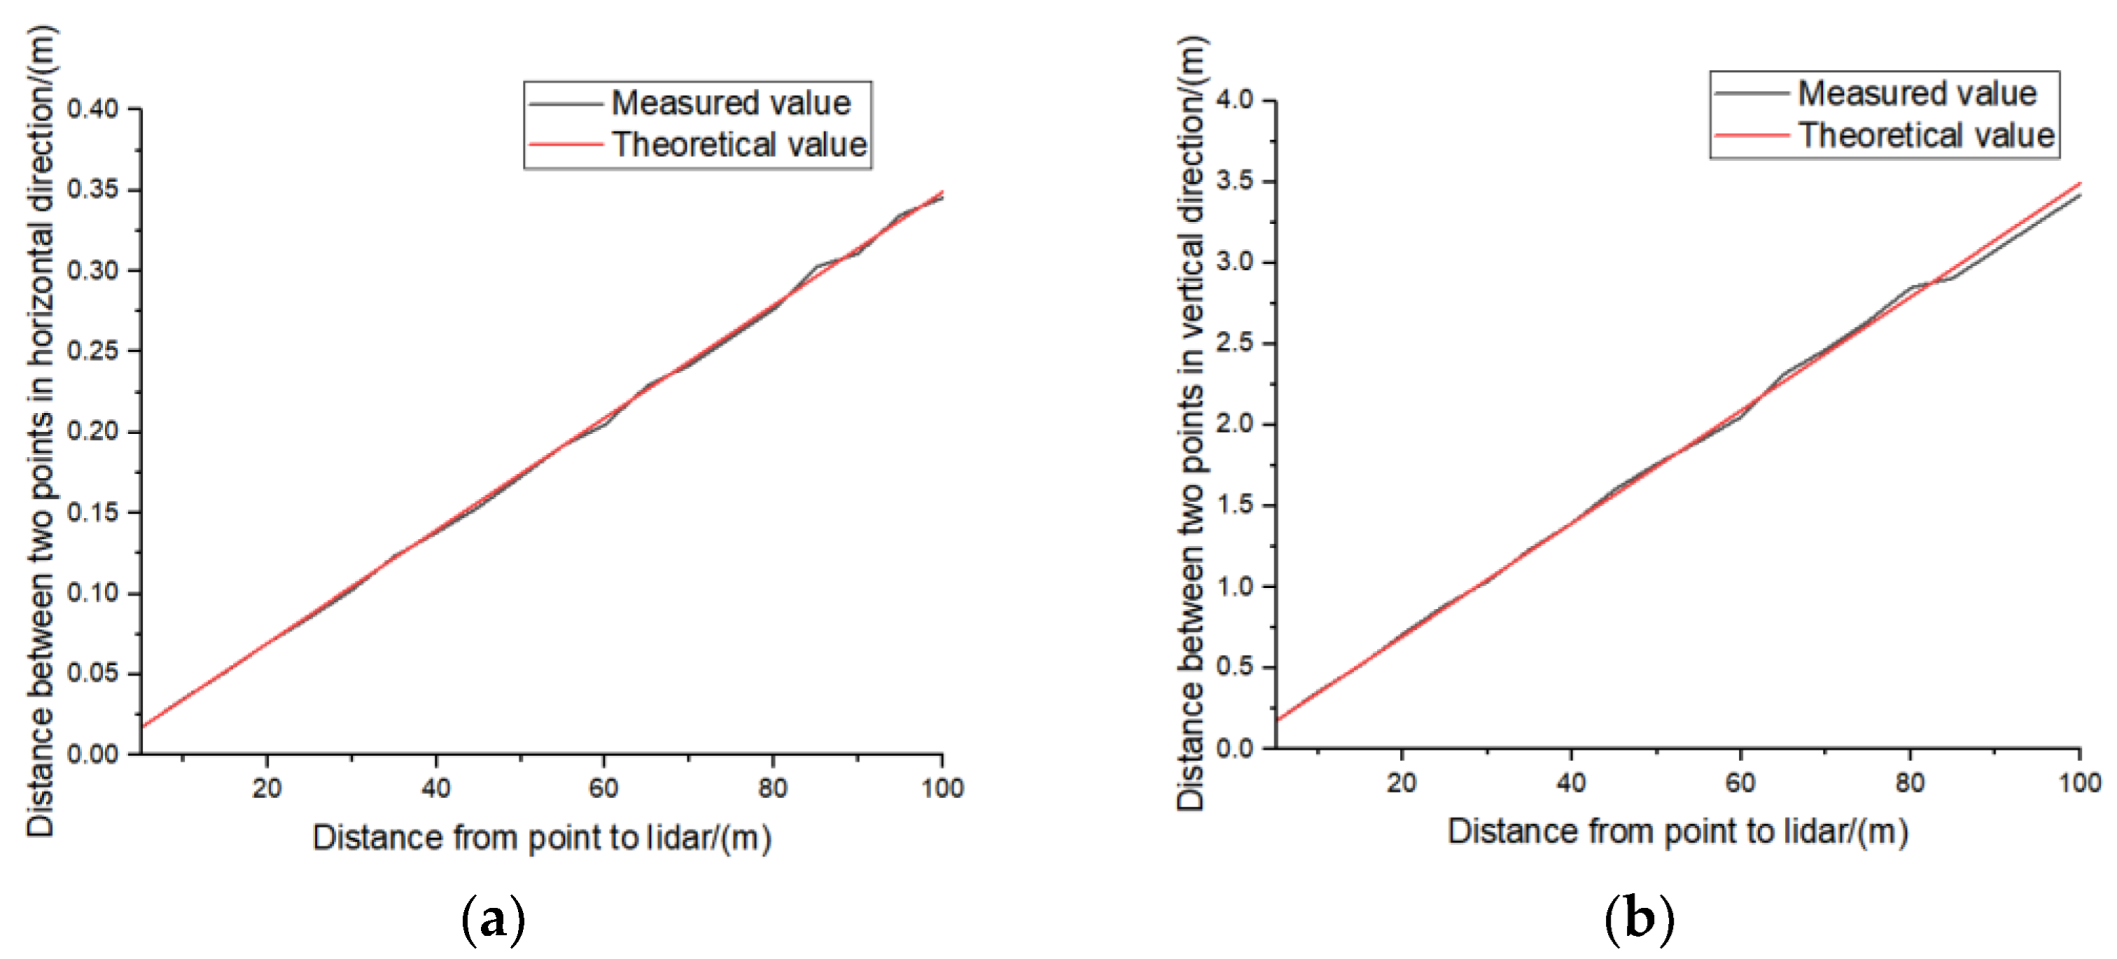
3.1. Analysis of Point Cloud Spatial Distribution

As shown in Figure 3, the overall spatial distribution of the point clouds collected by the lidar is sparse in remote regions, and dense in close regions. As the vertical angular resolution ω of the lidar is higher than the horizontal resolution α , the local point cloud spatial distribution has the following characteristics: (1) the distance between two adjacent points belonging to the same point cloud layer is near; (2) the distance between two adjacent points belonging to different point cloud layers is far. According to the partially enlarged graph on the right of Figure 3, the point cloud of the pedestrians is densely distributed horizontally and sparsely distributed vertically. In addition, when the point cloud is collected by scanning the object surface, points belonging to the same object will be naturally and densely distributed around it.

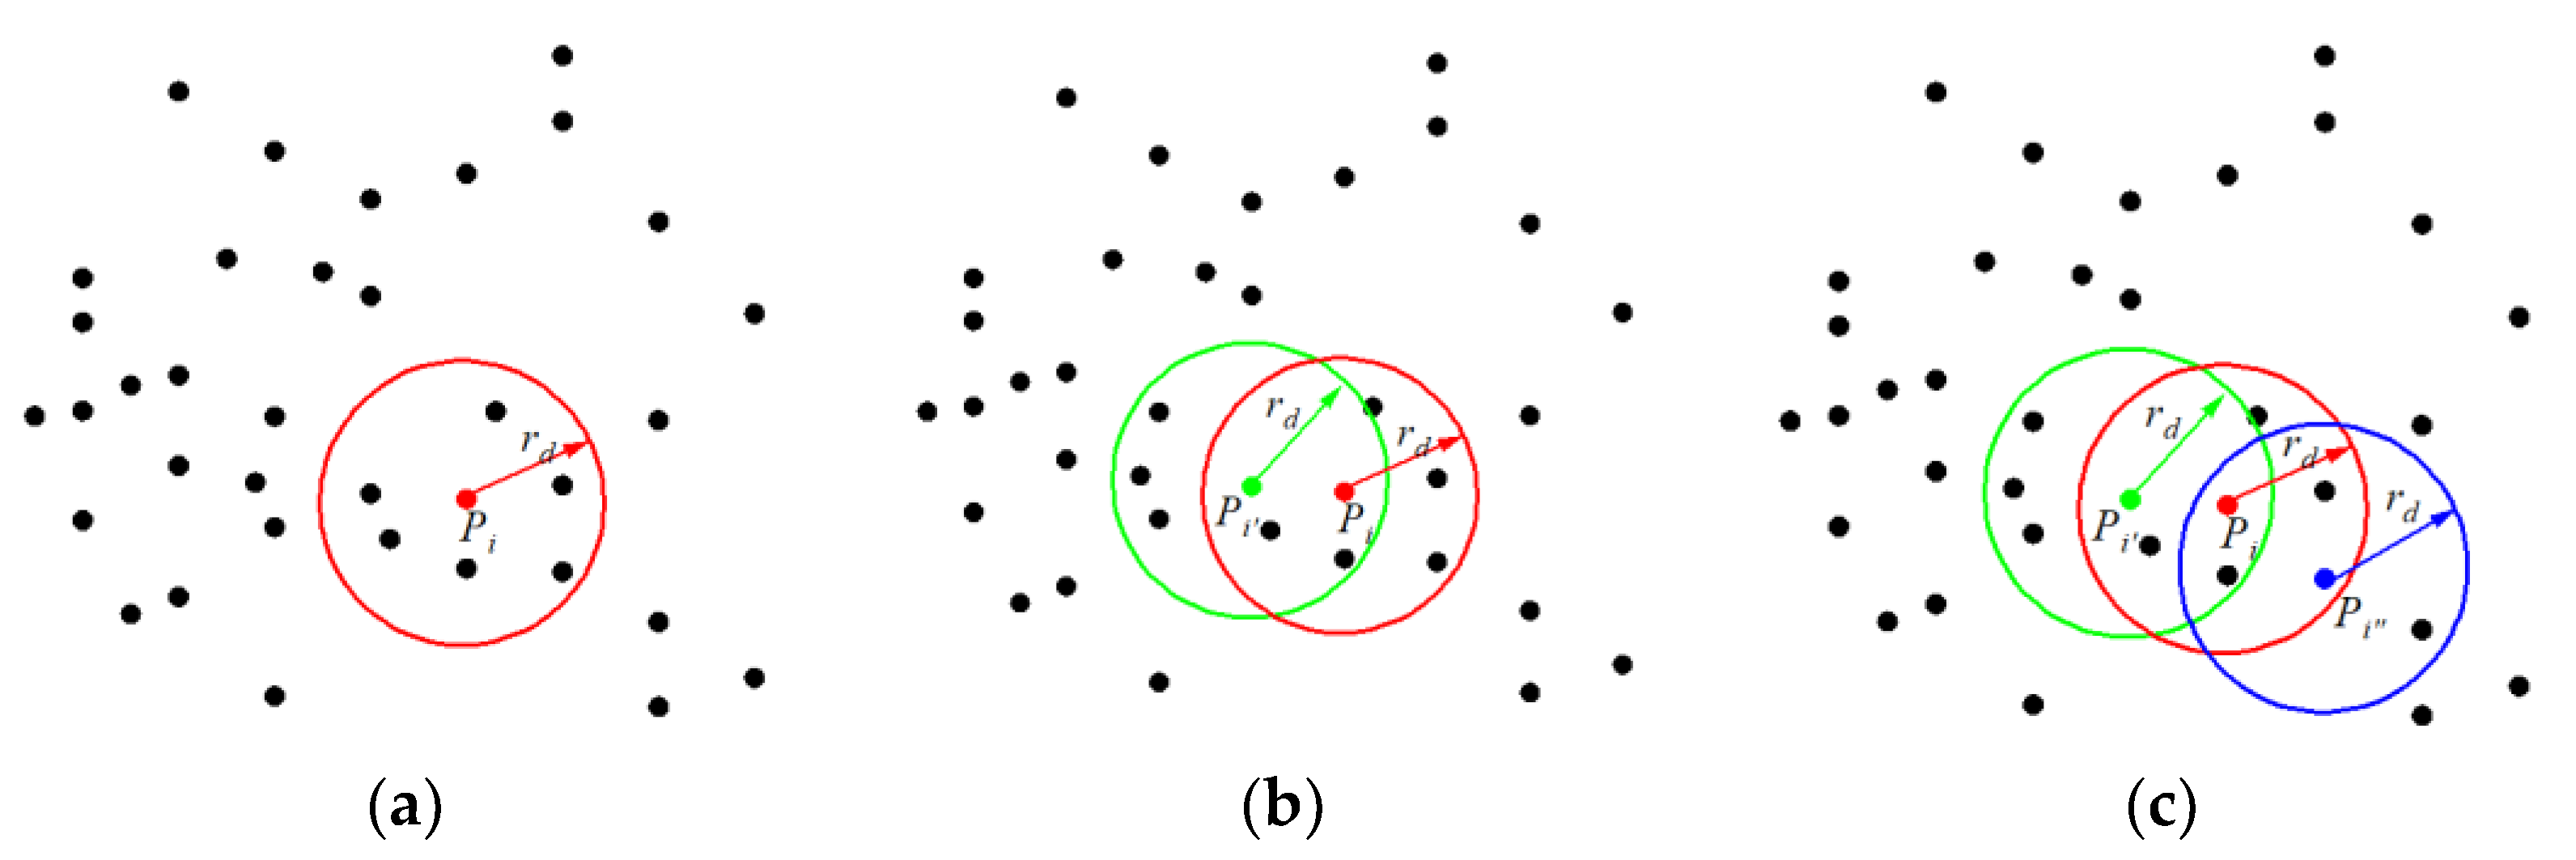
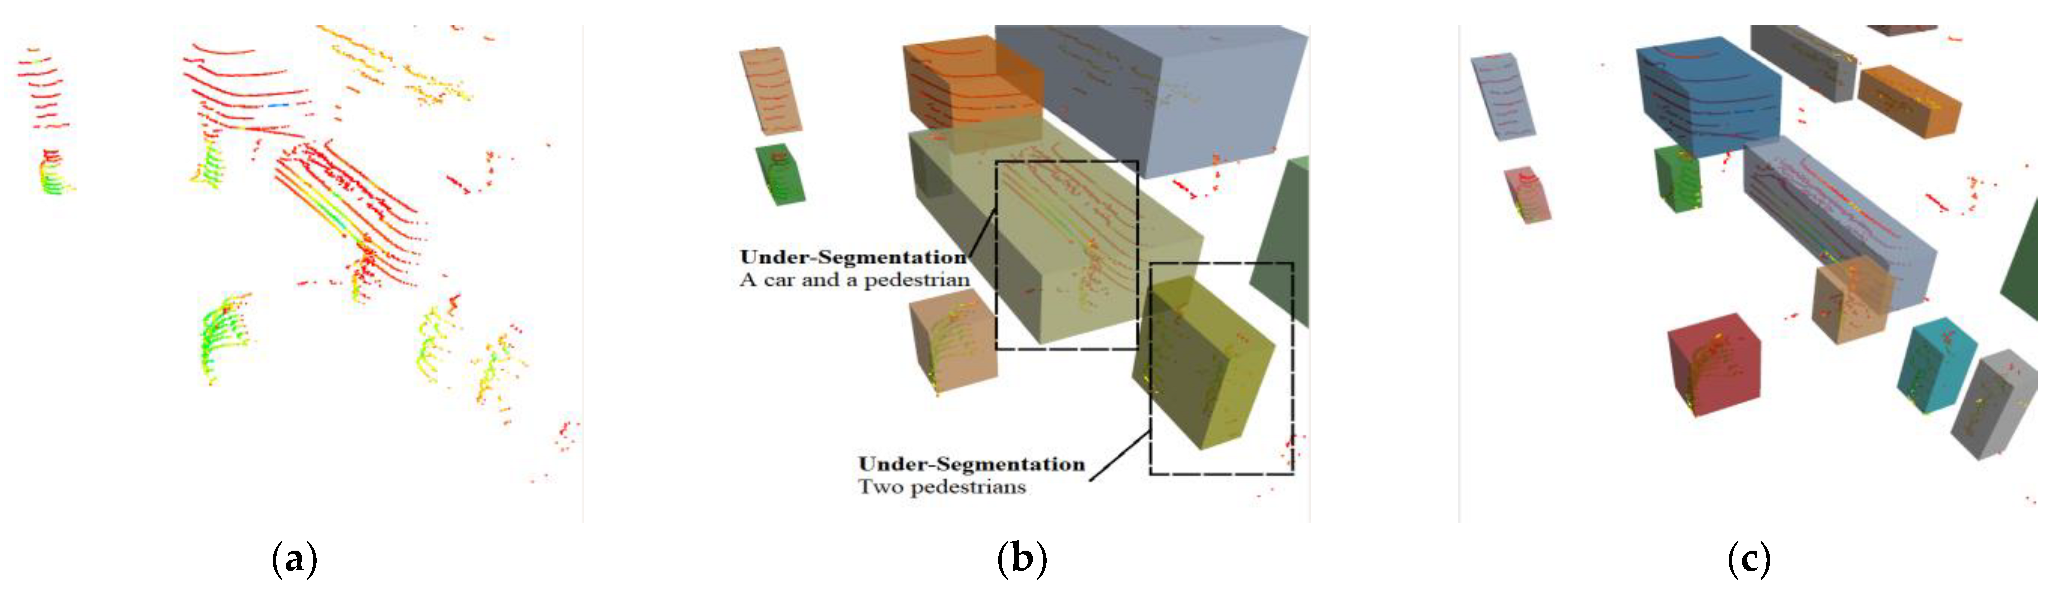
3.2. Analysis of Fixed Neighborhood Search Radius Clustering Algorithm

Clustering is a common data classification method that aims to divide elements in a dataset into finite subsets according to a certain rule. Normally, elements that are divided into the same subset have similar features, while elements from different subsets may exhibit different features. Obstacle detection methods based on point cloud clustering divide the obstacle point cloud into point cloud clusters, by using features such as point cloud location and reflection intensity. Each cluster represents an obstacle, so the key to ensuring the accuracy of obstacle detection is to group points belonging to the same obstacle into a cluster, without any wrong division.
Point cloud clustering aims to cluster points with similar characteristics into the neighborhood space of the clustering center in the point cloud. The size of the neighborhood space depends on the neighborhood search radius r d . Figure 4 shows the specific steps of the point cloud clustering process: (a) initialize the obstacle point set, O b s t a c l e = , and the seed point set, S e e d S e t = , then select an unprocessed point p i from point cloud P o f f as the initial clustering center, mark it as processed, add it into O b s t a c l e , and add all the points in the neighborhood space with center p i into O b s t a c l e and S e e d S e t ; (b) choose each point C u r r P o i n t (such as the green point p i ’) in S e e d S e t as the clustering center, add these newly processed points into O b s t a c l e and S e e d S e t , and delete C u r r P o i n t from S e e d S e t ; (c) carry out the iterative search until S e e d S e t = , and add the O b s t a c l e into the obstacle list O b s t a c l e L i s t . When all the points of the point cloud P o f f are processed, the whole O b s t a c l e L i s t is obtained.
Figure 5 shows the horizontal and vertical distances of two adjacent points in a point cloud 0–100 m, detected by a VELODYNE lidar. The farther the point cloud is from the lidar, the greater the distance between two adjacent points horizontally and vertically; therefore, in the process of obstacle detection, the required clustering threshold for the distant obstacle point cloud is larger than that for the close obstacle point cloud. The search radius r d directly influences the accuracy of point cloud clustering. Selecting r d properly can obtain an accurate obstacle detection result, while the improper selection of r d will cause false detection: specifically, if the value of r d is too large, the point cloud of adjacent obstacles will be clustered together, resulting in multiple obstacles being clustered into a single object. As shown in Figure 6a, two pedestrians are wrongly detected as one object; conversely, if the value of r d is too small, the point cloud belonging to the same obstacle will be divided into multiple clusters, as shown in Figure 6b, where a car is divided into two parts.
Considering that the point cloud spatial distribution is irregular, and the point cloud density at different locations is different, if the fixed value of r d is applied to process the whole obstacle point cloud, it is impossible to obtain accurate detection results. As shown in Figure 6c, the point clouds of the pedestrians and the car are accurately segmented at a very close distance, but the point cloud of the remote car is over-segmented. As shown in Figure 6d, the point cloud of the near car is accurately segmented, but the remote pedestrians are not detected. The root cause of these above problems is that the fixed r d cannot meet all the clustering requirements of the point clouds of cars and pedestrians at different locations.

3.3. Design of Adaptive Clustering Search Radius

For an obstacle (e.g., a car or a pedestrian), the spatial distribution becomes sparser further away from the lidar. To accurately cluster a point cloud belonging to the same obstacle, the clustering radius should be adjusted in real time according to the point cloud location and spatial distribution. The fixed threshold method [28] cannot adjust the value of the clustering radius, which could lead to the problems of over-segmentation of the cars point cloud and under-segmentation of the pedestrians point cloud. As shown in Figure 6, the further the obstacle is from the lidar, the greater will be the distance between the two points of the obstacle point cloud in the horizontal and vertical directions. To realize the accurate detection of pedestrians and cars, the value of r d of the remote pedestrian point cloud in Figure 7a should be greater than the value of r d of the near car point cloud. Similarly, the value of r d of the remote car point cloud in Figure 7b should be larger than the value of r d of the near pedestrians point cloud.
The theoretical distance ( Δ d   a n d   Δ z ) between two adjacent points in horizontal and vertical directions can be approximated by (7) and (8), respectively. It can be seen from Figure 8 that the measured values of the distances of the two points in the horizontal and vertical directions are basically consistent with the theoretical values calculated according to (7) and (8); therefore, Δ d and Δ z are used as the clustering thresholds in the horizontal and vertical directions in this paper.
In this paper, we propose an adaptive neighborhood search radius calculation method, based on the results of point cloud spatial distribution, as follows:
r d = R ( s i n ( α ) + s i n ( ω ) ) + σ
R = x i 2 + y i 2 + z i 2
Δ d = R s i n ( α )
Δ z = R s i n ( ω )
where α is the horizontal angular resolution of lidar, ω is the pitch angle of the point cloud layer, σ is the measurement error, and x i , y i   and   z i are the x , y   and   z coordinates of a point, respectively.
Based on the above spatial analysis of the point cloud, the value of r d positively correlates with the distance between two adjacent points, in both horizontal and vertical directions ( Δ d and Δ z ). In addition, Δ d is closely related to the horizontal angle resolution, α   and   R , Δ z is closely related to the pitch angle, ω and R , and Δ d and Δ z can be obtained from (7) and (8), respectively. By introducing α , ω and R , an adaptive neighborhood search radius for the obstacle point cloud at different locations can be calculated according to (5). Thus, the accuracy of obstacle detection for autonomous vehicles is improved. The pseudo-code of the proposed algorithm is shown in Algorithm 2.
Algorithm 2: Adaptive neighborhood search radius clustering algorithm
Input: Poff (Obstacle point cloud), α, ω
Output: ObstacleList
1
2
3
4
5
6
7
8
9
10
11
12
13
14
15
16
17
18
19
20
21
22
23
24
25
26
   Initialize Obstacle, SeedSet;
   foreach p Poff do
         if p.label = = PROCESSED then
               continue;
         else
               \\Calculate the rd of point p based on α, ω and R, and search for neighbor points;
               SeedSet = NeighborhoodSearch(p, rd(p, α, ω, R));
               Obstacle = {p} SeedSet;
               p.label = PROCESSED;
         end
         while SeedSet ≠ Φ do
               foreach q  SeedSet do
                      CurrPoint = SeedSet.first();
                      Obstacle = Obstacle ∪ NeighborhoodSearch(CurrPoint, rd(CurrPoint, α, ω, R));
                      SeedSet = SeedSet ∪ NeighborhoodSearch(CurrPoint, rd(CurrPoint, α, ω, R));
                      SeedSet = SeedSet \ {CurrPoint};
               end
               foreach k Obstacle do
                      \\Mark the processed points to prevent repeated clustering;
                      k.label = PROCESSED;
               end
               ObstacleList.add(Obstacle);
               Obstacle = Φ;
         end
   end
   return
The fixed-threshold Euclidean clustering method is simple, and has high real-time performance, but it cannot accurately detect obstacles in complex scenes, especially when the obstacles are far away from the ego car. Compared to the fixed threshold method, the method proposed in this paper can adjust the threshold adaptively according to the positions of different point clouds, which can be applied to obstacles of various complex shapes. Compared to clustering methods that only consider the angle of horizontal direction, this paper adds the pitch angle of the point cloud vertical direction, which can effectively solve the problem of over-segmentation of the obstacle point cloud, caused by the uneven distribution of the point cloud vertical direction. The traditional k-means clustering method needs to set the number of clusters in advance, which is not applicable to a complex driving environment; however, our proposed method can be used without setting the number of clusters in advance. The grid-map-based clustering method needs to project the 3D point cloud to the 2D horizontal plane before clustering, which greatly reduces the real-time performance of the algorithm; in addition, the grid-based method cannot dynamically adjust the size of the grid. The method proposed in this paper is directly used to detect 3D point clouds.

4. Experiment Result

To validate the effectiveness of the proposed obstacle detection method, multi-scene real vehicle experiments were carried out, where the Euclidean clustering method [28] and the proposed method were implemented. Furthermore, the comparison study of the two methods was realized by processing the offline KITTI dataset.

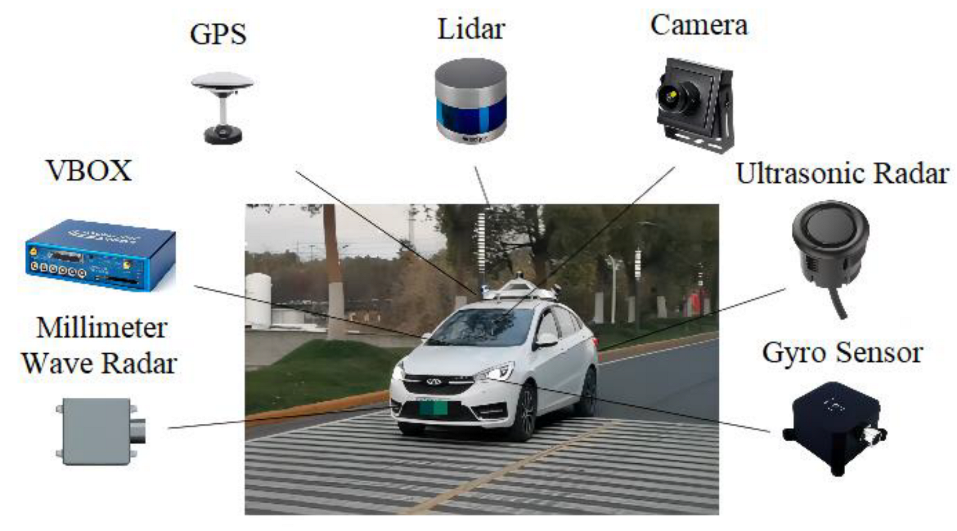
4.1. Experimental Vehicle

The experimental platform was an autonomous vehicle platform equipped with three VLP-16 lidars, and the sensor configuration scheme is shown in Table 1. The computing platform was an Intel i7 processor with 3.1-GHz and 8G-RAM, and the algorithm was run on the Ubuntu 16.04 operating system with ROS (Robot Operating System). The experimental platform is shown in Figure 9.

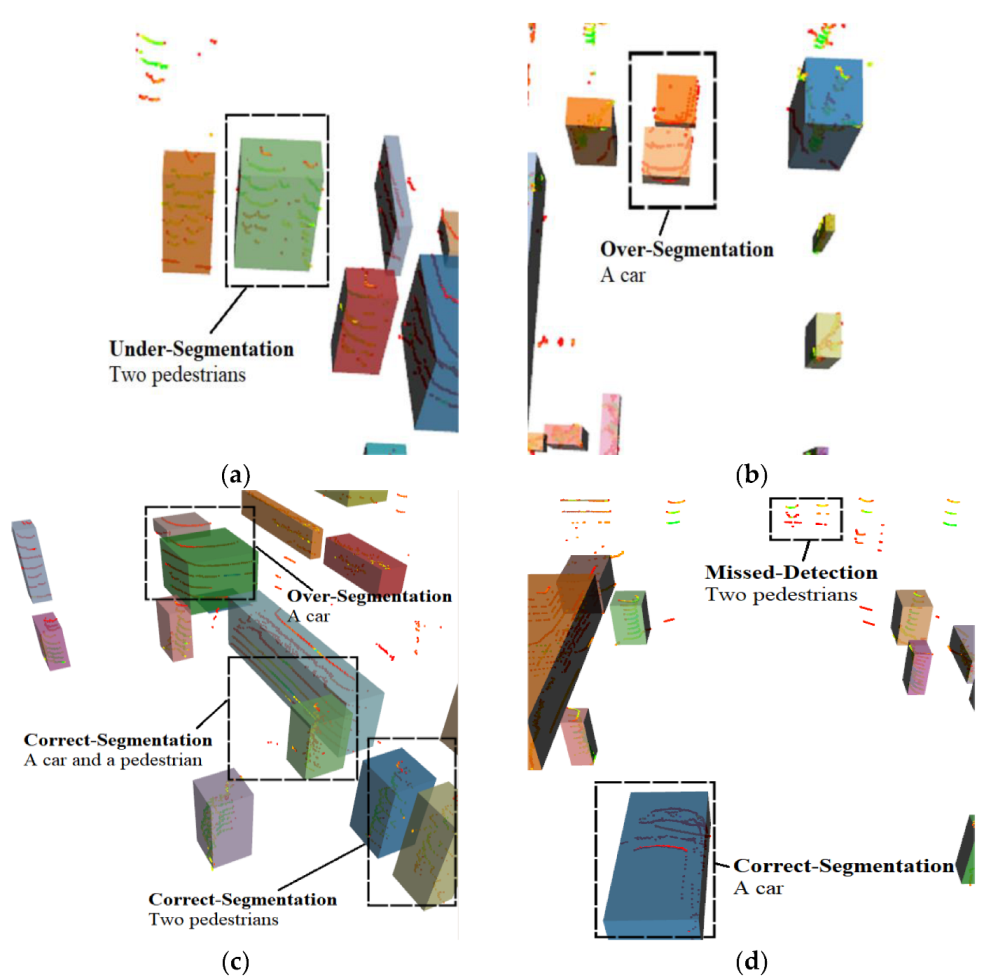
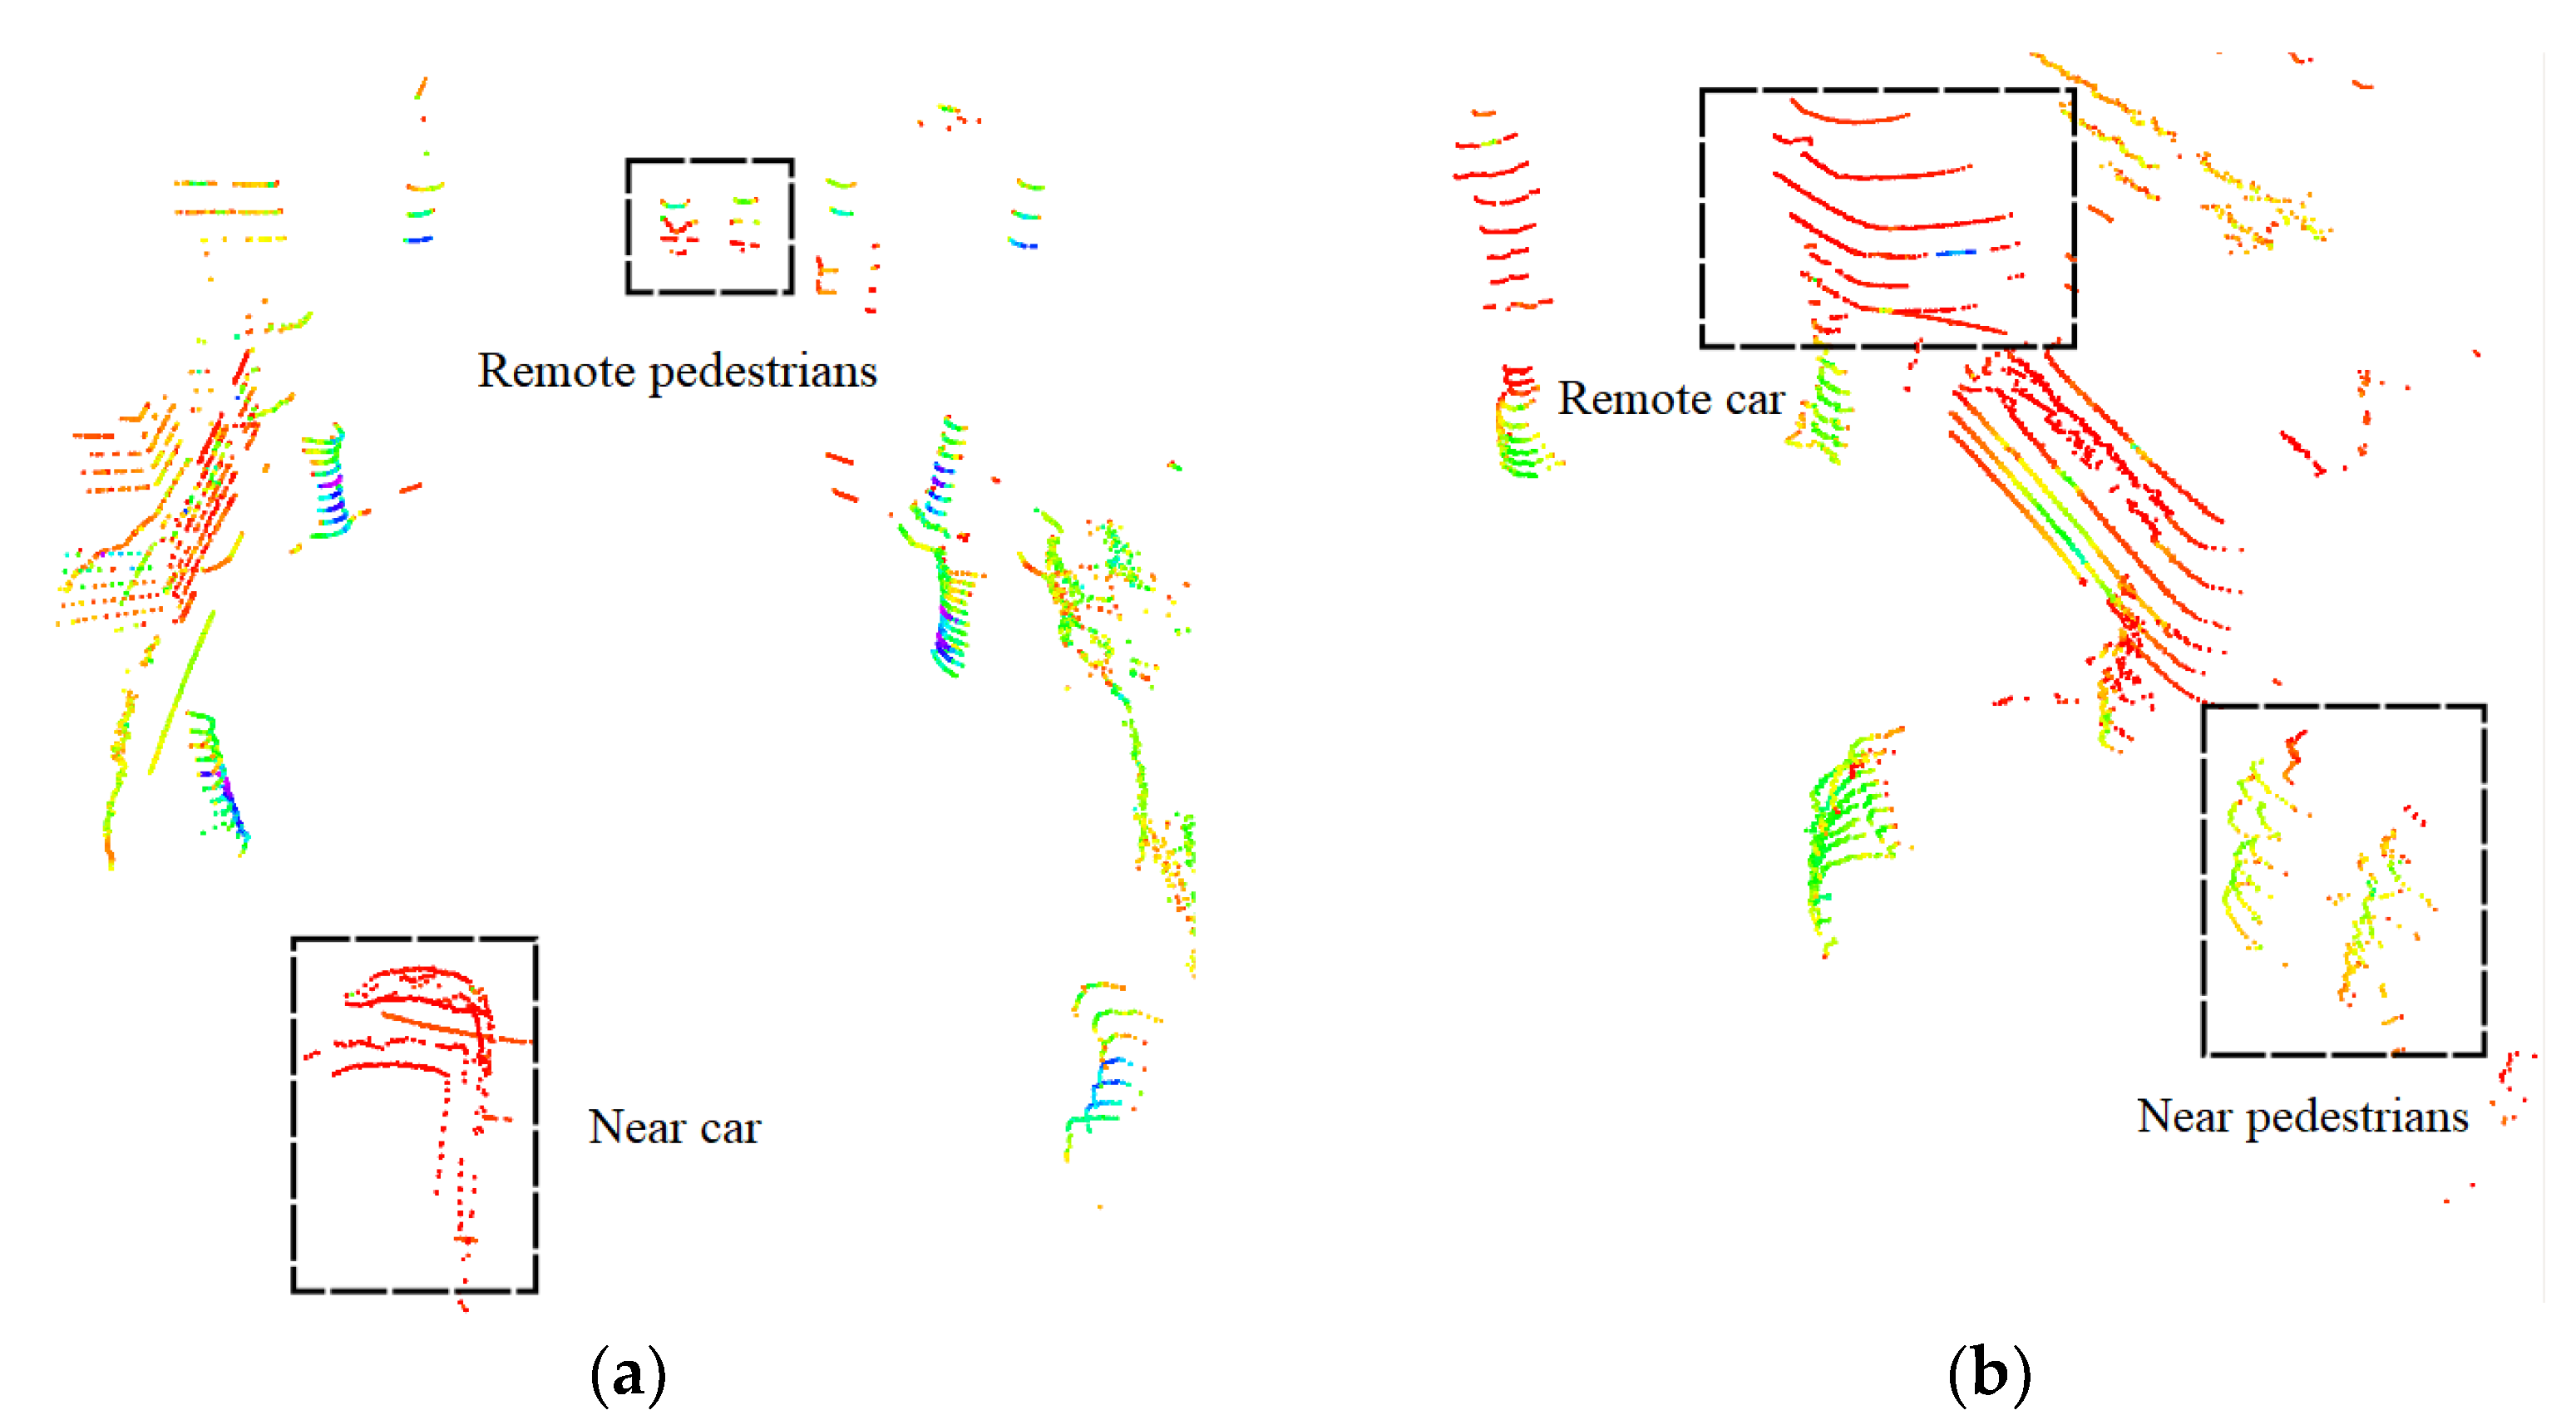
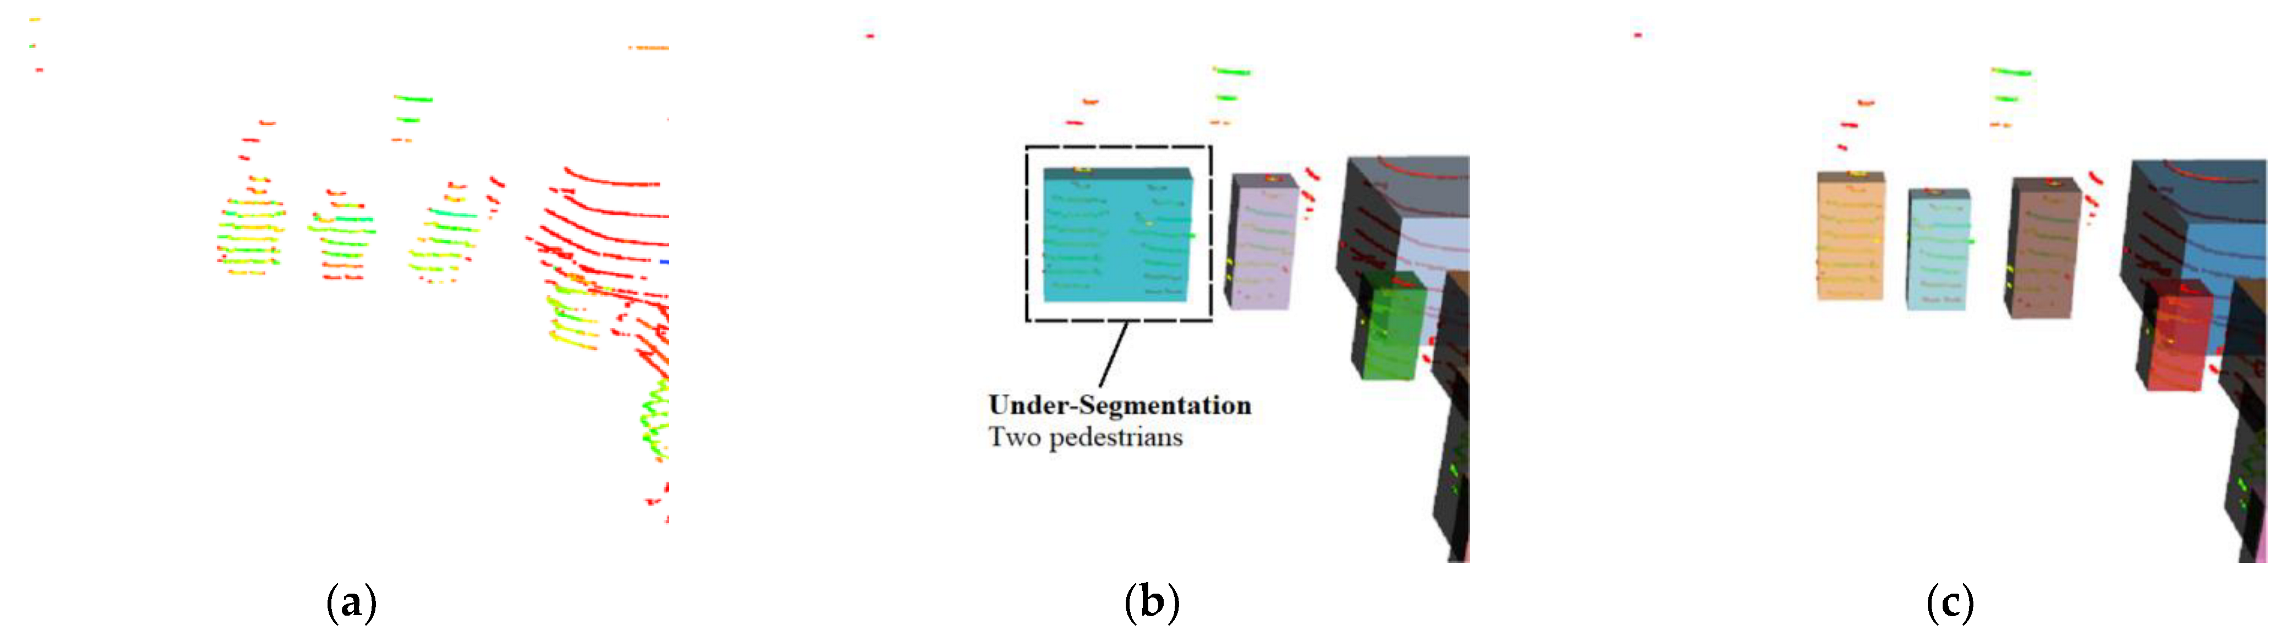
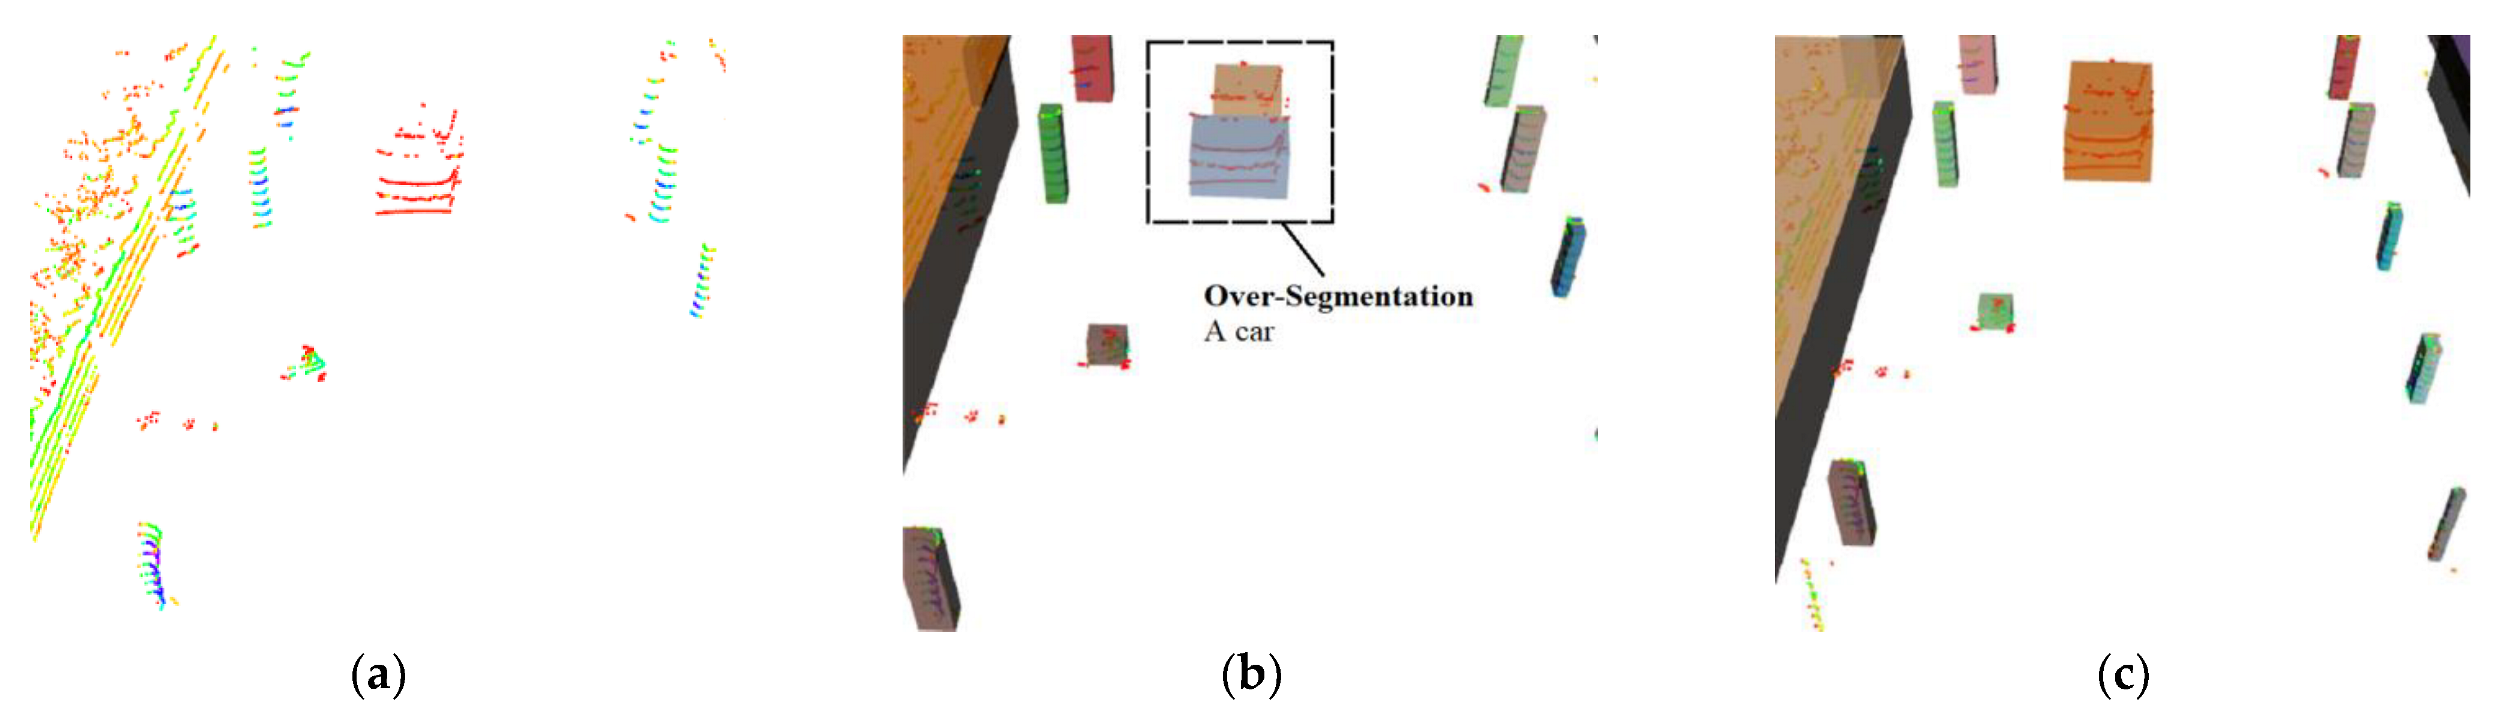
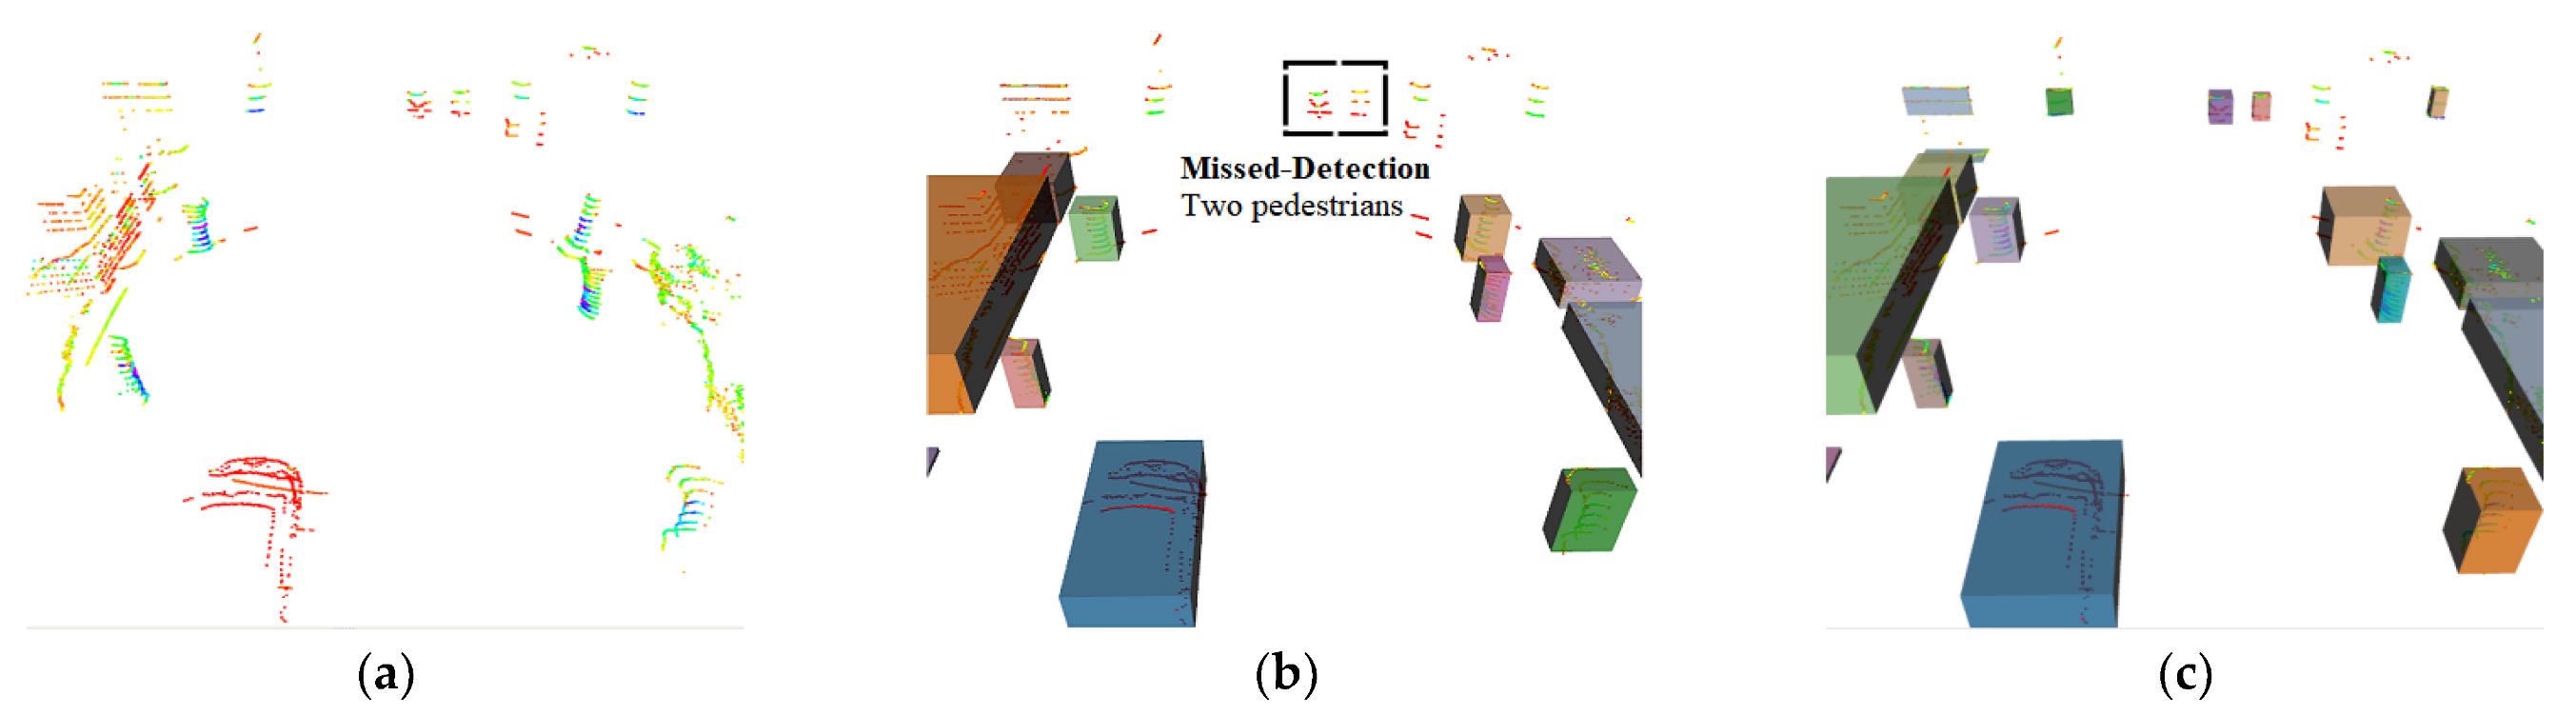
4.2. Multi-Scene Real Vehicle Experiments

In this section, the detection results of the proposed method and the Euclidean clustering algorithm in multiple scenarios are given. As shown in Figure 10b, Figure 11b, Figure 12b and Figure 13b, there were some under-segmentation and over-segmentation problems when the Euclidean clustering algorithm was used to detect obstacles. By contrast, the adaptive neighborhood search radius clustering method proposed in this paper can select the proper neighborhood search radius dynamically, according to the relationship between the point cloud spatial distribution and the clustering radius: the process of obstacle detection based on lidar is continuous. Figure 14 and Figure 15 show the detection process using the two methods, respectively, in an experimental scene, where one frame was extracted every 2.5 s, in order to clearly show the obstacle motion process.
In the experiment, 500 point cloud frames were selected from the collected dataset, and the obstacles in each point cloud frame were manually marked. The marked obstacles included vehicles, pedestrians, trees and other buildings. The detection results of the 500 point cloud frames processed by the above two algorithms are shown in Figure 16. The detection accuracy of the proposed method was an improvement of 6.94% compared to the Euclidean clustering algorithm, and it could simultaneously reduce under-segmentation, over-segmentation and false detection effectively.

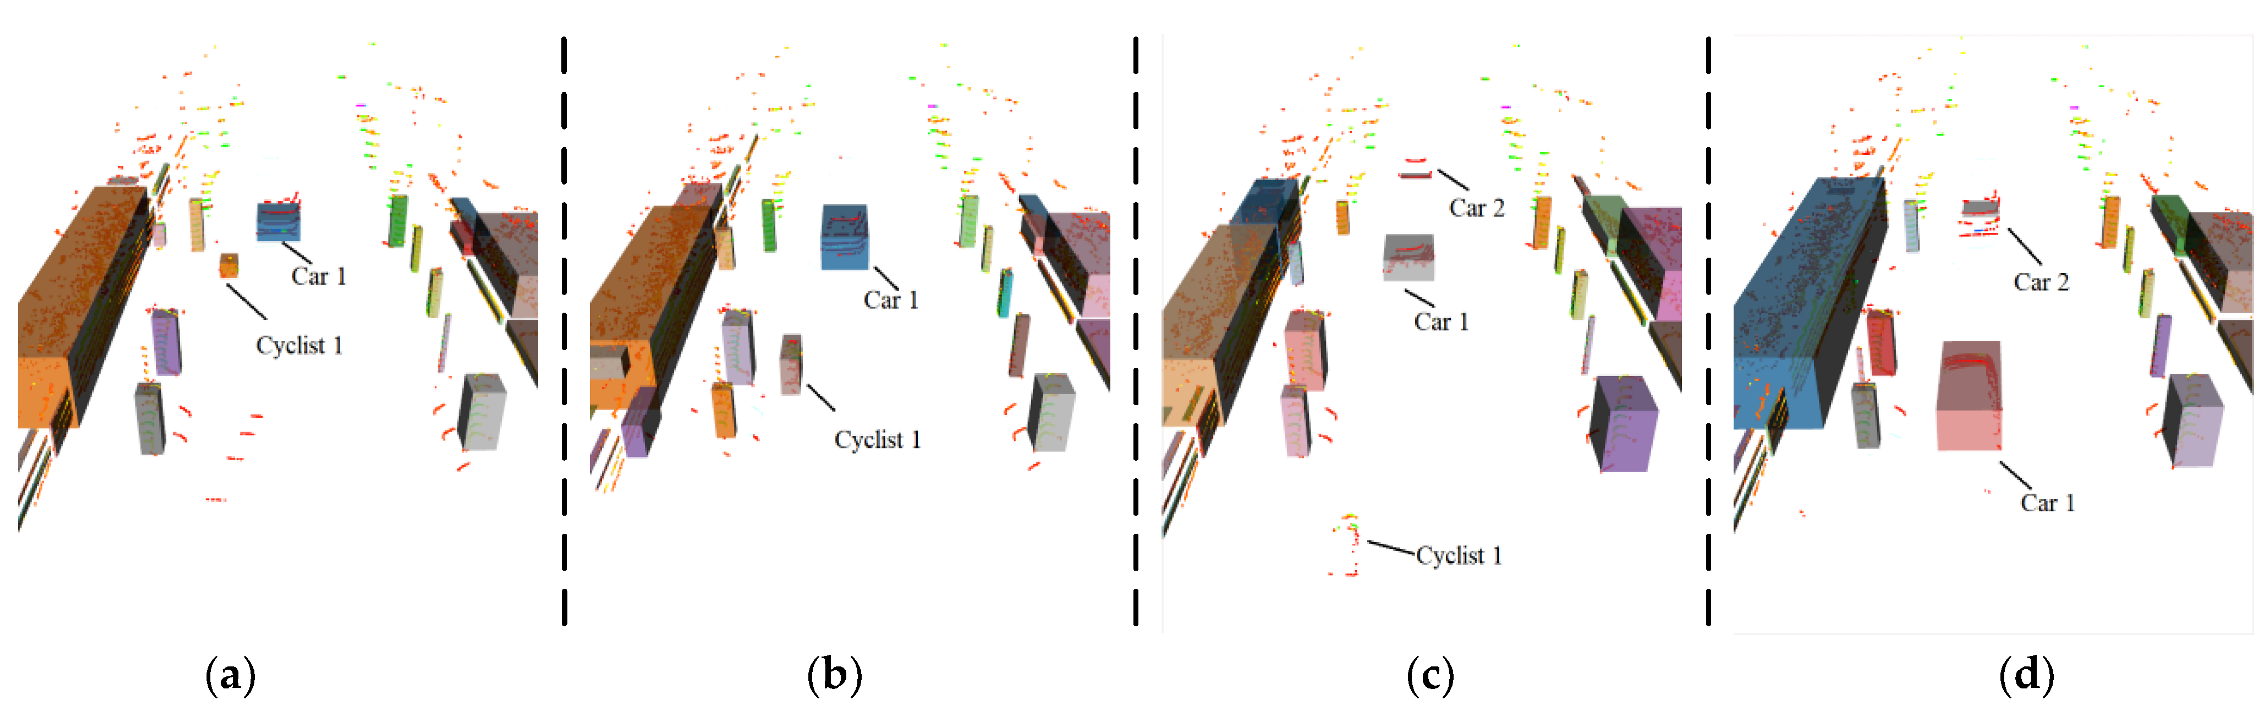
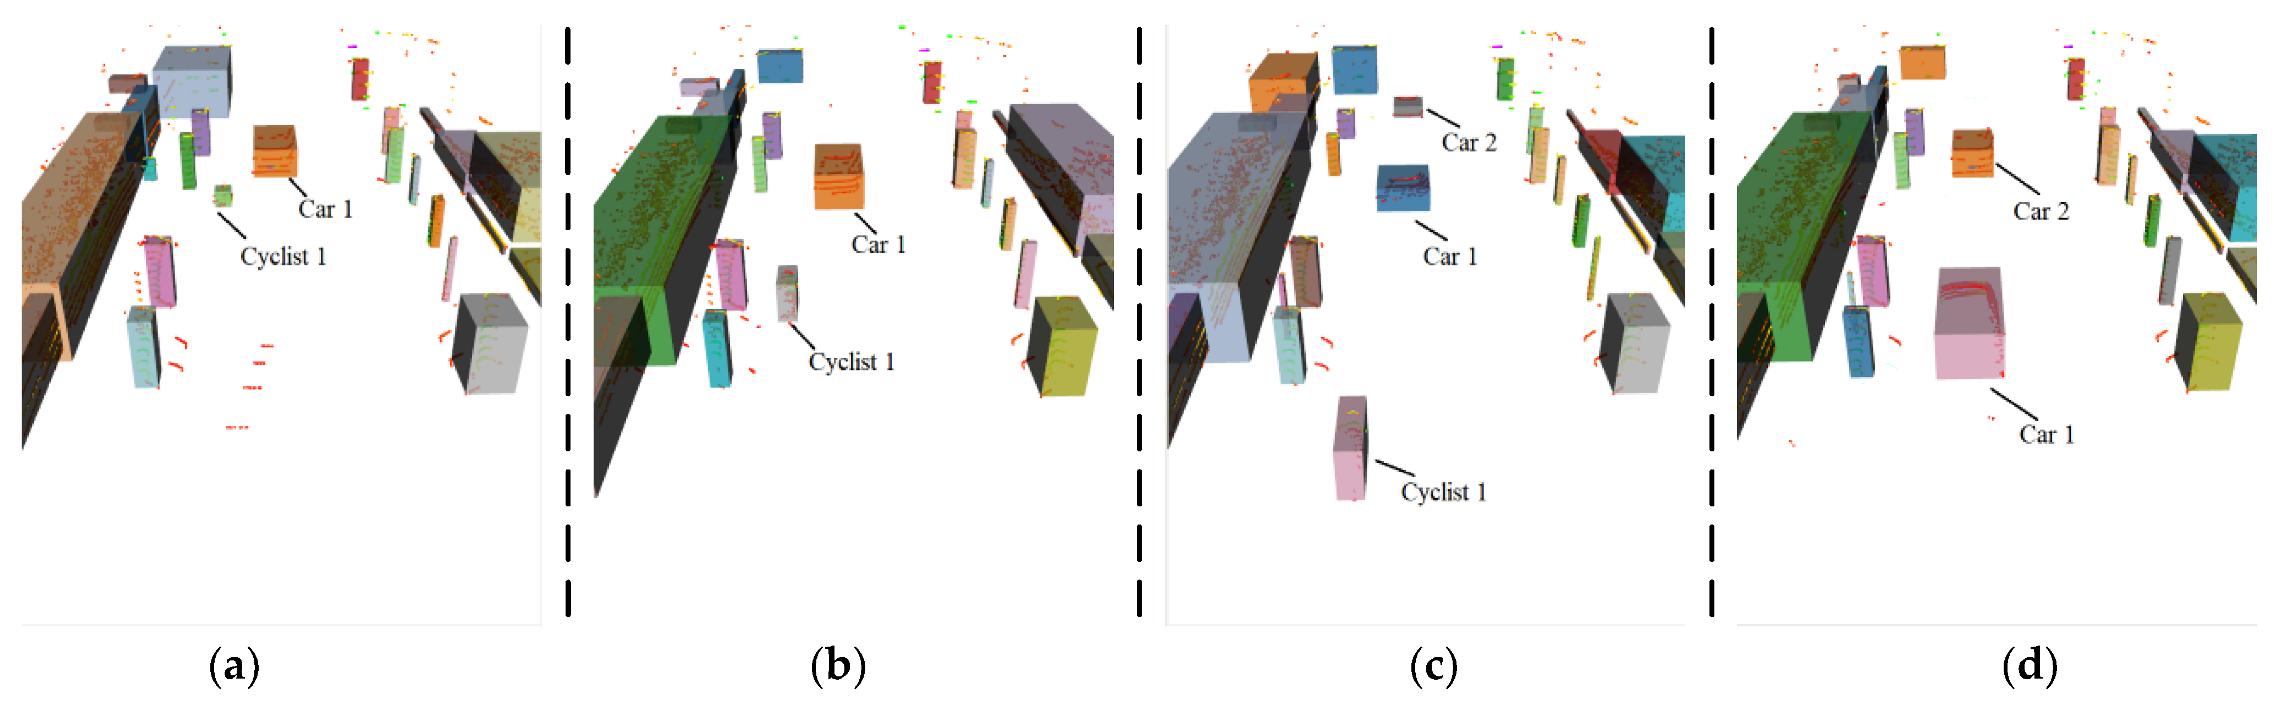
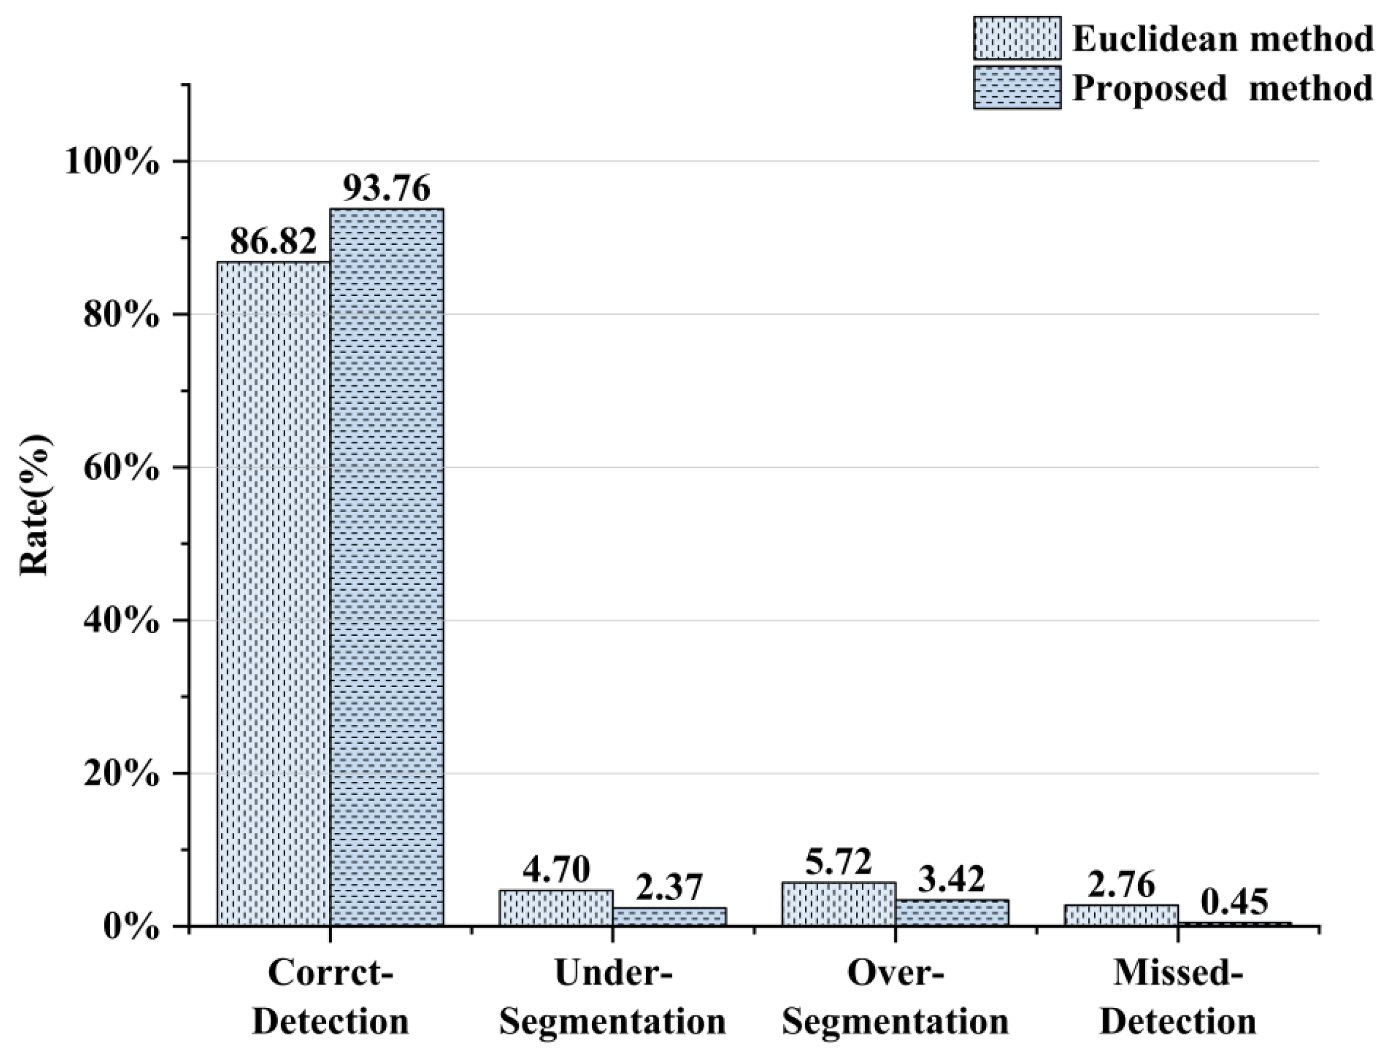
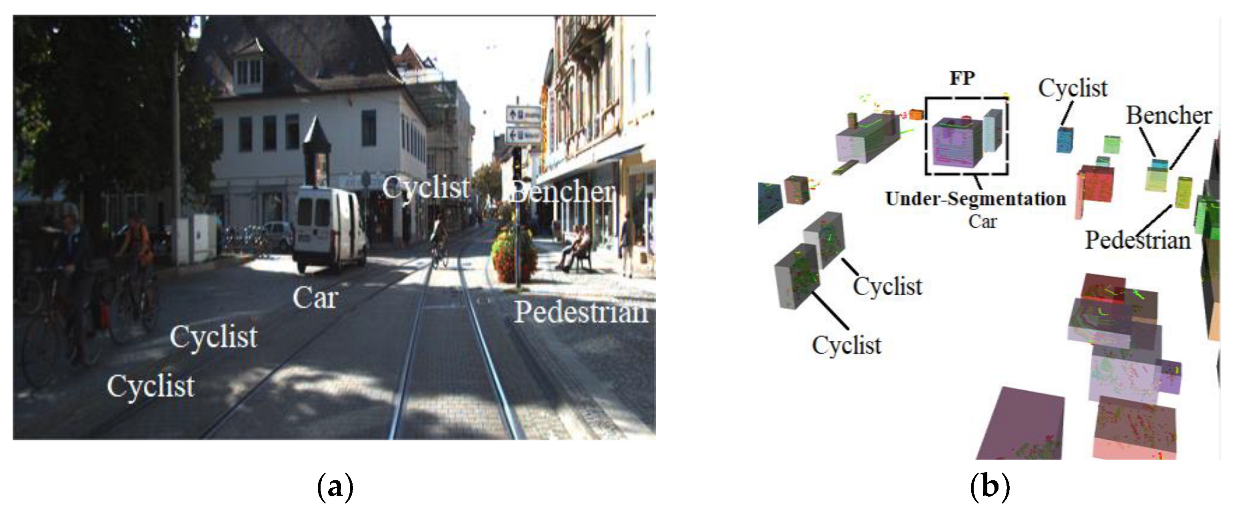
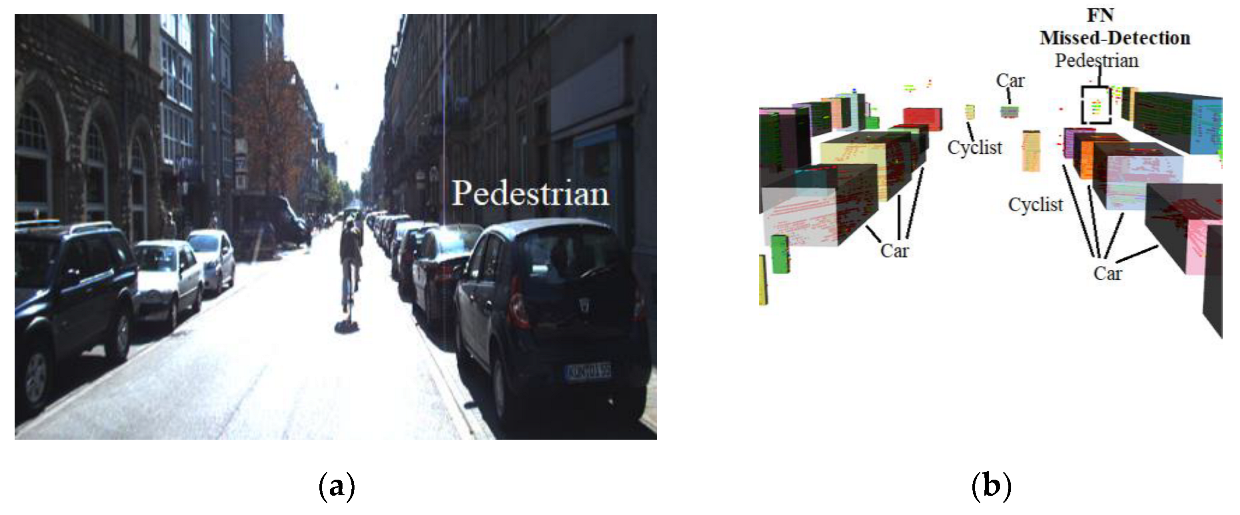
4.3. KITTI Datasets Experiments

The KITTI dataset was developed by the Karlsruhe Institute of Technology (Karlsruhe, Germany) in Germany and the Toyota Institute of Technology (Chicago, U.S.) in the United States, and is currently one of the most common datasets used internationally in autonomous driving [29]. The KITTI dataset includes multiple types of sensor data covering a variety of complex traffic environments, and many researchers use it to validate the performance of algorithms used for autonomous driving systems [30,31,32].
After conducting multi-scene real vehicle experiments, the KITTI dataset was used in this paper for obstacle detection, to comprehensively evaluate the performance of the proposed algorithm. In the KITTI dataset experiment, 385 frames from the offline autonomous driving KITTI dataset were selected, with a total number of 1928 marked obstacles, including 202 pedestrians, 229 cyclists and 1497 vehicles.
These point cloud frames of were processed by using the aforementioned two algorithms. The evaluation results of the two methods are shown in Table 2. The results of the KITTI dataset trials of the method proposed in this paper show that it could improve the detection accuracy of pedestrians, cars and other obstacles in different scenes, but that there were still some cases of false detection. In the paper, TP, FP and FN were introduced to calculate the F1 score, being the number of true, false and missed detections, respectively. The detection results belonging to FP can be divided into two groups: point cloud under-segmentation (Figure 17) and point cloud over-segmentation (Figure 18). There was only one group of detection results belonging to FN: missed detection (Figure 19).
The under-segmentation problem is caused by the inability of point cloud clustering methods to detect multiple targets that are too close to each other in the horizontal direction. The point cloud distribution is discrete, and there is a distance Δ d between two adjacent points in the horizontal direction. When the horizontal distance between two obstacle targets is less than Δ d , the point cloud clustering method will cluster the point clouds belonging to the two targets into one cluster, resulting in a point cloud under-segmentation problem.
The over-segmentation problem is mainly the point cloud over-segmentation of a car. The structure shape of the vehicle body to be detected is irregular, and there is an inclination angle between the engine compartment and the front windshield, as well as the trunk lid and the rear windshield. When the car to be detected is far away from the ego car, the clustering threshold in the vertical direction is difficult to set.
The missed-detection problem is mainly caused by two reasons: one is that the laser beam of the lidar can be blocked by other obstacles, resulting in an inability to sample the target; the other is that the obstacles are too far away from the lidar, and the refraction of the laser beam can cause point cloud position errors. In subsequent work, multi-sensor fusion combined with visual sensors could be used to solve the above problems.
The evaluation results are shown in Table 2, which shows that the Precision, Recall and F1 scores are increased significantly if the proposed adaptive neighborhood search radius clustering method is adopted; therefore, the obstacle detection method proposed in this paper can significantly improve obstacle detection accuracy.

5. Conclusions

In this paper, an adaptive neighborhood search radius clustering algorithm is proposed, to solve the problem of unsatisfactory obstacle detection accuracy. We statistically analyzed the variation of point cloud horizontal and vertical distance from the lidar, and designed an adaptive clustering threshold, using the pitch angle of the point cloud and the horizontal angle resolution of the lidar, which effectively coped with the characteristics of point cloud non-uniform distribution, as well as reducing the under-segmentation, over-segmentation and missed detection of the obstacle point cloud. The results of multi-scene real vehicle experiments and multi-scene KITTI dataset trials of our method, and of the Euclidean clustering method, show that the correct detection rate and F1 score of our method, compared to those of the Euclidean clustering method, showed improvement of 6.94% and 0.0629, respectively.
However, when the two obstacles were extremely close to each other, and when the obstacles were extremely far from the ego car, false detection and missed detection occurred. In future work, we will adopt the post-fusion of lidar and camera to solve this problem.

Author Contributions

Conceptualization, W.J.; methodology, M.Y.; software, C.S.; validation, Y.Y.; formal analysis, H.W.; writing—original draft preparation, W.J. All authors have read and agreed to the published version of the manuscript.

Funding

This work was supported in part by the National Natural Science Foundation of China, under Grants 62173119 and 61673154.

Data Availability Statement

The data are only available upon request to the corresponding author.

Conflicts of Interest

The authors declare no conflict of interest.

References

  1. Jin, X.; Yang, H.; Liao, X.; Yan, Z.; Wang, Q.; Li, Z.; Wang, Z. A Robust Gaussian Process-Based Lidar Ground Segmentation Algorithm for Autonomous Driving. Machines 2022, 10, 507. [Google Scholar] [CrossRef]
  2. Wang, G.; Wu, J.; He, R.; Yang, S. A Point Cloud-Based Robust Road Curb Detection and Tracking Method. IEEE Access 2019, 7, 24611–24625. [Google Scholar] [CrossRef]
  3. Dai, Y.; Lee, S. Perception, Planning and Control for Self-Driving System Based on On-Board Sensors. Adv. Mech. Eng. 2020, 12, 1–13. [Google Scholar] [CrossRef]
  4. Pendleton, S.D.; Andersen, H.; Du, X.; Shen, X.; Meghjani, M.; Eng, Y.H.; Rus, D.; Ang, M. Perception, Planning, Control, and Coordination for Autonomous Vehicles. Machines 2017, 5, 6. [Google Scholar] [CrossRef]
  5. Shen, Z.; Liang, H.; Lin, L.; Wang, Z.; Huang, W.; Yu, J. Fast Ground Segmentation for 3D Lidar Point Cloud Based on Jump-Convolution-Process. Remote Sens. 2021, 13, 3239–3259. [Google Scholar] [CrossRef]
  6. Yurtsever, E.; Lambert, J.; Carballo, A.; Takeda, K. A Survey of Autonomous Driving: Common Practices and Emerging Technologies. IEEE Access 2020, 8, 58443–58469. [Google Scholar] [CrossRef]
  7. Xie, D.; Xu, Y.; Wang, R. Obstacle Detection and Tracking Method for Autonomous Vehicle Based on Three-Dimensional Lidar. Int. J. Adv. Robot. Syst. 2019, 16, 1–13. [Google Scholar] [CrossRef] [Green Version]
  8. Schubert, E.; Sander, J.; Ester, M.; Kriegel, H.P.; Xu, X. DBSCAN Revisited, Revisited: Why and How You Should (Still) Use DBSCAN. ACM Trans. Database Syst. (TODS) 2017, 42, 1–21. [Google Scholar] [CrossRef]
  9. Sun, X.; Ma, H.; Sun, Y.; Liu, M. A Novel Point Cloud Compression Algorithm Based on Clustering. IEEE Robot. Autom. Lett. 2019, 4, 2132–2139. [Google Scholar] [CrossRef]
  10. Wang, Y.; Wang, B.; Wang, X.; Tan, Y.; Qi, J.; Gong, J. A Fusion of Dynamic Occupancy Grid Mapping and Multi-Object Tracking Based on Lidar and Camera Sensors. In Proceedings of the 2020 3rd International Conference on Unmanned Systems (ICUS), Harbin, China, 27–28 November 2020. [Google Scholar]
  11. Zermas, D.; Izzat, I.; Papanikolopoulos, N. Fast Segmentation of 3D Point Clouds: A Paradigm on Lidar Data for Autonomous Vehicle Applications. In Proceedings of the 2017 IEEE International Conference on Robotics and Automation (ICRA), Singapore, 29 May–3 June 2017. [Google Scholar]
  12. Li, Y.; Ma, L.; Zhong, Z.; Liu, F.; Chapman, M.A.; Cao, D.; Li, J. Deep Learning for Lidar Point Clouds in Autonomous Driving: A Review. IEEE Trans. Neural Netw. Learn. Syst. 2021, 32, 3412–3432. [Google Scholar] [CrossRef]
  13. Lang, A.; Vora, S.; Caesar, H.; Zhou, L.; Yang, J.; Beijborn, O. Pointpillars: Fast Encoders for Object Detection from Point Clouds. In Proceedings of the 2019 IEEE/CVF Conference on Computer Vision and Pattern Recognition, Long Beach, CA, USA, 15–20 June 2019. [Google Scholar]
  14. Zhao, J.; Xu, H.; Liu, H.; Wu, J.; Zheng, Y.; Wu, D. Detection and Tracking of Pedestrians and Vehicles Using Roadside Lidar Sensors. Transp. Res. Part C Emerg. Technol. 2019, 100, 68–87. [Google Scholar] [CrossRef]
  15. Wang, C.; Ji, M.; Wang, J.; Wen, W.; Li, T.; Sun, Y. An Improved DBSCAN Method for Lidar Data Segmentation with Automatic Eps Estimation. Sensors 2019, 19, 172–197. [Google Scholar] [CrossRef] [PubMed] [Green Version]
  16. Xia, X.; Zhu, S.; Zhou, Y.; Ye, M.; Zhao, Y. Lidar K-means Clustering Algorithm Based on Threshold. J. Beijing Univ. Aeronaut. Astronaut. 2020, 46, 115–121. [Google Scholar] [CrossRef]
  17. Li, X.; Zhang, Y.; Yang, Y. Outlier Detection for Reconstructed Point Clouds Based on Image. In Proceedings of the 2017 First International Conference on Electronics Instrumentation & Information Systems (EIIS), Harbin, China, 3–5 June 2017. [Google Scholar]
  18. Wang, X.; Wang, W.; Yin, X.; Xiang, C.; Zhang, Y. A New Grid Map Construction Method for Autonomous Vehicles. IFAC-PapersOnLine 2018, 51, 377–382. [Google Scholar] [CrossRef]
  19. Desheng, X.; Youchun, X.; Rendong, W. Obstacle Detection and Tracking for Unmanned Vehicles Based on 3D Laser Radar. Automot. Eng. 2018, 40, 952–959. [Google Scholar] [CrossRef]
  20. Yan, D.; Zeng, C.; Yan, S. Obstacle Circumnavigation System Based on Lidar Sensing. In Proceedings of the 2022 8th International Conference on Control, Automation and Robotics (ICCAR), Xiamen, China, 8–10 April 2022. [Google Scholar]
  21. Guo, R.; Jiang, Z.; Gao, R.; Yang, W.; Gao, Y.; Chen, X.; Zhi, Y.; Guo, L. Unmanned Vehicle 3D Lidar Point Cloud Segmentation. In Proceedings of the 2021 40th Chinese Control Conference (CCC) 2021, Shanghai, China, 26–28 July 2021. [Google Scholar]
  22. Wen, L.; He, L.; Gao, Z. Research on 3D Point Cloud De-Distortion Algorithm and Its Application on Euclidean Clustering. IEEE Access 2019, 7, 86041–86053. [Google Scholar] [CrossRef]
  23. Fan, X.; Xu, G.; Lin, W.; Wang, X.; Chang, L. Target Segmentation Method for Three-Dimensional Lidar Point Cloud Based on Depth Image. Chin. J. Lasers 2019, 46, 292–299. [Google Scholar] [CrossRef]
  24. Zheng, L.; Zhang, P.; Tan, J.; Li, F. The Obstacle Detection Method of UAV Based on 2D Lidar. IEEE Access 2019, 7, 163437–163448. [Google Scholar] [CrossRef]
  25. Qi, C.; Su, H.; Mo, K.; Guibas, L.J. PointNet: Deep Learning on Point Sets for 3D Classification and Segmentation. In Proceedings of the 2017 IEEE Conference on Computer Vision and Pattern Recognition (CVPR), Honolulu, HI, USA, 21–26 July 2017. [Google Scholar]
  26. Qi, C.; Yi, L.; Su, H.; Guibas, L.J. PointNet++: Deep Hierarchical Feature Learning on Point Sets in A Metric Space. Adv. Neural Inf. Process. Syst. 2017, 30, 5099–5108. [Google Scholar] [CrossRef]
  27. Shi, S.; Wang, X.; Li, H. PointRCNN: 3D Object Proposal Generation and Detection from Point Cloud. In Proceedings of the 2019 IEEE/CVF Conference on Computer Vision and Pattern Recognition, Long Beach, CA, USA, 15–20 June 2019. [Google Scholar]
  28. Fan, J.; Wang, L.; Chu, W.; Luo, Y. Research on Pedestrian Recognition in Cross-Country Environment Based on KDTree and Euclidean Clustering. Automot. Eng. 2019, 41, 1410–1415. [Google Scholar] [CrossRef]
  29. Geiger, A.; Lenz, P.; Stiller, C.; Urtasun, R. Vision Meets Robotics: The Kitti Dataset. Int. J. Robot. Res. 2013, 32, 1231–1237. [Google Scholar] [CrossRef] [Green Version]
  30. Zhao, Z.-Q.; Zheng, P.; Xu, S.-T.; Wu, X. Object Detection with Deep Learning: A Review. IEEE Trans. Neural Netw. Learn. Syst. 2019, 30, 3212–3232. [Google Scholar] [CrossRef] [PubMed] [Green Version]
  31. Tang, X.; Zhang, Z.; Qin, Y. On-Road Object Detection and Tracking Based on Radar and Vision Fusion: A Review. IEEE Intell. Transp. Syst. Mag. 2022, 14, 103–128. [Google Scholar] [CrossRef]
  32. Zhao, C.; Fu, C.; Dolan, J.M.; Wang, J. L-Shape Fitting-Based Vehicle Pose Estimation and Tracking Using 3D-Lidar. IEEE Trans. Intell. Veh. 2021, 6, 787–798. [Google Scholar] [CrossRef]
Figure 1. Interference point removal: (a) point cloud before interference point removal; (b) point cloud after interference point removal.
Machines 11 00054 g001
Figure 2. Result of ground segmentation: (a) ground point cloud; (b) obstacle point cloud.
Machines 11 00054 g002
Figure 3. Point cloud spatial distribution.
Machines 11 00054 g003
Figure 4. Schematic diagram of neighborhood search: (a) first step; (b) second step; (c) third step.
Machines 11 00054 g004
Figure 5. Horizontal and vertical distance between two adjacent points at 0–100 m from lidar.
Machines 11 00054 g005
Figure 6. Wrong point cloud segmentation results using fixed clustering threshold: (a) the point cloud of the two pedestrians is under-segmented; (b) the point cloud of the car is over-segmented; (c) the point cloud of the pedestrians is accurately segmented, and the point cloud of the car is over-segmented; (d) the point cloud of the car is accurately segmented, and the two pedestrians are not detected.
Machines 11 00054 g006
Figure 7. Point clouds of pedestrians and cars: (a) the point cloud of the pedestrians is remote, and the point cloud of the car is near; (b) the point cloud of the pedestrians is near, and the point cloud of the car is remote.
Machines 11 00054 g007
Figure 8. Theoretical and measured values of the distance between two points in the horizontal and vertical directions: (a) horizontal direction; (b) vertical direction.
Machines 11 00054 g008
Figure 9. Experimental platform.
Machines 11 00054 g009
Figure 10. Scene of multiple adjacent pedestrians: (a) obstacle point cloud; (b) Euclidean clustering; (c) proposed method.
Machines 11 00054 g010
Figure 11. Scene of a car and a pedestrian: (a) obstacle point cloud; (b) Euclidean clustering; (c) proposed method.
Machines 11 00054 g011
Figure 12. Scene of a near car and two remote pedestrians: (a) obstacle point cloud; (b) Euclidean clustering; (c) proposed method.
Machines 11 00054 g012
Figure 13. Scene of a remote car and pedestrians: (a) obstacle point cloud; (b) Euclidean clustering; (c) proposed method.
Machines 11 00054 g013
Figure 14. Continuous detection of Euclidean clustering: (a) 2.5 s; (b) 5.0 s; (c) 7.5 s; (d) 10.0 s.
Machines 11 00054 g014
Figure 15. Continuous detection of proposed method: (a) 2.5 s; (b) 5.0 s; (c) 7.5 s; (d) 10.0 s.
Machines 11 00054 g015
Figure 16. Comparison of detection results.
Machines 11 00054 g016
Figure 17. Under-segmentation in KITTI dataset experiments: (a) scene image; (b) proposed method.
Machines 11 00054 g017
Figure 18. Over-segmentation in KITTI dataset experiments: (a) scene image; (b) proposed method.
Machines 11 00054 g018
Figure 19. Missed detection in KITTI dataset experiments: (a) scene image; (b) proposed method.
Machines 11 00054 g019
Table 1. Configuration of sensors.
SensorNumber
VLP-16 lidar3
Camera1
Millimeter wave radar4
GPS/INS1
Ultrasonic radar12
Gyro Sensor1
VBOX1
Table 2. Evaluation results.
PrecisionRecallF1 Score
Proposed method0.95770.93260.9449
Euclidean method0.90300.86180.8820
Disclaimer/Publisher’s Note: The statements, opinions and data contained in all publications are solely those of the individual author(s) and contributor(s) and not of MDPI and/or the editor(s). MDPI and/or the editor(s) disclaim responsibility for any injury to people or property resulting from any ideas, methods, instructions or products referred to in the content.

