

Frequency Response Analysis for Three-Phase Star and Delta Induction Motors: Pattern Recognition and Fault Analysis Using Statistical Indicators

 , ,
, ,  , , , , and
Abstract
:1. Introduction
- In [15], the results show that the FRA method can be utilized to identify faults in the IMs. The FRA measurement shows a noticeable variation in the frequency range of between 1 kHz and 300 kHz due to broken bars in the squirrel cage rotor. The investigation was based on the rotor’s position. Additionally, no FRA interpretation methodology was presented.
- The findings in [16] show that short-circuit (SC) faults result in a variation on the IM FRA signature with significant variation due to Phase-to-Phase SC faults. Three statistical indicators were only used to interpret the obtained results, and only two types of SC faults were investigated.
- In [17], the conducted study shows that FRA can detect emerging IM winding faults at the 1% fault level. The SC fault in the turns in only one phase was studied. Additionally, there is a lack of results interpretation.
- In [20], the results show that FRA detects the variation due to IM winding faults. The interpretation of the measured data was conducted using statistical indicators along with personnel experience.
- In [21], FRA measurements of the power transformer and IM are taken. While the measurement procedure is proposed for IM, no interpretation methodology was proposed in this paper.
- In [22], the study was conducted to evaluate the application of FRA on the SC fault assessment of synchronous machines. The FRA curve was obtained to show the changes due to the SC fault. In the study, small- and medium-sized machines were tested.
- We measured and compared the FRA patterns of the star and delta stator winding for three IMs of different sizes.
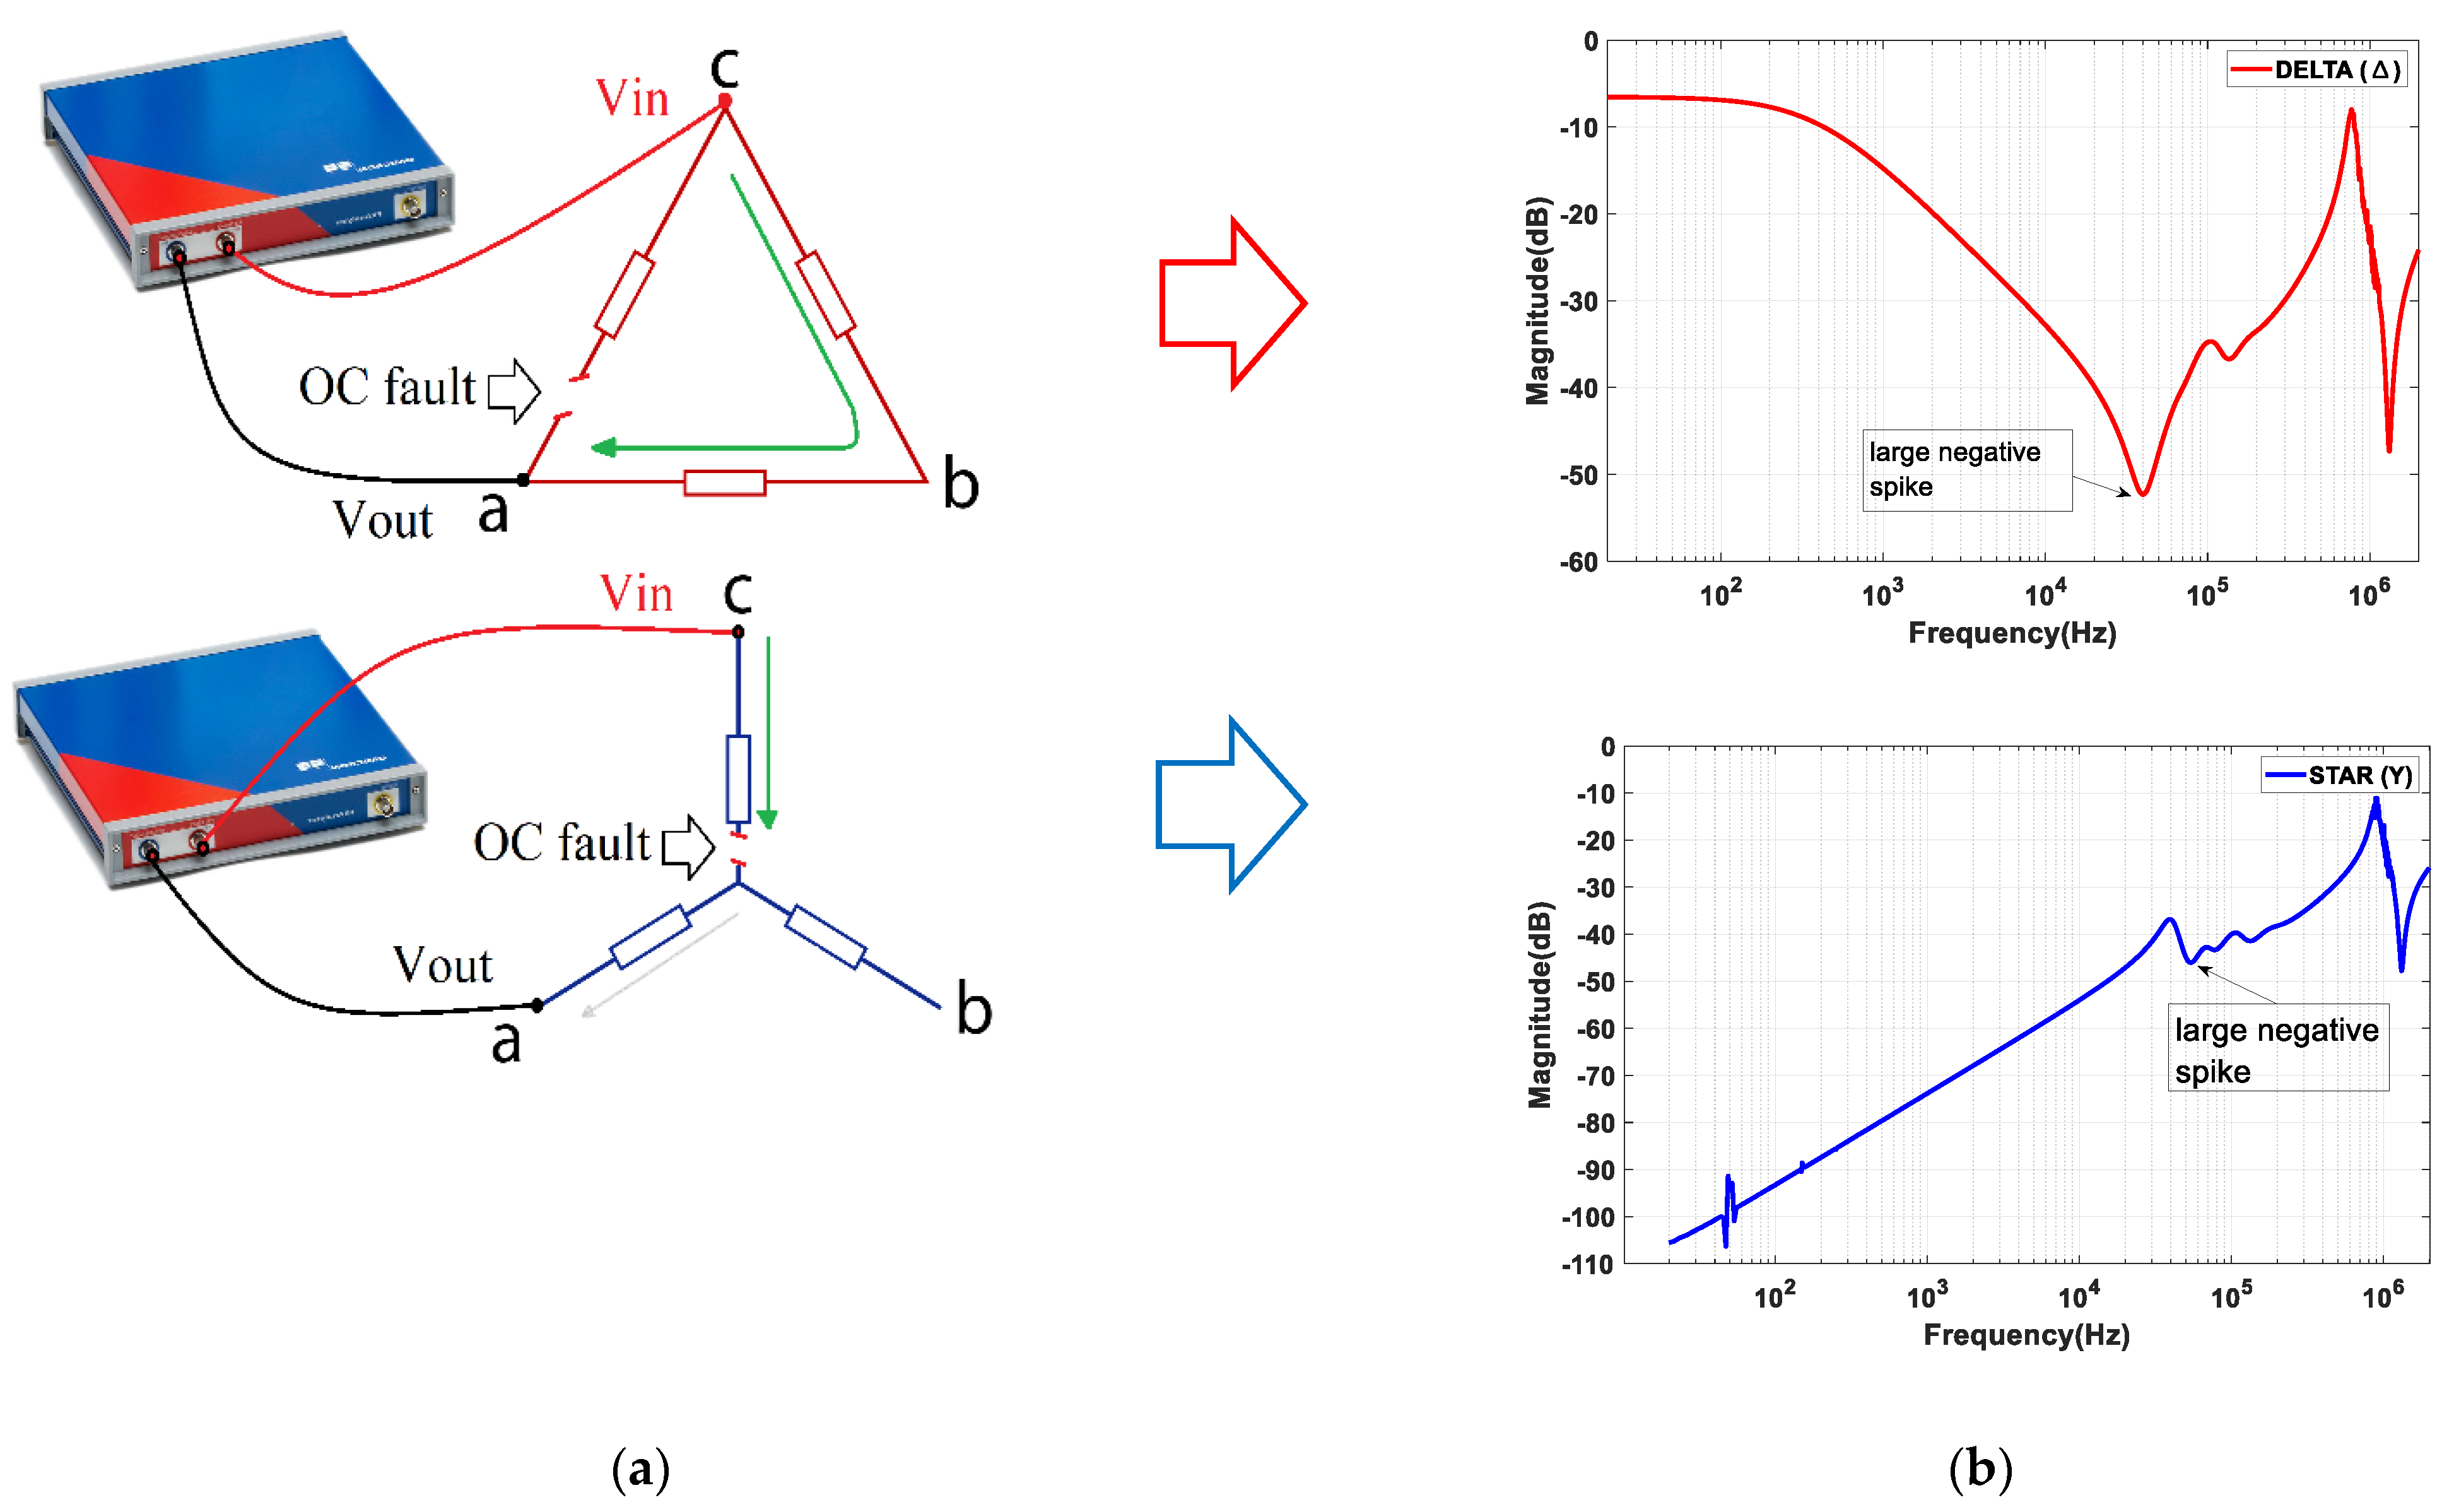
- We investigated the effect of SC and OC faults of star and delta IM windings on the FRA signature.
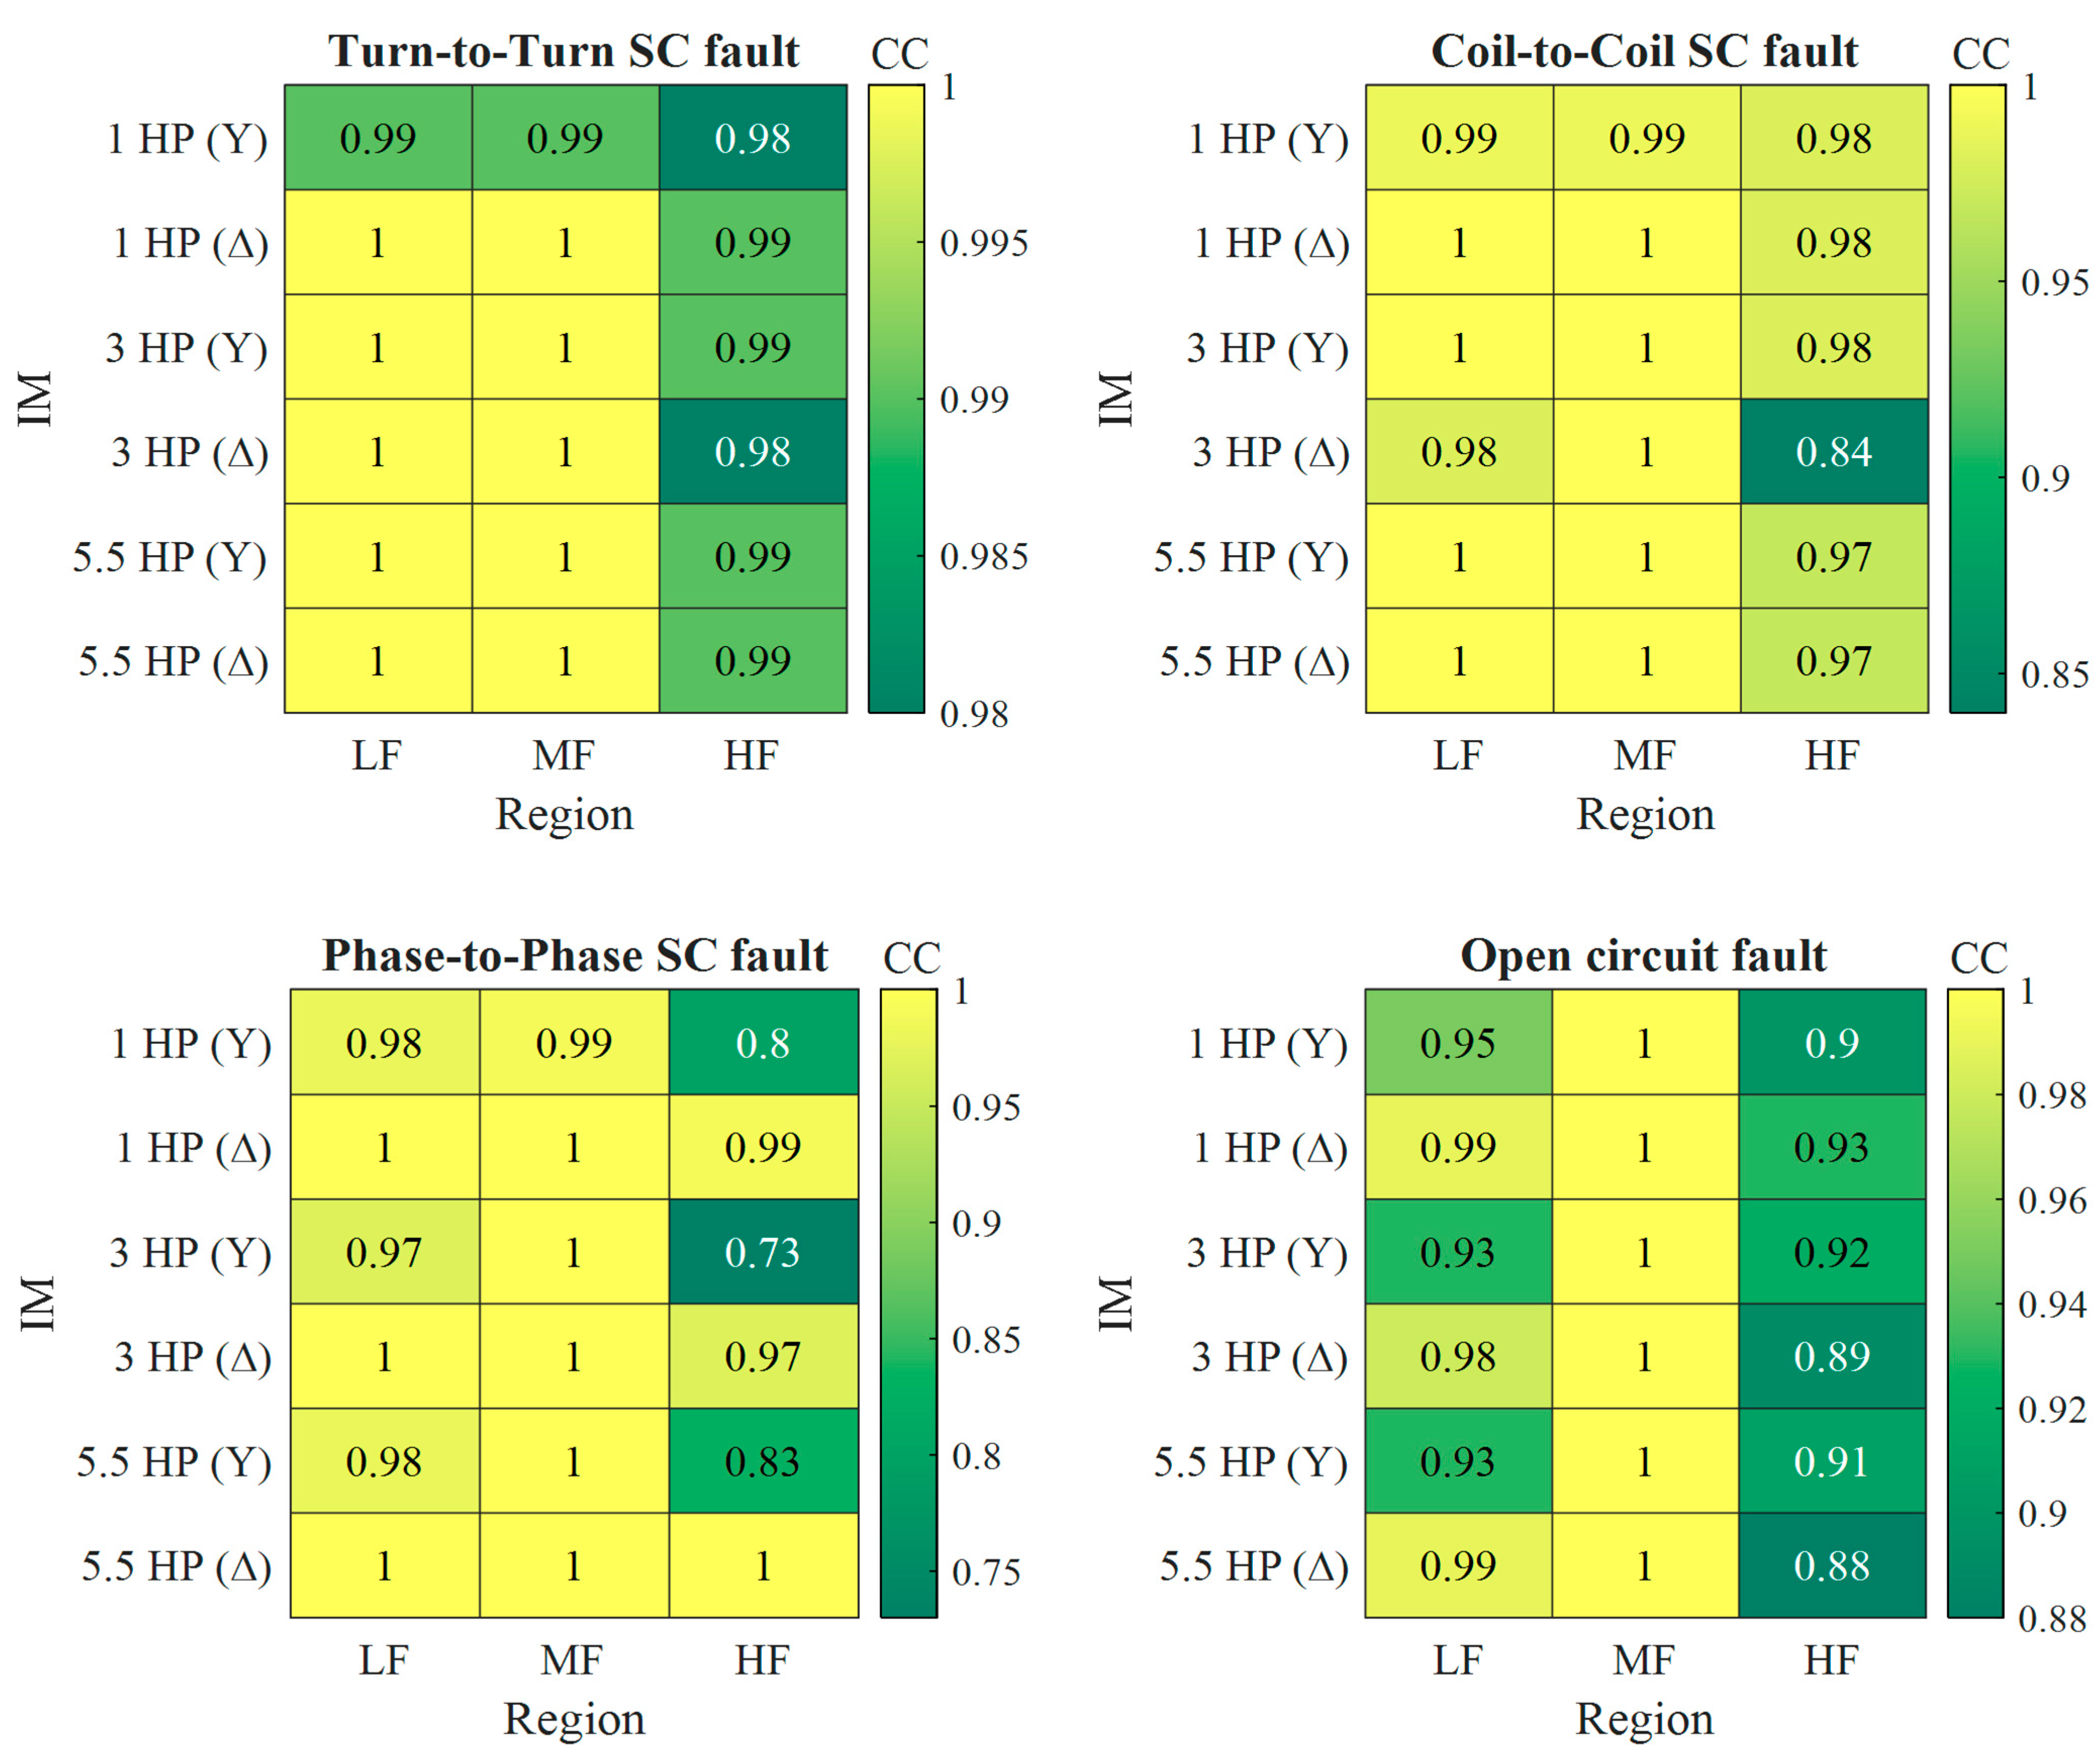
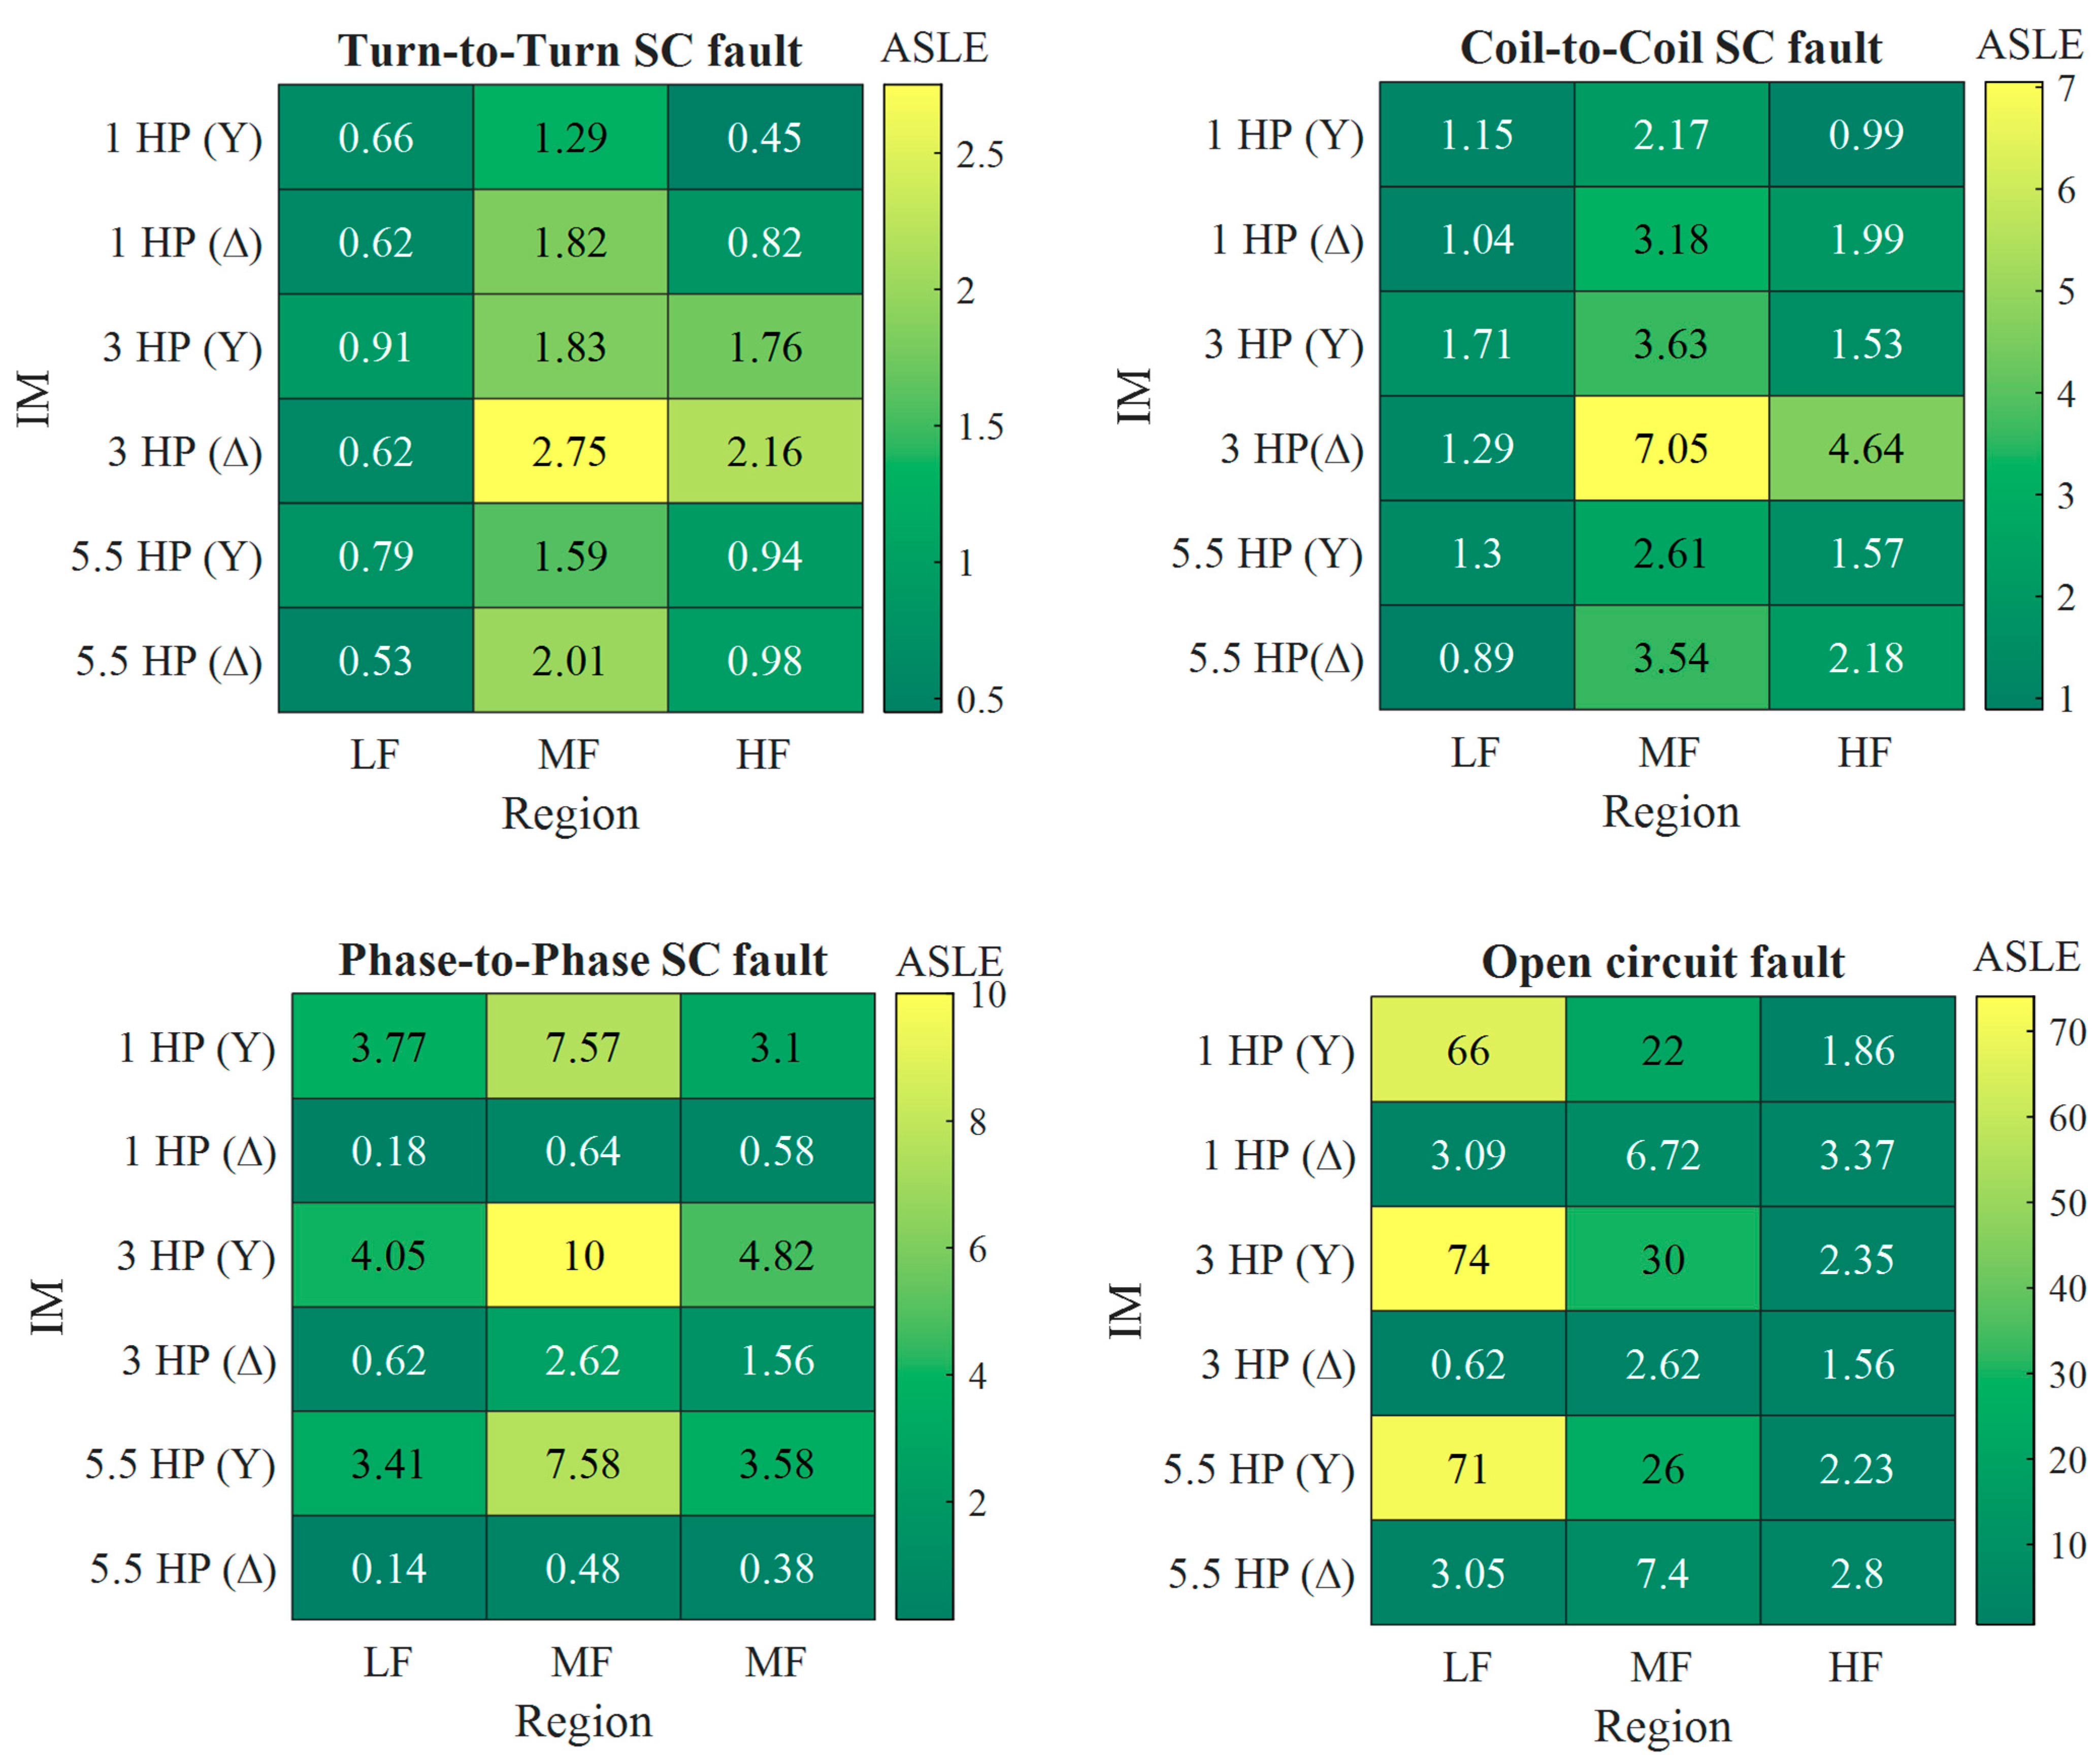
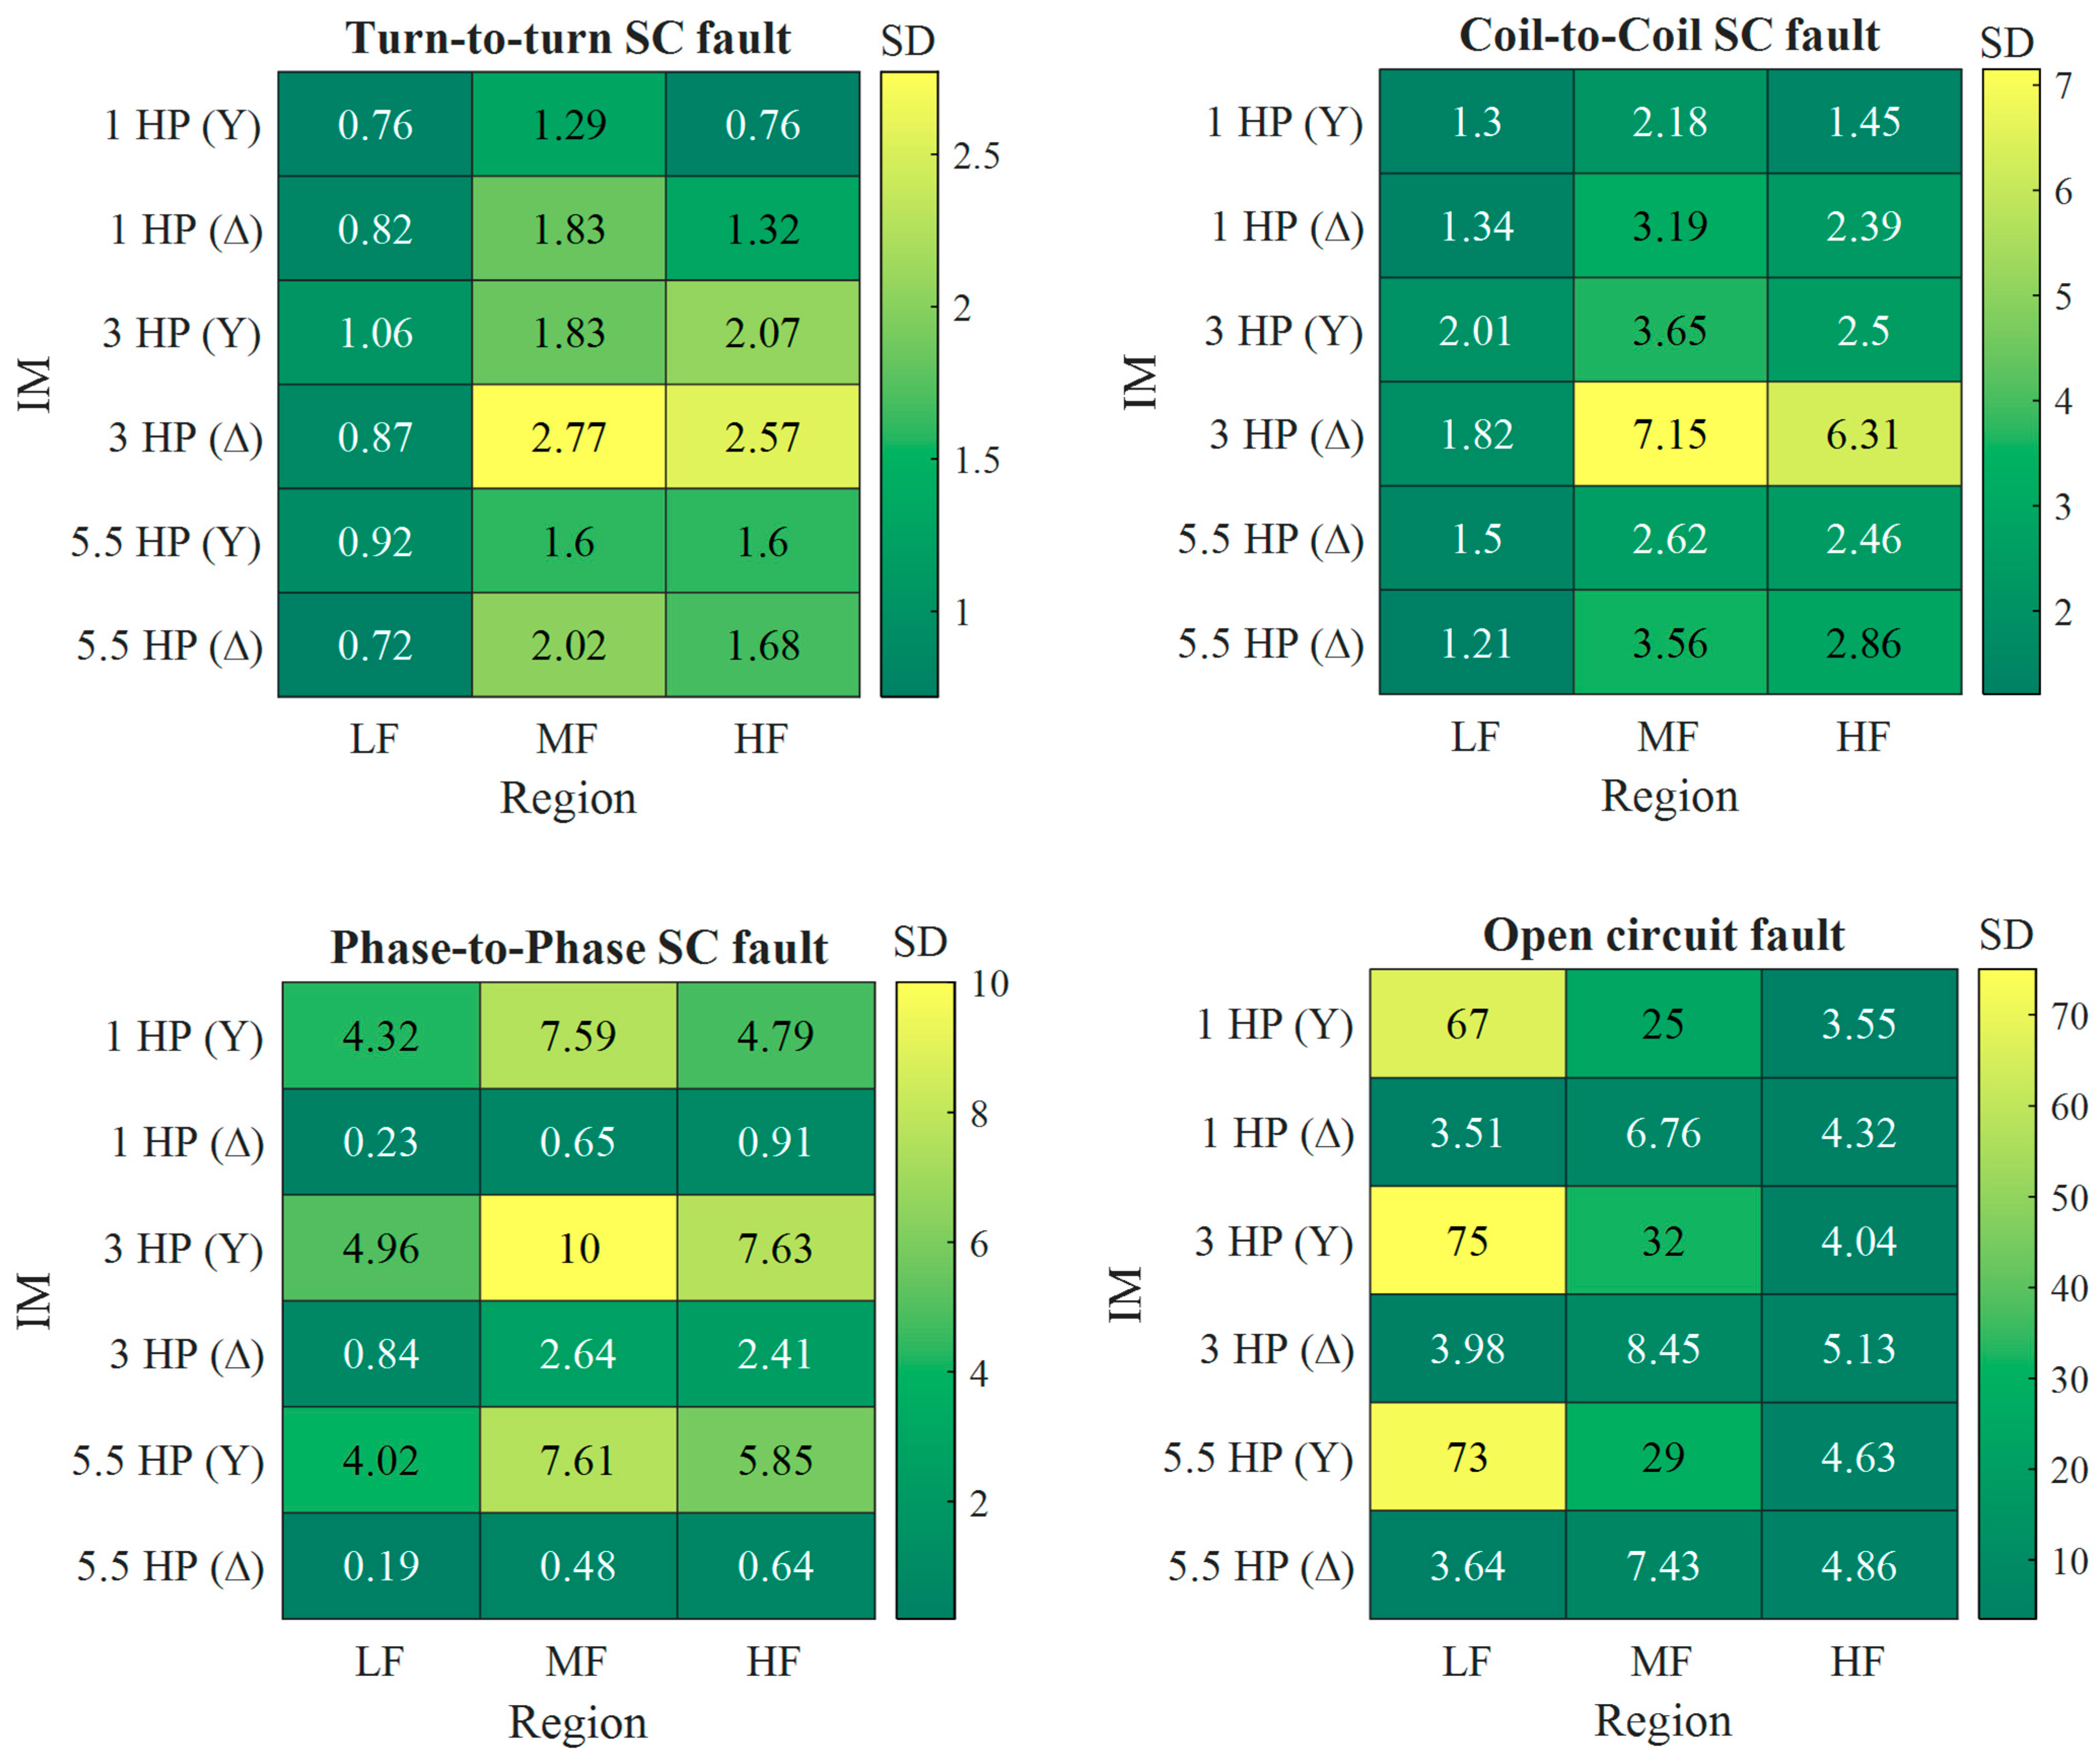
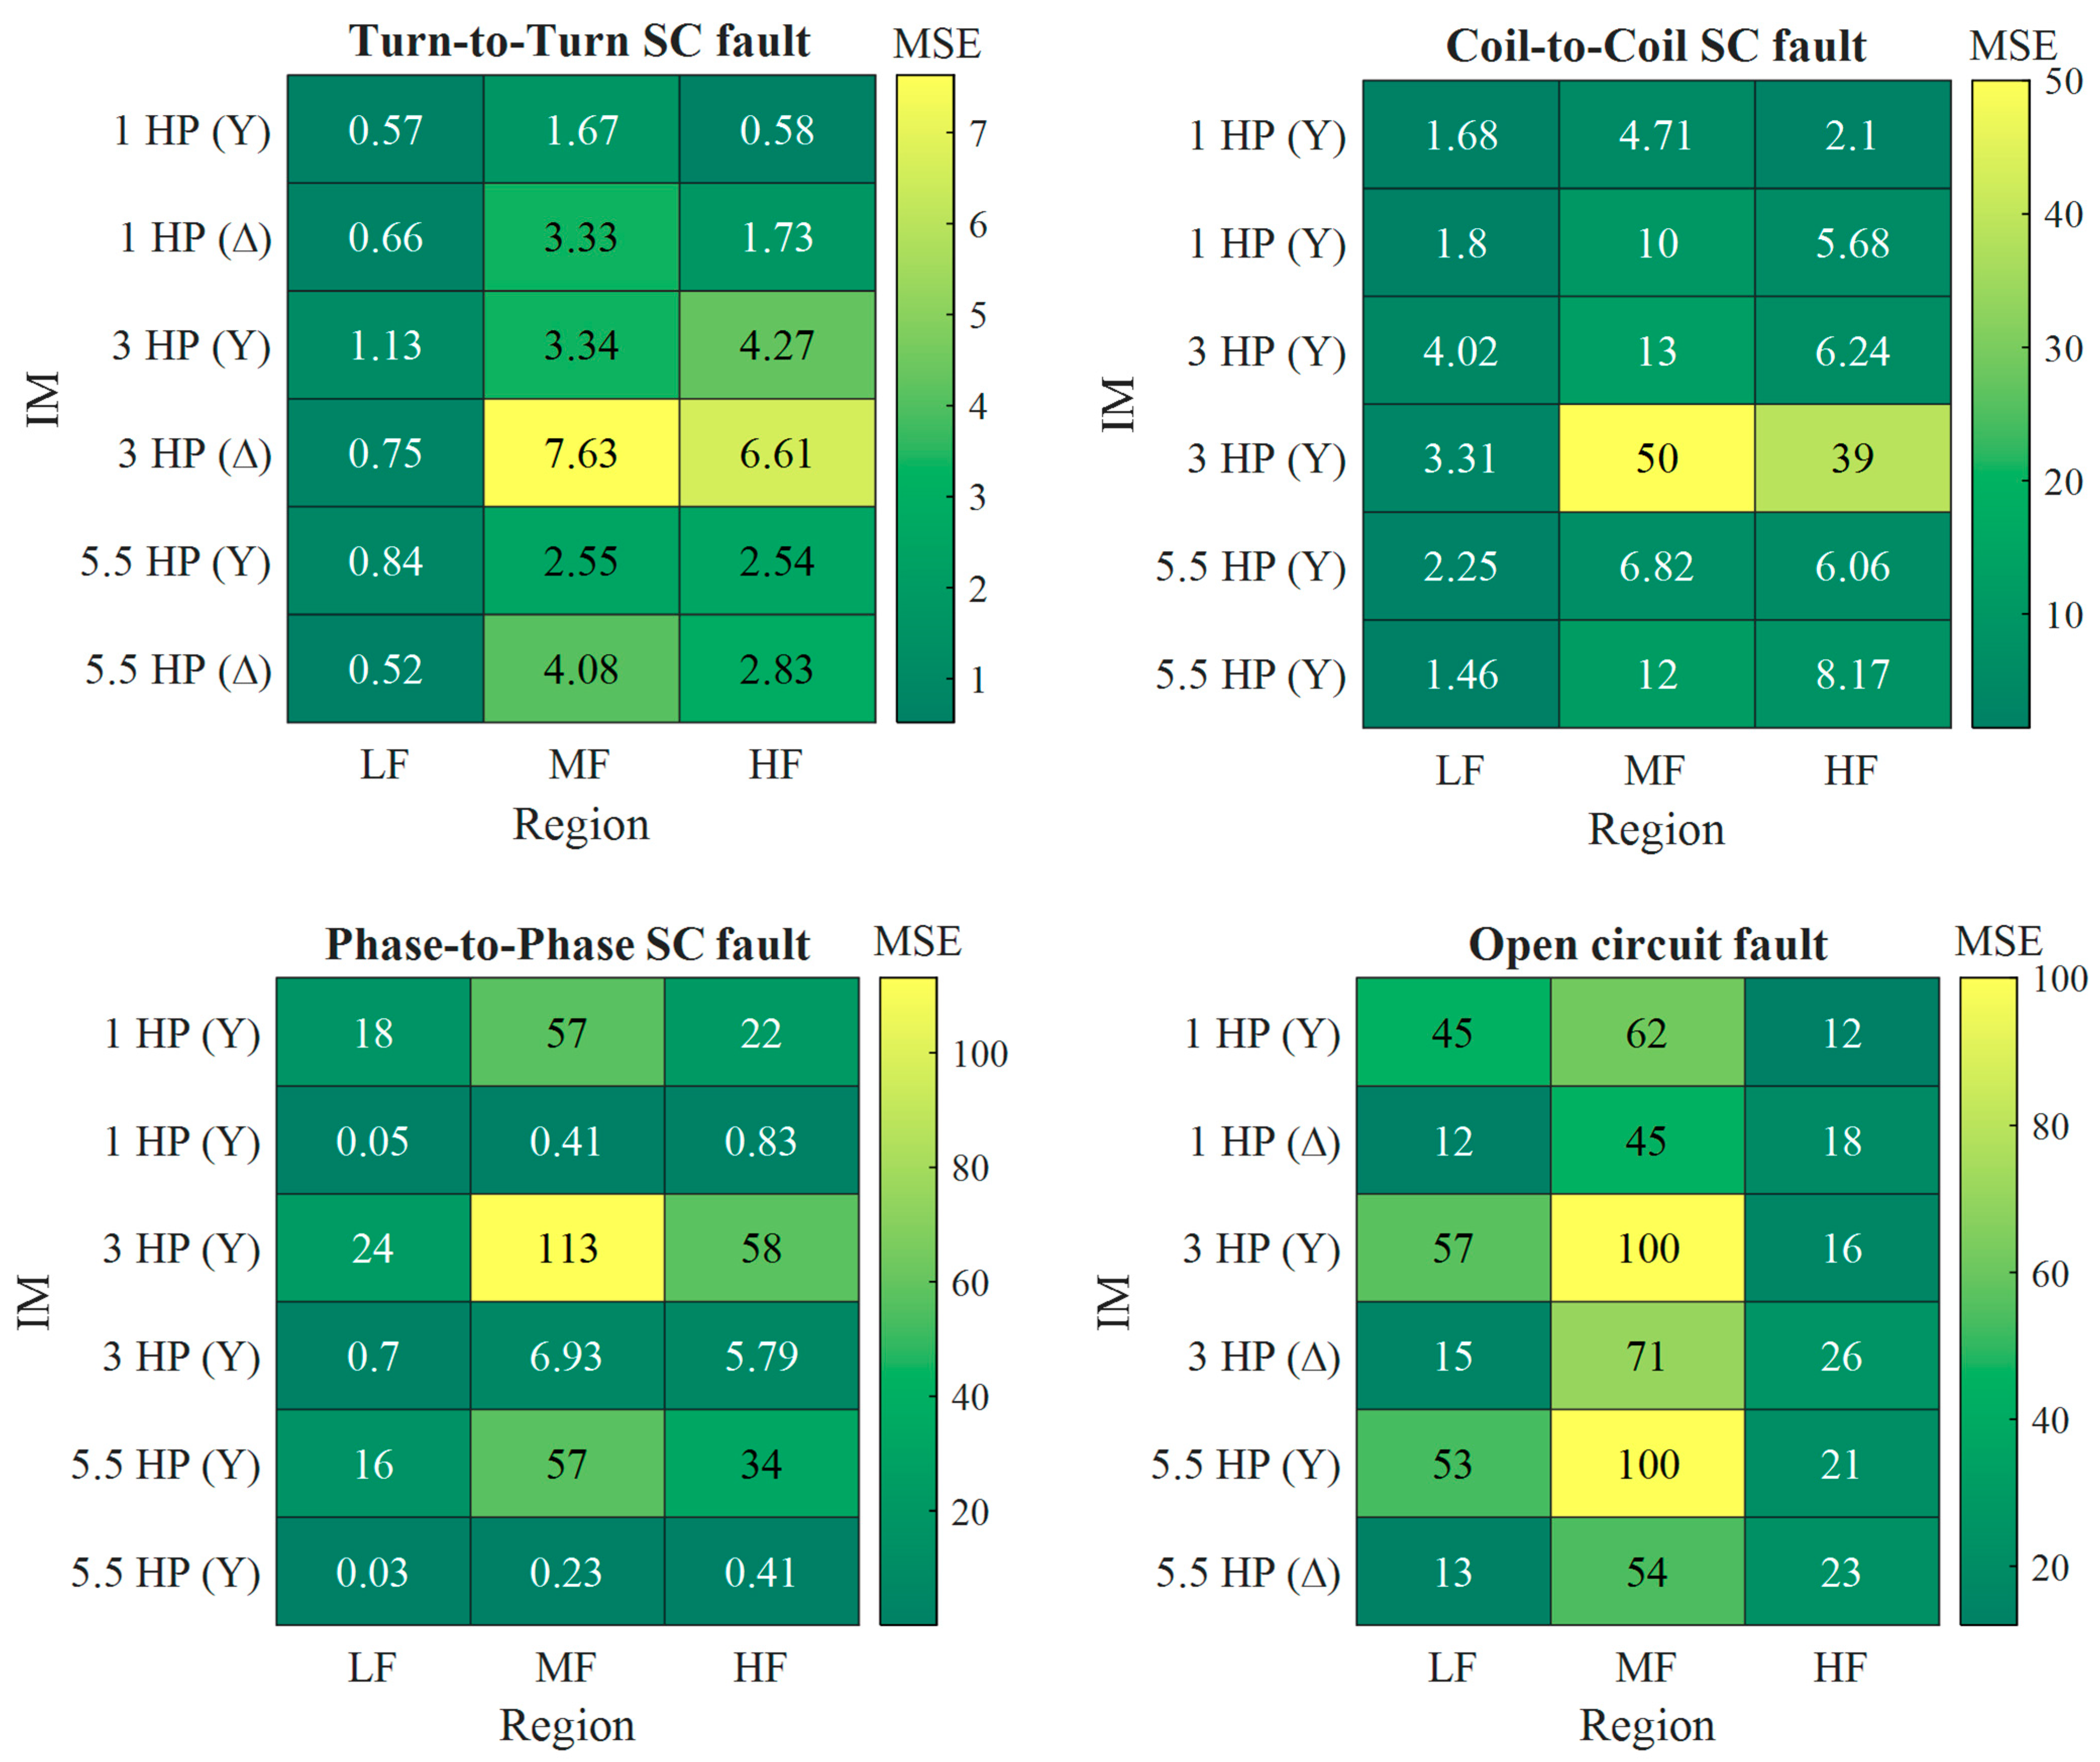
- We identified the threshold limits for various statistical indicators to facilitate the reliable identification and quantification of IM windings faults using FRA measurements.
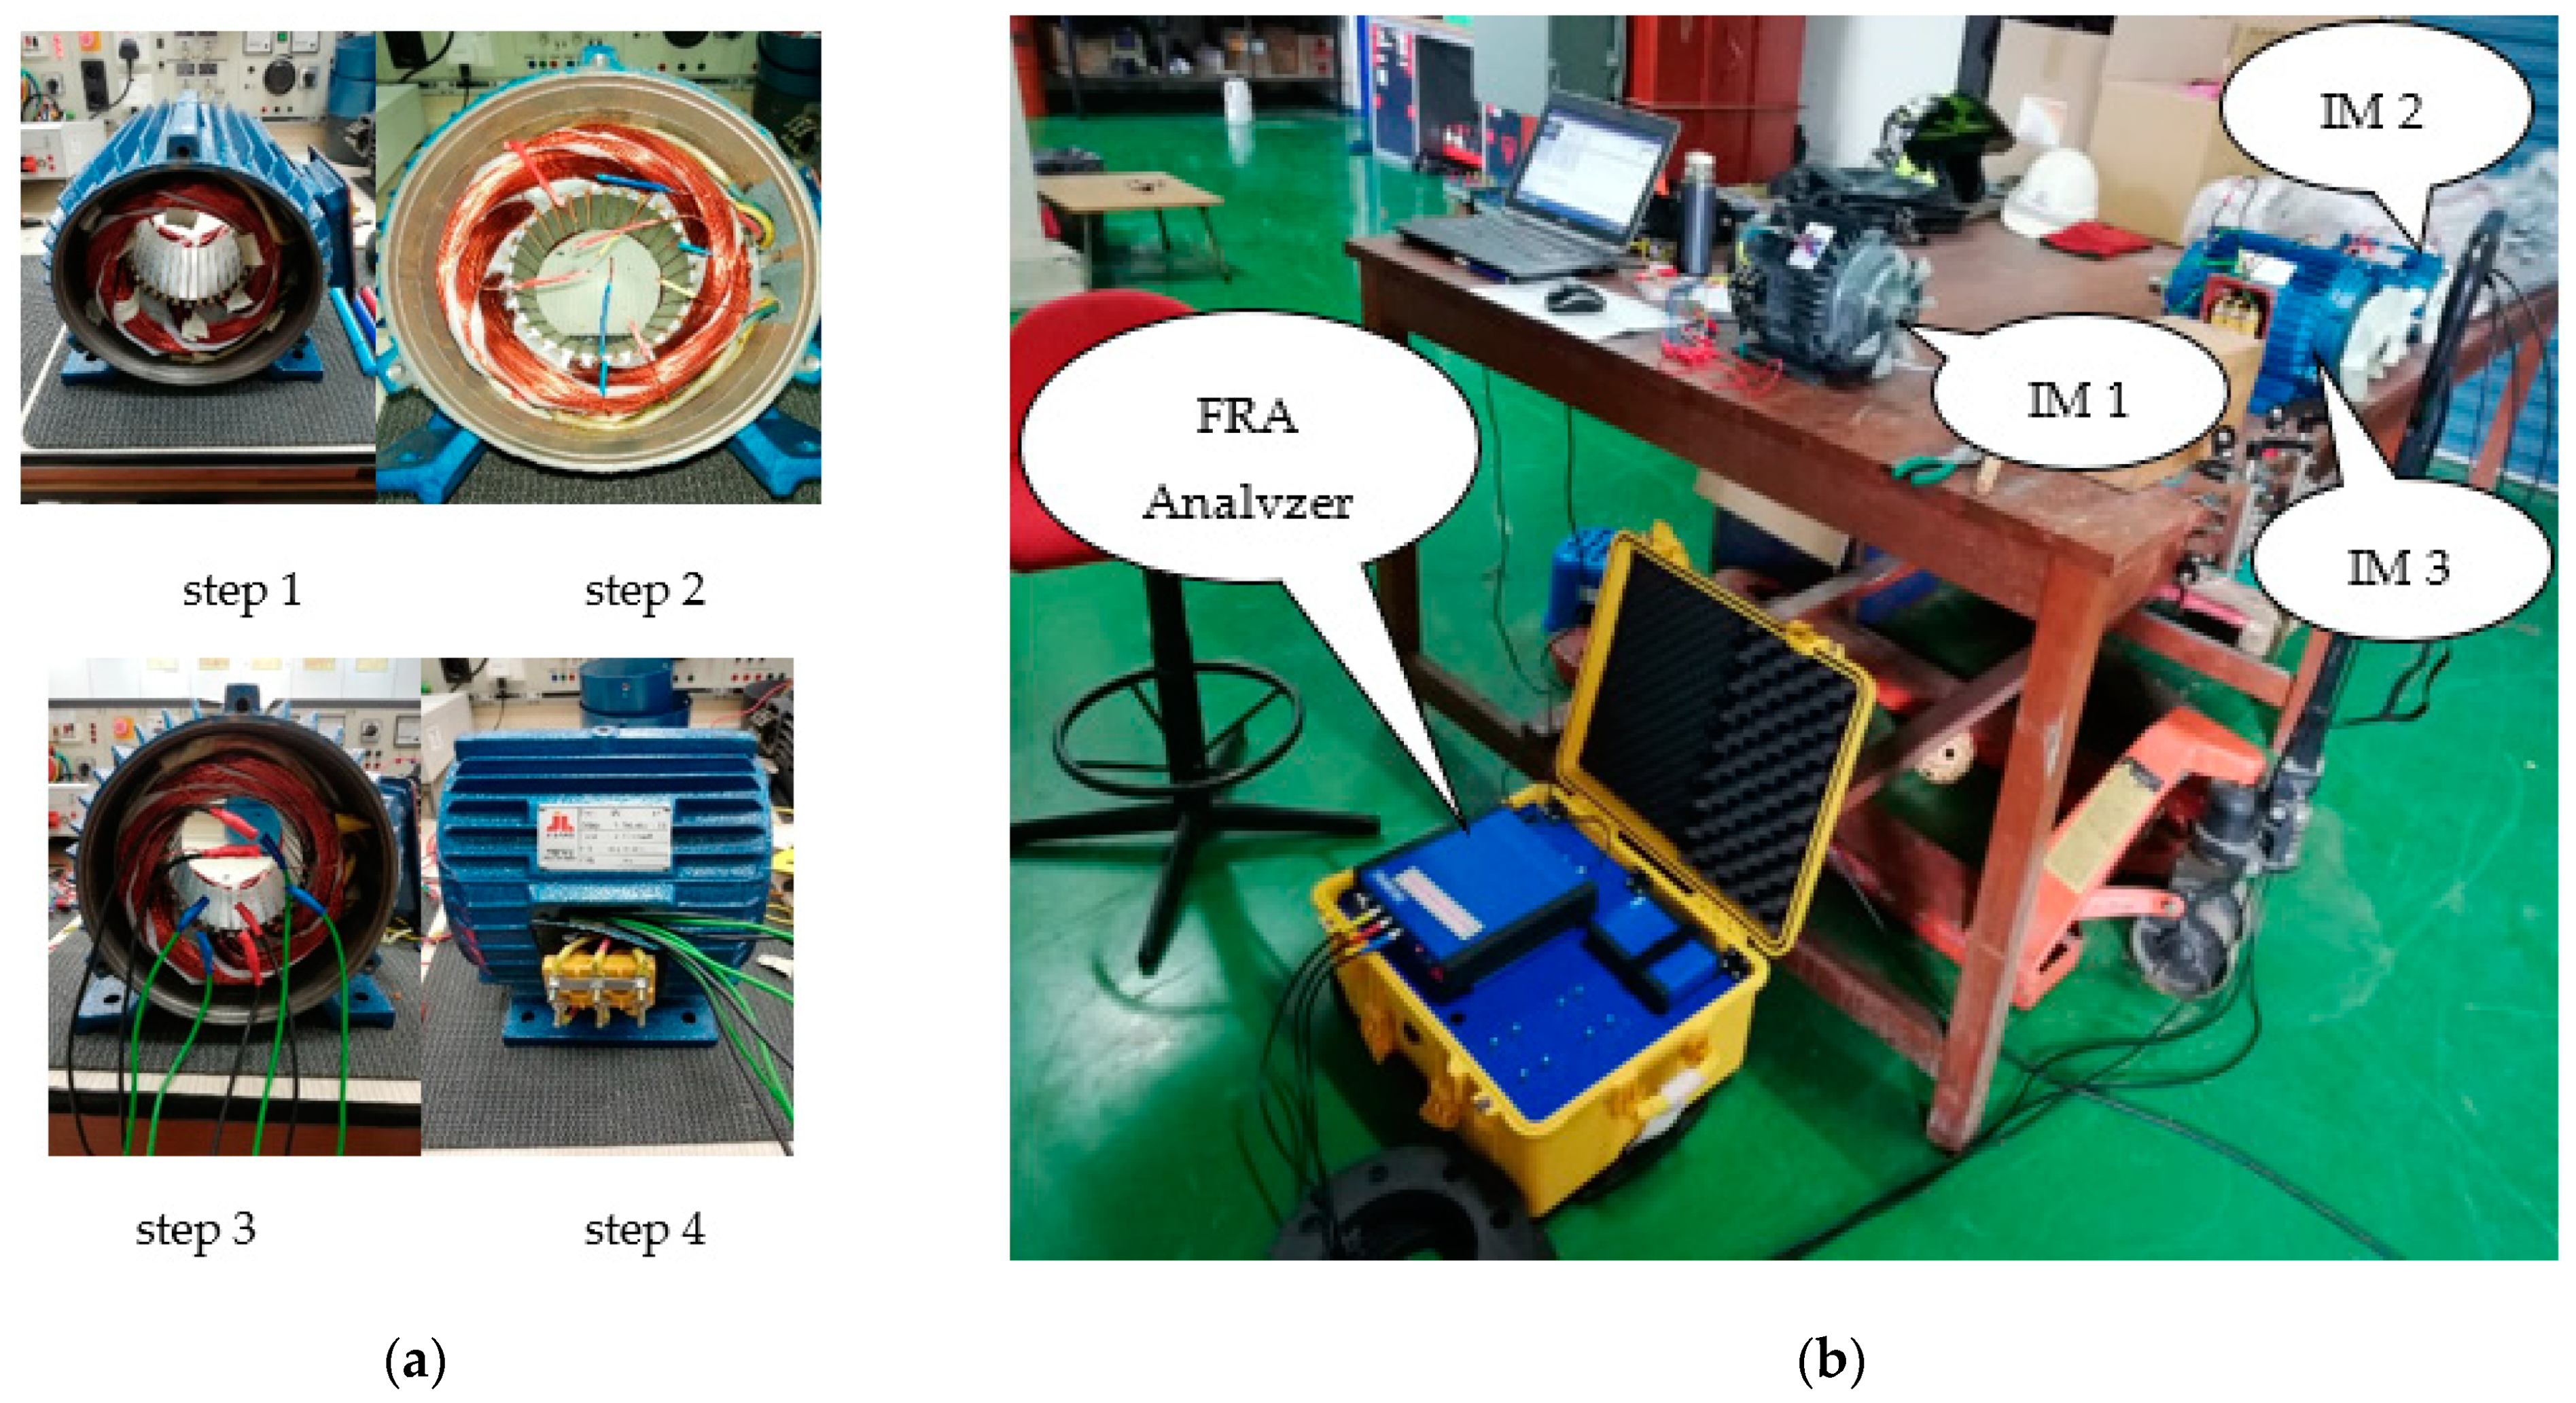
2. Setup and FRA Measurement
3. FRA Results
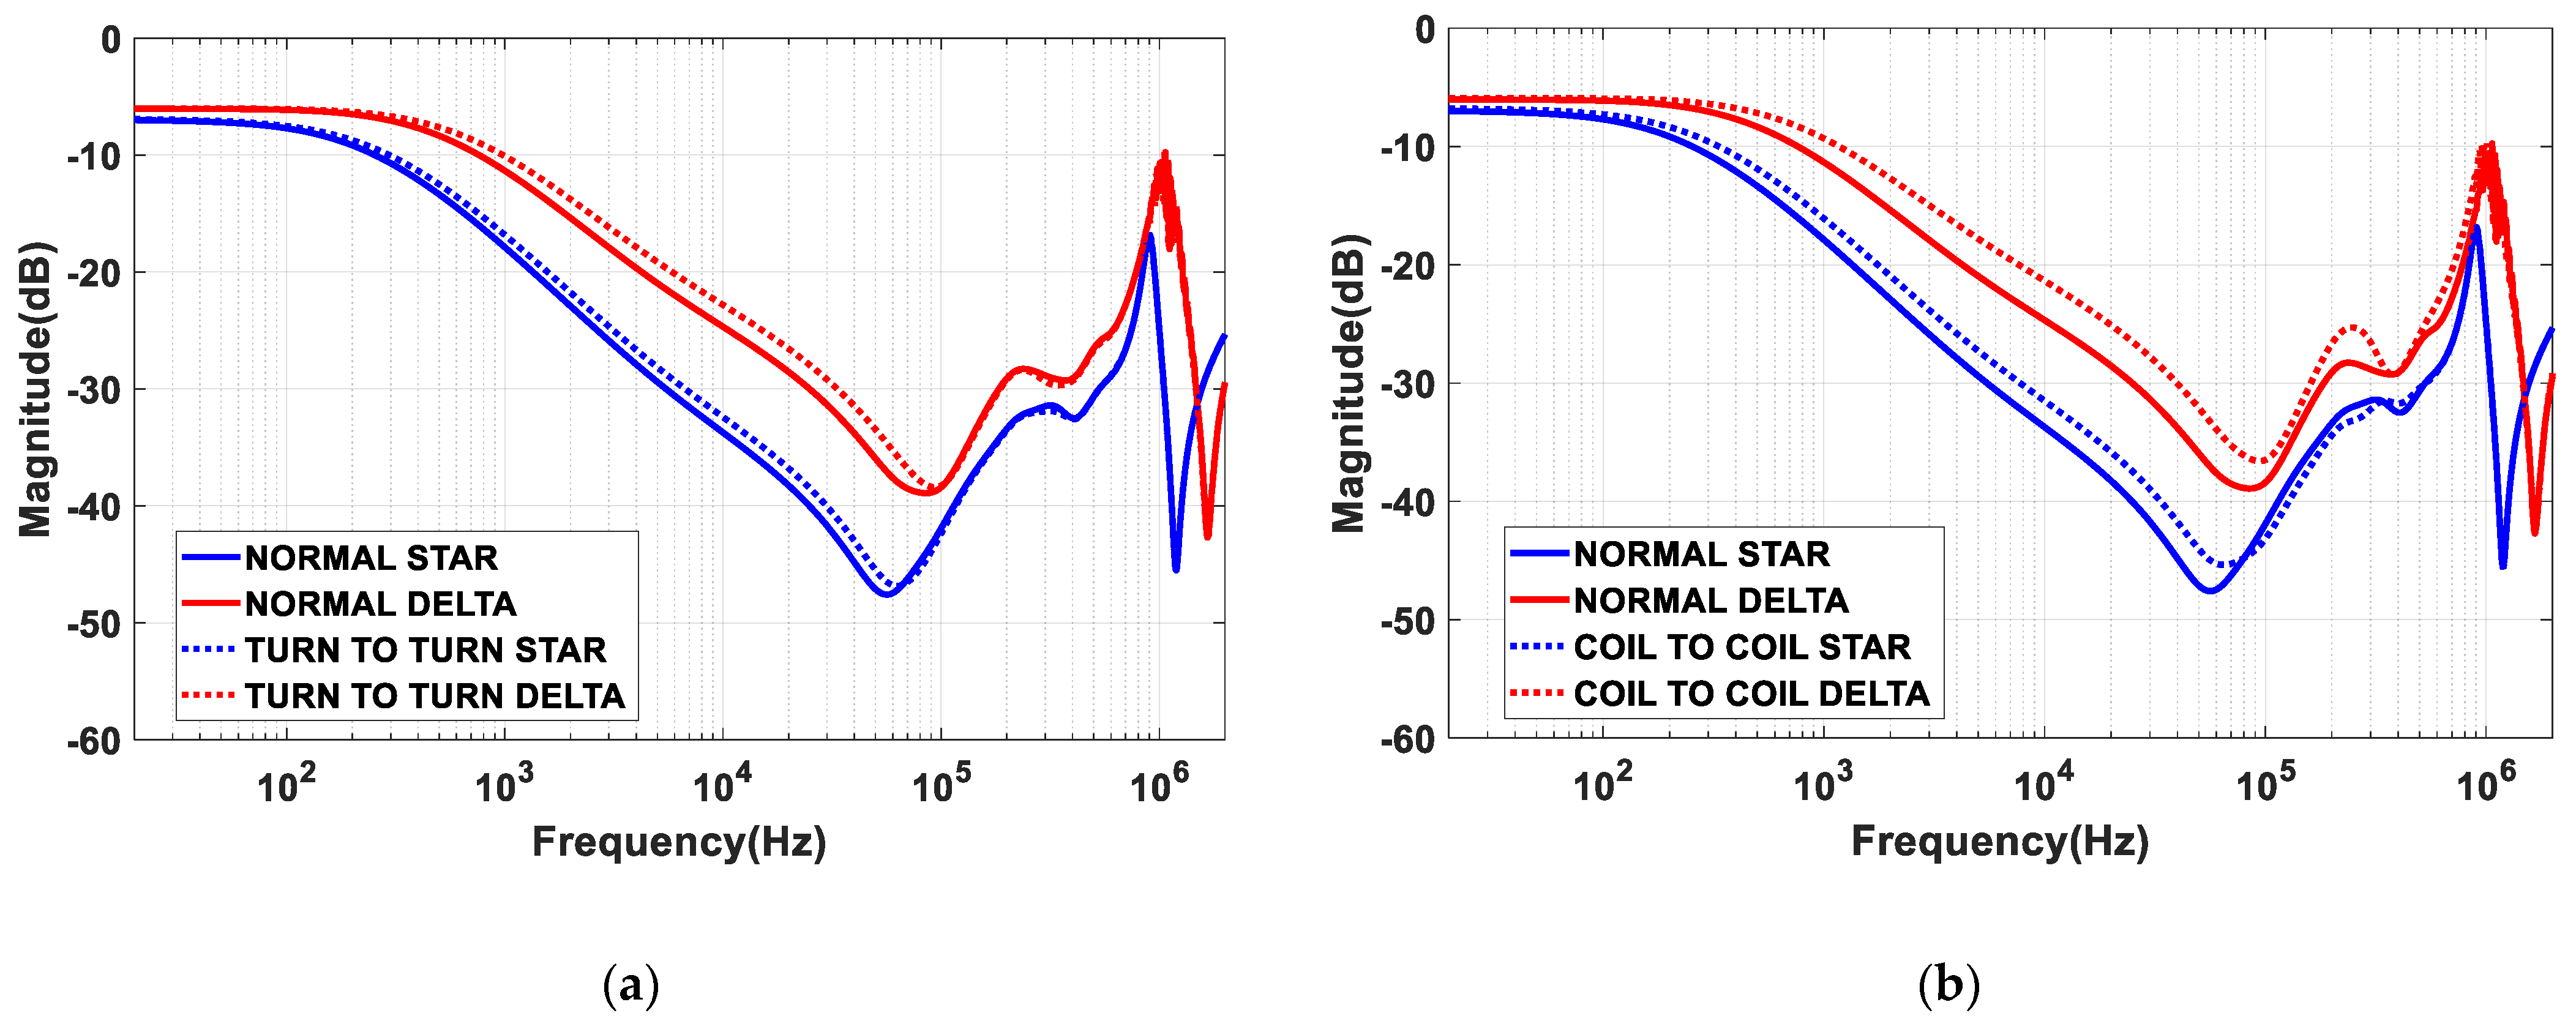
3.1. One HP Induction Motor
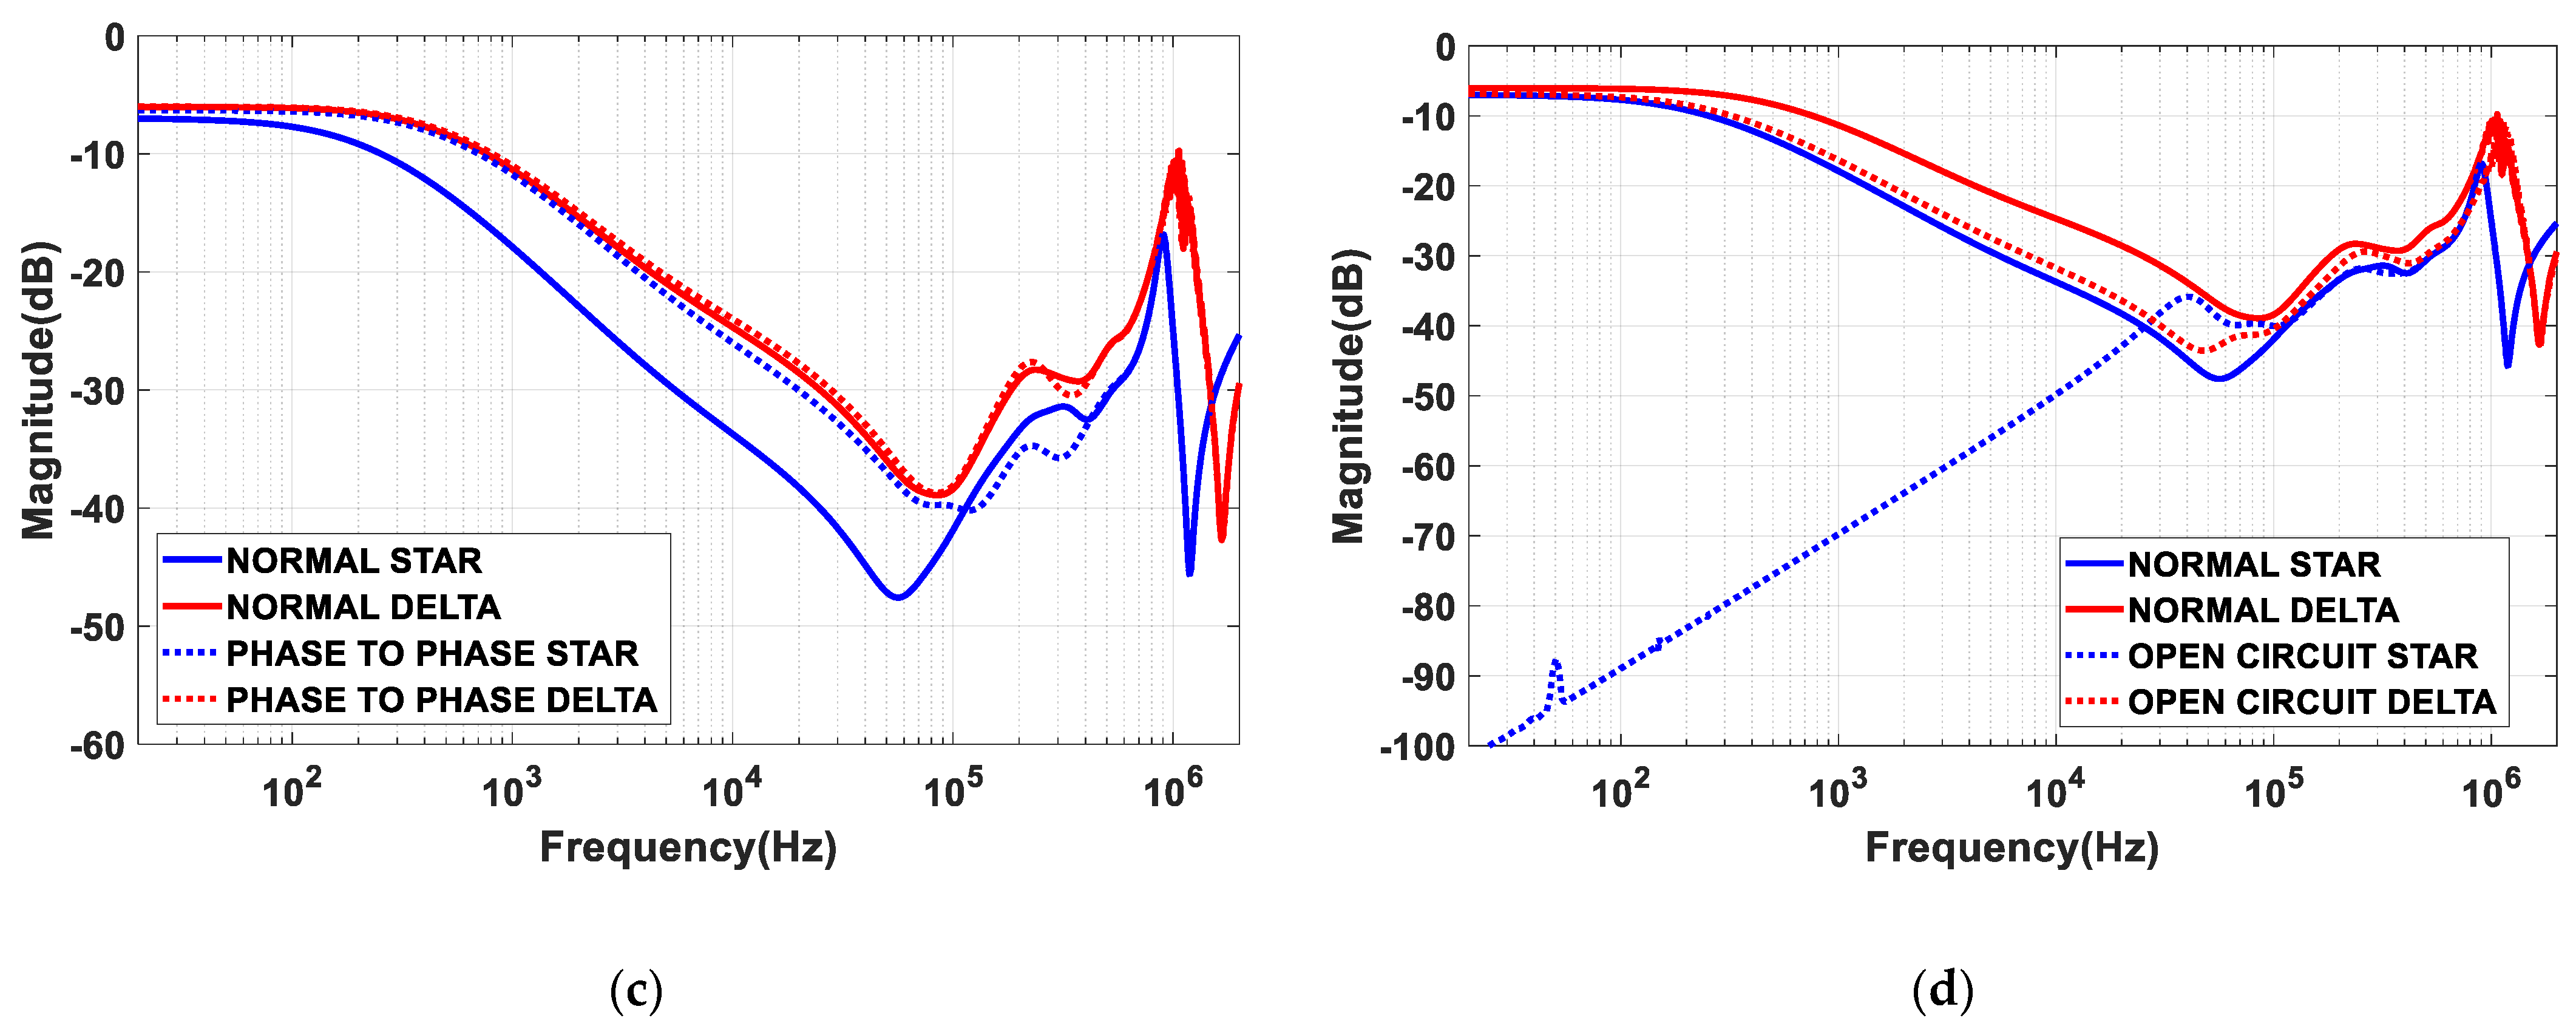
3.2. Three HP Induction Motor
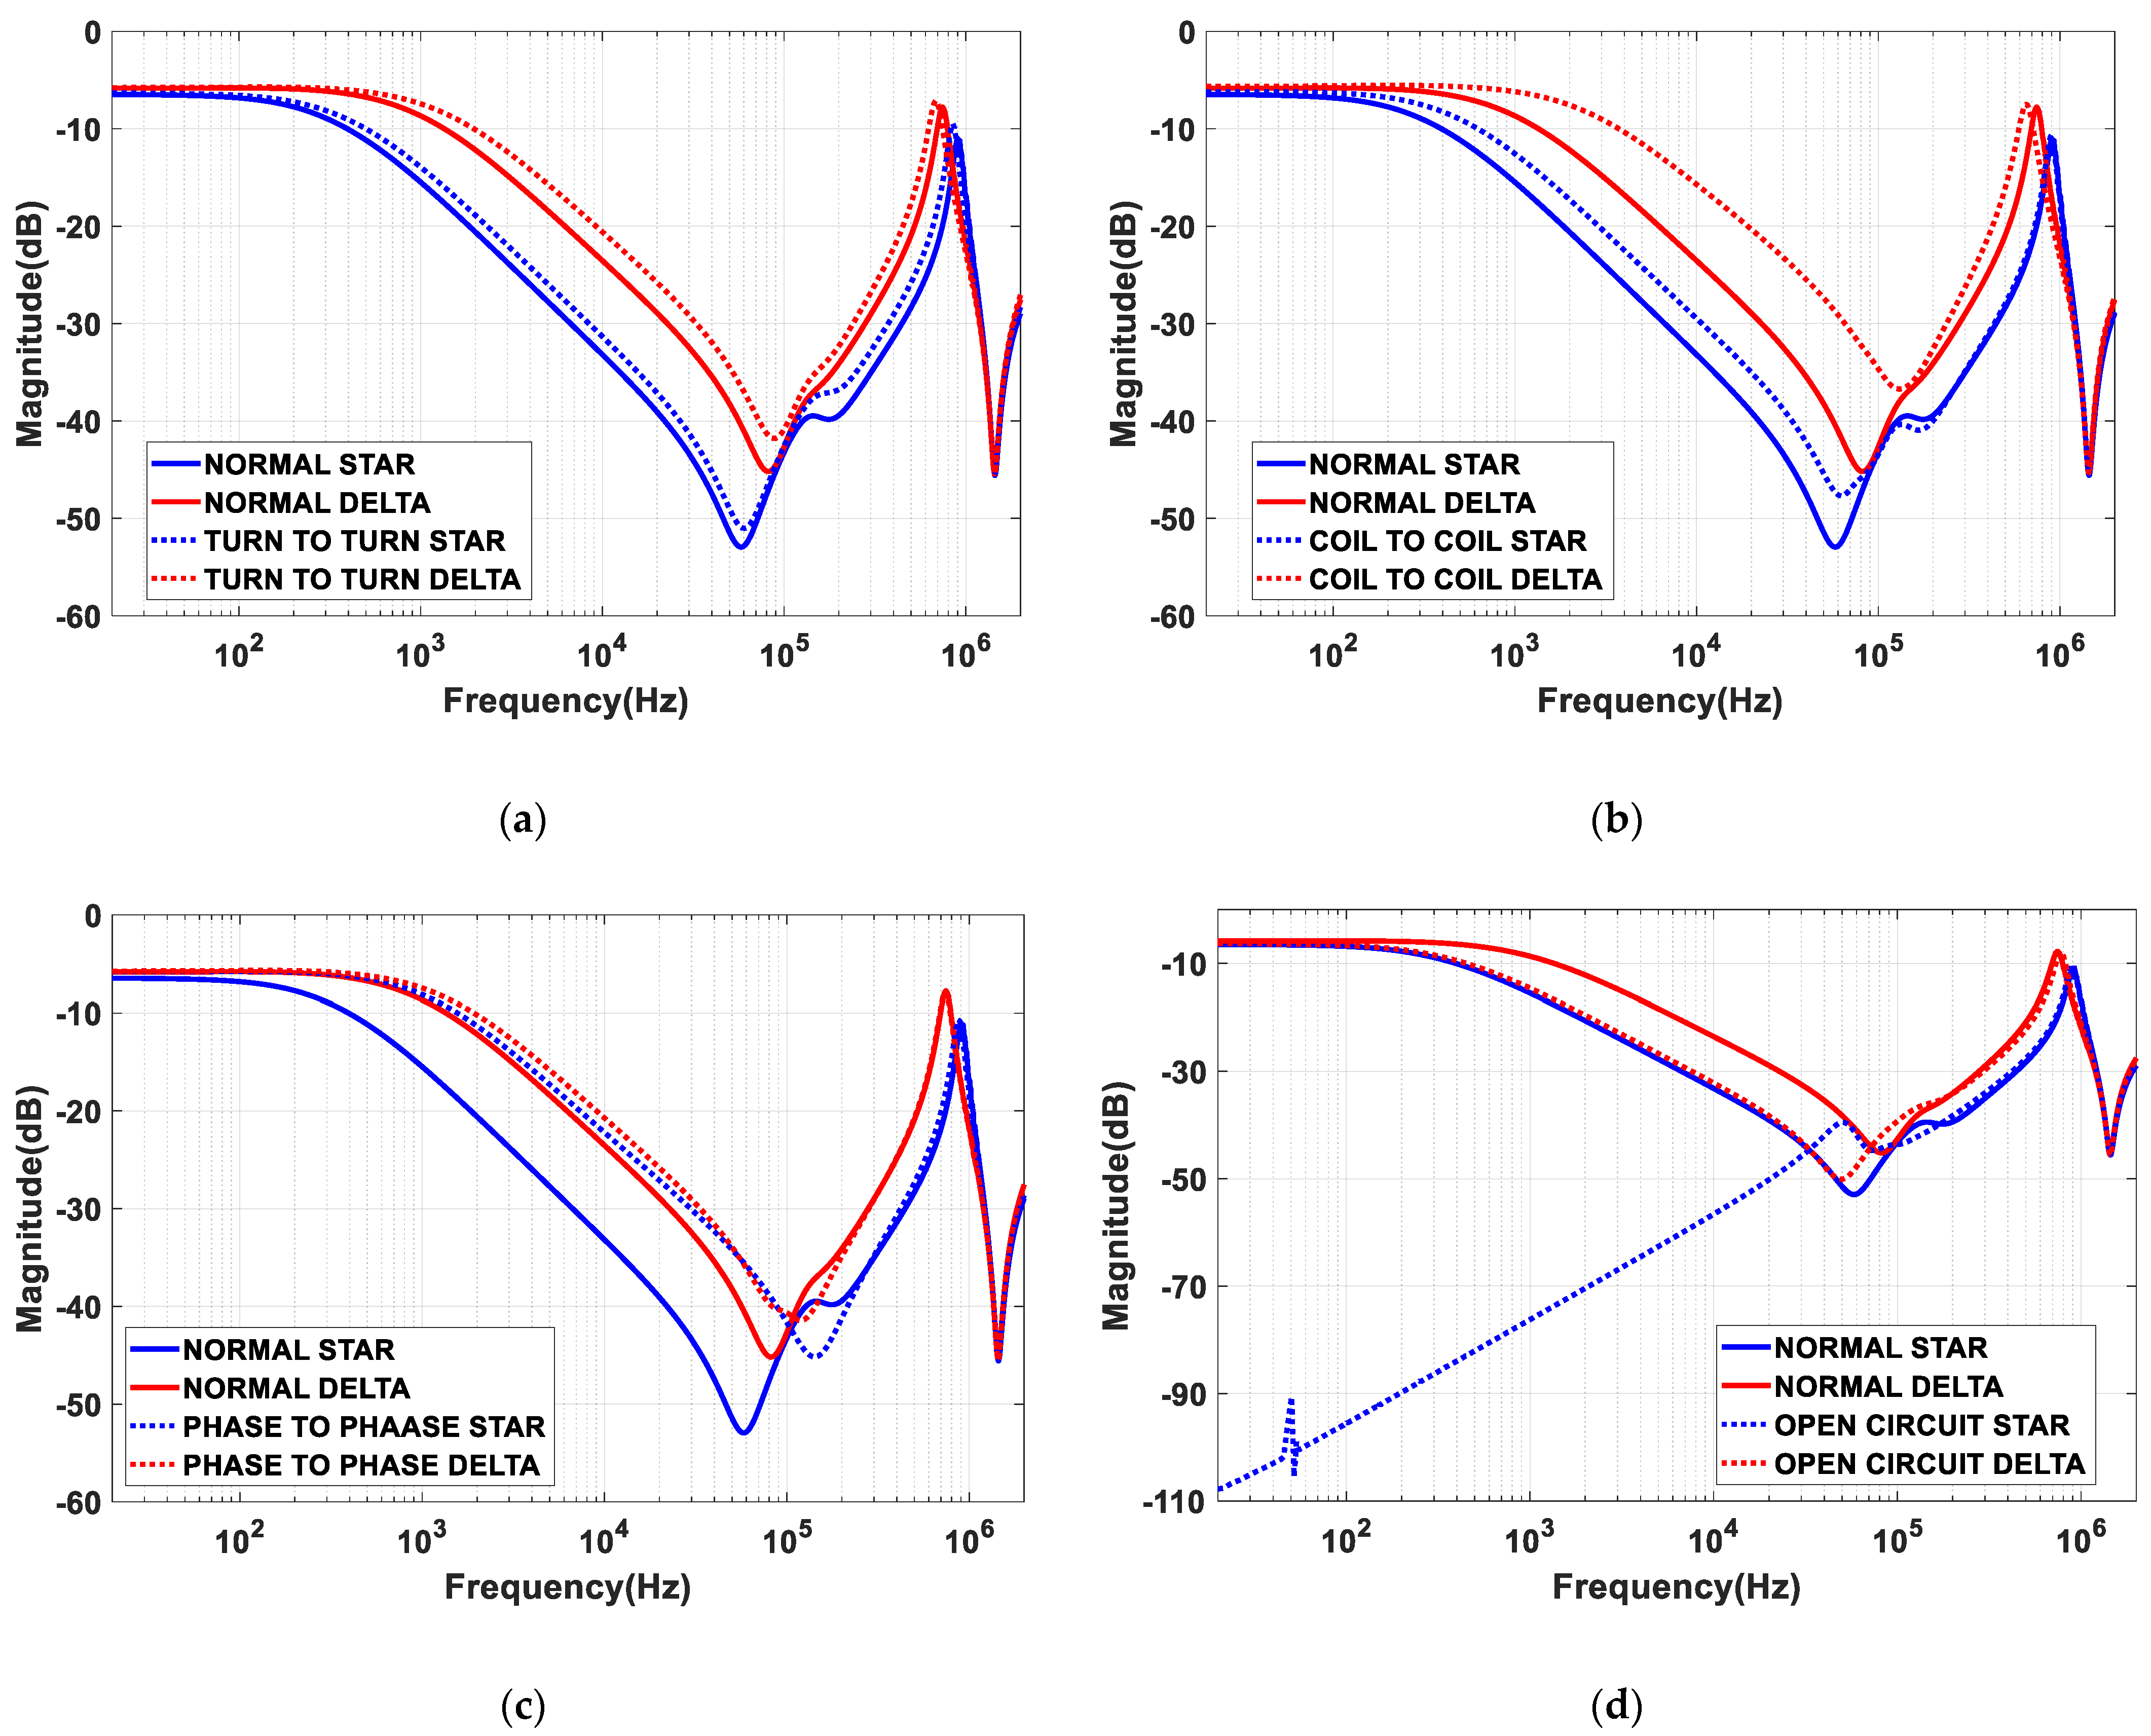
3.3. Five Point Five HP Induction Motor
4. Results Analysis
5. Comparison of Star and Delta FRA Patterns
6. Conclusions
Author Contributions
Funding
Data Availability Statement
Acknowledgments
Conflicts of Interest
References
- Motor Reliability Working Group. Report of Large Motor Reliability Survey of Industrial and Commercial Installations, Part I. IEEE Trans. Ind. Appl. 1985, IA-21, 853–864. [Google Scholar] [CrossRef]
- Cornell, P.F.E.P.; Owen, E.L.; Appiarius, J.C.; McCoy, R.M.; Albrecht, D.W.H. Improved Motors for Utility Applications; Final Report; General Electric Company: Schenectady, NY, USA, 1982. [Google Scholar]
- Florkowski, M.; Florkowska, B.; Zydron, P. Partial discharges in insulating systems of low voltage electric motors fed by power electronics—Twisted-pair samples evaluation. Energies 2019, 12, 768. [Google Scholar] [CrossRef] [Green Version]
- Sakhalkar, N.P.; Korde, P. Fault detection in induction motors based on motor current signature analysis and accelerometer. In Proceedings of the 2017 International Conference on Energy, Communication, Data Analytics and Soft Computing (ICECDS), Chennai, India, 1–2 August 2017; pp. 363–367. [Google Scholar] [CrossRef]
- Sonje, D.M.; Kundu, P.; Chowdhury, A. A Novel Approach for Sensitive Inter-turn Fault Detection in Induction Motor under Various Operating Conditions. Arab. J. Sci. Eng. 2019, 44, 6887–6900. [Google Scholar] [CrossRef]
- Chen, P.; Xie, Y.; Hu, S. Electromagnetic Performance and Diagnosis of Induction Motors with Stator Interturn Fault. IEEE Trans. Ind. Appl. 2021, 57, 1354–1364. [Google Scholar] [CrossRef]
- Gyftakis, K.N.; Cardoso, A.J.M. Reliable Detection of Stator Interturn Faults of Very Low Severity Level in Induction Motors. IEEE Trans. Ind. Electron. 2021, 68, 3475–3484. [Google Scholar] [CrossRef]
- Kumar, A.; Bhalja, B.R.; Kumbhar, G.B. Novel Technique for Location Identification and Estimation of Extent of Turn-to-Turn Fault in Transformer Winding. IEEE Trans. Ind. Electron. 2022, 1–10. [Google Scholar] [CrossRef]
- Abu-Siada, A.; Hashemnia, N.; Islam, S.; Masoum, M. Understanding Power Transformer Frequency Response Analysis Signatures. IEEE Electr. Insul. Mag. 2013, 29, 48–56. [Google Scholar] [CrossRef] [Green Version]
- Picher, P. Mechanical Condition Assessment of Transformer Windings Using Frequency Response Analysis (Fra). Cigre Eval. 2008, A2.26, 30–34. [Google Scholar]
- IEC 60076-18 Ed.1; Power Transformers—Part 18, ‘Measurement of Frequency Response’. International Electrotechnical Commission: Geneva, Switzerland, 2012.
- IEEE Std C57.149-2012; IEEE Guide for the Application and Interpretation of Frequency Response Analysis for Oil-Immersed Transformers IEEE Power and Energy Society. IEEE: Piscataway, NJ, USA, 2013; pp. 1–72. [CrossRef]
- Cheng, B.; Wang, Z.; Crossley, P. Using Lumped Element Equivalent Network Model to Derive Analytical Equations for Interpretation of Transformer Frequency Responses. IEEE Access 2020, 8, 179486–179496. [Google Scholar] [CrossRef]
- Al-Ameri, S.M.; Kamarudin, M.S.; Yousof, M.F.M.; Salem, A.A.; Siada, A.A.; Mosaad, M.I. Interpretation of Frequency Response Analysis for Fault Detection in Power Transformers. Appl. Sci. 2021, 11, 2923. [Google Scholar] [CrossRef]
- Uhrig, S.; Ottl, F.; Hinterholzer, R.; Augeneder, N. Reliable Diagnostics on Rotating Machines using FRA. In Proceedings of the 2020 International Conference on Diagnostics in Electrical Engineering (Diagnostika), Pilsen, Czech Republic, 1–4 September 2020. [Google Scholar] [CrossRef]
- Yousof, M.F.M.; Alawady, A.A.; Al-Ameri, S.M.; Azis, N.; Illias, H.A. FRA Indicator Limit for Faulty Winding Assessment in Rotating Machine. In Proceedings of the 2021 IEEE International Conference on the Properties and Applications of Dielectric Materials (ICPADM), Johor Bahru, Malaysia, 12–14 July 2021; Volume 2021-July, pp. 346–349. [Google Scholar] [CrossRef]
- Vilhekar, T.G.; Ballal, M.S.; Umre, B.S. Application of Sweep Frequency Response Analysis for the detection of winding faults in induction motor. In Proceedings of the IECON 2016—42nd Annual Conference of the IEEE Industrial Electronics Society, Florence, Italy, 23–26 October 2016; pp. 1458–1463. [Google Scholar] [CrossRef]
- Alawady, A.A.; Yousof, M.F.M.; Azis, N.; Talib, M.A. Frequency response analysis technique for induction motor short circuit faults detection. Int. J. Power Electron. Drive Syst. 2020, 11, 1653–1659. [Google Scholar] [CrossRef]
- Alawady, A.A.; Yousof, M.F.M.; Azis, N.; Talib, M.A. Phase to phase fault detection of 3-phase induction motor using FRA technique. Int. J. Power Electron. Drive Syst. 2020, 11, 1241–1248. [Google Scholar] [CrossRef]
- Brandt, M.; Kascak, S. Failure identification of induction motor using SFRA method. In Proceedings of the ELEKTRO 2016—11th International Conference, Strbske Pleso, Slovakia, 16–18 May 2016; pp. 269–272. [Google Scholar] [CrossRef]
- Brandt, M.; Gutten, M.; Kaščák, S. Diagnostic of induction motor using SFRA method. In Proceedings of the 2016 Conference on Diagnostics in Electrical Engineering (Diagnostika), Pilsen, Czech Republic, 6–8 September 2016. [Google Scholar] [CrossRef]
- Yu, Y.; Zhao, Z.; Chen, Y.; Wu, H.; Tang, C.; Gu, W. Evaluation of the Applicability of IFRA for Short Circuit Fault Detection of Stator Windings in Synchronous Machines. IEEE Trans. Instrum. Meas. 2022, 71, 1–12. [Google Scholar] [CrossRef]
- Samimi, M.H.; Tenbohlen, S.; Akmal, A.A.S.; Mohseni, H. Evaluation of numerical indices for the assessment of transformer frequency response. IET Gener. Transm. Distrib. 2017, 11, 218–227. [Google Scholar] [CrossRef]
- Al-Ameri, S.M.A.N.; Kamarudin, M.S.; Yousof, M.F.M.; Salem, A.A.; Banakhr, F.A.; Mosaad, M.I.; Abu-Siada, A. Understanding the Influence of Power Transformer Faults on the Frequency Response Signature Using Simulation Analysis and Statistical Indicators. IEEE Access 2021, 9, 70935–70947. [Google Scholar] [CrossRef]
- Sant’Ana, W.C.; Salomon, C.P.; Lambert-Torres, G.; da Silva, L.E.B.; Bonaldi, E.L.; de Oliveira, L.E.D.L.; da Silva, J.G.B. A survey on statistical indexes applied on frequency response analysis of electric machinery and a trend based approach for more reliable results. Electr. Power Syst. Res. 2016, 137, 26–33. [Google Scholar] [CrossRef]
- Ukil, A.; Chen, S.; Andenna, A. Detection of stator short circuit faults in three-phase induction motors using motor current zero crossing instants. Electr. Power Syst. Res. 2011, 81, 1036–1044. [Google Scholar] [CrossRef]
- Yousof, M.F.M.; Al-Ameri, S.; Ahmad, H.; Illias, H.A.; Arshad, S.N.M. A new approach for estimating insulation condition of field transformers using FRA. Adv. Electr. Comput. Eng. 2020, 20, 35–42. [Google Scholar] [CrossRef]
- Sultanbek, A. Exploring Statistical Index Criteria for Transformer Frequency Response Interpretation. Master’s Thesis, Nazarbayev University, Astana, Kazakhstan, 2018. [Google Scholar]
- Kim, J.-W.; Park, B.; Jeong, S.C.; Kim, S.W.; Park, P. Fault Diagnosis of a Power Transformer Using an Improved Frequency-Response Analysis. IEEE Trans. Power Deliv. 2005, 20, 169–178. [Google Scholar] [CrossRef]
- Bramerdorfer, G.; Tapia, J.A.; Pyrhönen, J.J.; Cavagnino, A. Modern Electrical Machine Design Optimization: Techniques, Trends, and Best Practices. IEEE Trans. Ind. Electron. 2018, 65, 7672–7684. [Google Scholar] [CrossRef]
- Orosz, T.; Rassõlkin, A.; Kallaste, A.; Arsénio, P.; Pánek, D.; Kaska, J.; Karban, P. Robust Design Optimization and Emerging Technologies for Electrical Machines: Challenges and Open Problems. Appl. Sci. 2020, 10, 6653. [Google Scholar] [CrossRef]
- Mugarra, A.; Mayora, H.; Guerrero, J.M.; Platero, C.A. Frequency Response Analysis (FRA) Fault Diagram Assessment Method. IEEE Trans. Ind. Appl. 2022, 58, 336–344. [Google Scholar] [CrossRef]
- Badgujar, K.P.; Maoyafikuddin, M.; Kulkarni, S.V. Alternative statistical techniques for aiding SFRA diagnostics in transformers. IET Gener. Transm. Distrib. 2012, 6, 189–198. [Google Scholar] [CrossRef]
- Secue, J.R.; Mombello, E. Sweep frequency response analysis (SFRA) for the assessment of winding displacements and deformation in power transformers. Electr. Power Syst. Res. 2008, 78, 1119–1128. [Google Scholar] [CrossRef]
- Behjat, V.; Mahvi, M. Statistical approach for interpretation of power transformers frequency response analysis results. IET Sci. Meas. Technol. 2015, 9, 367–375. [Google Scholar] [CrossRef]


| Motor | Motor 1 | Motor 2 | Motor 3 |
|---|---|---|---|
| Rotor speed | 1500 rpm | 2840 rpm | 2880 rpm |
| Made | JILANG | JILANG | JILANG |
| Model | 110RK-3DS | Y90L-2 | Y112M-2 |
| No. Phases | 3-Ph | 3-Ph | 3-Ph |
| Rated power | 0.75 kW/1HP | 2.2 kW/3 HP | 4 kW/5.5 HP |
| Rated Voltage | 415 V/50 Hz | 415 V/50 Hz | 415 V/50 Hz |
| Current | 7.5 A | 8.83 A | 8.17 A |
| Efficiency | 73% | 80.5% | 85.5% |
| Power factor | 0.76 | 0.86 | 0.87 |
| Motor Model | Normal | Turn-to-Turn SC Fault | Coil-to-Coil SC Fault | Phase-to-Phase SC Fault | Open-Circuit Fault |
|---|---|---|---|---|---|
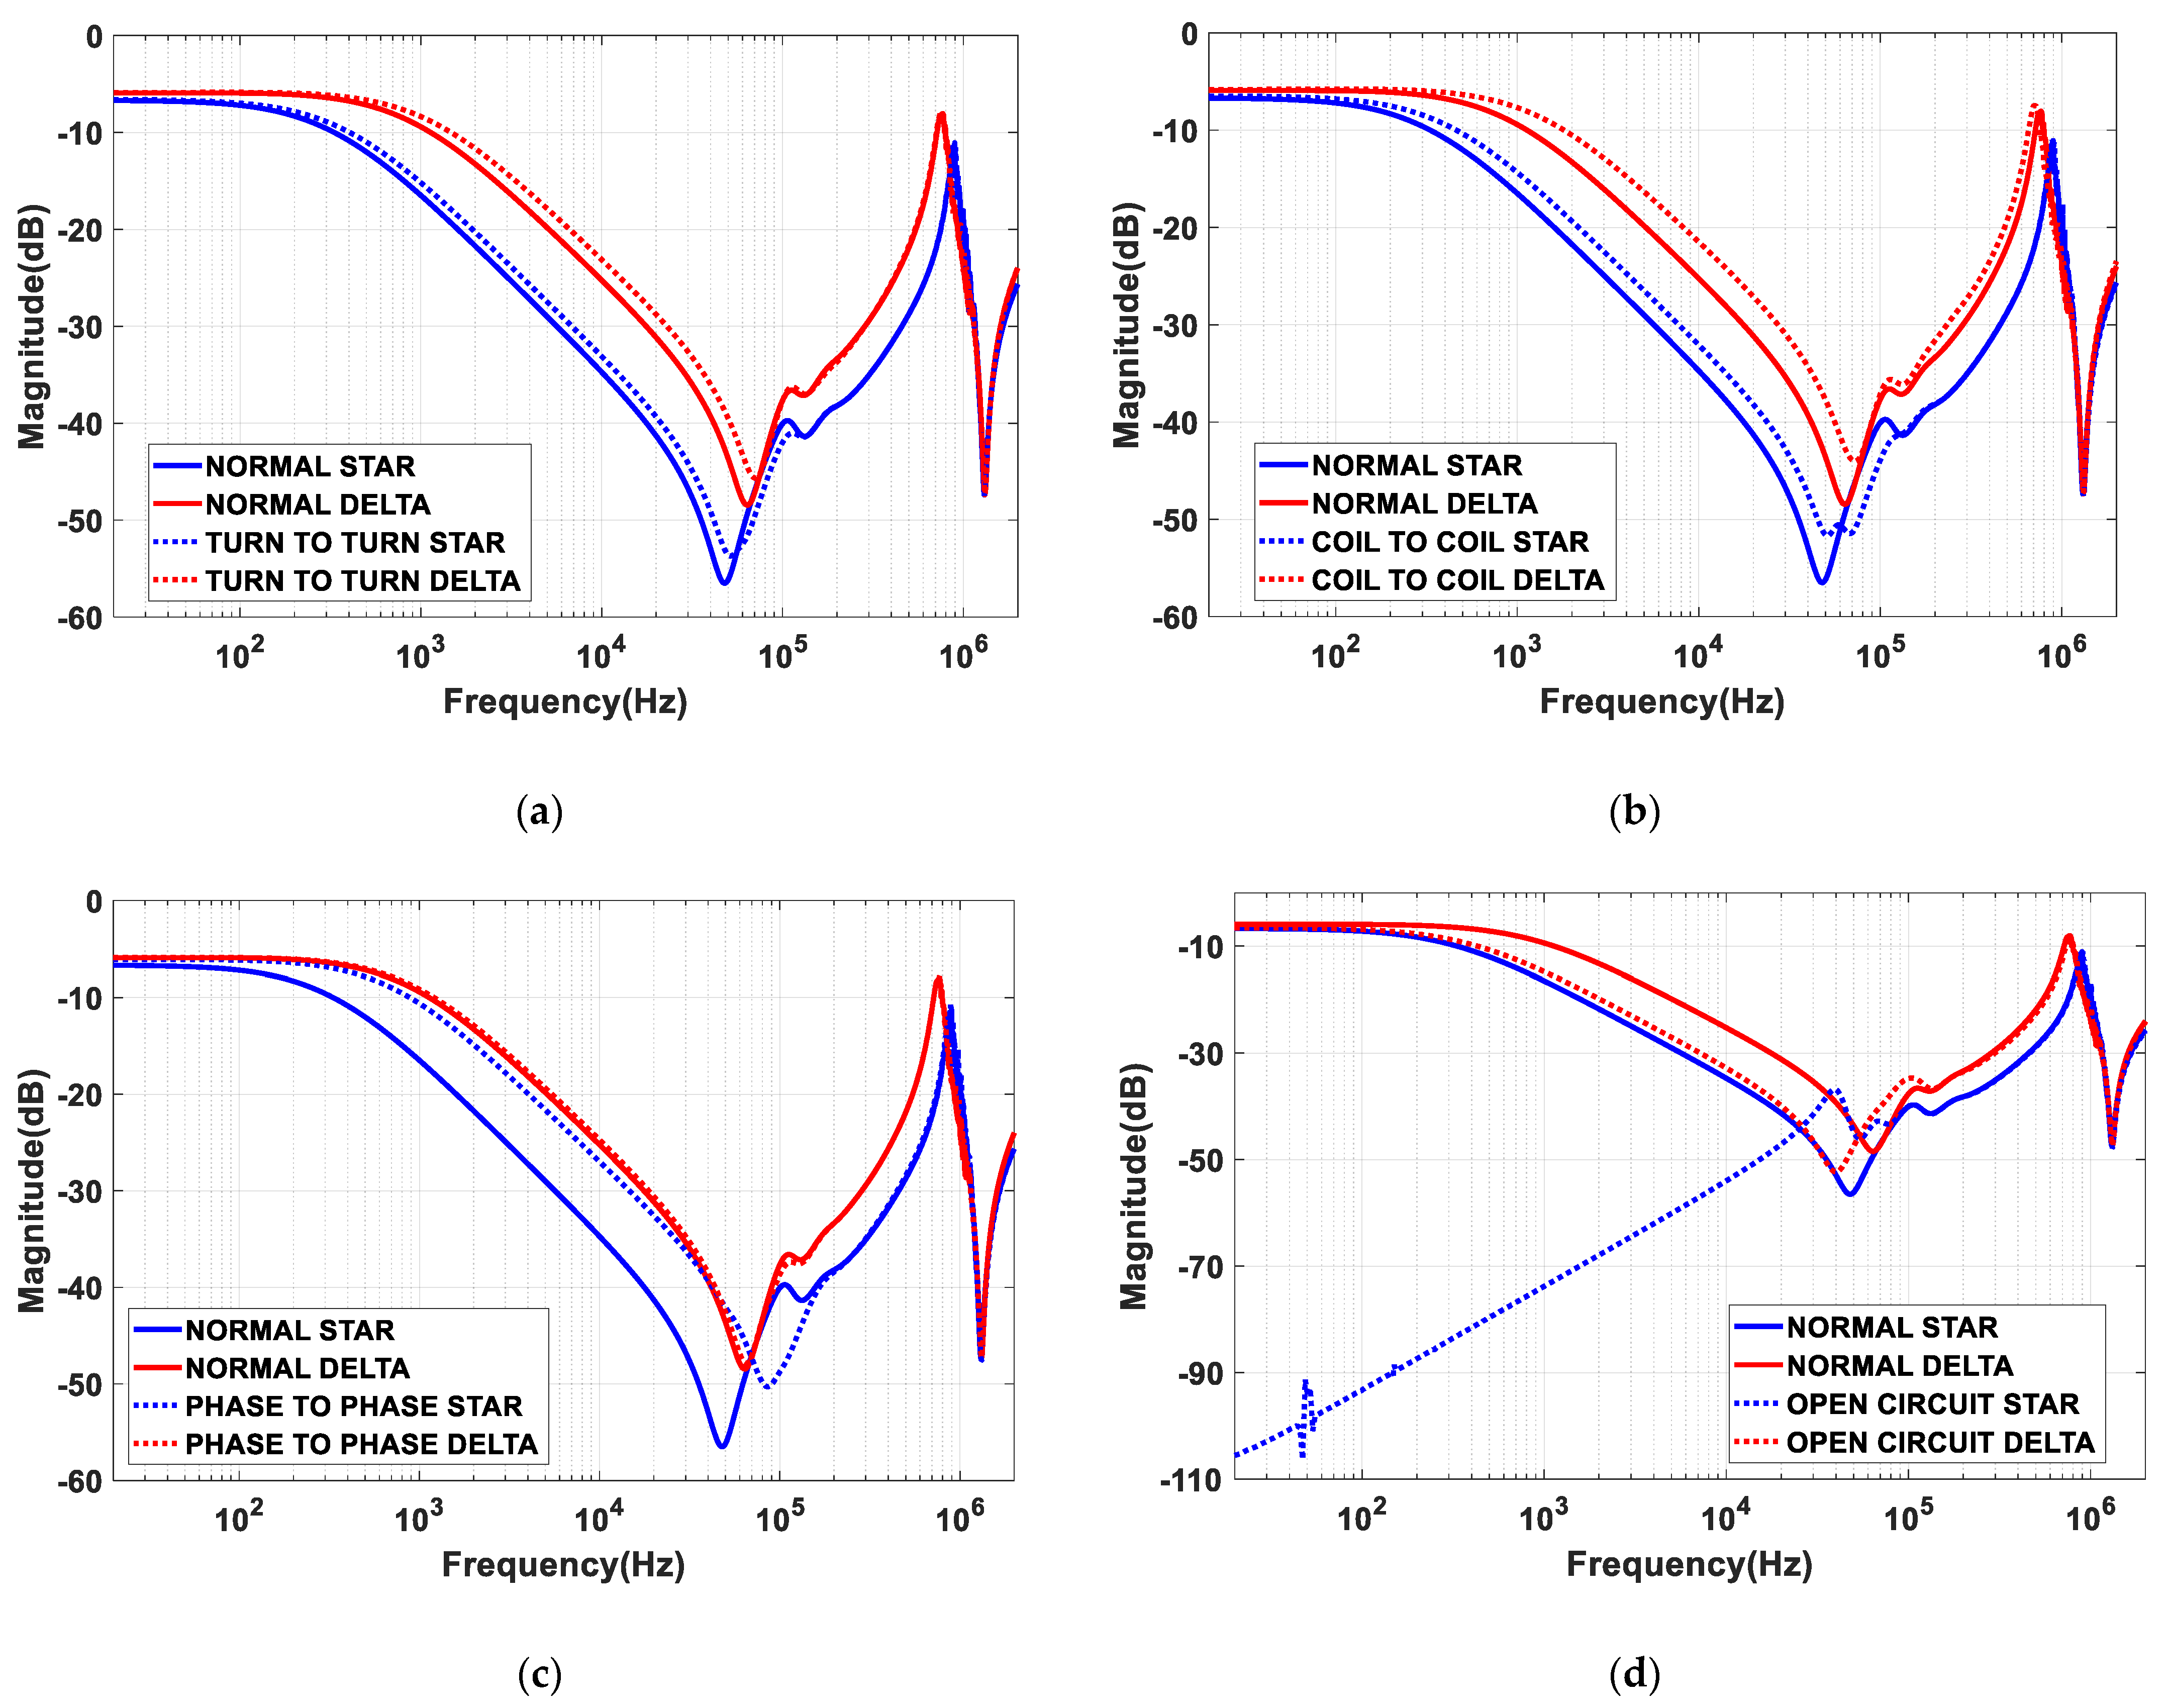
| 1 HP | Under normal conditions, the response magnitude (dB) reduces for the Y winding connection compared to that for the ∆ winding connection. This is observed in all of the measured motors. | The fault causes a reduction of the response magnitude at the MF region. This effect is similar in both the Y winding connection and ∆ winding connection. | The fault causes a reduction of magnitude in the LF and MF regions. This effect is similar in both the Y winding connection and ∆ winding connection. However, it is not similar in the HF region. The Y winding connection shows the magnitude reduction from 100 kHz to 500 kHz. | The fault shows a small reduction of the magnitude in the MF and HF regions for ∆ winding connection. However, for the Y winding connection, there is a huge reduction of the response magnitude in the LF, MF and HF regions. | The fault shows a small reduction of the response magnitude at LF and MF regions for ∆ winding connection. The fault shows a huge reduction of the response magnitude at the LF region for Y winding reduction. |
| 3 HP | The fault causes a reduction of the response magnitude in the MF and HF regions. This effect is similar in both the Y winding connection and ∆ winding connection. | The fault has a similar effect in LF and MF regions. There is a reduction of the response magnitude. There is a reduction of magnitude in the ∆ winding connection in the HF region, but the fault did not show any effect at the HF region for the Y winding connection. | The fault shows a small reduction of the response magnitude at the MF region for ∆ winding connection. On the other hand, the fault shows a huge reduction of the response magnitude in the LF, MF and HF regions for the Y winding connection. | ||
| 5.5 HP | The fault causes a reduction of the response magnitude at the MF region. This effect is similar in both the Y winding connection and ∆ winding connection. | Similar effect to that in the 3 HP IM. | Similar effect to that in the 3 HP IM. |
Disclaimer/Publisher’s Note: The statements, opinions and data contained in all publications are solely those of the individual author(s) and contributor(s) and not of MDPI and/or the editor(s). MDPI and/or the editor(s) disclaim responsibility for any injury to people or property resulting from any ideas, methods, instructions or products referred to in the content. |
© 2023 by the authors. Licensee MDPI, Basel, Switzerland. This article is an open access article distributed under the terms and conditions of the Creative Commons Attribution (CC BY) license (https://creativecommons.org/licenses/by/4.0/).
Share and Cite
Al-Ameri, S.M.; Abdul-Malek, Z.; Salem, A.A.; Noorden, Z.A.; Alawady, A.A.; Yousof, M.F.M.; Mosaad, M.I.; Abu-Siada, A.; Thabit, H.A. Frequency Response Analysis for Three-Phase Star and Delta Induction Motors: Pattern Recognition and Fault Analysis Using Statistical Indicators. Machines 2023, 11, 106. https://doi.org/10.3390/machines11010106
Al-Ameri SM, Abdul-Malek Z, Salem AA, Noorden ZA, Alawady AA, Yousof MFM, Mosaad MI, Abu-Siada A, Thabit HA. Frequency Response Analysis for Three-Phase Star and Delta Induction Motors: Pattern Recognition and Fault Analysis Using Statistical Indicators. Machines. 2023; 11(1):106. https://doi.org/10.3390/machines11010106
Chicago/Turabian StyleAl-Ameri, Salem Mgammal, Zulkurnain Abdul-Malek, Ali Ahmed Salem, Zulkarnain Ahmad Noorden, Ahmed Allawy Alawady, Mohd Fairouz Mohd Yousof, Mohamed Ibrahim Mosaad, Ahmed Abu-Siada, and Hammam Abdurabu Thabit. 2023. "Frequency Response Analysis for Three-Phase Star and Delta Induction Motors: Pattern Recognition and Fault Analysis Using Statistical Indicators" Machines 11, no. 1: 106. https://doi.org/10.3390/machines11010106