1. Introduction
The European shipbuilding industry is increasingly facing Asian competition in the construction of cruise ships, passenger ships, ferries, and even vessels of special purpose, and for decades it has almost entirely lost its market position in niches of cargo ship containers, bulk cargo, and oil. According to [
1], at the beginning of the 21st century, Asian countries dominate in large shipbuilding, with a greater world share in shipbuilding than European countries had 100 years ago, whose strong decline in large shipbuilding volume started in 1955. The first reason for that was the great rise of Japan in delivered gross registered tonnage, and then the remaining Asian countries—South Korea, then China.
The strengthening of Asian industrial conglomerates was mostly supported by indirect or even, in the case of China and South Korea, direct government subsidies. The Asian conglomerates also benefited from lower labour costs compared to Europe. European shipyards, with strong trade union activity and set fees in accordance with the extremely cyclical changes in freight rates on the shipping market [
2], could not compete on price [
1], thus leaving Asian countries with complete primacy in cargo shipbuilding. As quoted in [
2], in 2019, the main Asian countries accounted for as much as 95.5% of the deadweight tonnage in the global newbuilding orderbook, of which the share of China was 45.4%, South Korea 28.1%, and Japan 22%, while Europe accounted for only 1.9% of the world’s total ordered deadweight tonnage. Due to the lack of competitiveness in cargo shipbuilding in the last two decades, the European shipbuilding sector has been oriented primarily in building technologically sophisticated ships—cruise ships, vessels for oil and gas industry, suppliers for offshore wind farms, and others.
However, due to a decline in their share of the global shipbuilding orderbook in favour of China, Japan [
2,
3] and South Korea [
4] enlarged their portfolio of newbuilds to capture a market niche of big cruise ships at the beginning of the 21st century. The aforementioned strategies were additionally strengthened by the consequences of the financial crisis from 2008 to 2012, which saw a decline in cargo vessel [
3]. The ultimate and greatest challenge to European shipbuilding is the increasingly strong inclusion of China in the aforementioned market niche in the last decade, driven by the government-led policy of low selling prices [
3], with the aim of adopting the necessary technologies as quickly as possible.
Therefore, European shipbuilding faces a great challenge to continuously improve business processes to at least maintain but also increase its competitiveness while meeting high environmental protection and energy efficiency criteria. The current market demands for highly complex and technologically advanced vessels affects all stages of shipbuilding—design, construction, operation, and maintenance—creates new challenges for the R&D sector, and enhances the growth and development of various support industries, such as IT, design, specialised outfit production, and similar. The importance of such a chain of added value, originated and led by the shipbuilding industry and having a major economic impact on the overall economy, has to be acknowledged by European countries so that shipbuilding will be considered as long-term economic strategies are instituted. Development and research activities must be the backbone of modern European shipbuilding so that the industry can be a leader of current trends in energy-efficient design and environmentally friendly vessels, so-called “smart ships”.
Improving business processes to maintain or increase competitiveness is possibly approached from at least three intertwined aspects:
Using funds from the European Union to encourage development activities, research, and innovation, as well as investment in digital technologies, infrastructure, and production resources;
Implementing Industry 4.0 trends and technologies;
Organizational changes in terms of transforming the shipyard into a “smart” (digital transformation) and “green factory”, respectively.
Through “A New Industrial Strategy for Europe” adopted in 2020 [
5], which is based on the “European Green Deal” strategy adopted a year earlier [
6] on reaching the climate neutrality of Europe by 2050, the European Commission emphasises the primary significance of digital, i.e., the green transformation of European industry (dual transition), as a contributor to the process of achieving a climate-neutral European economy, defining the grant schemes to SMEs focused on development and research projects. Most of the leading countries in the maritime sector, not only in Europe but also globally, have recognised the importance of applying digital technologies to achieve an increase in the competitiveness of their industries in the sphere of sustainable growth and development [
7,
8]. They have also implemented new operational processes in shipbuilding [
9] (e.g., Germany issued “Industrie 4.0”, Spain adopted an agenda for Industrial Competitiveness, South Korea issued “Manufacturing Innovation 3.0 Strategy”, China issued strategic declaration “Made in China 2025”, etc.). Nevertheless, research work on applying digital technologies, i.e., the results achieved by implementing Industry 4.0 doctrines and trends in the shipbuilding sector, are still in the early stages.
The analysed research evaluates the importance of certain technological achievements of Industry 4.0 to the transformation of traditional business systems into smart ones differently. Therefore, some of the research [
10] recognises Cloud, Big Data Analytics, Internet of Things, and Artificial Intelligence as technologies of primary importance in improving shipbuilding processes followed by other digital trends and technologies such as Digitisation (of all workshops’ machinery), Additive Manufacturing (3D printing), Cybersecurity, Autonomous Guided Vehicles, Virtual and Augmented Reality, Collaborative Robotics, Blockchain, and Internet of Services. Other research [
11,
12,
13] emphasises the importance of the Cyber–Physical System (CPS) platform in creating Shipyard 4.0, whereas Digital Twin has been defined as the leading technology for realising the CPS platform [
14]. Moreover, a case study of Shipyard 4.0 [
11] assumes all other digital technologies as secondary and is built upon Digital Twin technology.
Digital Twin represents a virtual replica of a physical entity (product, machine, process, and the like) and is related to it by selected smart sensors and reference software applications that monitor the parameters in real-time by analysing the collected data [
14,
15]. As such, Digital Twin can be utilised as the basis for a smart manufacturing system (SMS) configuration, recognising and preventing misconceptions in the early stage of the SMS design process [
16]. Digital Twin technology, on the other hand, implies the comingling of three entities—the physical object, its virtual replica, and their mutual digital link/IT component [
17,
18]. Considering the specifics of the European shipyard studied in this paper related to constructing prototype vessels according to the client’s preferences, the shipyard has recognised Digital Twin as the core technology for the transformation into Shipyard 4.0. In relation to the already performed research [
19] regarding the importance of applying Digital Twin to sales and marketing activities, the studied shipyard recognises the advantages of applying 3D modelling with software tools in the earliest, pre-contractual, and sales phases. The ship’s development in its virtual equivalent enables the client and the shipyard to improve the ship’s parameters (e.g., the shape and the stability of the ship) which results in lower costs, i.e., better project profitability for the client. Furthermore, design activities in the digital twin ship enable the client, shipyard, and key suppliers to define the optimal technical and technological solutions with the aim of simplifying and thereby reducing the cost, resulting in an additional increase in added value for the client.
The complexity of financing the shipbuilding process [
20,
21] includes a large number of stakeholders [
22], and after the financing is approved, an entire supply chain is involved in the transaction processes. With the aim of maintaining but also improving competitiveness, the studied European shipyard gives priority, along with Digital Twin technology, to the implementation of the digital achievements of Industry 4.0, to blockchain technology, and its software application of smart contracts [
23,
24,
25,
26]. It also takes into account the high potential of its applicability in the shipbuilding industry [
27,
28,
29]. Blockchain technology represents the distributed database [
28] which enables the execution of direct transactions between networked users without the need for verification. Once adopted by consensus of the users, transactions remain unchangeable, which ensures transparency and trust. Adopting blockchain technology by eliminating the need for third-party mediation not only allows for a significant reduction in the duration of transaction approval procedures, but also eliminates the high financing costs, thus increasing the competitiveness of the shipyard.
By implementing the applicable trends and technologies of Industry 4.0, the main directions of the integration of shipyard business processes are realised [
10], namely:
Vertical, by integrating the business processes from workshops, through departments and up to management, by transmitting data between virtual reality and sensors, i.e., actuators installed on work equipment (automatic machines, production lines, etc.) in real-time (CPS environment), thus achieving significant savings in processes;
Horizontal, by integrating all the supply chain stakeholders in order to create possible new networks among the same, adjusted to the potential new projects;
End-to-End engineering, by connecting the supply chain stakeholders with the process functions (design, supply, production, maintenance) to monitor the product lifecycle by analysing data assigned to the product, i.e., real data from construction and use of the product to optimise the shipbuilding process and improve the efficiency of product maintenance.
However, a prerequisite for access to a digital shipyard transformation is the Lean transformation of business processes, necessary from the aspect of achieving business competitiveness by eliminating or reducing unnecessary costs, while increasing company profits, productivity, and employee motivation, ultimately increasing customer satisfaction.
In the past decades, Lean management has been popular because of its potential to improve not just discrete manufacturing processes, where it had emerged, but also in industrial processes, as well as service processes, such as healthcare, banks, and universities. The major point of interest of Lean management in the shipbuilding industry, as the literature reveals, was the manufacturing process itself. Since premanufacturing processes play a huge role and have a huge influence on the actual manufacturing process, the motivation of this research was to study the possibility of improving the premanufacturing phase, which in turn would improve the manufacturing phase.
This paper demonstrates the importance of improving the sales process of the studied European shipyard by using Value Stream Mapping (VSM) as the chosen Lean management tool. After introducing and reviewing the literature in the first two sections, the third section highlights the features of the Lean management method and describes Value Stream Mapping as the selected Lean tool for improving the sales process. The fourth section describes the applied research methodology for this work. In the fifth section, the current phases and subphases of the sales process are determined, upon which in the sixth section a map of the current situation will be described and a map of the future state of the sales process is presented and its implementation is planned. The sales process improvement theoretical results are presented in the seventh section. In the eight section accomplishments of the experimental application of improvement measures are first presented and recommendations for further research are discussed. Finally, the ninth section gives a conclusion and argues the significance of the achieved sales process improvement results in the shipyard’s business.
2. Literature Review
The following paragraphs review the available literature and scientific research on Lean management and manufacturing, respectively, in shipbuilding.
Unlike scientific research on the development and application of Lean principles in other manufacturing industries, there are not so many publications in the field of Lean shipbuilding. The authors Sullivan et al., as well as Suresh et al., claim that the reason is the novelty and restrictions of such an approach in this type of industry [
30,
31]. However, in their study, Suresh and other authors give an overview of lean shipbuilding in countries such as Japan, the US, and Norway and show that it is possible to achieve significant improvements in productivity with some of the Lean tools such as multi-skill training and five ‘S’ Value Stream Mapping and standardized work [
31]. Sullivan et al. claim that in lean transformation in maritime design, it is necessary for three aspects to be considered: process, people, and technology, and their study is focused on the design process of vessels and improving that process with Lean principles [
30]. Applying lean manufacturing principles in US shipyards was described in the article [
32]. The authors claimed that there is the potential for significant productivity improvements in shipyards by implementing Lean principles. The development of the Lean shipbuilding MES system is described in an article by Song and Zhou [
33]. They studied the case of a shipbuilding company’s production process that had problems with a long manufacturing cycle, a low utilization rate of personnel, and an unbalanced production line which were addressed using the Lean shipbuilding MES system. Two studies dealing with the panel line assembly process in shipbuilding show significant improvements by introducing Lean principles in this part of the shipbuilding process. In the first of these two mentioned papers, only by analysing the time chart and current Value Stream Mapping are possibilities for improvements detected in the manner of the sequence modification of the manufacturing flow. The Value Stream Mapping of the manufacturing process was a key element in analysing and improving production efficiency [
34]. The second mentioned paper also applied Value Stream Mapping to analyse the production process. The results were significant regarding man-hour and lead time savings of about 60 and 80%, respectively [
35]. Another work by Kolich et al. describes applying Value Stream Mapping in shipyard panel assembly lines. They suggested that by implementing Kanban and pull principles, as well as group technology and production configurations, significant improvements in terms of man-hours and production time can be seen [
36]. The case study of applying Lean principles in the European shipbuilding industry by Value Stream Mapping is presented in the paper [
37]. The authors described the case study of applying VSM and simulation of pylon production in the shipbuilding process, which have resulted in a future state map of the process. They showed possibilities for reducing lead time and local inventory levels compared to the current state. Another interesting study was given by Niansheng et al. [
38]. The authors give a systematic approach for the Lean supply chain in the shipbuilding industry by analysing specific characteristics of the shipbuilding processes to improve productivity and lower costs. The approach is established with procedures on three basic levels, and these are: foundation, execution, and index level. The first level incorporates the foundation of the management principles, the second level includes the operation directions, and the index level represents the performance measurement. Another study of Value Stream Mapping application in the shipbuilding industry, specifically in micro panel assembly, was given by Kolich et al. [
39]. The authors describe the case study of flow improvement in this specific part of the production process.
The ship production process from the point of purchasing to the point of delivering the final product can be as long as two years. This is a very long and complex process that consists of many complex and interdependent steps, and focusing only on the production process itself in terms of applying Lean principles and improving the process can lead to improvements. However, the significant results in reducing the lead time and increasing productivity and production efficiency could only lead if the whole process, including the contracting phase, is taken into account for improvements. Implementing Lean principles in the sales process, specifically in the contracting phase, must be one of the key strategic decisions of the shipyard’s management, given the effect achieved by improving the process in terms of revenue growth or production capacity employment. The reviewed literature showed the gap in this field, and this study aimed to research the possibility of Lean implementation in this specific area of the shipbuilding process, thereby detecting the losses in the sales process and accordingly defining the improvement measures to enhance the shipbuilding sales performance and competitiveness of the shipyard, respectively. Thus, the research questions aimed to be addressed in this case study were:
Q1: What are the wastes in the sales process in shipbuilding according to the Lean principles?
Q2: Is the Value Stream Mapping tool applicable in the sales department processes in the shipbuilding industry?
3. Lean Methodology
Since it was used to describe the specificity of Toyota Motor Company’s production system [
40], comparing it with other automotive industries, particularly Western ones, Lean management has become one of the widely used methodologies to improve, at first, production processes, but later also service companies as well hospitals and universities. As the method emerged, it was recognized as an improvement philosophy that can be applied in many industries.
The main goal of Lean manufacturing is to continuously improve the processes by eliminating all waste from the process, which Taiichi Ohno has classified into six categories: overproduction, transport, waiting, inventory, over-processing, unnecessary movement, and rework [
41]. In the Lean approach, waste is everything that does not add value to the customer [
42]. In addition, one of the definitions of Lean manufacturing is that Lean manufacturing, when implemented, reduces the time between the customer order and delivery of the final product by eliminating non-value-added activities. The goal is to achieve a short and agile process that can easily respond to customer demands [
43].
In their book
Lean Thinking, Womack and Jones define five basic principles of Lean manufacturing: value, value chain, flow, pull, and perfection [
42]. The principle of value means that the process has to be organized from the perspective of the customer and the premise of what brings value to the customer. Value chain principles summarized the approach that the process is the sum of all activities necessary for bringing that value to the customer. The flow principles define the idea that the process has to flow smoothly, without interactions and interruptions, and the ideal state is to have a one-piece flow. The pull principle is the most important principle of Lean management and is very often associated with Kanban, a signal card system that is developed and used in Toyota for pulling products to the customer instead of pushing products to the customer. Basically, every activity in the process is an internal customer, and the previous activity does not produce until the upstream activity does not demand, and that way, the product is pulled towards the end customer. The principle of perfection represents the philosophy of continuous improvement, which never ends.
The principles of value, value-chain, and the flow, through one of the tools of Lean management, which is Value Stream Mapping (VSM), are the subject of this research.
Value Stream Mapping is the tool for identifying and analysing the value chain, thus analysing all activities which bring the product to the customer. It utilizes some common graphical icons and symbols to represent the process and, in that way, becomes a common language about processes [
44]. As supposed from Western production thinking, which was concentrated mainly on the flow of the material, in the Toyota production system, many decades ago, the different value flows were identified, and those are: the flow of material, the flow of information, which is as important as material flow and even more significant because it dictates how the material will move through the production process. Thus, the flow of information directly influences the flow of material. The third flow recognized in Toyota is the flow of people.
Value Stream Mapping allows one to identify all activities, all flows, both the flow of material and information and the flow of people, with the primary purpose of analysing and eliminating all wastes from the process. Previously, researchers have developed many techniques for optimizing individual operations, but most of these techniques and tools cannot comprehend and visualize the whole picture of the entire production process. That way, the operations are analysed separately, which can bring isolated improvements which do not necessarily lead to improving the whole production process. Value Stream Mapping is the primary tool used to identify the opportunities for Lean tools to improve the entire process [
45,
46,
47,
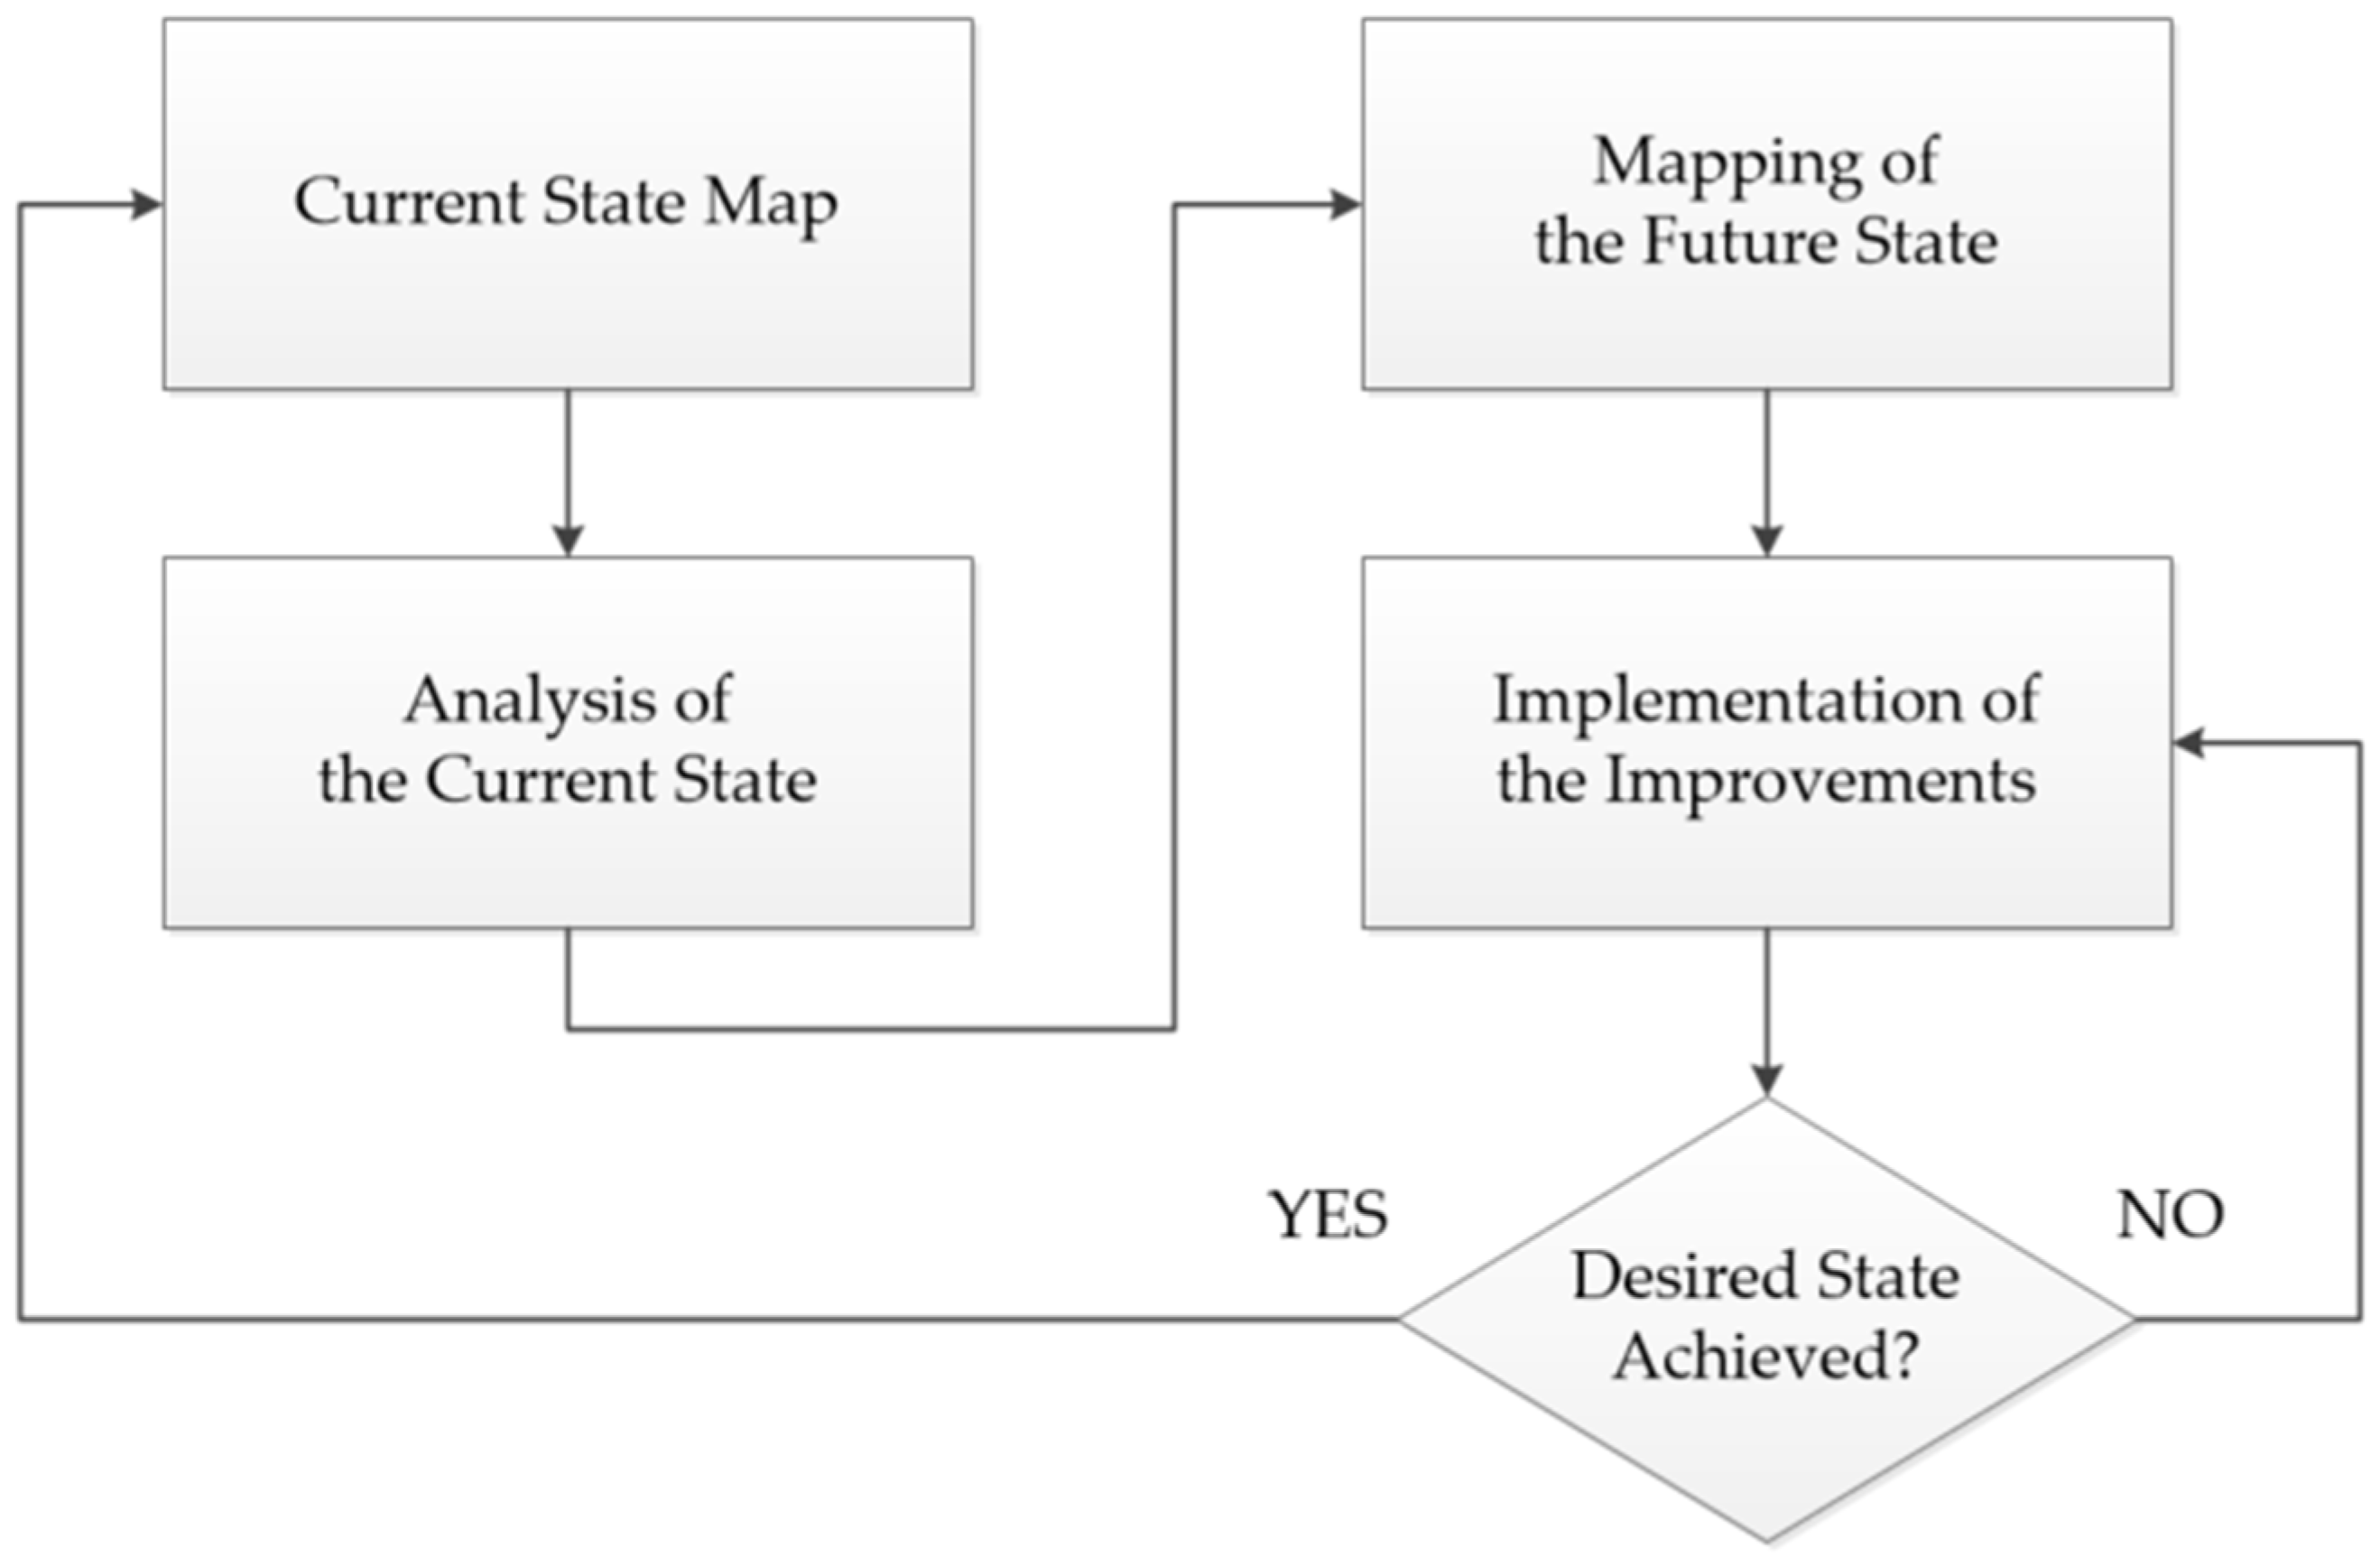
48]. The Value Stream Mapping process is shown in
Figure 1.
The first step in Value Stream Mapping is case selection and deciding for which product, product family, or service the Value Stream Map is going to be made. The next step is making the current Value Stream Map, and it is recommended to create a map of the current state in the field to collect reliable data. The current map is then analysed, and ideas for improvements are generated which are then presented in the future state map. According to the future state, an action plan for implementation is made. These steps were implemented in this case study, and details are given in section four.
4. Research Methodology
The purpose of this study was to research the adoption of Value Stream Mapping for analysing and improving the sales process in the shipbuilding industry, an event over which research does not have control. As Leonardo et al. suggest, in this situation the methodology applicable is a case study [
49]. In addition, Rashid et al. suggest that for in-depth phenomena research, a qualitative case study methodology is a good choice [
50].
In his work, Yin explains that there are three types of case studies, and those are exploratory, descriptive, and explanatory. Since the explanatory study is applicable for studies of the processes of the companies, this type of case study is chosen in this research. In addition, according to Yin, a case study can be a single-case case study or a multiple-case case study. Since in this research there were no other available cases for replication, a single-case case study was adopted [
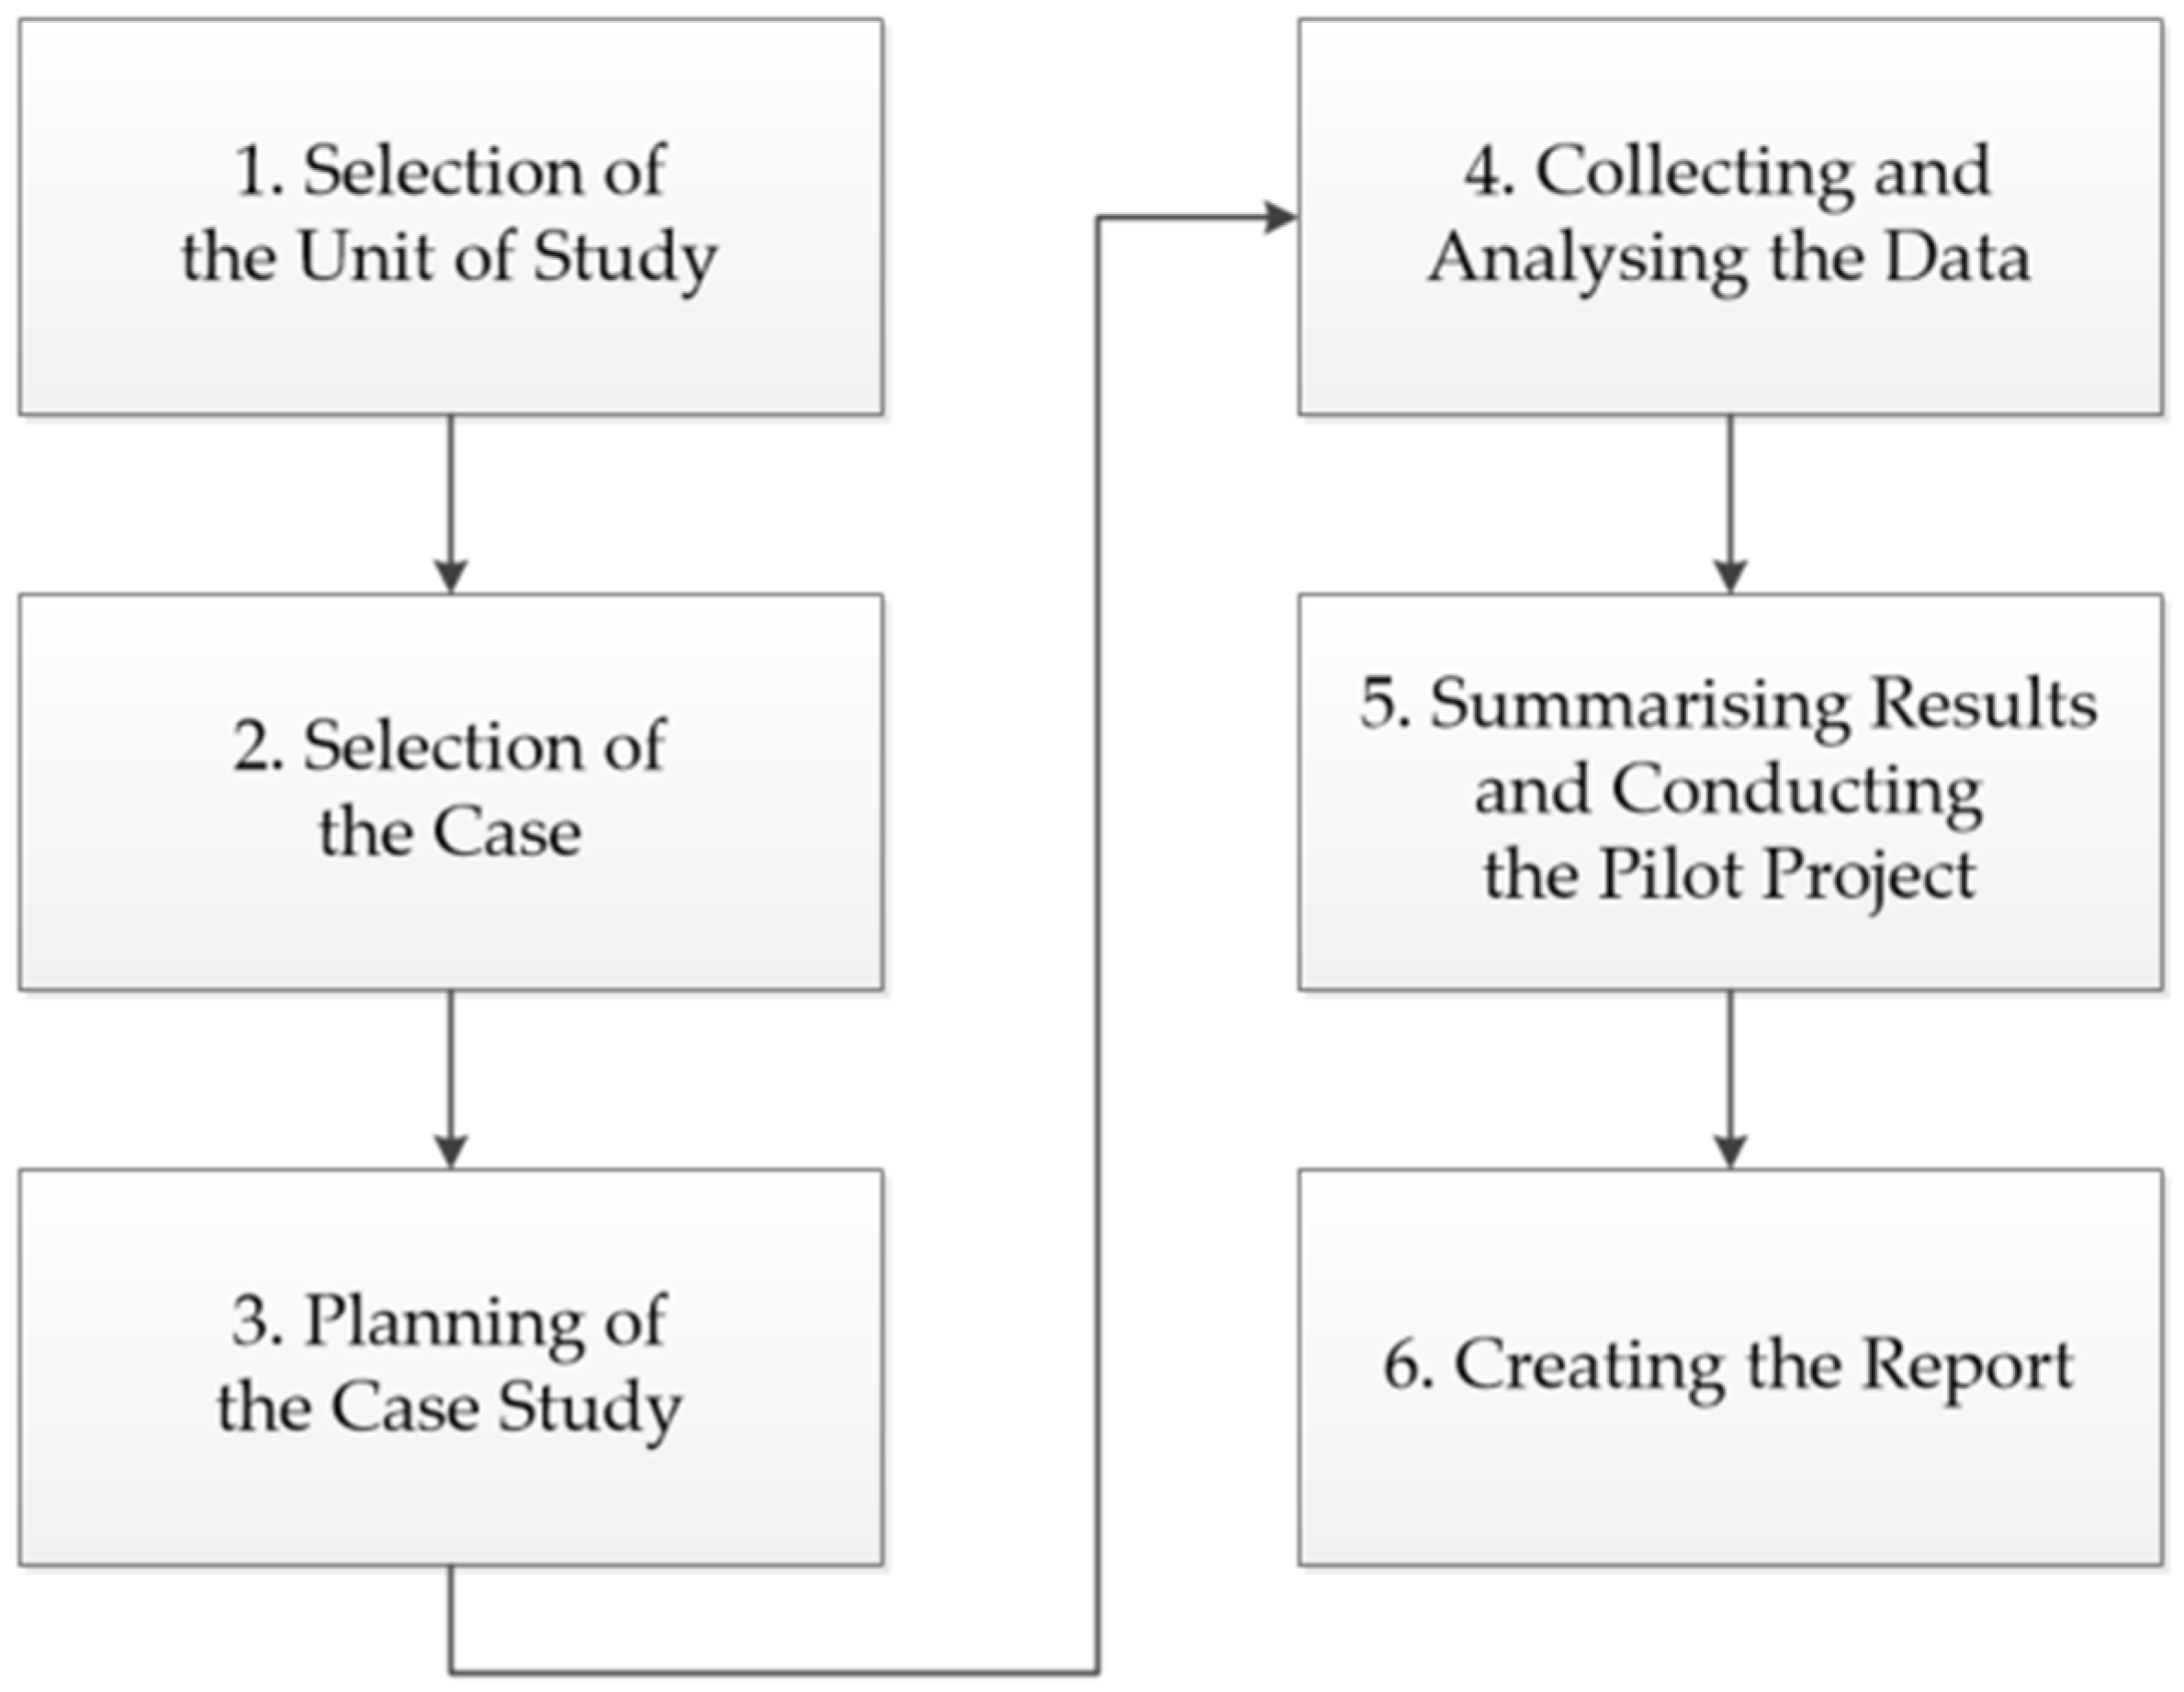
51]. Before conducting the case study, good preparation was necessary and as Rashid et al. in their work point out, issues such as clarity, selection, and operationalization of the case study can lead to wasting time, confusion, and wrong decisions. Thus, they suggest four phases of the case study and those are: step 1—the foundation phase, step 2—the pre-field phase, step 3—the field phase, and step 4—the reporting phase. The steps of this case study are given in
Figure 2.
The foundation phase begins with a selection of the unit study and the case. The unit selected was a European shipbuilding factory whose strategic investment plans were oriented toward implementing Industry 4.0 doctrines in technological and production processes and business systems using the available digital technology tools to transform the shipyard into a Smart factory.
According to the size of its infrastructure and number of employees, it belongs to the group of large European shipyard plants, organizationally including all business functions—administrative (sales, marketing, project management, purchasing, finances, and human resources), as well as all those technical and technological (planning, technology, design, engineering) and production (maintenance and transport included), with the possibility of project realisation exclusively or primarily by its own human resources.
The shipyard provides the services of developing/initial designing, designing, and constructing the most complex ships, with demanding special infrastructure constructions (e.g., bridges), offshore objects for the oil and gas industry, as well as components for offshore wind farms. It is present in the entire international market.
The shipyard currently employs a couple of thousand workers, of which more than 100 are designers who develop and optimise different types of the most technologically advanced ships. By using the most modern software tools, they virtually model and design a “digital prototype” (Eng. “digital twin” or “ship 0”) [
52,
53] to define the optimal technical and technological solutions before the object/vessel construction launches (begins).
Since the Sales and Marketing Sector and the Project Management Office are the backbones of the company, the selected case was the company’s sales sector. Implementing the Lean system in the sales process was one of the key strategic decisions of the shipyard’s management to improve the process in terms of revenue growth, i.e., employment of production capacities.
The pre-field phase included planning the case study. Interviewing managers and designated personnel from the Sales and Marketing Sector, Initial Design Department, Planning and Technology Sector, Project Management Office, Key Material Sourcing Department, Legal Department and Financial Sector, was planned, all together in average 12 employees involved, within the period of about 3 months, mostly as a part of the regular (weekly) operational meetings. Additionally, the field walk with personnel to gather all the necessary data for the current Value Stream Map was planned.
The field phase, consisting of steps four and five of the case study, included the field walk, gathering the historical and present data, and constructing the current Value Stream Map. Data were collected from the archive (IT, server) of each and every involved sector and department detailing the time their employees’ had engaged in the sales process during the past 2 years. Brainstorming meetings attended by at least three representatives from the Sales and Marketing Sector representatives along with directors, managers, and personnel, in various compositions were held on bi-weekly basis through approximately a nine-month period The purpose of these meetings was to analyse the current state and gain solutions for the future state map. The future state map was the result of this phase of the case study, and the pilot project was carried according to the future VSM.
The reporting phase included creating and structuring the results achieved with the VSM tool.
In the next section, the field and reporting phase will be thoroughly described.
5. Shipbuilding Sales Process in the Selected Unit
The Sales and Marketing Sector, with the associated Project Management Office, is the backbone of the shipbuilding system organisation; the sector is divided into the shipbuilding department, represented by three employees, and the off-shipbuilding department with up to eight employees, including technical and technological support.
The Initial Design Department also makes up part of this sector (the development/initial design of the ship), which is actively involved in the data processing of inquiries (for newbuilds), i.e., in offer preparation and project contracting.
The shipbuilding department of the Sales and Marketing Sector receives inquiries directly from the customers or gains them via agents (“brokers”) based on the following:
The shipyard’s references, i.e., its market position (word of mouth, marketing activities—fairs, interviews, and advertising in specialised publications/editions);
Direct approach to potential customers by the sales representatives regarding long-term business strategy (opening new market niches such as ship repairs and refits, constructing offshore objects, conversions and constructing megayachts);
The ongoing projects and previous deliveries—re-ordering of “sister” or similar new vessels by the former and actual clients.
The value created by the shipbuilding sales process is the shipbuilding contract for the vessel optimised so that the ship parameters are improved during the development and design phase. This is accomplished by implementing the shipyard’s available software tools to reach the best possible indicators of the feasibility study of the customer’s project.
Processing inquiries for new construction, i.e., preparing the offer for the initial design of the ship, and designing and constructing the ship up to contracting the specific project, evolves in four phases: the inquiry selection phase, the Preliminary offer preparation phase, the Letter of Intent defining phase, and the contracting phase.
5.1. Inquiry Selection Phase
The selection of inquiries sent by the customer or agent is performed according to the following criteria:
Conformity with the market niches which are the shipyard’s strategical mid-term and long-term orientation (passenger ships, ferries, cruise ships, special purpose vessels—oil industry, offshore wind farms), as well as the acceptable volume of the ships to be constructed (preferred gross tonnage depending on the shipyard’s profile). Smaller ships are acceptable if they are from the mega-yacht or navy program niche, if they are contracted as a large serial of vessels by the basic shipbuilding contract and not as optional vessels, and if the customer is recognized as a long-term strategic partner in the shipbuilding or shipping sector;
Shipbuilding capacities regarding the available and short-term planned shipyard infrastructure (lifting capacity of cranes, the shipyard’s hall size, slipway size, maximal depths of the shipyard’s port, and the like);
The project realization capacity within the planned delivery date according to the shipyard’s standard and usual delivery deadlines for of design and building a ship of similar parameters and, if required by the inquiry, according to the obligated class notations and requirements for its seaworthiness.
Inquiry analysis is performed by the Sales and Marketing Sector according to the selection criteria mentioned above and with the possible assistance of the Planning and Technology Sector relating to project realisation capacities. The inquiry selection phase usually lasts for 3 to 4 days (in average some 84 h), mostly conditioned by communication with the customer or its agent to clarify certain inquiry details. Here, the mentioned duration of this phase includes internal communication with the Planning and Technology Department.
5.2. Preliminary Offer Preparation Phase
The Preliminary offer preparation phase consists of two subphases: the Non-Disclosure Agreement defining the subphase and the Preliminary offer budgeting subphase. Preparation of the data framework for initial calculation is based on input documents sent by the potential client/agent, whereas the shipyard defines the minimum requirement for the potential client’s documentation—conceptual design/preliminary general arrangement plan and the ship’s outline specification. Before submitting the relevant documents, the potential client delivers the Non-Disclosure Agreement (NDA) proposal no more than three days from when the shipyard Sales Sector has confirmed its interest in processing the inquiry. The Sales and Marketing Sector contacts the company’s Legal Department to prepare the Non-Disclosure Agreement proposal for each future revision after the potential client sends the answer regarding the company’s comments. To review the initial Non-Disclosure Agreement proposal, the Legal Department takes 4 days. Every other future revision is generally exchanged within 3 days, which usually includes four revisions from the initial document. Once the Non-Disclosure Agreement is approved, it is delivered to the Management Board Office for signature. After that, and usually within 3 days, it is re-sent to the Sales Sector and electronically to the potential client.
Preparing a preliminary data framework for initial calculation is performed by the Sales representative based on the ship’s technical parameters (gross tonnage, deadweight, number of passengers, number of crew members, vessel dimensions, and other relevant information), requirements for the ship’s seaworthiness, requests according to required class notations (regulations of the ship classification societies), applicable international rules and regulations, and comparing it with ships of reference (assigning the coefficients regarding the complexity of the ship’s requirements). The Sales and Marketing Sector contacts the Initial Design Department to analyse the applicable launching technology and the Planning and Technology Sector regarding the preliminary analysis of the possible shipbuilding technological methods, all to estimate project realisation possibilities regarding the available infrastructure and the shipyard’s current technological achievements. Furthermore, depending on the inquiry, the Sales representative asks the Planning and Technology Sector to estimate the working hours for the ship’s hull construction and outfitting, and from the (related) engineering company, the cost estimation for the anti-corrosion protection of the ship. In addition, the Planning and Technology Sector delivers the Sales Sector a detailed estimation of the project realisation period (elaborated in phases: effectiveness of the shipbuilding contract, the start of steel cutting, keel laying, launching, and delivery), all under the assumption that the relevant project is contracted within up to 8 months from receiving the inquiry. The average time to prepare the preliminary data framework for calculation is 7 to 10 working days, depending on the intensity of the involvement of the pre-listed departments, i.e., the related company. The preliminary data framework for the initial calculation, outlined in the table form, is delivered to the Management Board Office for the approximate estimation of the ship’s cost. Within 5 days, the Management Board member gives information on the initial sales price with comments related to the ship’s estimated construction/delivery deadline along with the suggested dynamics for paying based on which the Sales Sector prepares the Preliminary offer and delivers the same to the client within 1 day. The client usually takes 14 days to comment on the Preliminary offer. In total, the Preliminary offer preparation phase on average takes 44.5 days (1068 h).
5.3. Letter of Intent Defining Phase
If the potential client should find the Preliminary offer sufficient for continuing negotiations, the Financial Sector gets involved in the sales process by submitting the insurance instruments available for monitoring the relevant project within 3 days. Upon receiving the relevant information, the potential client usually asks the shipyard for a statement on the capacities of the financial support of the project, which means that within approximately 10 days, the Financial Sector, accompanying banks of the company and insurance companies, analyses the financial reports of the potential client, its business plan, and feasibility indicators of the project, and the statement on conclusions regarding the possibility of the company’s participation in financing the project is delivered to the potential client. If all parties—the potential client, shipbuilder, and financial institutions—agree on options related to financing and payment dynamics, defining the Letter of Intent can begin. The period of mutual consent, starting from the shipyard’s statement on the possibilities of financial participation in the project to the eventual agreement with the potential client about the acceptable financial arrangements to follow the newbuild’s construction (or its series), usually takes 10 days. A Letter of Intent proposal is generally prepared by the company’s Legal Department according to commercial instructions delivered by the Sales Sector within 2 days after agreeing with the potential client that the Letter of Intent will be prepared. Regarding the commercial–legal specificities of the project, preparing the Letter of Intent proposal usually lasts 4 days, after which it is delivered to the potential client for analysis. Generally, until the Letter of Intent is adopted, contracting parties exchange four revisions of the relevant documents, with an average period of three days to prepare comments between revisions. The agreed Letter of Intent is submitted by the Legal Department to the Management Board Office with a summary of the legal interpretation of the document and upon adoption and signing, is electronically sent to the Sales Sector, usually within 3 days. Hence, the average duration of the Letter of Intent defining phase is around 41 days (984 h).
5.4. Contracting Phase
The contracting phase comprises two simultaneously running subphases: the contractual ship price calculation subphase and the shipbuilding contract review subphase. Upon signing the Letter of Intent (LOI), the Initial Design Department begins with the development, i.e., the ship’s initial design, and with defining/elaborating the technical specifications of the same to prepare contractual technical documentation within 120 days. The ship’s initial design process implies the much-needed constant cooperation with the client’s technical–commercial team on the shipbuilder’s site to optimise the ship according to the client’s wishes, so the best solutions are achieved with minimal expenses. This ensures that the ship’s top quality and the fastest return on the client’s investment are met. At the same time and during the first 45 days, the Initial Design Department prepares the ship’s technical basis and submits them to the Key Material Sourcing Department to prepare the final calculation and the final contractual ship price, respectively. The ship’s technical basis is delivered simultaneously by each profession (propulsion systems, electro components, navigation and communication equipment, and others) to relevant subdivisions of the Key Material Sourcing Department. Within 15 days from the last received technical basis, the Key Material Sourcing Department, based on market processing results and the best pre-contracted supply prices for the defined equipment and systems, delivers the detailed cost sheet to the Management Board Office, elaborated according to the functional division of the ship, for analysis and defining the ship’s final cost.
Usually within 7 days, the Management Board sets the contractual ship price, which is further negotiated with the client by the Sales Sector. Approaching the final contractual ship price agreement is completed within 30 days. Then, the Legal Department intensifies the proposal review for the Shipbuilding contract—the same is delivered to the client by the Legal Department immediately after signing the LOI. After approximately 150 days (3600 h) of total average duration of the contracting phase and from signing the LOI, respectively, the final version of the Shipbuilding contract, along with the contractual technical documentation previously agreed upon and verified by the client, is given to each contracting party to be signed. To finalize the Shipbuilding contract and fulfil all financial prerequisites (issuing the advance payment guarantees, advance payment executed) takes around 90 days. Upon signing the Shipbuilding contract, the Project Management Office names the project manager of the relevant project.
6. Value Stream Mapping of the Shipbuilding Sales Process
6.1. Lean Metrics
The Management Board has to be provided with the metrics for measuring the performance and effectiveness of the shipbuilding system processes over a defined period of time, among which the Sales and Marketing Sector secures the measures monitoring sales and revenue growth, respectively, sales process cycle average duration, inquiry-to-shipowner conversion effectiveness, and average sales process cost.
The sales growth performance indicator measures the accomplishments of sales goals considering the company’s turnover growth over a determined period, comparing the actual revenue with the forecasted one [
54]. The average sales cycle length performance indicator, initially aligned with the duration of the actual state of the process, measures success in optimisation of the sales cycle: the shorter the cycle is, the more sales will be achieved [
54]. The inquiry-to-shipowner ratio measures success in converting inquiries into shipbuilding contracts; a higher ratio indicates higher effectiveness of employees engaged in the sales process, particularly in the later phases [
54,
55]. The cost per client acquisition (CCA) performance indicator refers to all sales process costs generated in reaching the shipbuilding contract, including but not limited to marketing, travel and lodging, and research and development costs [
54,
55]. The CCA compares and analyses accrued costs per client acquisition, thereby enabling determination of sales priorities; furthermore, it helps achieve cost savings by identifying waste in the process that needs to be eliminated.
Key performance indicators to be applied to measure the sales process improvement by applying Value Stream Mapping as the chosen Lean tool, refer to:
Monitoring the transformation of the contacts into the clients, on annual average with the indicators as follows:
Conversion rate (C1) of the Contact (CO) of the Potential Client (PC), as the result of accepting the Inquiry from the Customer (inquiry selection phase);
Conversion rate (C2) of the Potential Client (PC) into the Apparent Client (AC), completed once the Preliminary offer is accepted by the Potential Client;
Conversion rate (C3) of the Apparent Client (AC) into the Client (CL), completed by signing the LOI;
Conversion rate (C4) of the Client (CL) into the Shipowner (SO)—the ultimate conversion completed by signing the Shipbuilding contract,
Removal, i.e., decreasing losses in the sales process, and realising the sales results by applying the following Lean metrics:
Average length of the sales process by each realised shipbuilding contract;
Costs of the sales process, annual average;
Number of the contracted man-hours in production, annual average.
6.2. Value Stream Mapping of the Current State
The average duration length of the shipbuilding sales process is defined by:
The average durations of the inquiry selection phase activities are shown in
Table A2, the Preliminary offer preparation phase in
Table A3, the LOI defining phase in
Table A4, and the contracting phase in
Table A5; considering value added and non-value added sales process activities durations, whereby non-value-added activities relate at most to the waiting time in internal and external communication, day time unit expressed in
Table A2,
Table A3,
Table A4 and
Table A5 spreads to the 24 h time span.
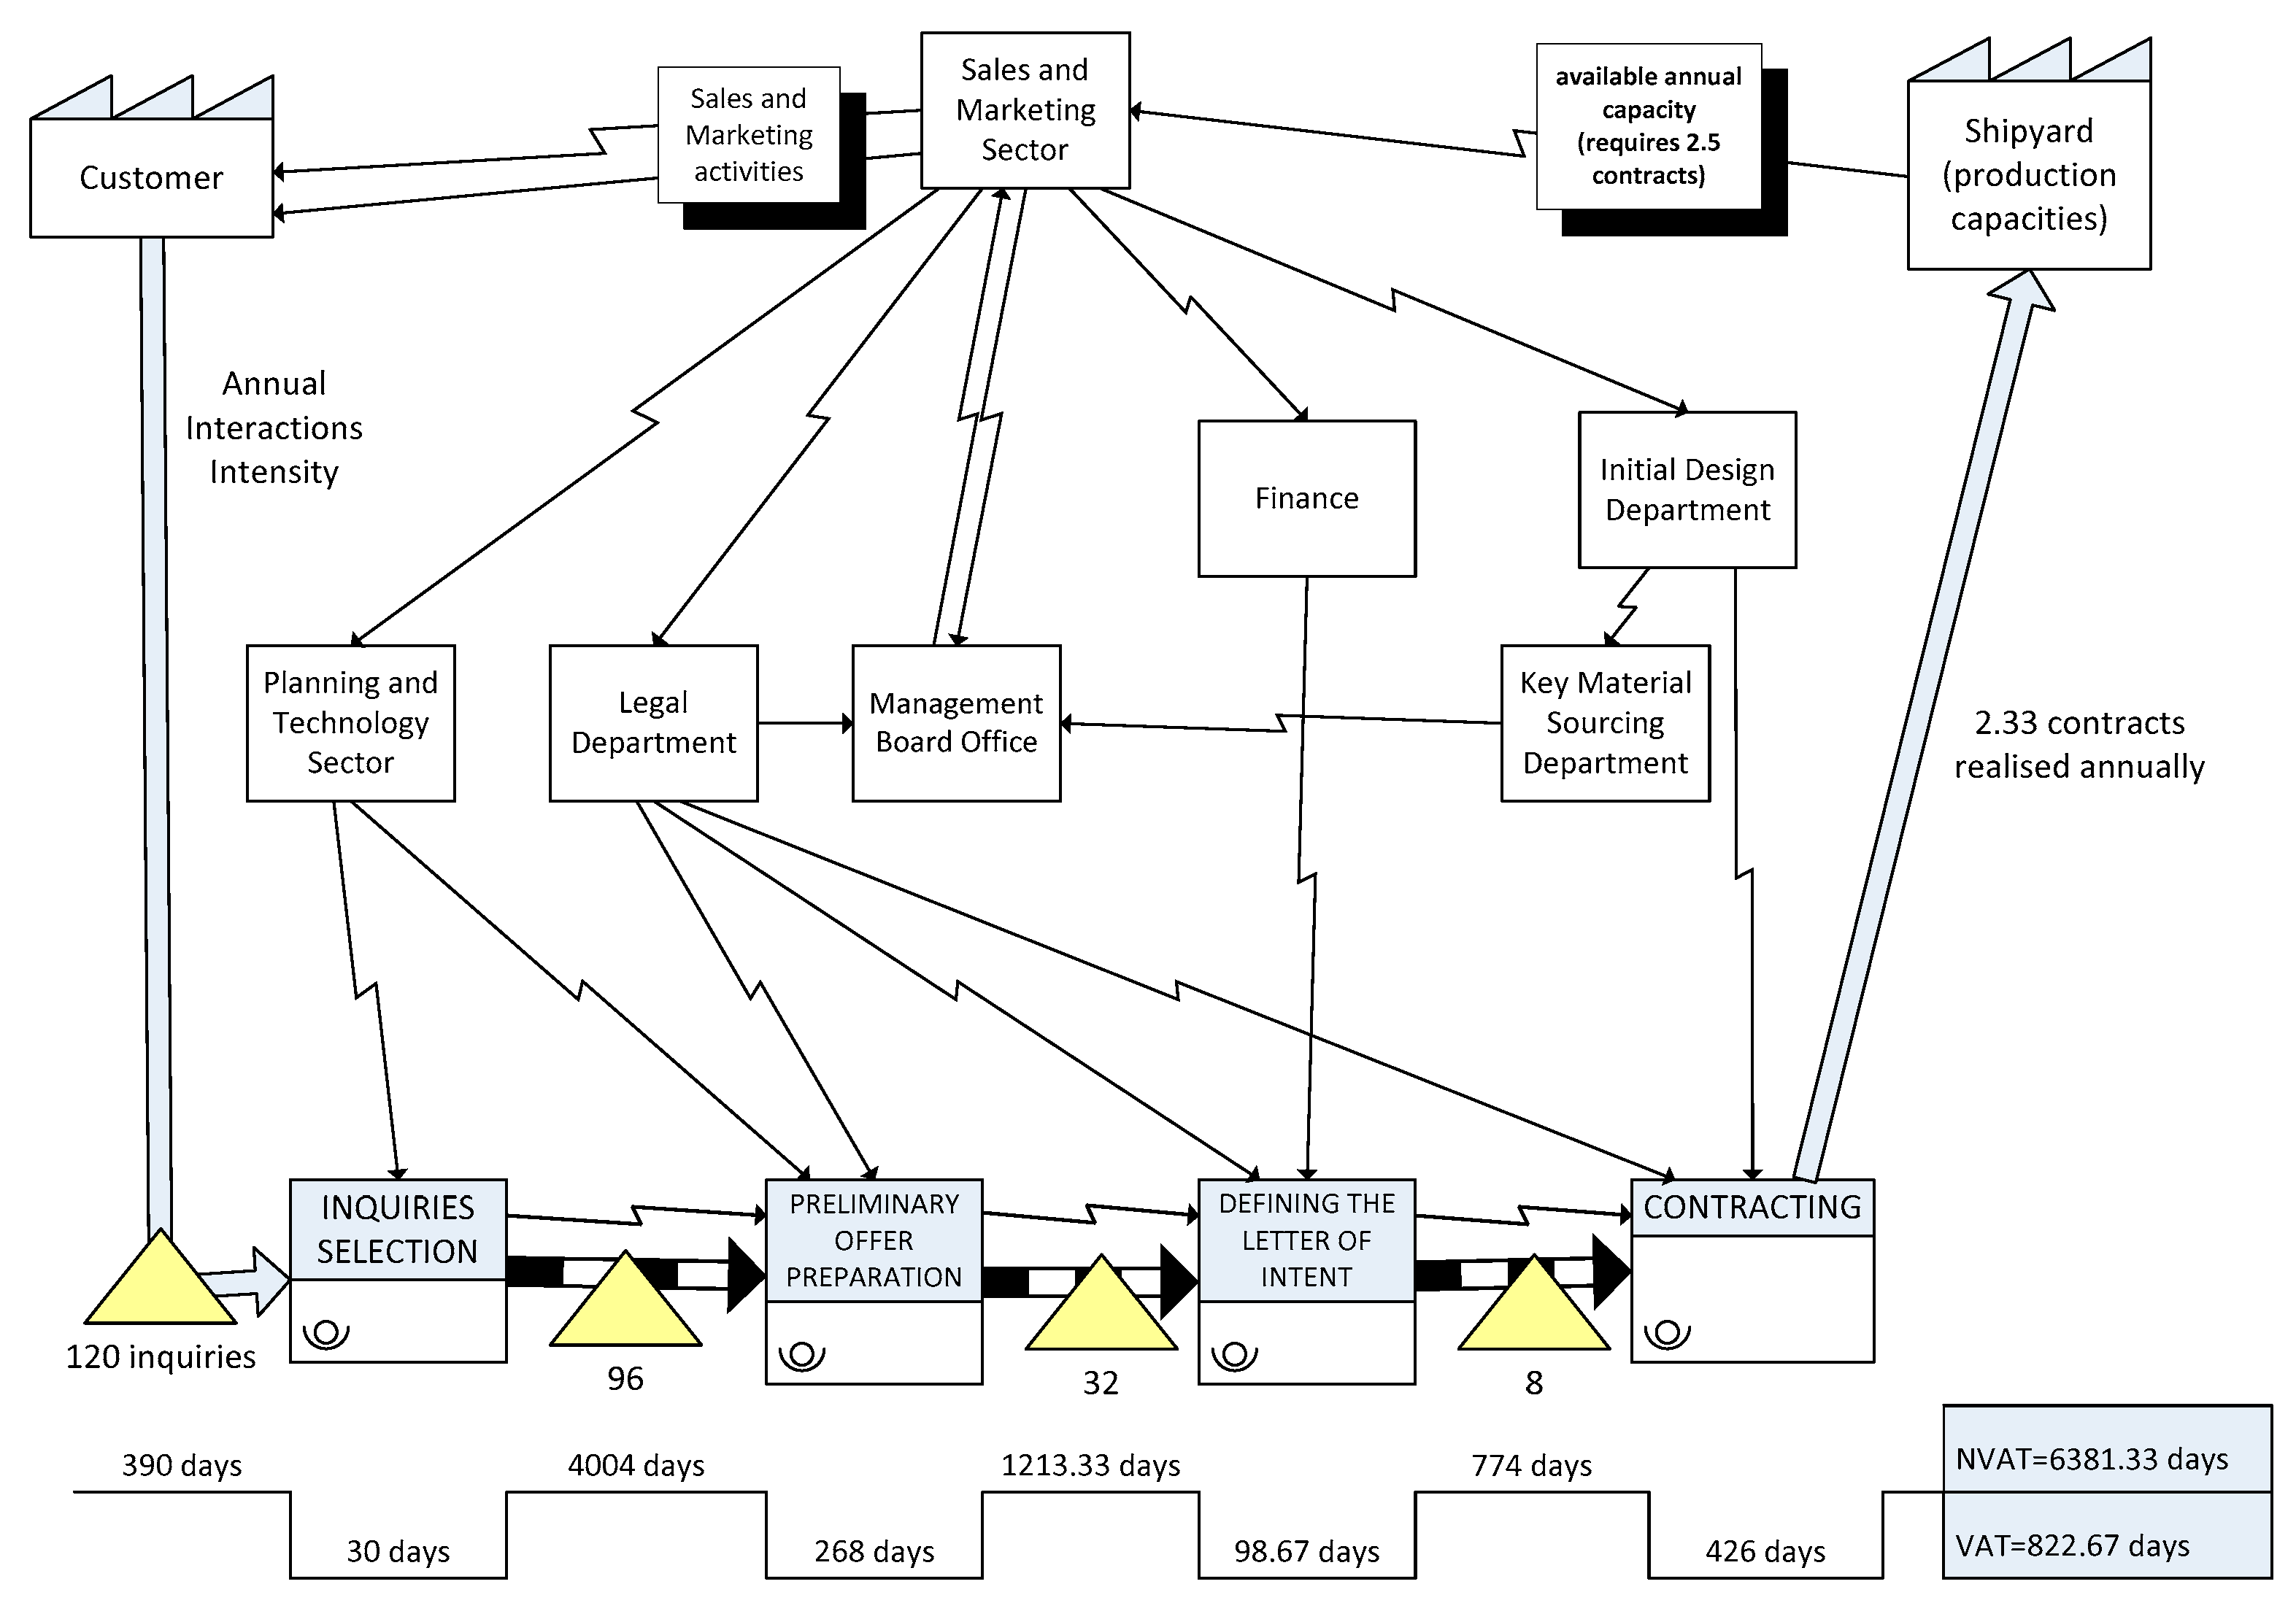
The Value Stream Map of the current state of the shipbuilding sales process is shown in
Figure 3.
Value-added time of, for example, the Letter of Intent defining phase, equals the number of entries (32 Apparent Clients, AC, as shown in
Table A1) into the subject phase, multiplied by the total average time (expressed by day time unit) of value-added activities of the subject phase, as presented in
Table A4.
By analysing the current Value Stream Map of the sales process, it is noted that a large number of inquiries is transferred into Phase 2 of the sales process, and accordingly, a large quantity of (simultaneous) interactions with customers even into the next phases, which makes it drastically harder to recognize the buyers who ask for a stronger involvement in the offer-making process, to understand their requests better and to communicate with them constantly during the value creation. Due to processing several simultaneous inquiries, i.e., making the offer, legal analysis, and defining the contractual and technical documentation within the minimum or negligibly partial phase shifts, the average length of the individual sales process from receiving the inquiry to realising the shipbuilding contract usually takes 8 months, whereas activities which do not contribute to the added value of the sales process last an average of 6 months, which is 75% of the overall process duration time. Insufficient involvement with the customers regarding the analysis of their potential as clients, the common impossibility of not recognizing the customer’s key representatives with decision power, and insufficiently monitored communication with the customer during the higher phases of the sales process, all due to the overload of the stakeholders in the sales process by the (over)sized quantity of inquiries “downloaded” into the sales process, eventually results in the opposite of what was expected, i.e., fewer realised shipbuilding contracts (average is 2.33 per year) versus the planned (average of 2.7 annually). Consequently and due to the available production capacity average of the shipyard (that matches the construction of about 2.5 newbuilds), for part of its capacities (around 120,000 production man-hours annually), the shipyard has to subcontract (most commonly other shipyards) or apply other labour law instruments (rescheduling the working hours, etc.).
To perform the shipbuilding sales process according to the current state, 37 employees from the seven organisational units of the shipyard required, as shown in
Table 1.
To conclude, the large number of phase interactions with the customers as a consequence of the high percentage of accepted inquiries compared to the received ones (80% of the “approved” inquiries), results in a 2.7% share of the average annual expense of the shipbuilding sales process (EUR 3,112,000, as shown in
Table 2,) in the shipyard’s overall annual revenue (nearly EUR 116,500,000), which is approximately 34% more than the expenditure plan of the planned annual cost of the sales process (nearly EUR 2,330,000, which is 2% of the average annual revenue, excluding the marketing costs).
6.3. Value Stream Mapping of the Future State
Value Stream Mapping of the future state of the shipbuilding sales process is anticipated by defining the measures which could realise changes in the sales process.
Improvements in the sales process will be achieved firstly by strict selection of the inquiries received, i.e., by detailed analysis and consequently with a lower number of phase interactions with the customers and therefore more effective engagement of the shipyard workers when communicating during the higher phases of the sales process, eventually resulting in high added value for the customer.
Decreasing the number of phase interactions with the customers will be achieved by improving the sales process according to the following:
The Sales Sector will engage a renowned, international consulting service agency specialising in the maritime sector to complete the study analysis of the actual, mid-term, and long-term expected competitiveness of the shipyard within specific market niches (passenger ships, ferries, special purpose vessels, cruise ships, cargo ships, yachts, naval vessels) and their mid-term and long-term prospective growth potential, risks, new markets, etc. The analysis will contain the review of current and forecast trends in the shipbuilding and shipping industry. The study analysis will be ordered in six month intervals and used by the Sales Sector as the tool during the inquiry selection phase. It will be the base according to which, with additional time engagement of the Sales Sector employees, the inquiries will be analysed in further detail, i.e., to be selected more rigorously.
If the inquiry should define specific requests for maritime features of the ship and the scope of required class notations, the Sales Sector will include the Initial Design Department in Phase 1 of the sales process to receive an opinion about the complexity of the criteria and parameters set by the inquiry, i.e., their implication to the aimed delivery deadline, all from the beginning due to the more rigorous choice of the inquiry to transfer it to the next phase of the sales process. Furthermore, because of the same reason and regarding the same criteria, i.e., the possibility of realising the project within the aimed delivery deadline, the Planning and Technology Sector will be included in the inquiry selection phase, with its additional engagement power, for a more detailed analysis of the project’s realisation and actual mid-term planning, i.e., the shipyard’s capacities which, besides the already contracted projects, also includes projects from the 3rd and 4th phase of the sales process.
The Sales and Marketing Sector will join the legal specialist as the permanent employee of the sector for faster internal communication with the shipyard’s employees, therefore inciting the customers to more agile interaction, with an emphasis on reviewing the pre-contractual and contractual documentation (Non-Disclosure Agreement, LOI, and Shipbuilding contract).
When defining the Non-Disclosure Agreement, to make a better choice amongst potential clients to continue with the negotiations, the Sales Sector, i.e., its legal specialist, will ask for the legal/organisational structure of the customer, and based on the same, along with available network data, will perform a preliminary legal due diligence in a reduced and narrow scope. Furthermore, most commonly, the customer’s request to pay for an indefinite indemnity charge if the NDA provisions would be breached will not be accepted, but the shipyard will insist on limiting the damages to a certain amount; only if the potential client was recognised as a possible strategic or a long-term partner, and/or the shipyard is a major source of the disclosed information, can the shipyard accept the initial, common request of the customer.
When the NDA is signed, and as the additional criterion for selecting potential clients, the Financial Sector will conduct one “mini” financial due diligence of the customer, based on data available on the Internet and possible financial statements delivered by the customer.
The Preliminary offer will include two additional “conditions” for the customer:
Approximate deadlines to realise further sales process phases—accepting the Preliminary offer, signing the LOI, defining and accepting the contractual ship price as well as signing the Shipbuilding contract—all as the prerequisites for handing over the ship within the deadline desired by the client, or within the first next possible deadline and according to the production plan, i.e., the availability of the shipyard’s capacities;
The preliminary price of the Initial design, i.e., contractual technical documentation (defining the general arrangement plan and technical specification of the ship, developed from the ship’s initial design activities), along with the payment conditions of the same: in installments during the contracting phase or at once if the shipyard and the customer do not sign the shipbuilding contract or the same has not become effective. Accepting the aforementioned will be considered the main prerequisite for signing the LOI. Only if the client is recognized as a strategic one, with the possibility of building more ships in a serial, and whose models of financing depend on developing and contracting the (first) ship, will the shipyard estimate the possibilities for acknowledging to take over 50% maximum of the Initial design expenses.
To conclude, the validity deadline of the Preliminary offer will be shortened, i.e., defined as not longer than 30 days, depending on the characteristics of the project and current plans of the shipyard.
The Finance Sector will additionally ask the customer for evidence of their existing funds or to reserve funds to finance the construction or pay for the ship upon its delivery. It will be performed in the form of deposited funds or with the confirmation that the customer’s financial institution guarantees that the payment is ready to be issued. Depending on the customer’s compliance with these additional criteria, the shipyard will estimate if the negotiations with the customer should continue and should the LOI, previously agreed upon, be signed. These criteria will not be applied in the event that the customer should be a Public Administration Authority (ministries and the like).
Upon signing the LOI, the Project Management Office will nominate the manager of the relevant project, who will, as a coordinator of the Client’s commercial–technical teams and the shipbuilder, will participate in the initial design of the ship, i.e., defining and elaborating the technical specification of the same, for the extra evaluation of the project requirements, to contribute to the optimal implementation of the same during the ship’s development, and amongst all due to managing the dynamics of the communication between the teams pursuant to the Preliminary offer and “conditioned” deadlines for defining the ship’s price and agreeing on the Shipbuilding contract. The Project Manager will actively be involved in the work of legal teams during the revision process of the Shipbuilding contract and will initialise the final, executed contract version.
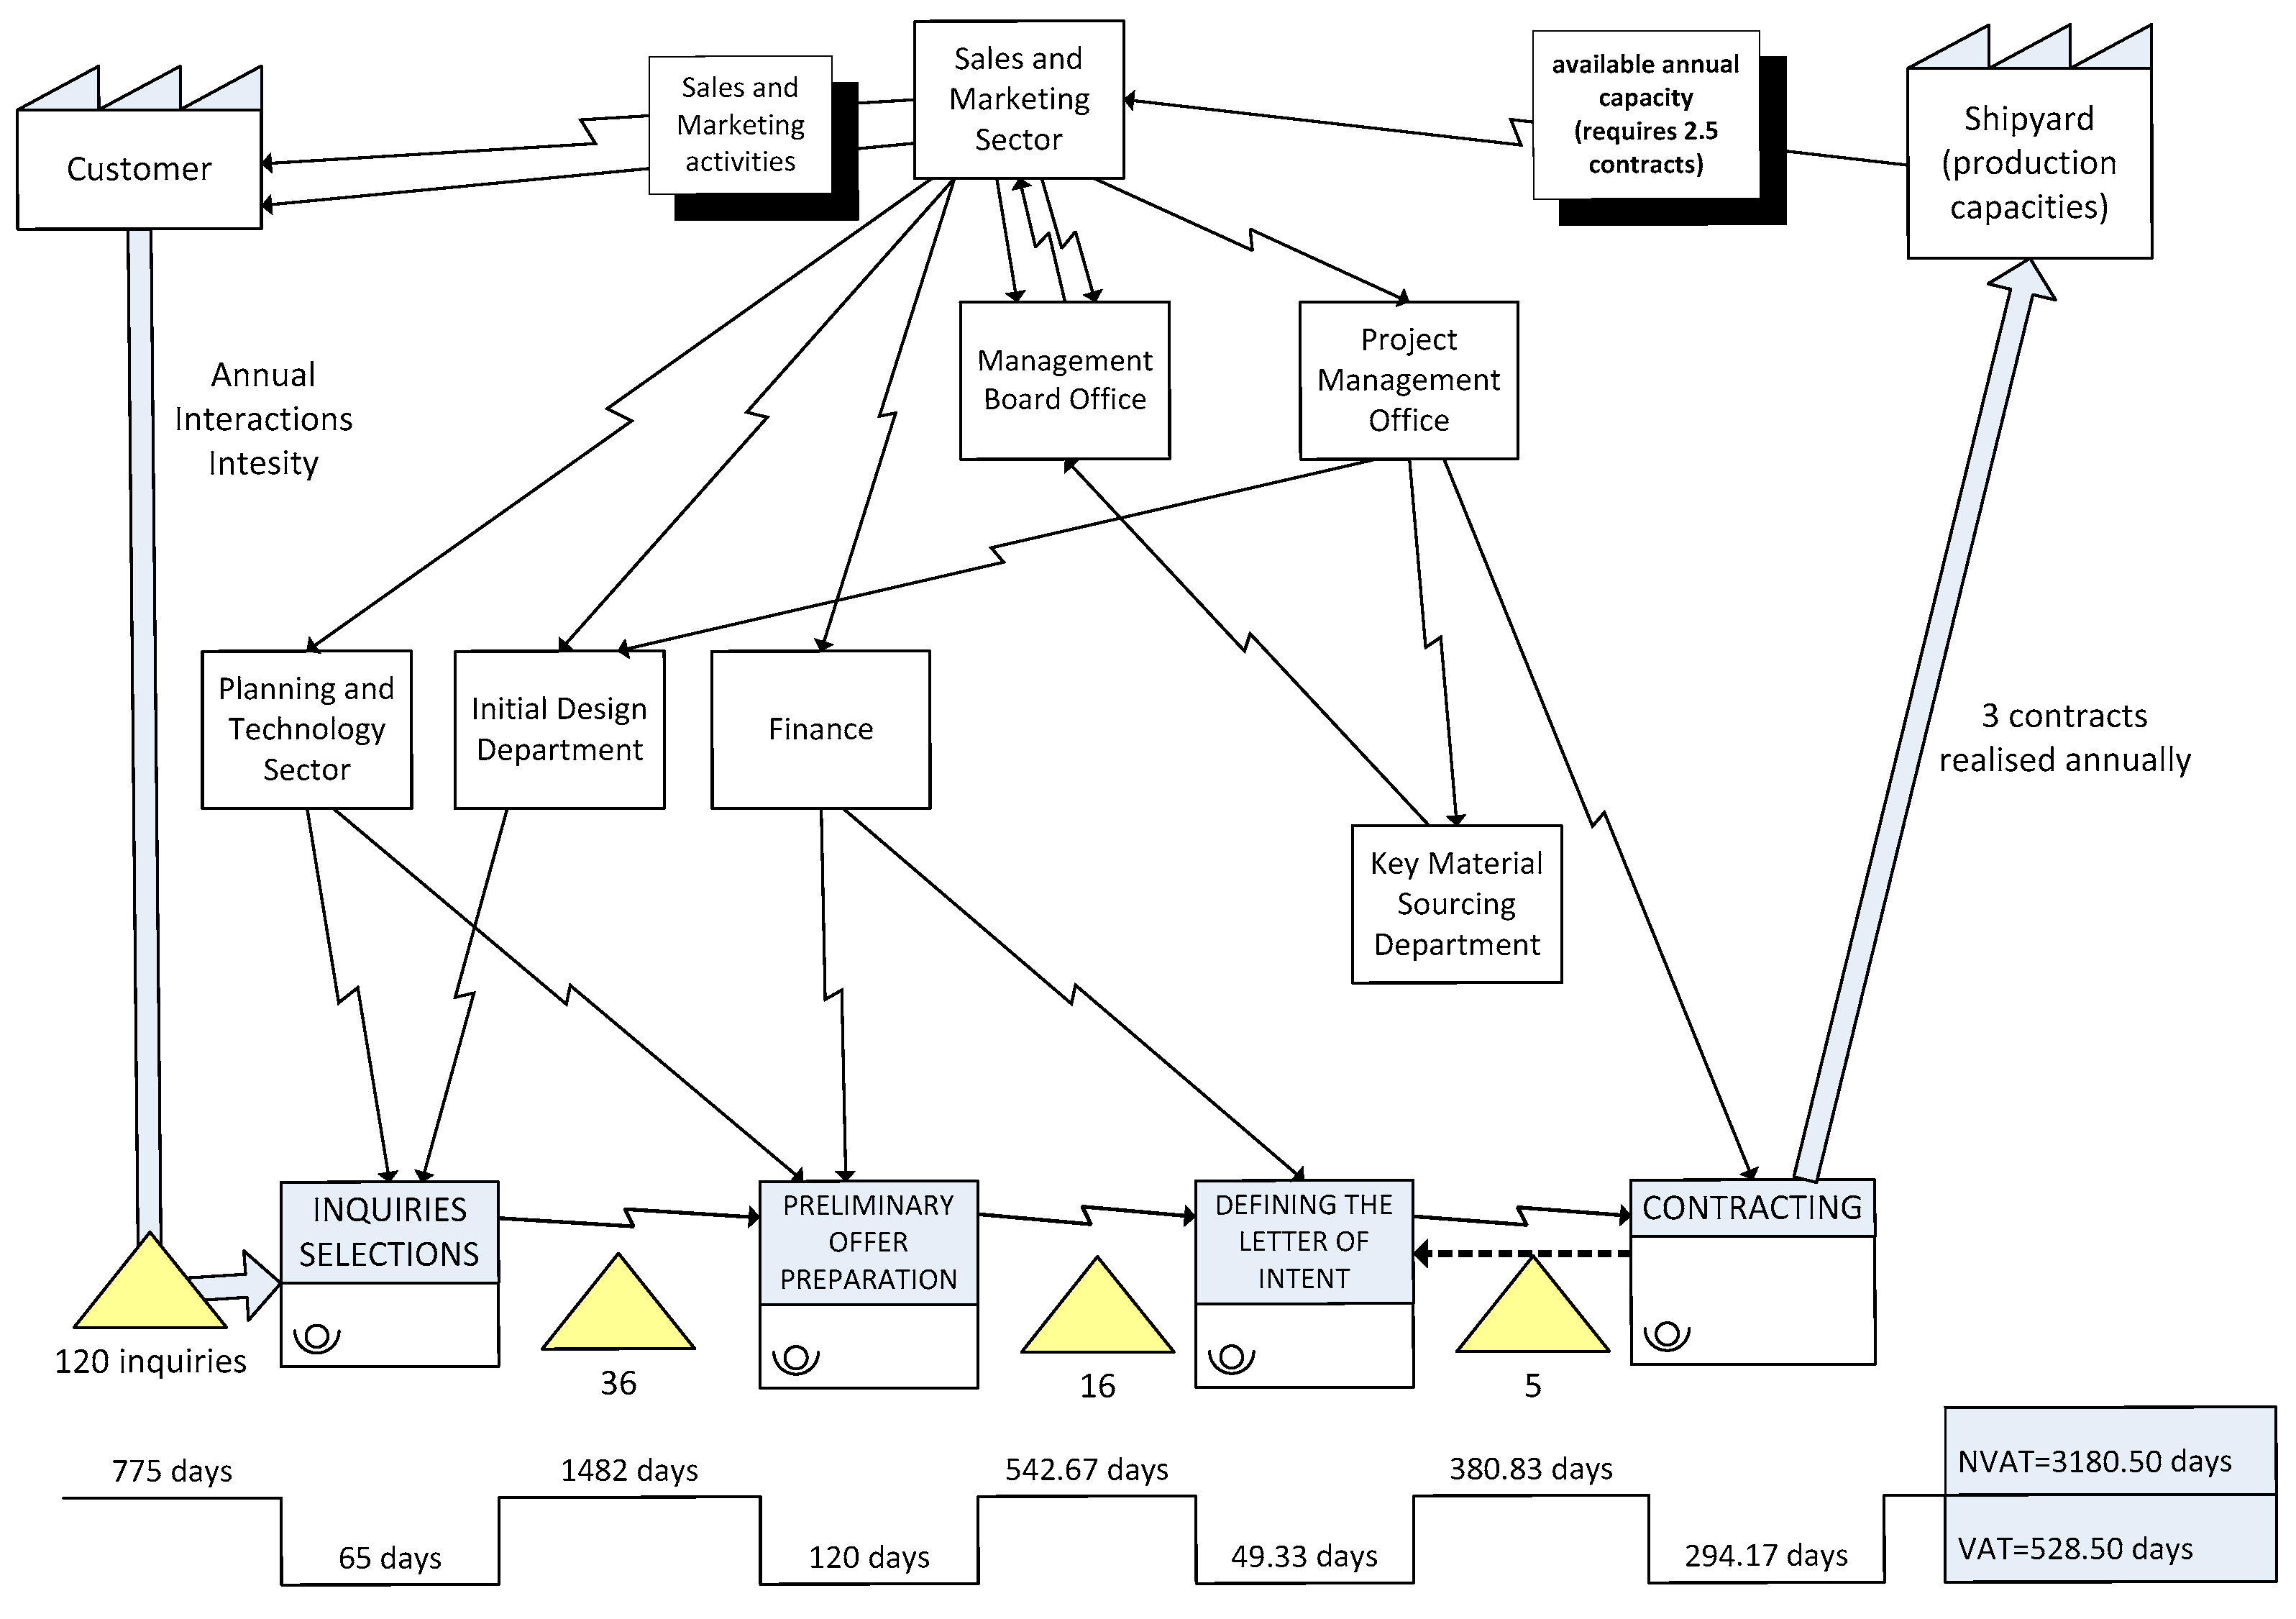
A Value Stream Map of the future state of the shipbuilding sales process is shown in
Figure 4.
6.4. Implementing the Improvements—Theoretical Model
Applying the aforementioned improvement measures does not necessarily impact the change in the average phase time—except for doubling the duration length of the inquiry selection phase activities (
Table A6), but it changes the relationship of the average time of the activities. Namely, within the Preliminary offer preparation phase, and especially in the contracting phase, it decreases the average duration time of the activities, which does not create added value (
Table A7, i.e.,
Table A9). When defining the LOI for the average length of the activity, which does not create added value for the customer, the time is shortened, while the duration of the activities which develop the added value remains unchanged (
Table A8). The stated decreases of losses in the process, with an emphasis on those referring to the waiting time to receive the answer from the customer, are predominantly realised by introducing the conditions for defining the approximate realisation deadlines of the higher phases of the sales process, starting from the deadline for accepting the Preliminary offer, which “assigns” the expected dynamics of the communication with the shipyard (defining the approximate reaction time of the customer to technical–commercial and legal questions of the shipyard’s teams—the customer’s ”response time“ within the process) to achieve the possible project realisation at least close to the client’s desired deadline for the ship’s delivery. If the customer should significantly step out of the approximately defined dynamics of interacting with the shipyard’s teams, the new dates to realise higher sales process phases will depend on the engagement possibilities of the shipyard’s employees in the involved sectors/departments on the relevant project and according to their availability concerning other actual projects, i.e., customers.
A big contribution to the reduction in losses and shortening the duration of the activities which do not create added value in the contracting phase is performed by naming the manager of the relevant project, knowing that they are in charge of monitoring the compatibility of the activities performance dynamic with approximately defined dates to realise the key points of the phase (process “follow up“) by managing the cross-teams communication in a way that the same is kept within the assigned time intervals (optimal “response time“ of the shipyard as well as the customer to their mutual questions regarding, for example, the initial design and optimisation of the ship, defining the ship’s price, Shipbuilding contract revisions, etc.).
In addition to the Inquiry selection phase, introducing the improvements has a neutral effect on the average costs of the sales process phases.
A significant decrease in the average number of phase interactions regarding the “shipyard–customer” (
Table A10) is primarily achieved by rigorous inquiry selection, and in later phases by all other process improvement measures, with an emphasis on efficacy selection of the Potential Clients by introducing the additional requirements for the customer in the Preliminary offer. The reduction mentioned above in the average number of phase interactions with the customers, significant reduction of the losses is achieved in the sales process and concerning working hours spent, and the representation and travel expenditures for the inquiries, i.e., customers of the lower and low potential of conversion to the next, higher process phases, which in the end results in a decrease in the average annual cost of the sales process according to the facts presented in the next section. Implementing the improvement measures for the sales process results in a nearly 38% decrease in the average number of employees necessary annually to perform the sales activities. The average number of employees in departments/sectors engaged in the sales process after improving the same is shown in
Table 3.
7. Theoretical Results
Introducing improvement measures within the sales process, and with the primarily realised decrease in the average number of phase interactions, has relieved the employees engaged in the sales process of the most common comparative analysis of too many customers by, therefore, providing them with the possibility of a quality “follow-up“ of high-prospect ones, with an emphasis on the faster recognition of the customers’ representatives who have the decision-making power and an on-time “response time“ in communicating with the same, which has resulted in a far better, i.e., higher rate of contact conversion into clients and eventually into shipowners. As shown in
Table 4, besides the conversion rate of the Contacts into the Potential Client, which, as the consequence of the rigorous inquiry selection, has decreased by 62% compared to the sales process state before introducing improvement measures, all other conversion indicators have improved significantly, i.e., the conversion rate of the Potential Client into the Apparent Client has increased by 33%, of the Apparent Client into the Client by 25%, and eventually the Customer into the Shipowner by a high 106%.
Better identifying those customers that should be focused on and communicated with was achieved by better understanding the customer’s requests in the project, more efficient team cooperation when defining the contractual technical documentation, and generally improving the parameters of the ship in its initial design/development phase, which at the end of the process results in the high added value for the customer, i.e., with a project/ship of optimal feasibility. At the same time, by decreasing the average number of phase interactions with customers, the sales process is shortened, i.e., the average duration of each sales process is decreased by 15 days. In such an improved state, the individual process, from receiving the inquiry to realising the shipbuilding contract, is performed during an average of 7.5 months, while during one realised shipbuilding contract, the average sales process duration after introducing improvement measures decreases by 60%. The achievements in decreasing the average time of the sales process, i.e., the activities which do not create the added value and those which do after improvements are implemented, are shown in
Table 5, whereby the number of phase interactions per realised shipbuilding contract (PI
S) equals the average yearly number of phase interactions divided by the average number of realised shipbuilding contracts (2.33 in the existing state and 3 in the future one, annually).
Furthermore, improving the shipbuilding sales process using Value Stream Mapping as the chosen Lean tool has created a decrease in the average annual sales process cost by 38%, with the simultaneous higher number of realised shipbuilding contracts (average of 3 per year) in comparison to the one assigned by the plan (2.7 per year). Comparing the average annual cost of the sales process before and after implementing improvements is shown in
Table 6.
To emphasise, by improving the sales process, the average annual cost of the same was 17% lower than the one assigned by the expenditure plan, defined for the observed financial year—the one during which the improvements of the sales process were introduced.
In conclusion, the most noted result of process improvement is seen in the average number of contracted production man-hours per year, which stands for almost 30% growth in realising sales in comparison to the average number of production hours contracted before implementing the improvement measures within the sales process. Knowing that work has an almost 30% share within the ship’s price, better sales realisation (average of 3 contracts per year, in comparison to the previous 2.33 before implementing the improvement measures into the sales process) has raised the annual revenue of the shipyard by 20%, i.e., nearly EUR 140,000,000 in comparison to EUR 116,500,000 realised before the improvement measures were introduced. Consequently, the average annual cost of the sales process has significantly decreased (EUR 1,930,840, as shown in
Table 6,) in the total annual revenue of the shipyard (EUR 140,000,000, in conditions of the improved state of the process) from 2.7% to only 1.4%.
The shortage in the annual production capacity (for the difference between available capacity sufficient for construction of around 2.5 newbuilds, and required one for realisation of 3 newbuilds on average, contracted in the improved state of the sales process), the shipyard may substitute by employing or subcontracting additional workers of the required specialties.
8. Pilot Project and Discussion
An experimental application of the measures for improving the shipbuilding sales process begins in the Preliminary offer preparation phase by indicating the preliminary price of the Initial design and the payment method of the same. By accepting a Preliminary offer supplemented in this way by the Potential Client, which is the main prerequisite for signing the LOI, the conversion rate C2 has increased by 103% compared to the existing sales process in the observed six-month period, which is three times more than expected from the theoretical model of implementing the improvement measures. Namely, in the observed six-month period, the relevant improvement measure was implemented to all 12 Potential Clients (2. sales process phase—Preliminary offer preparation phase) from the market niches and according to the following:
4 mega-yachts, average project value above EUR 100 mil;
2 series of naval vessel newbuilds, an average project value above EUR 100 mil;
4 cruise ships, average project value above EUR 300 mil;
2 ferries, average project value above EUR 50 mil
Seven of the abovementioned Potential Clients have accepted the obligation to pay the cost of preparing the Initial design, i.e., contractual technical documentation, as a new prerequisite for signing the LOI and paying the same during or after the last phase of the sales process—the contracting phase. Before introducing the relevant improvement measure, the costs of providing services by the Initial Design Department, as an integral part of the Sales and Marketing Sector, have been calculated in full as the expenditure within the planned (annual) cost of the shipbuilding sales process. As the eighth Apparent Client, one of the buyers of the cruise ships has been accepted, recognised as the strategic one, with the potential of constructing one more ship from the serial.
Furthermore, within the previous six months, the measure of entitling the project manager is implemented for four Clients (all from the mega-yachts niche). The Project Management Office has nominated one project manager for two projects. In three projects, during their contracting phase, a significant reduction in the duration of activities that do not create additional value was noticed thanks to the continuous monitoring of how the communication is led, especially the communication among the commercial–technical and legal teams of the Clients and shipyard, i.e., thanks to maintaining the dynamics according to the planned time for realising the key points of the relevant phase. By reducing the waiting time within the internal communication, and especially within the communication with the Clients’ teams, the duration of the contracting phase time is reduced by 10 to 30 days in relation to the shipbuilding sales process state before implementing relevant improvement measure. Yet, the duration time of the contracting phase related to the fourth mega-yacht project is prolonged significantly due to the great increase of waiting time in external communication, exclusively due to the inadequate “response-time” by the commercial-technical Client’s teams, and by nearly 50 days in relation to the theoretical model of the future process state.
This research needs to be continued with the periodical analyses of realised improvements in the sales process according to further dynamics and the schedule of implementing suggested measures of the improvements into the process, along with the verification of the theoretical results of improvement. By continuously comparing the shipbuilding sales process improvements resulting from the experiment with the value stream of the theoretical model of the future state, the reflection possibilities on new measures for the process improvement are enlarged, with the continuous increase of added value for the buyer accordingly.
Results achieved, as well as the future improvement results, can additionally be improved by introducing the Kaizen Lean tool in a way that the shipyard employees should be encouraged, especially those involved in the sales process, including them in “workshops” to make them continuously think about further measures of improvement to result in the additional cost reduction in the process.
Regarding the extreme contribution of the Initial Design Department’s activities in creating the added value and optimisation of the ship, it is suggested that the future research topic analyses the justification of the business strategy of integrating initial design activities (Initial or Conceptual design) into the business system of the shipyard in relation to the approach of engaging the “outsourced” design offices to perform the same. Indeed the analysis calls for a distinction of a prototype shipyard or shipyards for smaller serials, such as European ones, from those oriented to larger series of new constructions (such as Asian shipyards), regarding the differences in the requirements for the Initial design.
Furthermore, it is necessary to presume that the conversion rates, as part of the Lean metrics defined by this paper, are not key performance indicators applicable for the shipyards of larger series of new constructions. Therefore, all stated here has to be analysed additionally. If the presumptions appear to be correct, research must be performed on the possibility of adjusting the relevant performance indicators to such systems or the need to define the alternative ones.
9. Conclusions
Under conditions of the actual customers’ requirements in the international shipbuilding market for energy-efficient and ecologically acceptable vessels, shipbuilders need to implement the digital transformation from traditional into “smart” and eventually into “green”, At the same time, according to the European Commission strategies adopted (“European Green Deal”, then attached to it “A New Industrial Strategy for Europe”, and others) on achieving climate neutrality by 2050 at the latest, European shipyards aim to adopt the applicable Industry 4.0 doctrines and technologies also from that aspect, therefore realising the prerequisites for sustainable growth and development of their business systems. Implementing the Lean method for managing business processes is generally the basic prerequisite to approach the shipyard’s digital transformation to maintain, i.e., to enlarge the competitiveness, and grow its value.
The authors of this paper recognise the (sub)process of sales and its flow of value, i.e., information in the process of realising shipbuilding projects in the studied European shipyard as the basis for structuring the assumptions of the overall improvement of business results, from the growth of employment and profitability to increasing client satisfaction and employee motivation.
Therefore, Lean transformation of the studied shipyard starts from the shipyard’s Sales and Marketing Sector, as the leading functional units of the sales process, whereas Value Stream Mapping (VMS) has been chosen as the Lean tool for identifying and decreasing/removing the losses from the process. After analysing the current sales process, the value it creates was confirmed and the applicable key performance indicators were defined. The shipbuilding contract for the vessel additionally improved in parameters compared to the initial requirements of the customer.
After mapping the existing state of the sales process and analysing the value stream through its four phases—from the selection of the inquiry, preparation of the Preliminary offer, then defining the Letter of Intent, and finally, the contracting phase—the key shortcomings were identified as (i) an extremely lengthy sales process, (ii) smaller number of realised shipbuilding contracts compared to the one defined by the business plan, (iii) higher average yearly expenditures of the shipbuilding sales process than planned, and (iv) all as the consequence of a large number of simultaneous interactions with customers as they were not properly selected during the sales process interphases. In accordance with what was seen, the improvement measures were defined, primarily in order to decrease the number of phase interactions between shipyard employees involved in the sales process with customers. Improvements in the sales processes were planned to be achieved, among other things, by (i) hiring a renowned international consulting firm specialised in the maritime sector in order to better understand the situation of certain market niches, (ii) adding a legal specialist in the Sales and Marketing Sector as permanently employed staff, (iii) requiring customers to follow the deadlines for realising the sales process phases as well as for covering the expenses of the initial design, all as the prerequisite for signing the Letter of Intent, and (iv) appointing a project manager by the shipyard already in the contracting phase. According to the same, a diagram was created of the future state of the theoretical model of shipbuilding sales process. The value stream of the improved state resulted in a more than significant sales process improvement, measured as follows:
Shortening the average duration of the sales process of one realised shipbuilding contract by 60%;
Decreasing the average annual cost of the sales process by 38%;
Increasing annual sales by almost 30%, followed by an increase in the productivity of employees involved in the sales process by a high 93%.
Implementing the improvement measures significantly decreases the average number of sales employees needed—from the current 37 to 23 annually. Eventually, the improved state of the sales process results in a 20% increase in the average annual turnover of the shipyard compared to its realisation in the current state.
The authors of this paper foresee further opportunities to improve the shipbuilding sales process, not only by continuously monitoring it by implementing the VSM tool, but also by presenting the Kaizen Lean tool to shipyard employees, i.e., the philosophy of its contribution to achieving (further) savings in the process.


