1. Introduction
Today, power supply systems use many power transformers, which are the key energy system components designed to increase or decrease voltage [
1]. Notwithstanding the fact that most power transformers are highly reliable, failures occur during their operation, which is undesirable and unacceptable for a power system. Such failures can also entail significant financial costs, exacerbation of safety issues, and unexpected interruptions in power supply to consumers. Therefore, early fault diagnostics and detection in power transformers, largely determining the reliability of the entire power system, while costing more than all other power grid equipment, require closer attention [
2,
3,
4,
5]. Generally, diagnostics costs are much less than repair costs, especially in the case of accidents.
Thus, identifying near-misses is an important and urgent problem. The diagnostics of power transformers and their operating modes not only reduce repair costs, but also prevent many process incidents [
6,
7,
8]. Therefore, the major diagnostic aim is defining the possibility of further safe operation of the equipment.
Most power transformers are designed as oil-filled to improve their efficiency. The oil, therefore, acts as an arc-quenching, cooling, and insulating medium. Obviously, the reliability and durability of such a transformer directly depend on the oil condition, the electrophysical parameters of which deteriorate during operation because of moisture and thermal oxidative aging, since electrical, magnetic, and thermal loads continuously impact the oil in the transformer operation [
9,
10,
11,
12]. Thus, the most common dielectric in the energy sector–oil—is believed to conditionally report about 70% of information on the state of oil-filled equipment, including power transformers [
13].
Therefore, reducing the likelihood of transformer failure with further emergency power outages requires continuous online oil diagnostics, i.e., developing measures for the timely monitoring of the oil properties directly in operating modes [
14,
15].
Currently, the most informative and frequently used techniques for early diagnostics of developing failures are as follows: 1: recording partial discharges (PD) in oil–paper insulation; and 2: physicochemical analysis of insulating liquids and gases. Obviously, both discharges in the gas inclusions of transformer oil and PDs in it cause oil decomposition, with the release of corresponding gaseous decomposition products. The degree of electrical equipment wear during its operation can actually be understood by the PD intensity, and various developing faults can be estimated by the gas concentration and its increase rate [
16,
17,
18,
19]. A detailed review of various applied offline and online transformer oil monitoring techniques is given in [
16]. Many publications on the topic have been analyzed; the advantages and disadvantages of various techniques have been shown. Pandey et al. [
17] provide an overview of basic techniques used for the online monitoring of oil quality in the operating transformer by the amount of gas dissolved inside. Conventional and new techniques for detecting faults were comparatively analyzed, which allows for the selection of the most effective way to diagnose dissolved gas in specific fault cases. Karandaeva et al. [
18] consider the causes of PDs and their impact on the insulation conditions, and propose a real-time monitoring system using a generalized insulation condition and fault localization criterion containing an additional parameter of partial discharge intensity (PDI), characterizing the PD power and intensity. The proposed technique uses statistical toolkits available for PC. Thus, the analysis of these studies shows that known methods for the conventional transformer oil quality diagnostics have certain drawbacks, which requires developing new promising approaches to this problem-solving. Laskar et al. [
19] propose to monitor humidity using a fiber optic sensor, and Khramshin et al. [
20,
21] study the specifics of transformer operating modes to be considered when justifying the diagnostic functions of the transformer technical condition continuous monitoring system, and describe the Minitrans diagnostic complex, which allows for the monitoring of the gas and moisture content in transformer oil.
Along with conventional techniques, there are other modern ways to monitor transformer oils: physicochemical diagnostics, liquid and gas chromatography, heat monitoring (infrared thermography), optical techniques (ultraviolet–visible, infrared, and NMR spectroscopy), thermal analysis, etc. [
22,
23,
24,
25,
26,
27]. Taib et al. [
22] show the possibility of identifying power transformer faults by the extended use of polarization and depolarization current measurements, conducted on an oil sample of the operating power transformer. For each specific condition, the authors propose introducing a corresponding unique dimensionless value of a depolarization factor that allows defining the fault type. Kang et al. [
23] describe a new way to diagnose the aging of mineral insulating oils by measuring their complex optical and dielectric properties using terahertz spectroscopy.
Kalathiripi et al. [
24] review the latest developments in the field of diagnosing the transformer oil quality by colorimetry, which allows for the monitoring of the oil contamination, degradation, or oxidation. Transformer oil monitoring systems based on the optical techniques such as UV–visible spectroscopy, Fourier-transform IR spectroscopy, and nuclear magnetic resonance (NMR) spectroscopy are described. Degeratu et al. [
25] study various thermal and spectroscopic oil quality control systems, and Khramshin et al. [
26] consider smart systems for the multiparameter diagnostics of the HV transformer equipment technical state by the oil condition. Kinkeldey et al. [
27] propose a procedure for estimating the oil transformer aging by oil parameters using a new fuzzy logic algorithm. It is shown that, if required, the oil can be restored or replaced, while paper insulation, the key factor for determining the transformer aging, is irreplaceable. Thus, to estimate quality, a paper sample should be taken from the transformer. Therefore, the proposed algorithm uses fuzzy sets of oil parameters (acidity, interfacial tension, carbon dioxide and monoxide, breakdown voltage) to define the paper insulation polymerization degree.
An analysis of the considered ways to monitor aging transformer oils shows that each of them has certain shortcomings, the majority of which are the following: need for additional complex equipment, analysis duration, need for special chemical compounds, possibility of laboratory monitoring only, etc.
Thus, despite quite a large number of different monitoring systems, improving existing techniques for diagnosing the transformer oil properties, and developing new ones, are of a particular relevance. Obviously, the reliability of diagnosing the high-voltage oil-filled electrical equipment conditions depends on the appropriate technique selected. Therefore,, diagnostic techniques for the monitoring of current equipment state onsite under operating voltage and, preferably, normal operation, come to the fore.
2. Developing a New Technique for Oil Properties’ Diagnostics
It is known that the transformer oil quality is largely determined by moisture content, so this information is the most relevant for the transformer condition diagnostics. To solve this problem, a new diagnostic technique is proposed, forming the basis for the transformer condition monitoring system. It is based on forming an additional high-frequency measuring loop using a constructive parasitic capacitance between the first inner row of LV winding and the core surface as a measuring capacitor cell, along with the existing low-frequency operating power loop. In this case, high-frequency low-voltage is used as a data signal carrier. A review of the scientific, technical, and patent literature shows that it is the first time such an approach is used to solve the problem set.
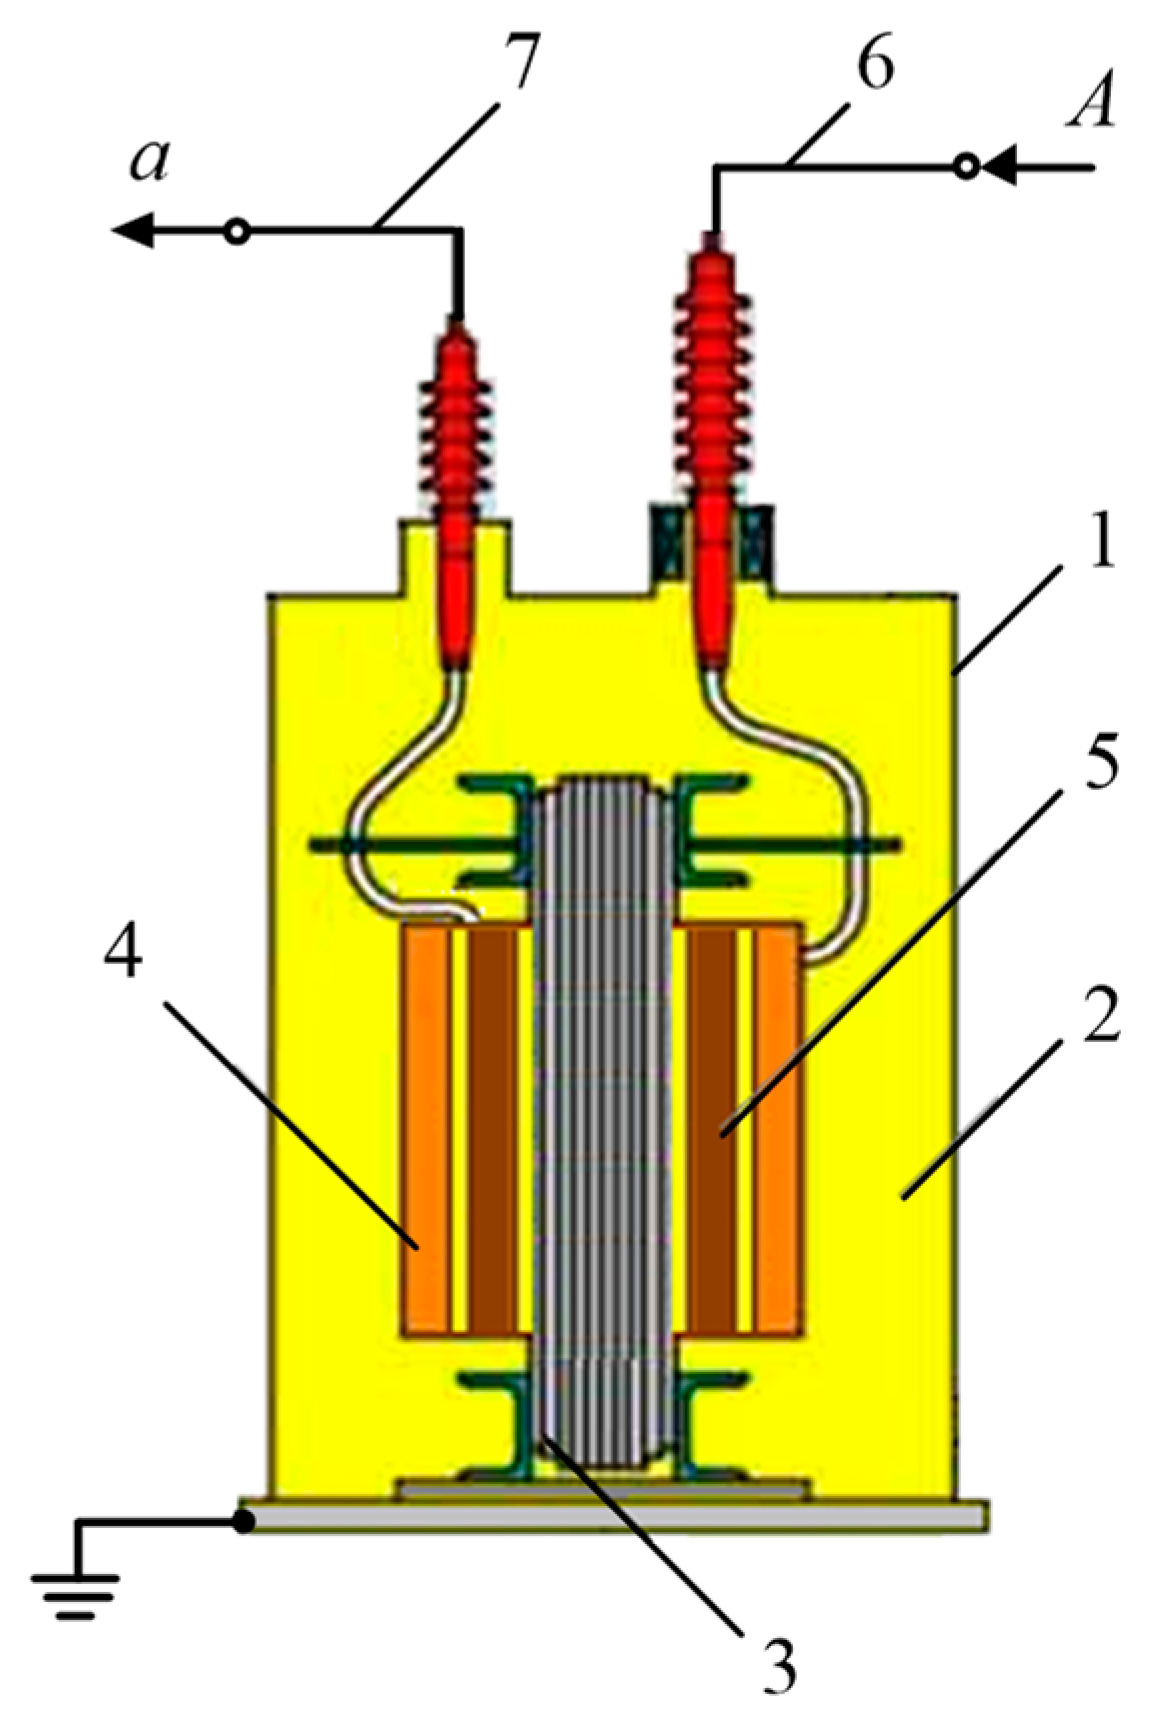
As a diagnosed object, consider a typical oil-filled transformer consisting of the following key components (
Figure 1): 1—power transformer tank; 2—transformer oil; 3—core; 4—high-voltage (HV) winding; 5—low-voltage (LV) winding; 6—HV winding end (A); 7—LV winding end (a).
An analysis of the oil-filled transformer design facilitated the development of a new approach to the monitoring of the transformer gas–liquid component state, which indirectly characterizes the physical degradation of this component.
The proposed technical solution implies the formation of an additional high-frequency measuring loop that uses a stray parasitic capacitance as a measuring capacitor cell (MCC), along with the existing low-frequency working power loop. In this case, high-frequency low–voltage serves as a data signal carrier.
To eliminate the cross-impact of low-frequency high-voltage and high-frequency low-voltage circuits, the pilot high-frequency low–voltage is excited by a special coupling capacitor, with an output to the power feeder through an appropriate low-frequency choke [
17,
20].
Figure 2 shows the flowchart of the proposed system for monitoring the transformer components’ parameters.
This flowchart comprises the following functional elements: 1—power transformer tank; 2—transformer oil; 3—core; 4—high-voltage (HV) winding; 5—low-voltage (LV) winding; 6—HV winding end; 7—LV winding end; 8—insulated cylindrical metal electrode with an inner coaxial LV winding end; 9—high-frequency sinusoidal low-voltage generator; 10—metering device; L—low-pass filter inductance; A—HV phase; a—LV phase.
Thus, the proposed technical control solution has the following benefits: (1) the oil can be diagnosed directly in real-time during operation under load; (2) several typical insulating oil parameters can be defined; (3) an LV HF sinusoidal voltage can be easily included in the HV LF power circuit; and (4) the transformer components can be used as the measuring system elements.
The last two features significantly simplify the entire measuring system for monitoring oil parameters inside the transformer tank.
The proposed technique also has certain drawbacks: 1: each control object requires the system operating modes to be individually adjusted while functional measuring modules are appropriately calibrated; and 2: the proposed monitoring system is focused on the design features of oil-filled transformers with the LV winding placed inside the HV one, which, in a certain sense, limits the applications of the monitoring system considered.
3. Analyzing Basic Physical Processes
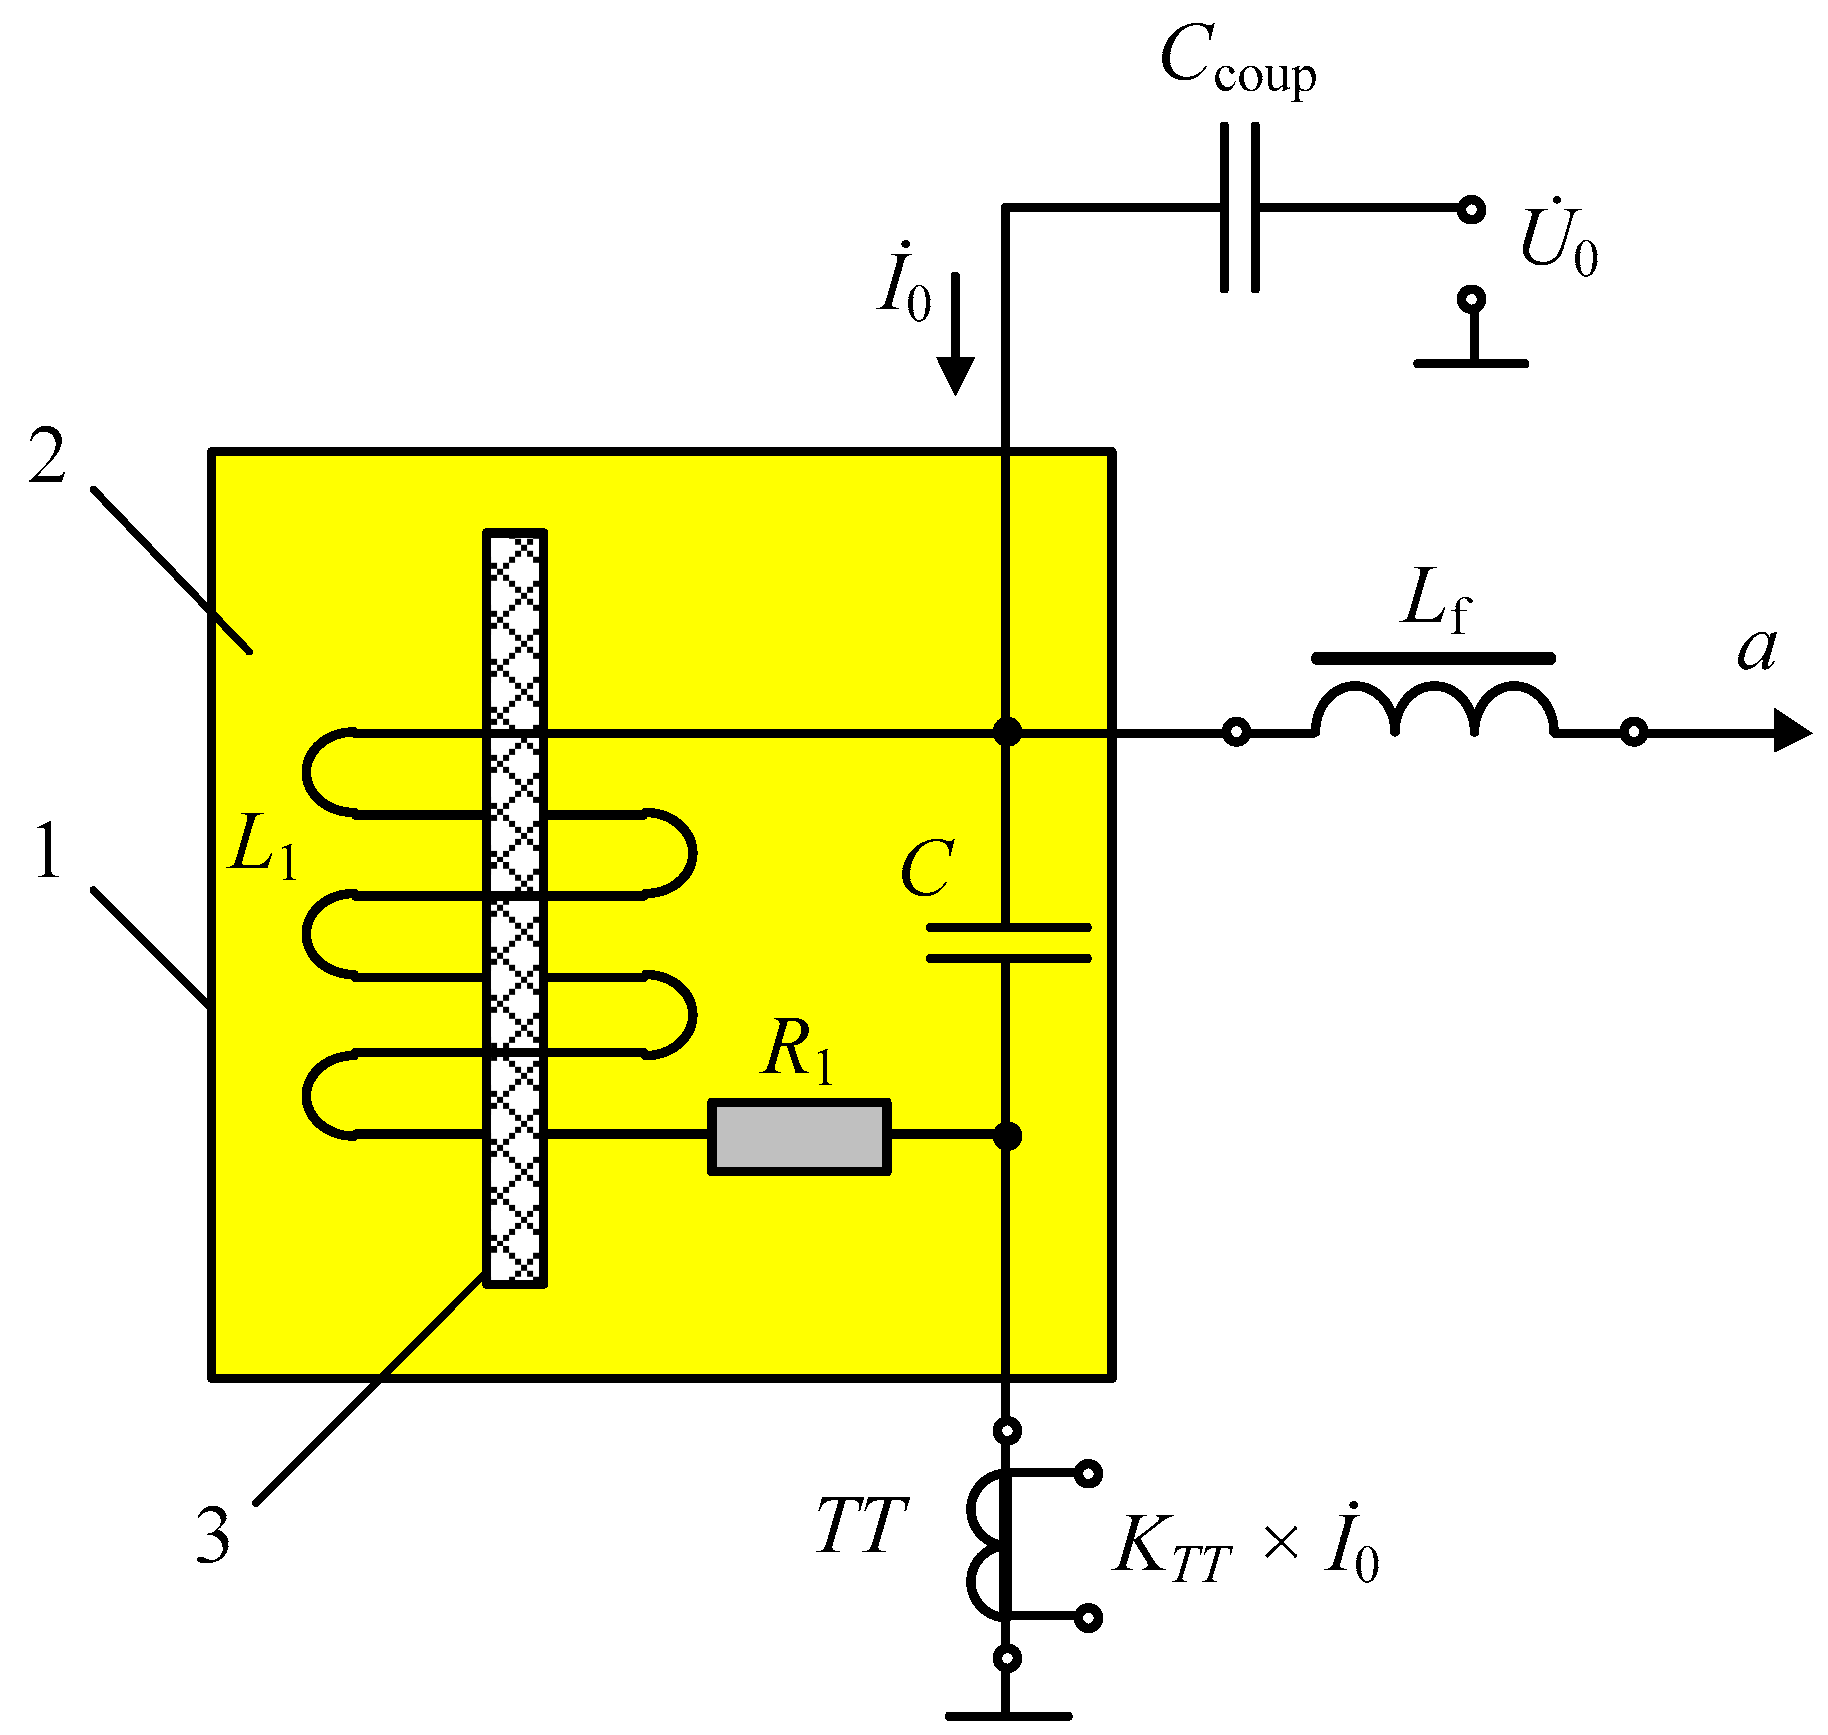
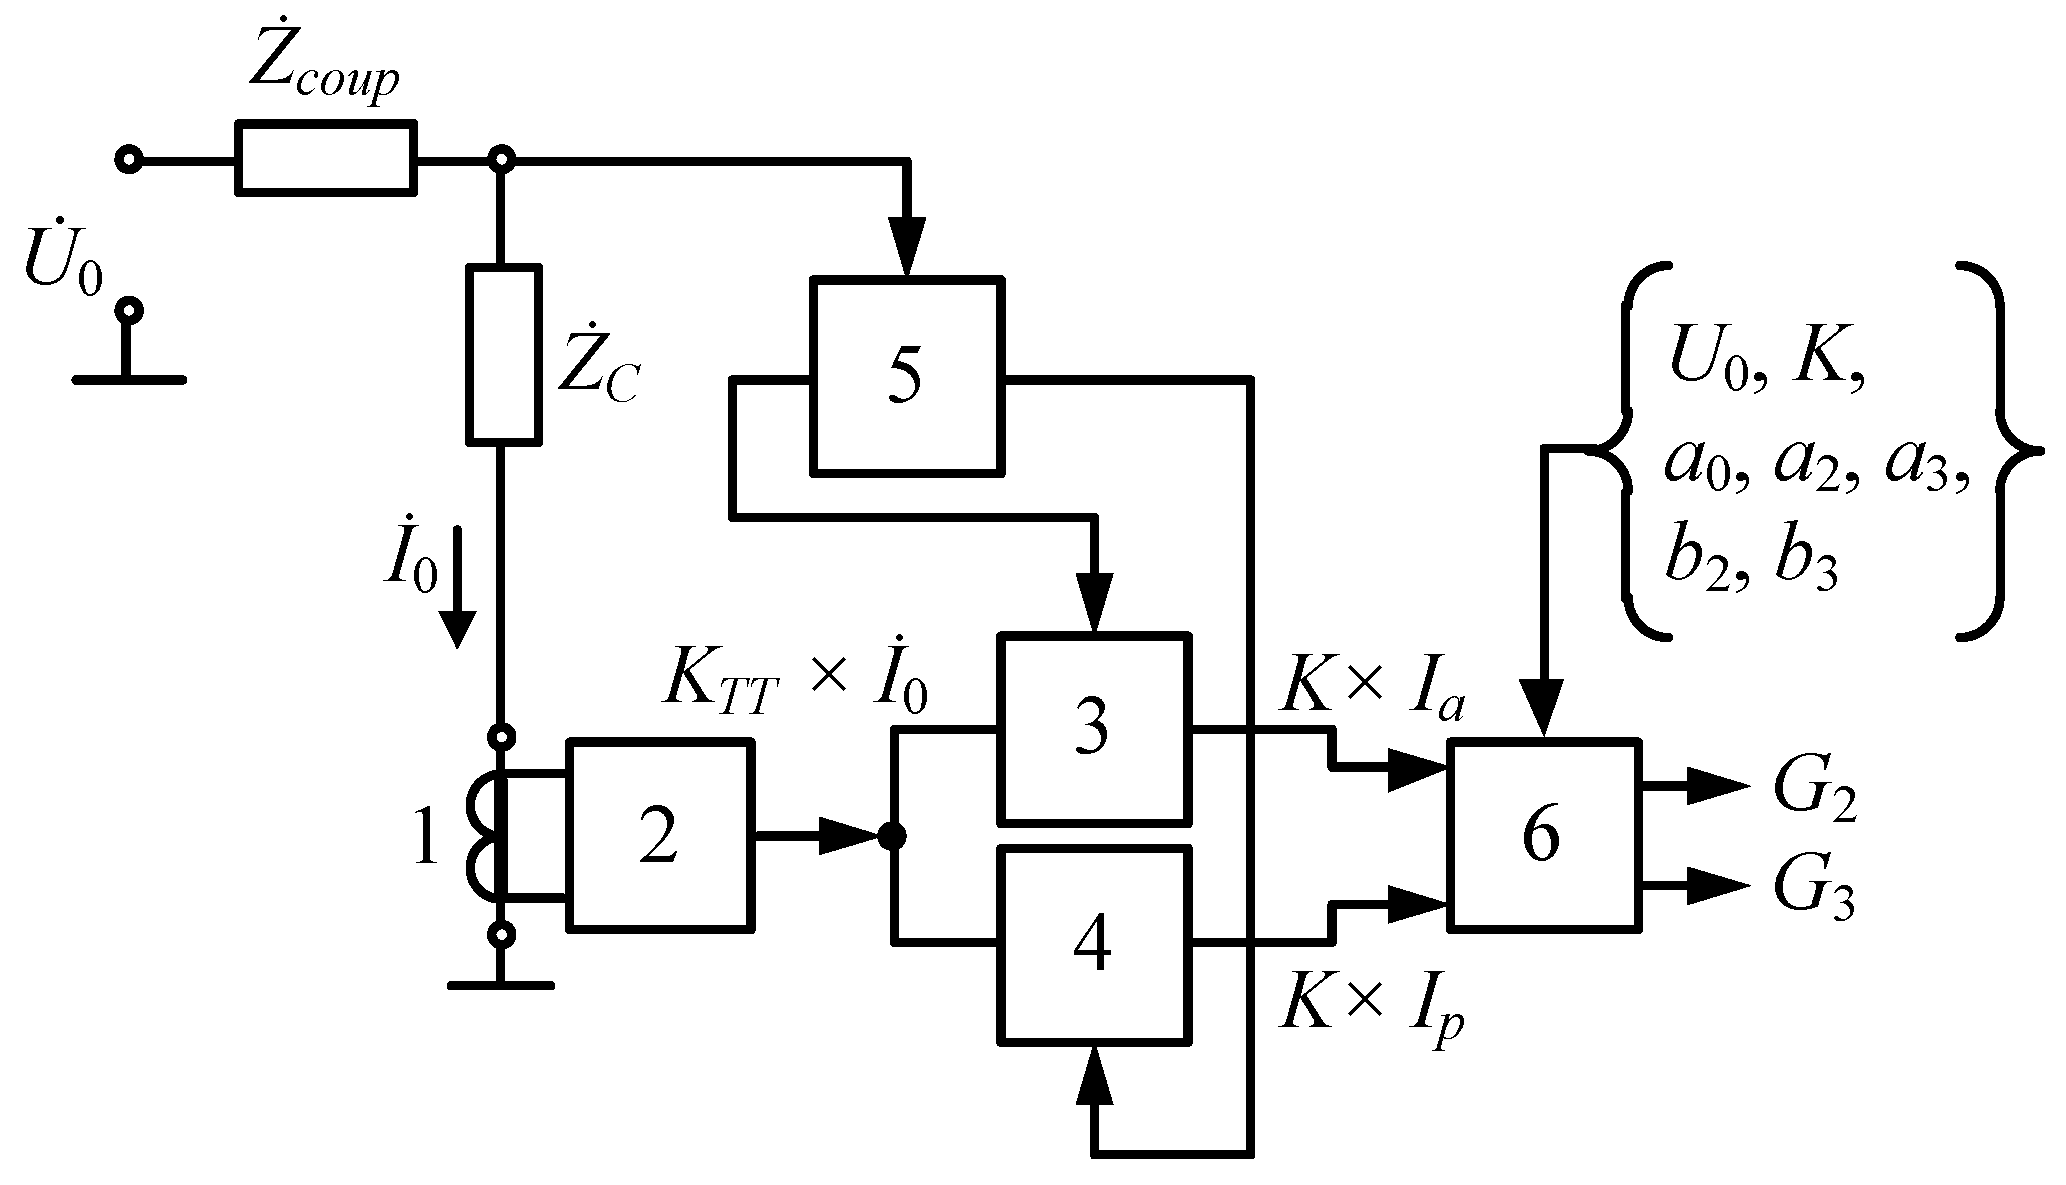
To analyze the basic physical processes occurring in the transformer components in more detail, an equivalent circuit of an additional high-frequency measuring loop was built (
Figure 3).
The equivalent circuit of an additional high-frequency measuring loop, shown in
Figure 3, comprises the following components:
Ccoup—coupling capacitor formed by a cylindrical metal electrode and an inner coaxial winding end;
Lf—the low-pass filter inductance (LF choke);
—LV winding HF excitation voltages;
—LV winding HF current;
TT—measuring current transformer;
KTT—
TT conversion rate; 1—a conditional elementary oil-filled transformer cell containing a core 2 and the LV winding active resistance
R1 and inductance
L1, as well as an MCC formed by a stray capacitance
C between the LV winding’s first inner row and the core surface.
To analyze physical processes in the circuit considered, assume that the LV winding and its core are cylindrical (
Figure 4), and the LV winding’s complex resistance
where
is the MCC complex resistance; and
is the LV winding’s excitation voltage high cyclic frequency.
The assumptions made allow for the conclusion that , i.e., the LV winding’s HF current is actually determined by the parameters of the MCC with an impedance .
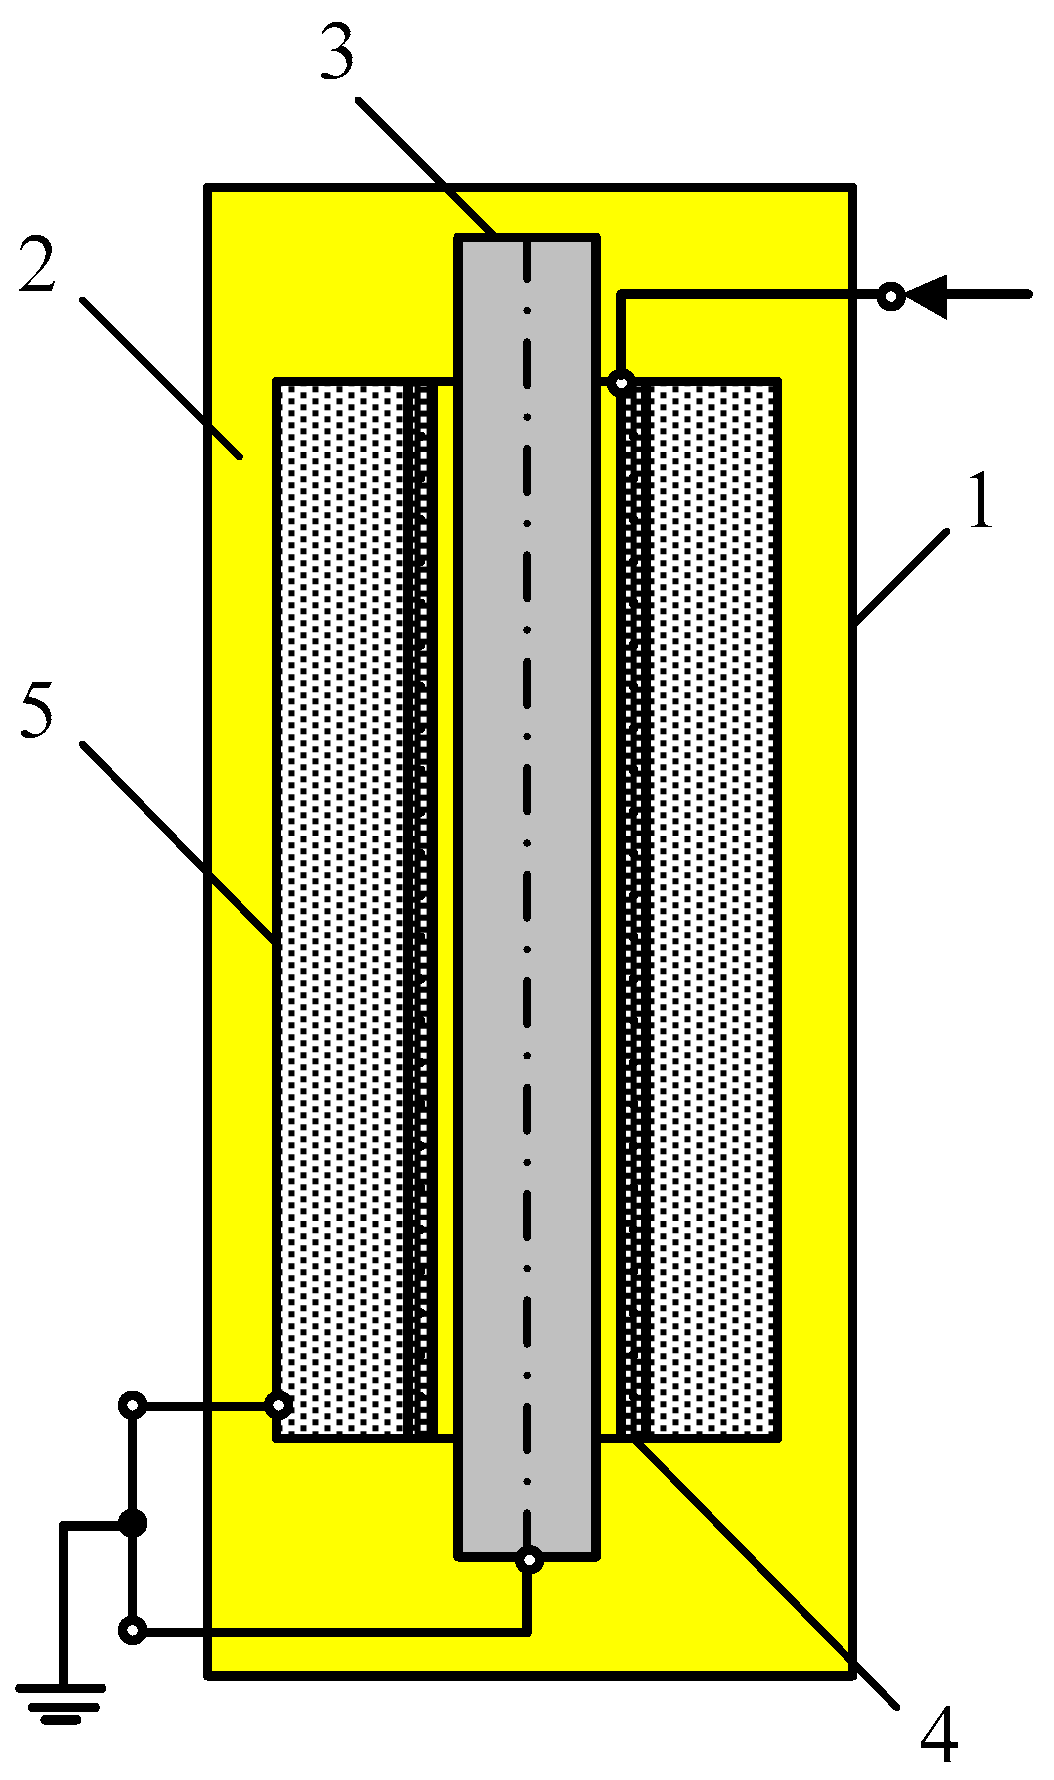
Figure 4 shows the MCC design: 1—the MCC conditional tank; 2—the gas–liquid component; 3—metal core; 4—the LV winding’s first inner row; 5—LV windings.
In this case, the object monitored is a heterogeneous dissipative system with a variable physicochemical structure, filling the MCC conditional tank [
23,
26]. Such a type of dielcometric measuring capacitor cell is intended to monitor the composition and properties of filling substances. Its operating principle is based on the dependence between the physico–technological parameters of these substances and the measuring cell capacity.
With the aforementioned in mind, consider a simplified MCC model as a single measuring two-electrode cylindrical capacitor with an unfilled interelectrode space (an air dielectric), whose electrodes are two coaxial cylinders with an axial length
l (m), and conditional radii of the inner and outer electrodes
ri and
ri+1 (m), respectively.
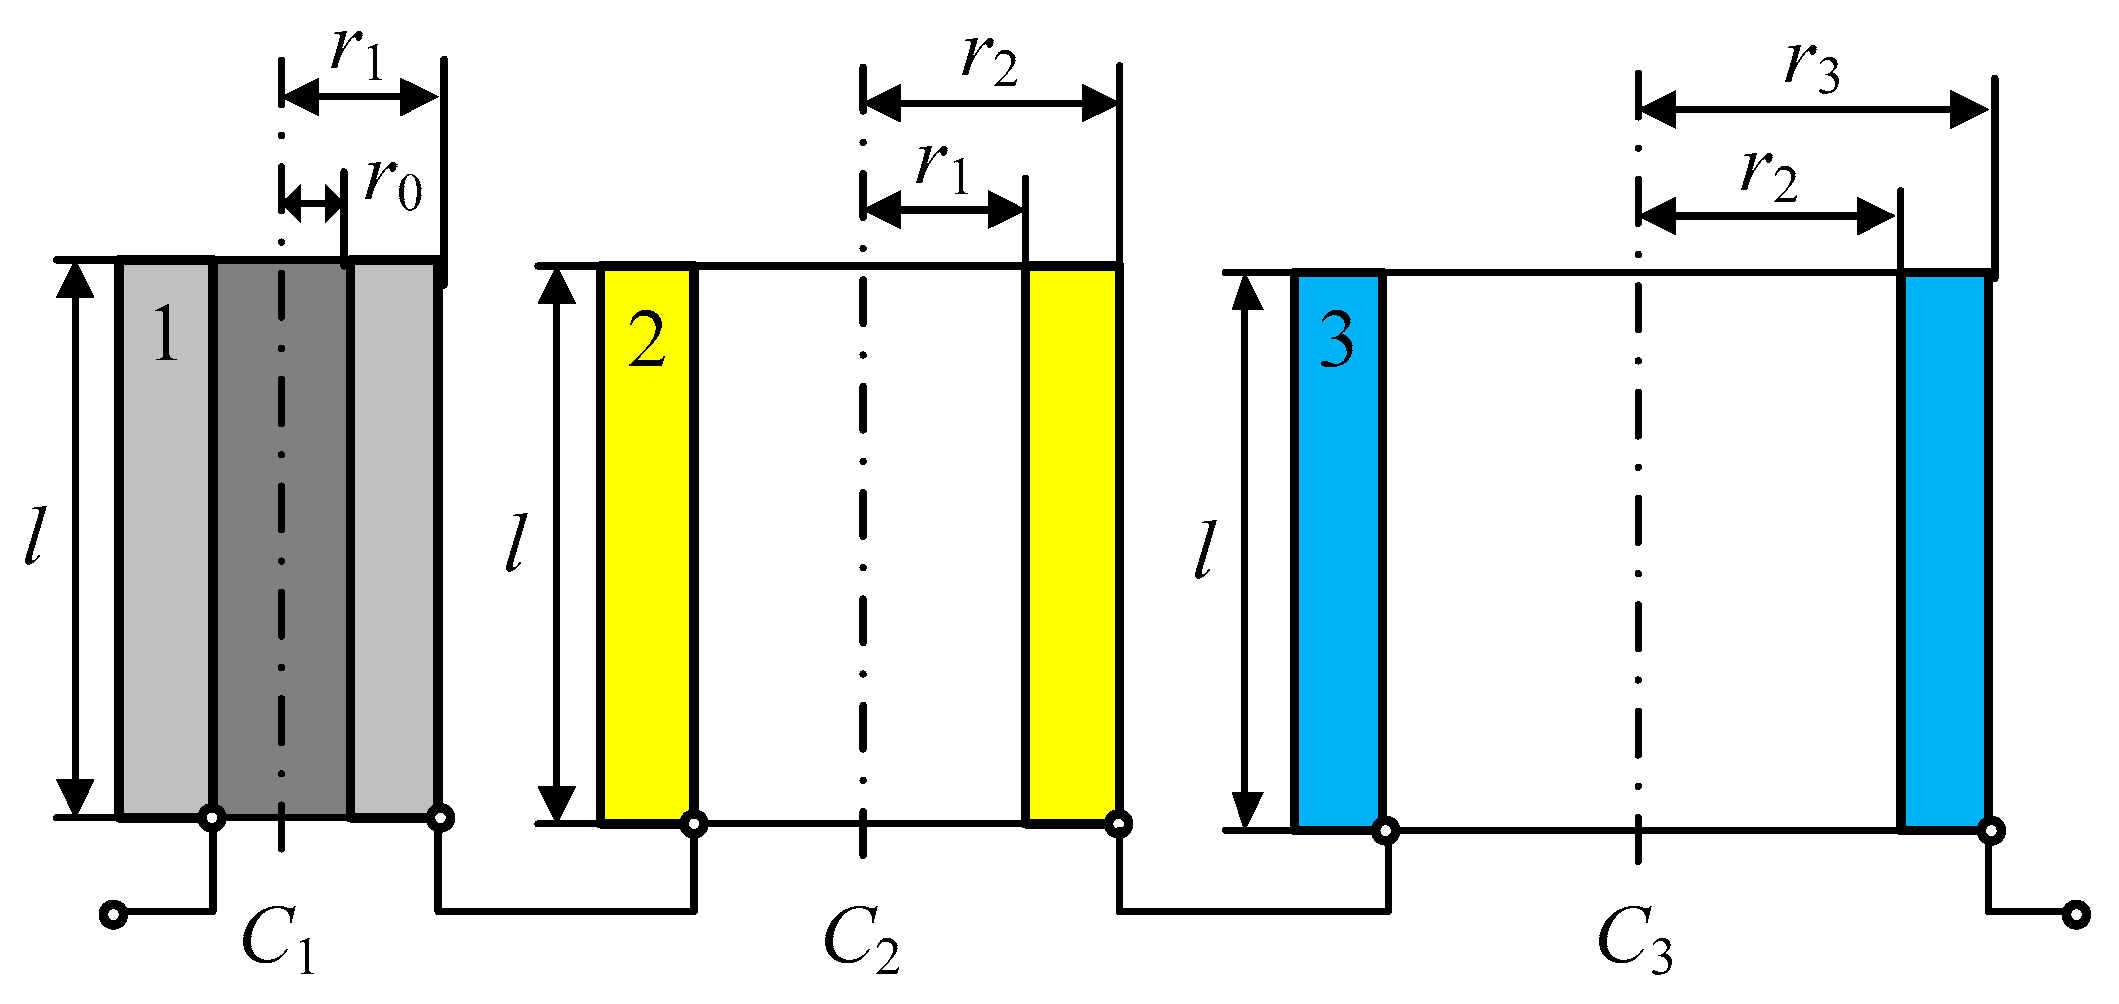
When an interelectrode space is filled with a heterogeneous dissipative system (a mix of air, transformer oil, and process water), the MCC model can, thus, be represented as three series-connected two-electrode cylindrical capacitors
C1,
C2, and
C3, with different dielectrics: 1—air; 2—transformer oil; 3—process water, respectively (
Figure 5).
In this case, the electrical capacitance of each aforementioned capacitor can be consequently expressed by the following equations:
where
r0 and
r1 are the radii of the
C1 air-filled capacitor’s inner and outer electrodes, respectively;
r2 is the radius of the
C2 transformer oil-filled capacitor’s outer electrode;
r3 is the radius of the
C3 process water-filled capacitor’s outer electrode;
ε1 is the air permittivity;
ε2 is the transformer oil permittivity; and
ε3 is the process water permittivity.
Determining the reciprocal of the MCC’s total capacitance:
Assume that d1 = (r1 − r0) is the thickness of the air layer in the transformer oil that is conditionally uniformly spread over the electrode surface; d2 = (r2 − r1) is the thickness of the transformer oil layer, conditionally uniformly spread over the electrode surface; d3 = (r3 − r2) is the thickness of the water layer in the transformer oil, conditionally uniformly spread over the electrode surface; and D = (d1 + d2 + d3) is the average gap between the LV winding first inner row and the core surface.
Further, considering that 0 <
ri+1/
ri ≤ 2, Equation (4) can be reduced to:
Determining the MCC total capacitance according to (5)
It is known that the volume resistance for a dielectric material in the interelectrode space of a cylindrical capacitor with coaxial electrodes is determined by the equation:
where
d is the layer thickness of the material in the cylindrical capacitor’s interelectrode space;
l is the axial length of the cylindrical capacitor electrodes; and
gv is the material specific volume resistance.
Considering Equation (7), Equation (6) can be rewritten in the form:
Determining the MCC impedance:
Representing the permittivity as a complex, according to the Debye theory:
where
is the real component of the complex permittivity characterizing the system polarity; and
is the imaginary component of the complex permittivity characterizing the electric field energy absorption by the system via various channels, including reach-through conductivity.
Considering (10), we can write Equation (9) as follows:
After a series of simple transformations, Equation (11) is easily transformed into:
where
,
,
,
and
—constant coefficients;
and
are the active and reactive components of the MCC impedance, respectively.
According to (12), building a system of linearly independent algebraic equations:
The solution to the system of Equation (13) is mathematically expressed as follows:
To determine the MCC conductivity:
where
and
are the MCC active and reactive conductivities, respectively.
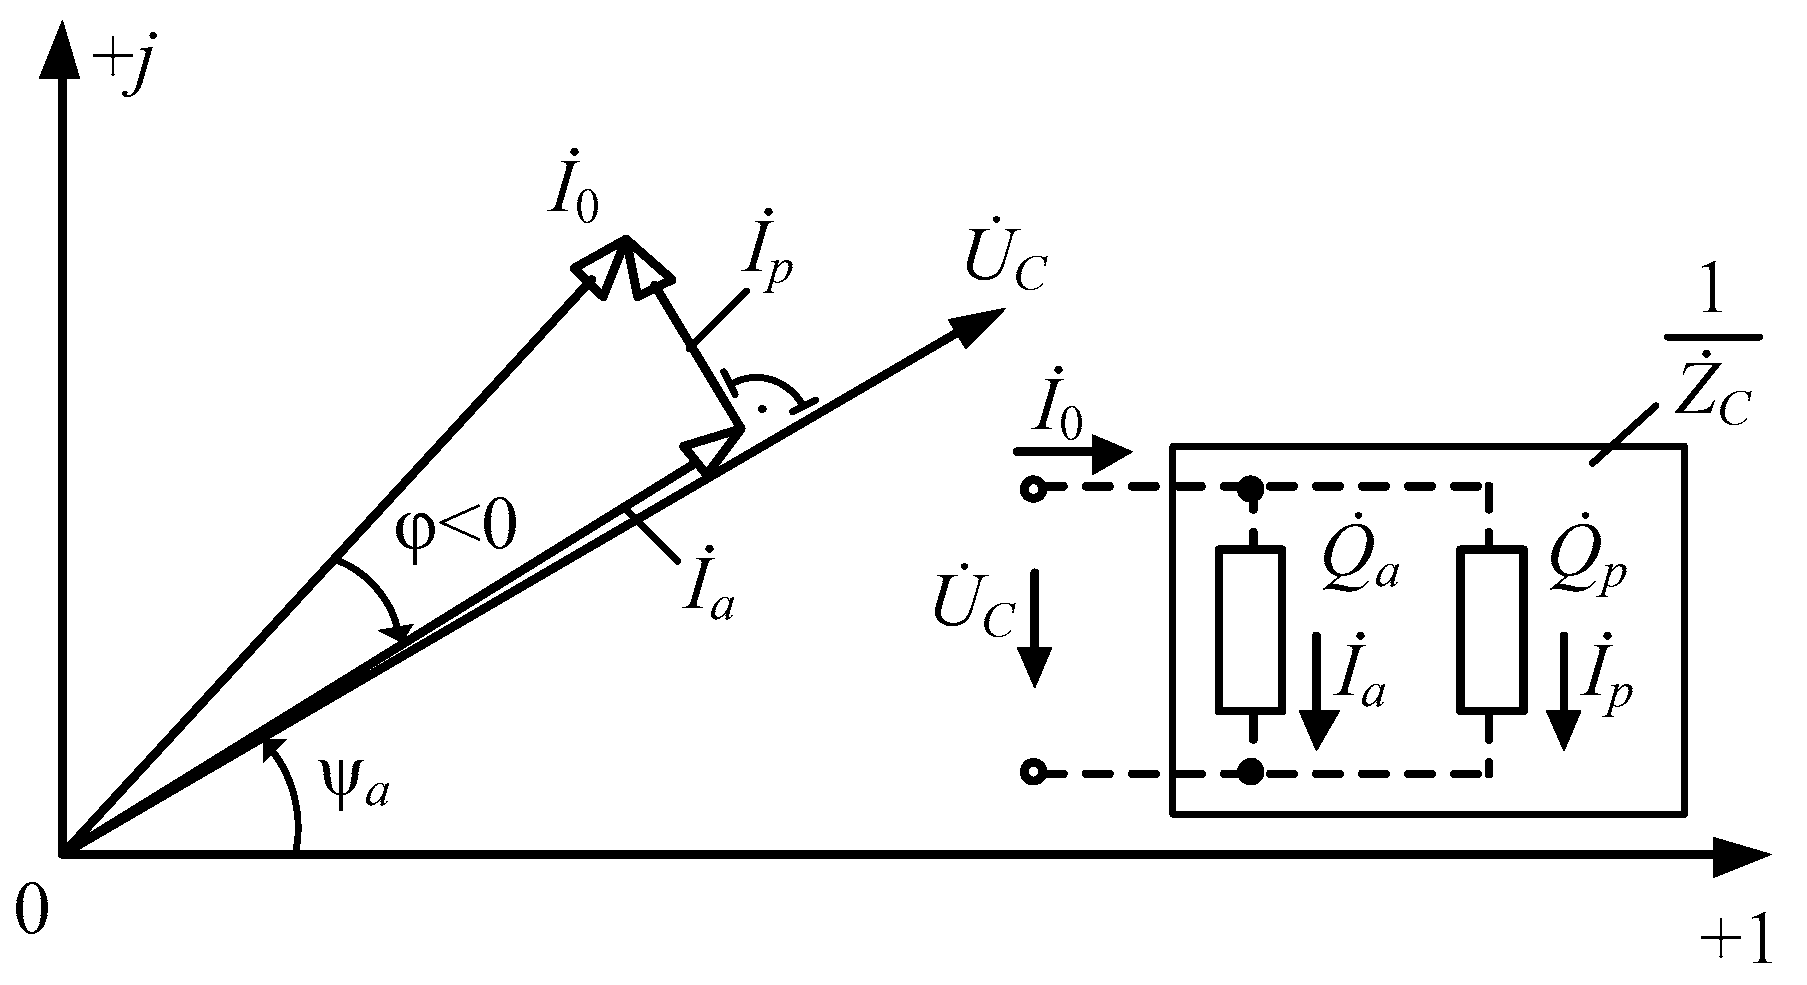
According to (15), the (passive two-pole) measuring capacitor cell
C can be represented as an equivalent circuit consisting of parallel active
and reactive
conductivity components, and the total electric current
in it can be expressed through its two active
and reactive
components (
Figure 6):
where
and
are, respectively, the active and reactive components of the circuit total HF electric current
; and
is the HF voltage applied to the MCC.
To simultaneously form scalar components from a vector quantity , proportional to its projections on the corresponding coordinate axes, or its phase relative to another vector quantity , the simplest quadrature functional converters are used—quadrature synchronous detectors (SD), with reference voltages shifted by π/2 in phase.
When aligning the
SDs’ reference voltage vectors with the coordinate axes on the complex plane
, the constant components of the circuit rectified electric current at the outputs of
SDs operating in key modes are defined as follows:
where
Ia and
Ip are the recorded effective values of the active and reactive components of the circuit’s total HF current
, respectively;
K =
KTT ×
KSD;
KTT, and
KSD are the
TT and quadrature
SD conversion rates, respectively; and
is the angle between the
SD’s input and reference voltages.
Based on (16) and (17), the effective values of active and reactive conductivities are defined, respectively, as:
Considering
, the effective values of the MCC impedance active and reactive components can be written, respectively, as:
After simple transformations of Equation (19), we eventually obtain:
Appropriately substituting (20) into (14), the volume resistance for transformer oil and technical water in the MCC interelectrode space is defined as:
Taking into account the MCC resonant excitation mode in the circuit considered, we can assume that UC = U0.
The analysis of algorithms for obtaining the current resistances (21) and (22) of transformer oil (TO) and process water (PW) allows the conclusion that the composition of the complex heterogeneous liquid mix in the power transformer tank can actually be monitored by forming an additional HF measuring loop (AHFML) in its operating electrical circuit.
If, due to the impact of various operational and time factors, the algorithmically determined values of the heterogeneous liquid mix component parameters exceed the corresponding reference limits, this indicates certain degradation processes occurring in the functional elements of that power equipment. Continuous monitoring of the specified oil parameters allows for the early diagnostics of destructive processes and thereby, a timely arrangement of appropriate measures to eliminate them, or replace the oil in the transformer tank [
17,
26].
5. Experimental Verification
The operability and efficiency of the proposed monitoring system were verified by the appropriate experimental studies, where a power transformer TM-25-6/0.4 filled with a liquid transformer oil TKp (TU 38.101890–81) was used as a monitored object, and moisture content in the transformer oil H was selected as the studied parameter. Experimental studies were performed at a constant ambient temperature (25 °C) and a transformer load current of 25 A in the transformer’s steady-state operating mode.
Note that for the moisture content in oil
H, a phenomenological dependence corresponding to the Equation (7) was used:
where
M3 and
M2 are the masses of process water and transformer oil, respectively.
Eight specially prepared oil–water liquid mix samples were used in the experimental studies, i.e., a kind of water-in-oil emulsion (w/o reverse type), where the dispersion medium and phase were, respectively, oil and water. For each sample, the weight fractions of the dispersion medium and phase were predetermined separately by gravity, i.e., weighing on electronic scales, with further preparation of the sample itself using a special emulsifier. In this case, it was assured that the required moisture content Hi was set, and subsequently defined using the proposed indirect HF impedance technique. After that, the prepared samples were placed in the transformer tank in a certain sequence.
The required data signals were registered by the AHFML, and algorithmically processed to determine the current moisture content as the corresponding measurement result. In other words, based on 10moisture content observation data for each sample (i = 1 ÷ 8—the sample number, j = 1 ÷ 10—the observation data number for the i-th sample), the corresponding measurement result was defined as the arithmetic mean of an observation data group for each sample prepared.
Table 1 contains the generalized results of experimental studies to identify whether it is feasible to obtain the moisture content
H in transformer oil using the AHFML.
When analyzing the observation data, the corresponding ratios of the statistical characteristics of the output AHFML were used.
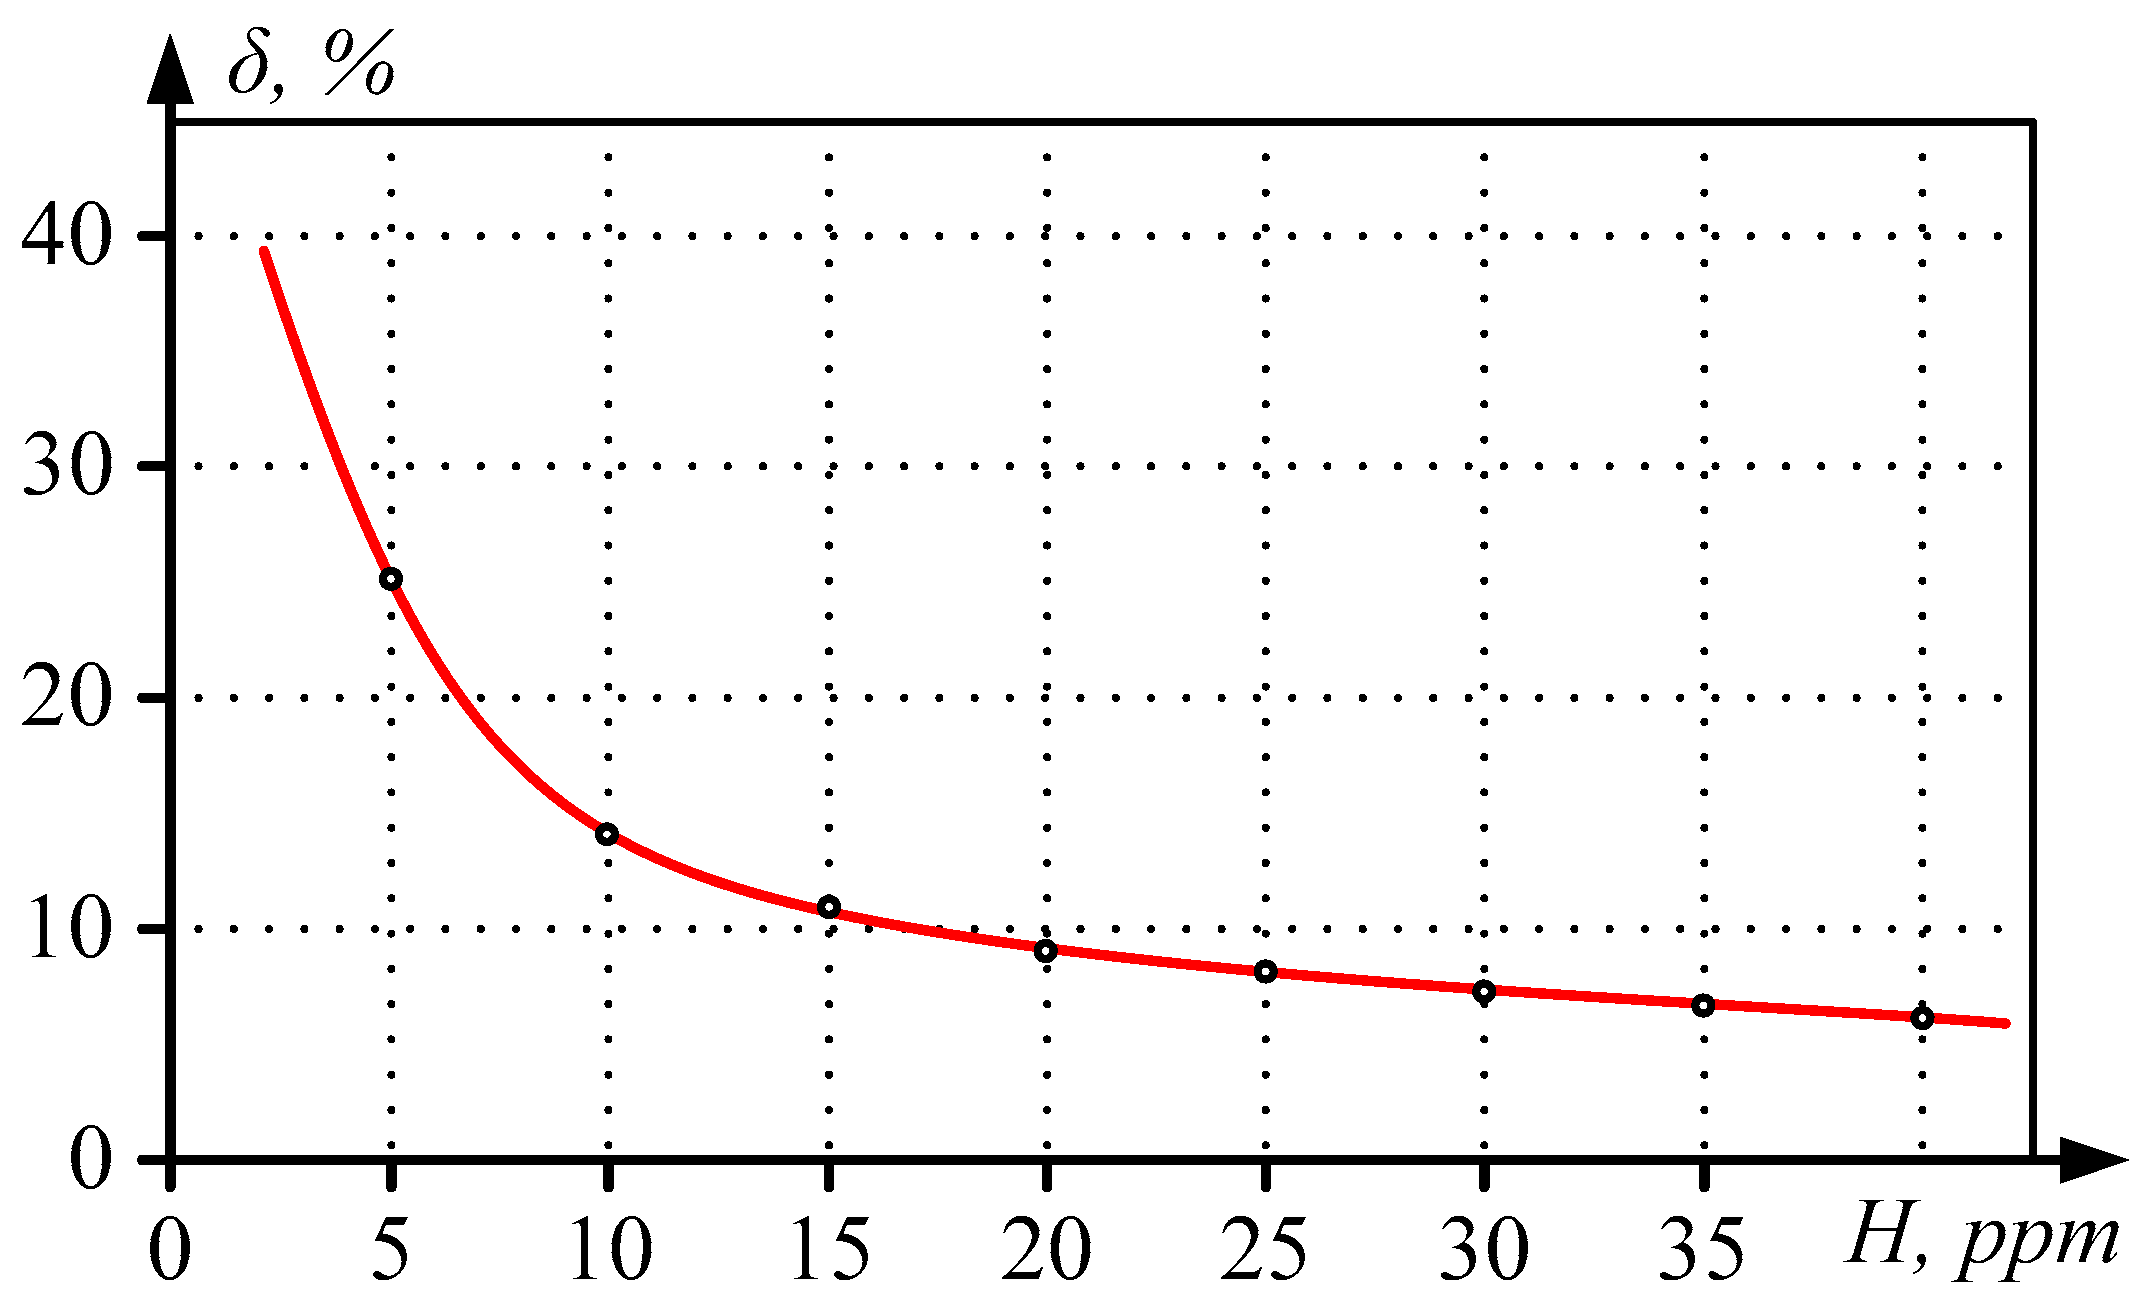
Based on the experimental data analysis, the authors built a curve illustrating the relative error
δ of defining the current moisture content in oil (
Figure 8), where the X (0–
H) and Y (0–
δ) axes represent, respectively, the reference moisture content values of each liquid sample and the error of the corresponding reference moisture content values measured using the technique proposed.
Note that the number of reference liquid mix sets (samples) was chosen according to the existing four classes of the oil technical condition. Given the complex sample preparation technology, this number is sufficient for correct experimental studies. Since the measurement result significance was estimated by the Fisher criterion, the moisture content was measured ten-fold for each reference sample, which ultimately ensured the required reliability of the entire experiment.
The oil condition was classified according to the moisture content, the presence of faults, and their development degree depending on the moisture content in the oil as follows:
- 1
Normal, less than 5 ppm, i.e., no obvious faults;
- 2
Working–Normal, with deviations less than 10 ppm, i.e., minor fault;
- 3
Working–Normal, with significant deviations from 10 to 15 ppm, i.e., significant fault;
- 4
Deteriorated condition, with deviations from 15 to 25 ppm, i.e., critical fault.
Figure 8 allows for the conclusion that critical faults can be identified by the increased moisture content in the oil with a maximum error of 10%, considering the aforementioned classification of the oil condition, and the AHFML sensitivity threshold reaches about tenths of ppm. Therefore, at a reduced moisture content
H < 5%, the MCC operates in a mode close to its sensitivity threshold, which determines the trend towards decreasing the measurement accuracy in
Figure 8.
The δ-H dependence nature indicates an additive measurement error associated with pickups, drifts, and vibrations. Further improvement of the AHFML design and technology will allow the full realization of the existing potential and the effective functioning of the entire system.
Although the paper sets the problem of defining the oil technical condition by the moisture content, to sum up, the proposed monitoring system allows for the defining of the following insulating oil parameters by means of the appropriate algorithm for processing the recorded data: 1—moisture content; 2—dielectric losses due to the accumulation of aging products in the oil and its pollution; and 3—the content of gases dissolved in oil.
According to
Figure 6 and Formula (17), the dielectric loss tangent is determined by the
Ip/
Ia ratio, and dielectric losses are defined by the equation:
where the total MCC capacitance
C is defined by Equation (8).
6. Conclusions
The proposed system for monitoring the power transformer conditions, implementing an option of the HF impedance technique, not only allows the technical staff to make timely and prompt decisions based on the data obtained, but also provides a long-term performance of the power equipment.
The proposed technique is effective, as it allows for building a power transformer failure prevention system. Such a system improves the reliability of state monitoring of the power oil-filled transformer, due to the early detection of incipient faults by the continuous monitoring of water and gases dissolved in oil. Another distinctive feature of the diagnostics proposed is the simplicity of its technical implementation, which does not compromise the integrity of the transformer structural elements and its operating mode.
However, it should be emphasized that the study does not involve the numerical estimating of the proposed technique accuracy against the already known methods. A detailed design of the circuit hardware part of the device, implementing the technique developed, its optimization, and thorough experimental studies, is the next independent stage of ongoing work. The research is aimed at identifying the essence of physical effects that allow for the monitoring of the oil condition directly during the transformer operation, by forming an additional HF measuring loop in its operating circuit and, theoretically, justifying the monitoring procedure. Thus, the study results in the new justified monitoring technique and its fundamental hardware implementation, currently unknown from the available technical information sources. This contributes to the development of the theory and practice of monitoring the power oil transformer conditions.
To conclude, it is of note that the proposed oil monitoring technique can be used to control not only transformers, but also other oil-filled power equipment, e.g., reactors, oil circuit breakers, current and voltage measuring transformers, HV bushings, etc.


 ,
, 


