
Experimental Investigation on Auto-Ignition Characteristics of Kerosene Spray Flames


1
State Key Laboratory of Multiphase Flow and Power Engineering, Xi’an Jiaotong University, Xi’an 710049, China
2
BYD Auto Industry Company Limited, Shenzhen 518118, China
*
Author to whom correspondence should be addressed.
†
These authors contributed equally to this work.
Machines 2022, 10(8), 601; https://doi.org/10.3390/machines10080601
Submission received: 23 June 2022
/
Revised: 16 July 2022
/
Accepted: 19 July 2022
/
Published: 22 July 2022
(This article belongs to the Special Issue Advances in Combustion Science for Future IC Engines)
Abstract
:To facilitate the better use of RP-3 kerosene in compression ignition engines, the auto-ignition behaviors of RP-3 kerosene spray were experimentally investigated in an optical rapid compression machine. Results show that most of the tests have good ignitability and combustion performance. For all the successful ignited cases, the flame kernel was found to be formed before the steep rise of pressure, which explained that image-based ignition delay time is always shorter than the pressure-based ignition delay time. The effects of ambient environment, injection pressure, and injection delay time on the pressure history, ignition intensity, combustion duration, heat release rate, and other parameters were investigated individually. The ambient environment has a strong influence on ignition delay time by accelerating the chemical reactions, whereas the high injection pressure helps the better vaporization of fuel spray. The effect of injection delay time is non-monotonic as the trade-off relation between heat loss and blending of fuel and oxygen. The heat release rate histories under different conditions were compared and analyzed, and the two-stage heat release phenomenon was observed in the negative temperature coefficient region. The ignition intensity region was determined based on the measured ignition delay times of RP-3 kerosene spray, and multiple linear regression correlation was used to study the ignition delay time sensitivity to multi-factors.
1. Introduction
Because of the advantages of thrust-weight ratio, bypass ratio, and oil consumption, gas turbine aero engines are widely used in aviation aircrafts. However, due to the rapidly growing demand of small aircrafts for agriculture spraying, mapping & surveying industrial inspection, etc., which use a large number of unmanned aerial vehicles (UAVs), equipping these aircraft with traditional reciprocating engines are emerging due to their high versatility and low cost of use [1]. On the other hand, the fuel supply system is the key part in modern warfare, but it is inconvenient and has a high cost due to the running of two fuel lines, namely, the diesel line to fuel ground vehicles and the kerosene line to fuel aircrafts. Thus, the single fuel concept (SFC) was adopted by the US Army to tackle the coordination difficulties of fuel supply [2]. Specifically, Jet Petrol-8 (JP-8) kerosene was used as the single fuel in both piston engines and gas turbine engines. To ensure the stability and extend the service life of piston engines fueled with kerosene, the controllable and robust combustion strategy of kerosene spray caused extensive concern. Ever since, research on the application of kerosene in traditional internal combustion engines has been in full swing.
JP-8 has been fueled in a heavy-duty diesel engine without critical problems [3]. JP-8 was also found to have the potential for lowering the emissions and achieving higher combustion efficiency compared to diesel [4,5,6]. Propellant-3 (RP-3), a standard kerosene widely used in China, differs in composition and physical properties from JP-8 and other kerosene fuels [7], and the combustion characteristics need to be investigated for its compatibility in conventional reciprocating engines. Chen and co-authors [8,9] checked the running state of RP-3 in a compression ignition (CI) engine and found that higher indicated thermal efficiency was achieved by replacing the diesel with RP-3 kerosene. Emissions such as carbon monoxide (CO) and total hydrocarbon (THC), especially under low engine loads, were also pointed out. As kerosene and diesel have distinct characteristics (e.g., volatility, viscosity, H/C ratio, cetane number (CN)) [10], their processes of combustion are significantly different. The customized timing control in terms of injection and ignition is crucial for further improvements of CI engines fueled with kerosene. A number of studies [8,11,12,13,14,15] has been conducted on real engines fueled with RP-3 kerosene; the published datasets obtained from these experiments, however, are generally unrepeatable due to the differences among facilities. This makes the data difficult to use in chamber design and ignition model development; hence, abundant datasets under accurate thermodynamic states are urgently needed.
Fundamental studies have become the preferred method, as their conditions can be described clearly, and repeatable datasets can be provided. For physical spray morphology studies, both Zhao et al. [16] and Liu et al. [17] used a pressure swirl atomizer to study the spray characteristics of RP-3, and then the constant volume bomb (CVB) was used to enhance the ambient pressure [13,18]. For chemical kinetic studies, laminar combustion velocity [19] and ignition delay time (IDT) [20,21,22] of RP-3 were measured successively, and new surrogate models were also constructed in these studies. However, only a few fundamental studies focused on the ignition and combustion performance of RP-3 spray. Zhang et al. [23] investigated the ignition limit of RP-3 spray at both stable and near-lean blowout conditions. They found that the rotation mode in the swirl flame is primary under stable conditions, while three modes of the flame dynamics, including vibration, rotation, and flame shedding, can be found at near-lean blowout conditions. Du et al. [24] examined the ignition performance of RP-3 spray under wall-impinged conditions. They found that a low temperature wall will prolong the spray ignition delay, but a low injection pressure at small injection quantities can shortening the ignition delay. However, higher injection pressures at larger injection quantities are beneficial to fuel atomization, which shortens the duration of diffusion combustion and decreases soot emissions. Recently, Shi et al. [25] blended diesel with RP-3 kerosene at cold-start conditions in a compression ignition CVB and found that strong volatility of kerosene can significantly promote spray atomization and evaporation. The addition of a small proportion of kerosene can shorten the ignition delay under cold-start conditions, although it has a lower cetane number. Previous studies have shown that although there is a good application prospect of RP-3 kerosene, the optically-accessible studies of RP-3 kerosene spray ignition and combustion under engine-like conditions are still limited. In addition, the auto-ignition of fuel spray is much more complicated due to the turbulent mixing spatially and temporally; the ignition limit of fuel and the accurate IDT of fuel spray are important for model validation and development, which also influence kerosene engine performance.
Facing the miniaturization tendency of aviation piston engines and the lack of fundamental databases in terms of IDT, pressure history, and combustion duration of RP-3 spray ignition and combustion process, our objective is to investigate the spray combustion of RP-3 kerosene at engine-like conditions. The auto-ignition behaviors of RP-3, including the macroscopic spray development and combustion process, were recorded through high speed imaging over a wide range of initial chamber pressure and temperature conditions in an optical rapid compression machine (RCM). This RCM simulates the actual engine piston compression, and its thermodynamic conditions are well defined and can be accurately monitored [26]. The effects of injection pressure and injection delay times on IDT and combustion duration were also discussed. Furthermore, the heat release rates for cases under different conditions were analyzed and compared. Based on the measured IDTs, the ignition intensity region was determined, and the IDT correlation was derived. The above results provide abundant datasets and ignition limits over broad conditions, which is beneficial for chamber and fuel design, injection and ignition timing control, and combustion strategy modification.
2. Experimental Specifications
2.1. Experimental Apparatus and Limitations
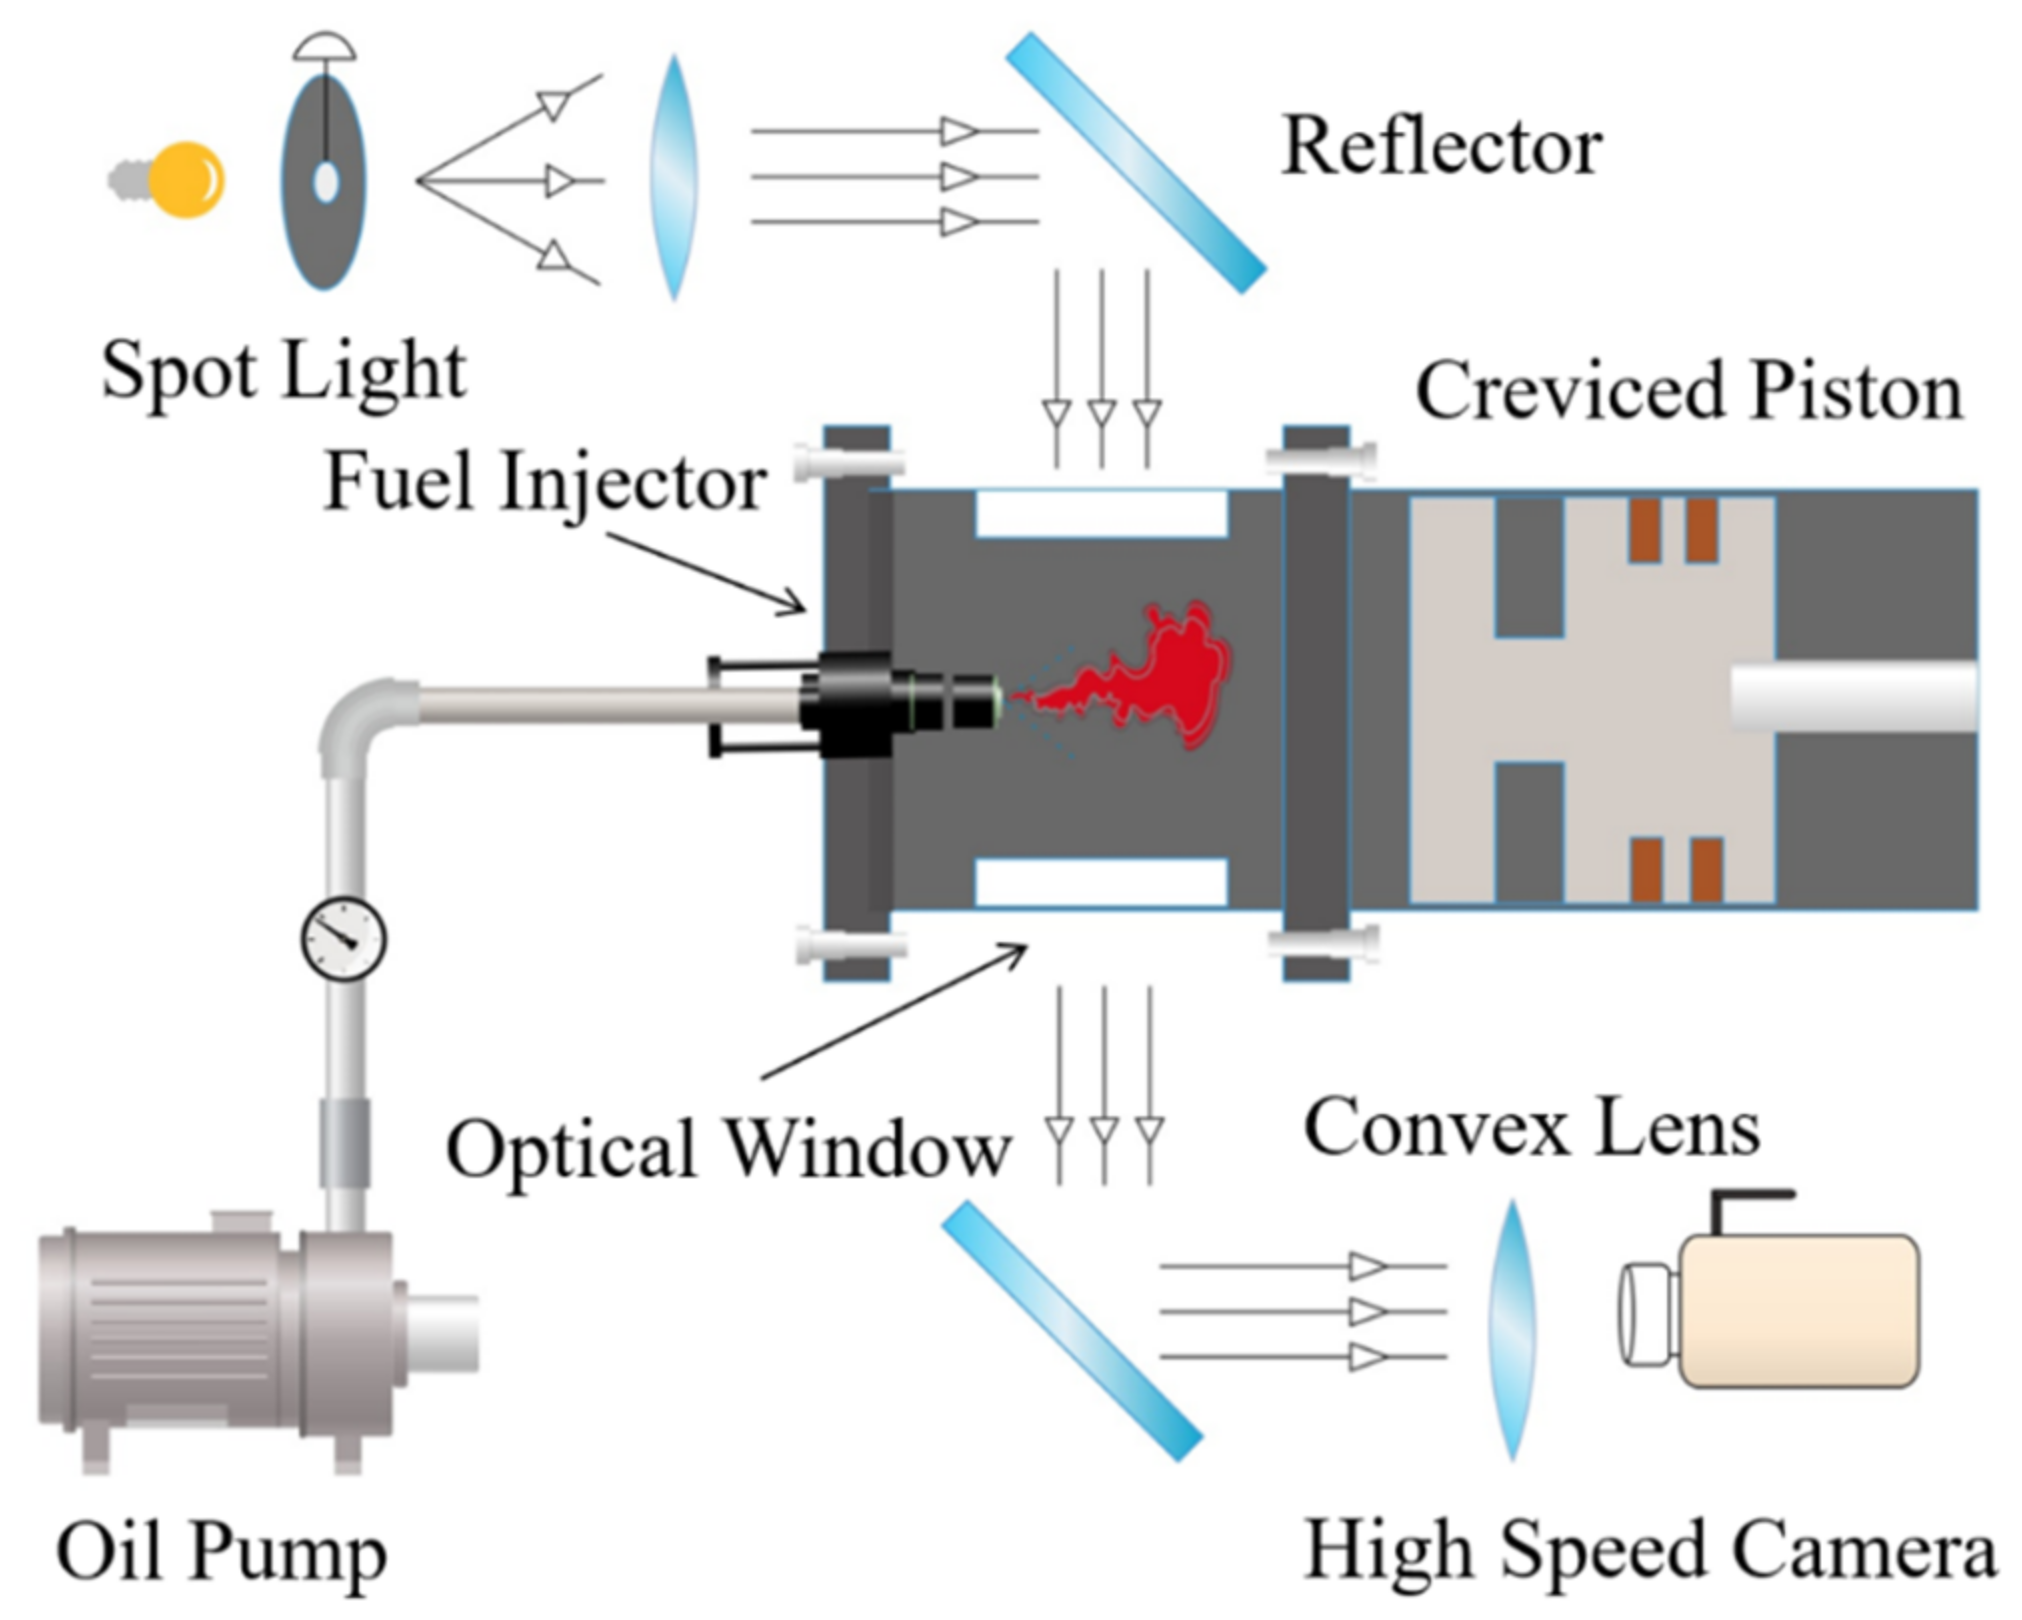
In this study, an optical RCM was utilized to study the fuel spray at CI engine-relevant conditions. This RCM has an engine-like piston movement and allows for the simulation of a single compression stroke at variable compression ratios (CRs), and it was previously used to study the auto-ignition characteristics of the homogeneous gas phase mixtures such as methylcyclohexane [27], 1,3,5-trimethylbenzen [28], and nitromethane [29]. However, in the actual CI engine, the fuel is directly injected into the combustion chamber in the liquid phase and then atomized, evaporated, mixed with air, and combusted. To update the facility to investigate liquid fuel direct injection and combustion characteristics, the combustion chamber was elaborately redesigned to cooperate with a fuel injector and a high-speed camera (HSC). As shown in Figure 1, this combustion chamber has a cylindrical geometry with a flat cylinder head, and two optical windows were installed horizontally on both its sides. A 6-hole commercial injector body (AC Delco), previously used in [30], was mounted on the center of the cylinder head to discharge pressurized fuel and initialize the fuel spray. The macroscopic photos of spray were obtained by the Schlieren method with a Phantom V611 high-speed camera (HSC), convex lens (Zolix), and spot light (Zolix). More detailed descriptions and its operation principle are available in our previous studies [27,28,29,30]. In this study, the combustion chamber length was fixed at 30 mm, and the sample rate of the HSC was set at 25,000 fps. An overview of this RCM setup and test conditions is shown in Table 1.
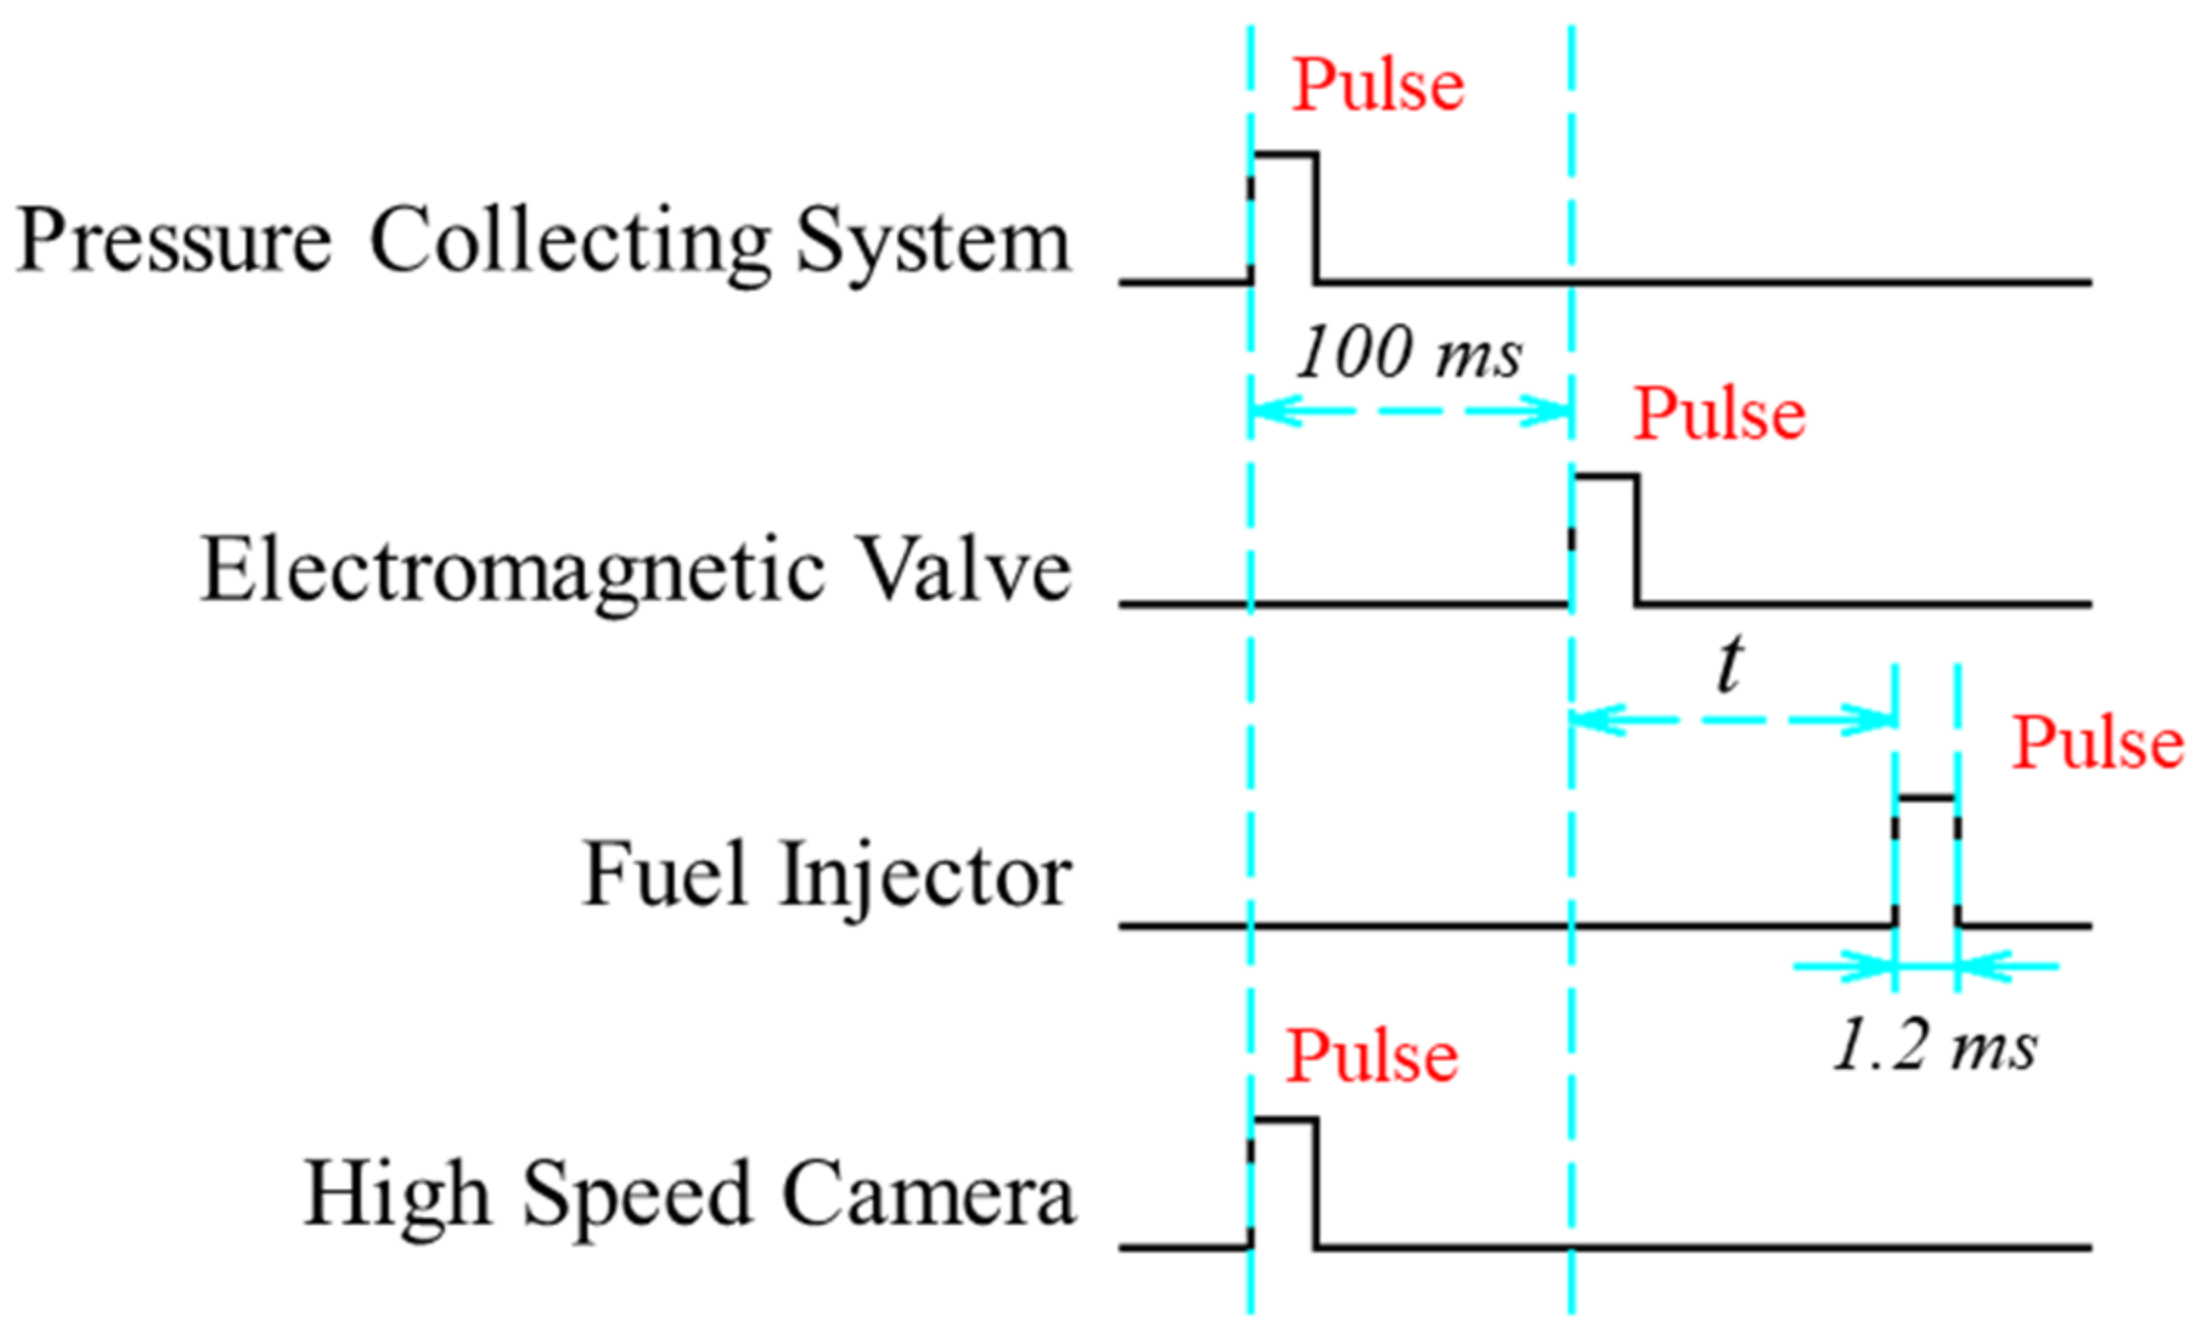
To have flexible control of the whole RCM system, an updated LabView program was developed to sort the time sequences of trigger signals. As shown in Figure 2, the pressure collecting system and HSC were firstly triggered by a pulse signal to record the whole pressure history and the flame development. After the time interval of 100 ms, the electromagnetic valve was triggered to close the hydraulic brake system, so the piston was pushed by the high-pressure air to achieve the compression stroke, which took about 45 ms. Finally, the fuel injector was energized to inject the tested fuel into the combustion chamber, and different post-compression conditions could be achieved by varying the time interval (t). The duration of the energizing signal for this injector is the injection pulse width, which was set at 1.2 ms in this study. The tested fuel, RP-3 kerosene, was purchased from Lanzhou Petrochemical Company (Lanzhou, China), and its main properties are given in Table 2. This kerosene was used without further purification. As tabulated in Table 3, the fuel injection quantities per injection at different pressures were measured and calibrated by averaging the injected mass for 20 injections. The injection pulse width was fixed at 1.2 ms, and the fuel temperature was always maintained at room temperature of 298 K.
2.2. Data Collection and Analysis Processing
The pressure and temperature of the mixture elevated quickly during the compression stroke; in order to clearly describe different conditions of the combustion chamber, the pressure and temperature at the end of compression (EOC) were used as the characterization parameters (Pc and Tc). As the chamber pressure was monitored continuously by the pressure sensor (Kistler 6125C) and the charge amplifier (Kistler 5018B), Pc could be directly obtained from the collected pressure history. As for Tc, because the laser-based non-intrusive measurement is still developing on this RCM, the adiabatic core hypothesis [32] was used in this study to calculate the temperature history from the measured pressure history. Under this assumption, the heat transfer from the core volume of the chamber only occurs in a thin boundary layer near the wall, so the compressed temperature can be calculated by the following equation:
where Ti is the initial temperature of the gas mixture and was fixed at 298.15 K in this study, Pi is the initial pressure of the gas mixture, and is the temperature-dependent specific heat ratio. This method was demonstrated to be effective through comparison with the measured results by Nasir and Farooq [33]. An optimized piston [26] with a suitable hydraulic system [34] was used to restrain the in-cylinder roll-up and ensure homogeneity. Additionally, gaseous mixtures consisting of oxygen, nitrogen, and argon with purities all over 99.99% were charged into the chamber before the fuel injection, which guaranteed that no chemical reactions would happen during the compression stroke and further improved the assumption accuracy. Based on this equation, the EOC condition was adjustable by changing the initial state of the gas mixture, such that a higher Pc could be achieved by increasing Pi, and a lower Tc could be reached by replacing the argon with nitrogen in the mixture.
To calculate the heat release rate (HRR) for the RCM test, direct application of the energy conservation equation faces numerous challenges as illustrated by Goldsborough et al. [35]. Based on the adiabatic core hypothesis, HRR can be calculated through the following equation:
where the subscript ‘nr’ in Equation (2) indicates non-reacting conditions. It was straightforward that chemical heat release caused more heat loss through the cold boundary; thus, the heat loss of the non-reactive test was not identical with that of the reactive test. Even so, this method provided an easy way to conduct the qualitative comparison. The specific components and proportions for all the tests can be found in Supplementary Materials S1.
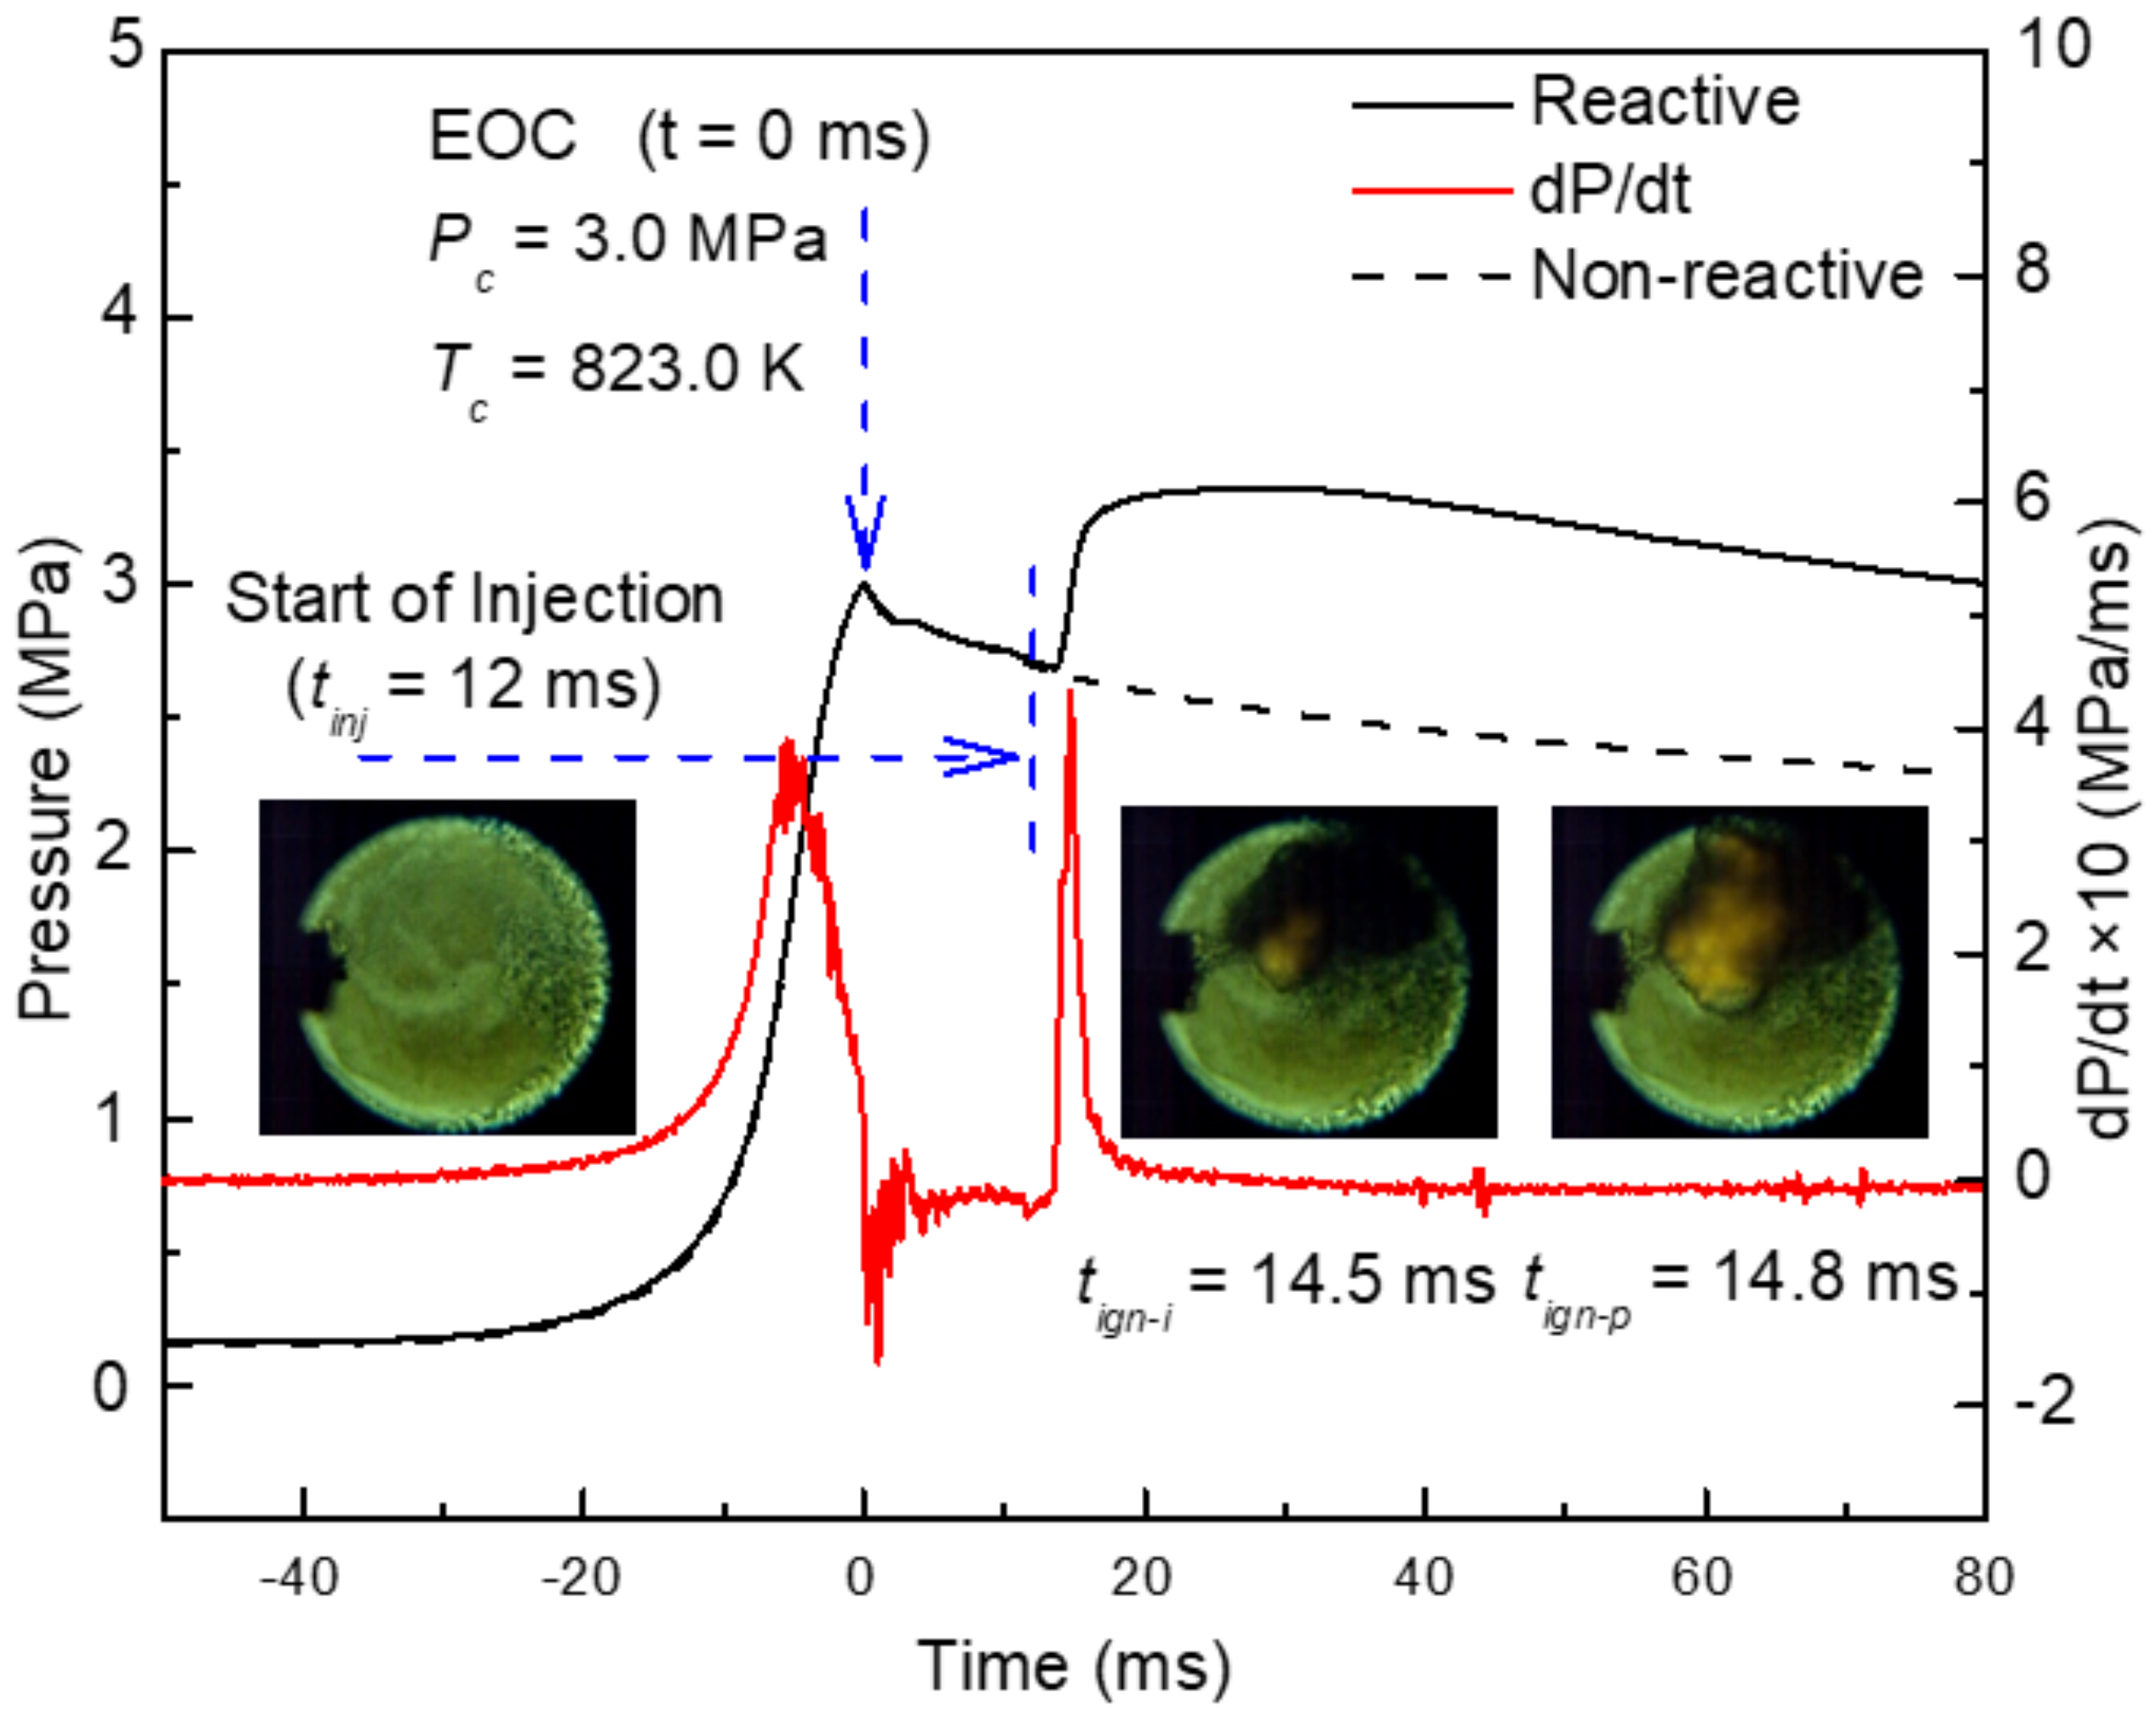
Figure 3 shows a typical pressure history of a mixture consisting of oxygen and argon, and its initial pressure (Pi) was 0.183 MPa. The black line is the pressure of the combustion chamber, while the red line is the derivative of the pressure data. The non-reactive test was also conducted by replacing the oxygen with nitrogen, and the recorded pressure evolution is represented as the dashed line. Time zero (t = 0 ms) was defined at EOC where the pressure reached the first peak; the pressure traces of reactive and non-reactive tests overlapped well before ignition, providing evidence that negligible chemical reactions happened during the compression. The ignition delay time was defined as the time interval between the start of injection (tinj) and the ignition (tign), and the maximum pressure rise was widely accepted as the onset of ignition in many studies [36,37,38]; however, the image series showed that the flame kernel had already formed before that moment. For this case, the fuel was injected at 12 ms, the flame was firstly observed at 14.5 ms through the images, and the maximum pressure rise happened at 14.8 ms. Thus, two types of IDTs were used in this study; one derived from the images was calculated as IDTi = tign-i tinj = 2.5 ms, and another one, derived from pressure evolution, was obtained as IDTp = tign-p tinj = 2.8 ms. It is worth noting that although the pressure history experienced a rapid increase and a slow increase before the pressure drop, this cannot be called a multi-stage ignition phenomenon. In gas-phase experiments, the chain-branching reactions of some fuels will be favored at different stages, and thus their pressure evolutions have multiple increases, whereas the combustion mode of fuel spray is significantly different with that of gas-phase fuel; due to the inhomogeneous distribution of fuel spray, part of the fuel was fully vaporized, while the other part of fuel was not, and then the premixed and diffused combustion could co-exist and interact with each other in the chamber.
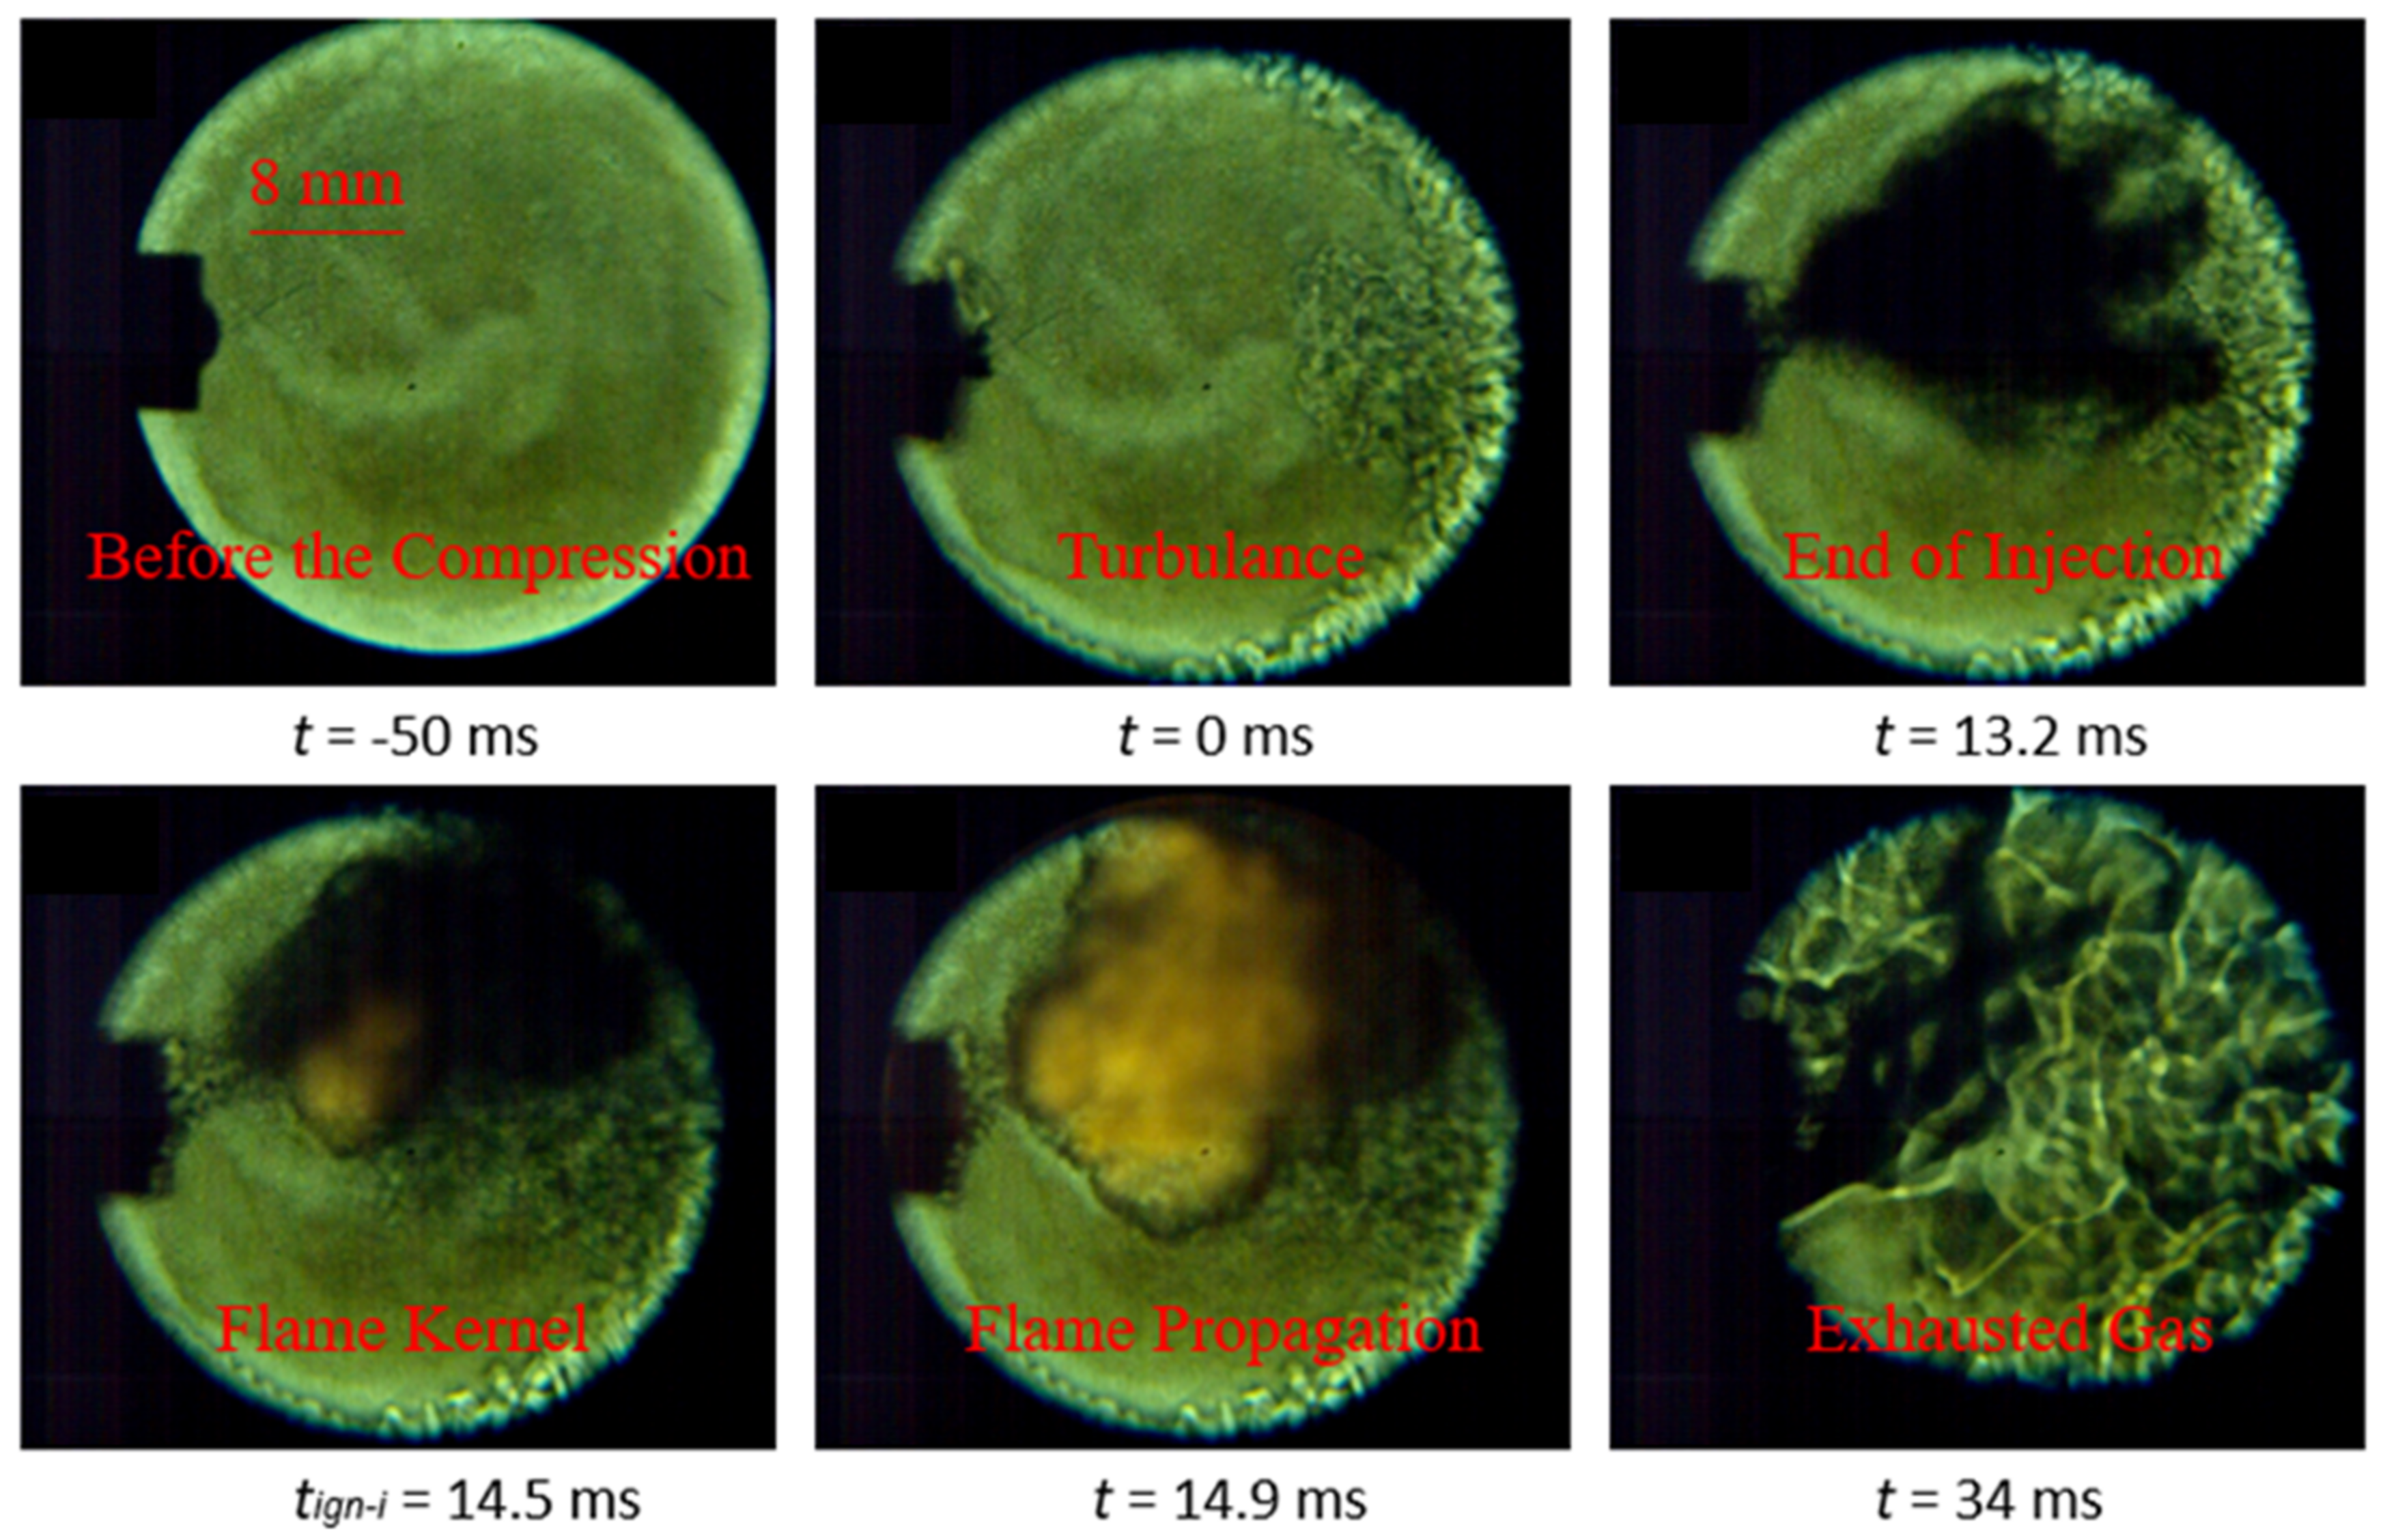
To clearly illustrate the combustion process of RP-3 spray, some typical stages during the pressure trace, as shown in Figure 3, were extracted, as shown in Figure 4. Before the compression, no in-cylinder vortex was observed in the window, whereas the mixture was compressed by the piston, and vortexes appeared from the window boundary near the piston top and gathered around the central region, which was consistent with our previous simulations [26]. The gaseous mixture was pushed into the core region of the chamber or into the piston crevice due to the piston motion. At the injection pressure of 10 MPa and the injection duration of 1.2 ms, RP-3 kerosene through six nozzles was injected into the chamber, whereas the side view Schlieren images basically recorded the projected spray plumes, so only four plumes of them were imaged. The dark region (liquid fuel) wrapped by the brighter region (vapor fuel) increased gradually to the end of the injection and gasified in the high temperature environment. The flame kernel appeared at tign-i = 14.5 ms and then ignited the surrounding mixtures quickly; the flame propagation was thus formed until it impinged on the wall. We note that the impingement of flame was not observed because of the size of the window. As the fuel spray was not spatially homogenous in the chamber, extensive heat exchange and density variation were observed during the combustion process. The complete video is available in Supplementary Materials S2.
3. Experimental Results and Discussion
3.1. Effect of Ambient Environment on Spray Combustion
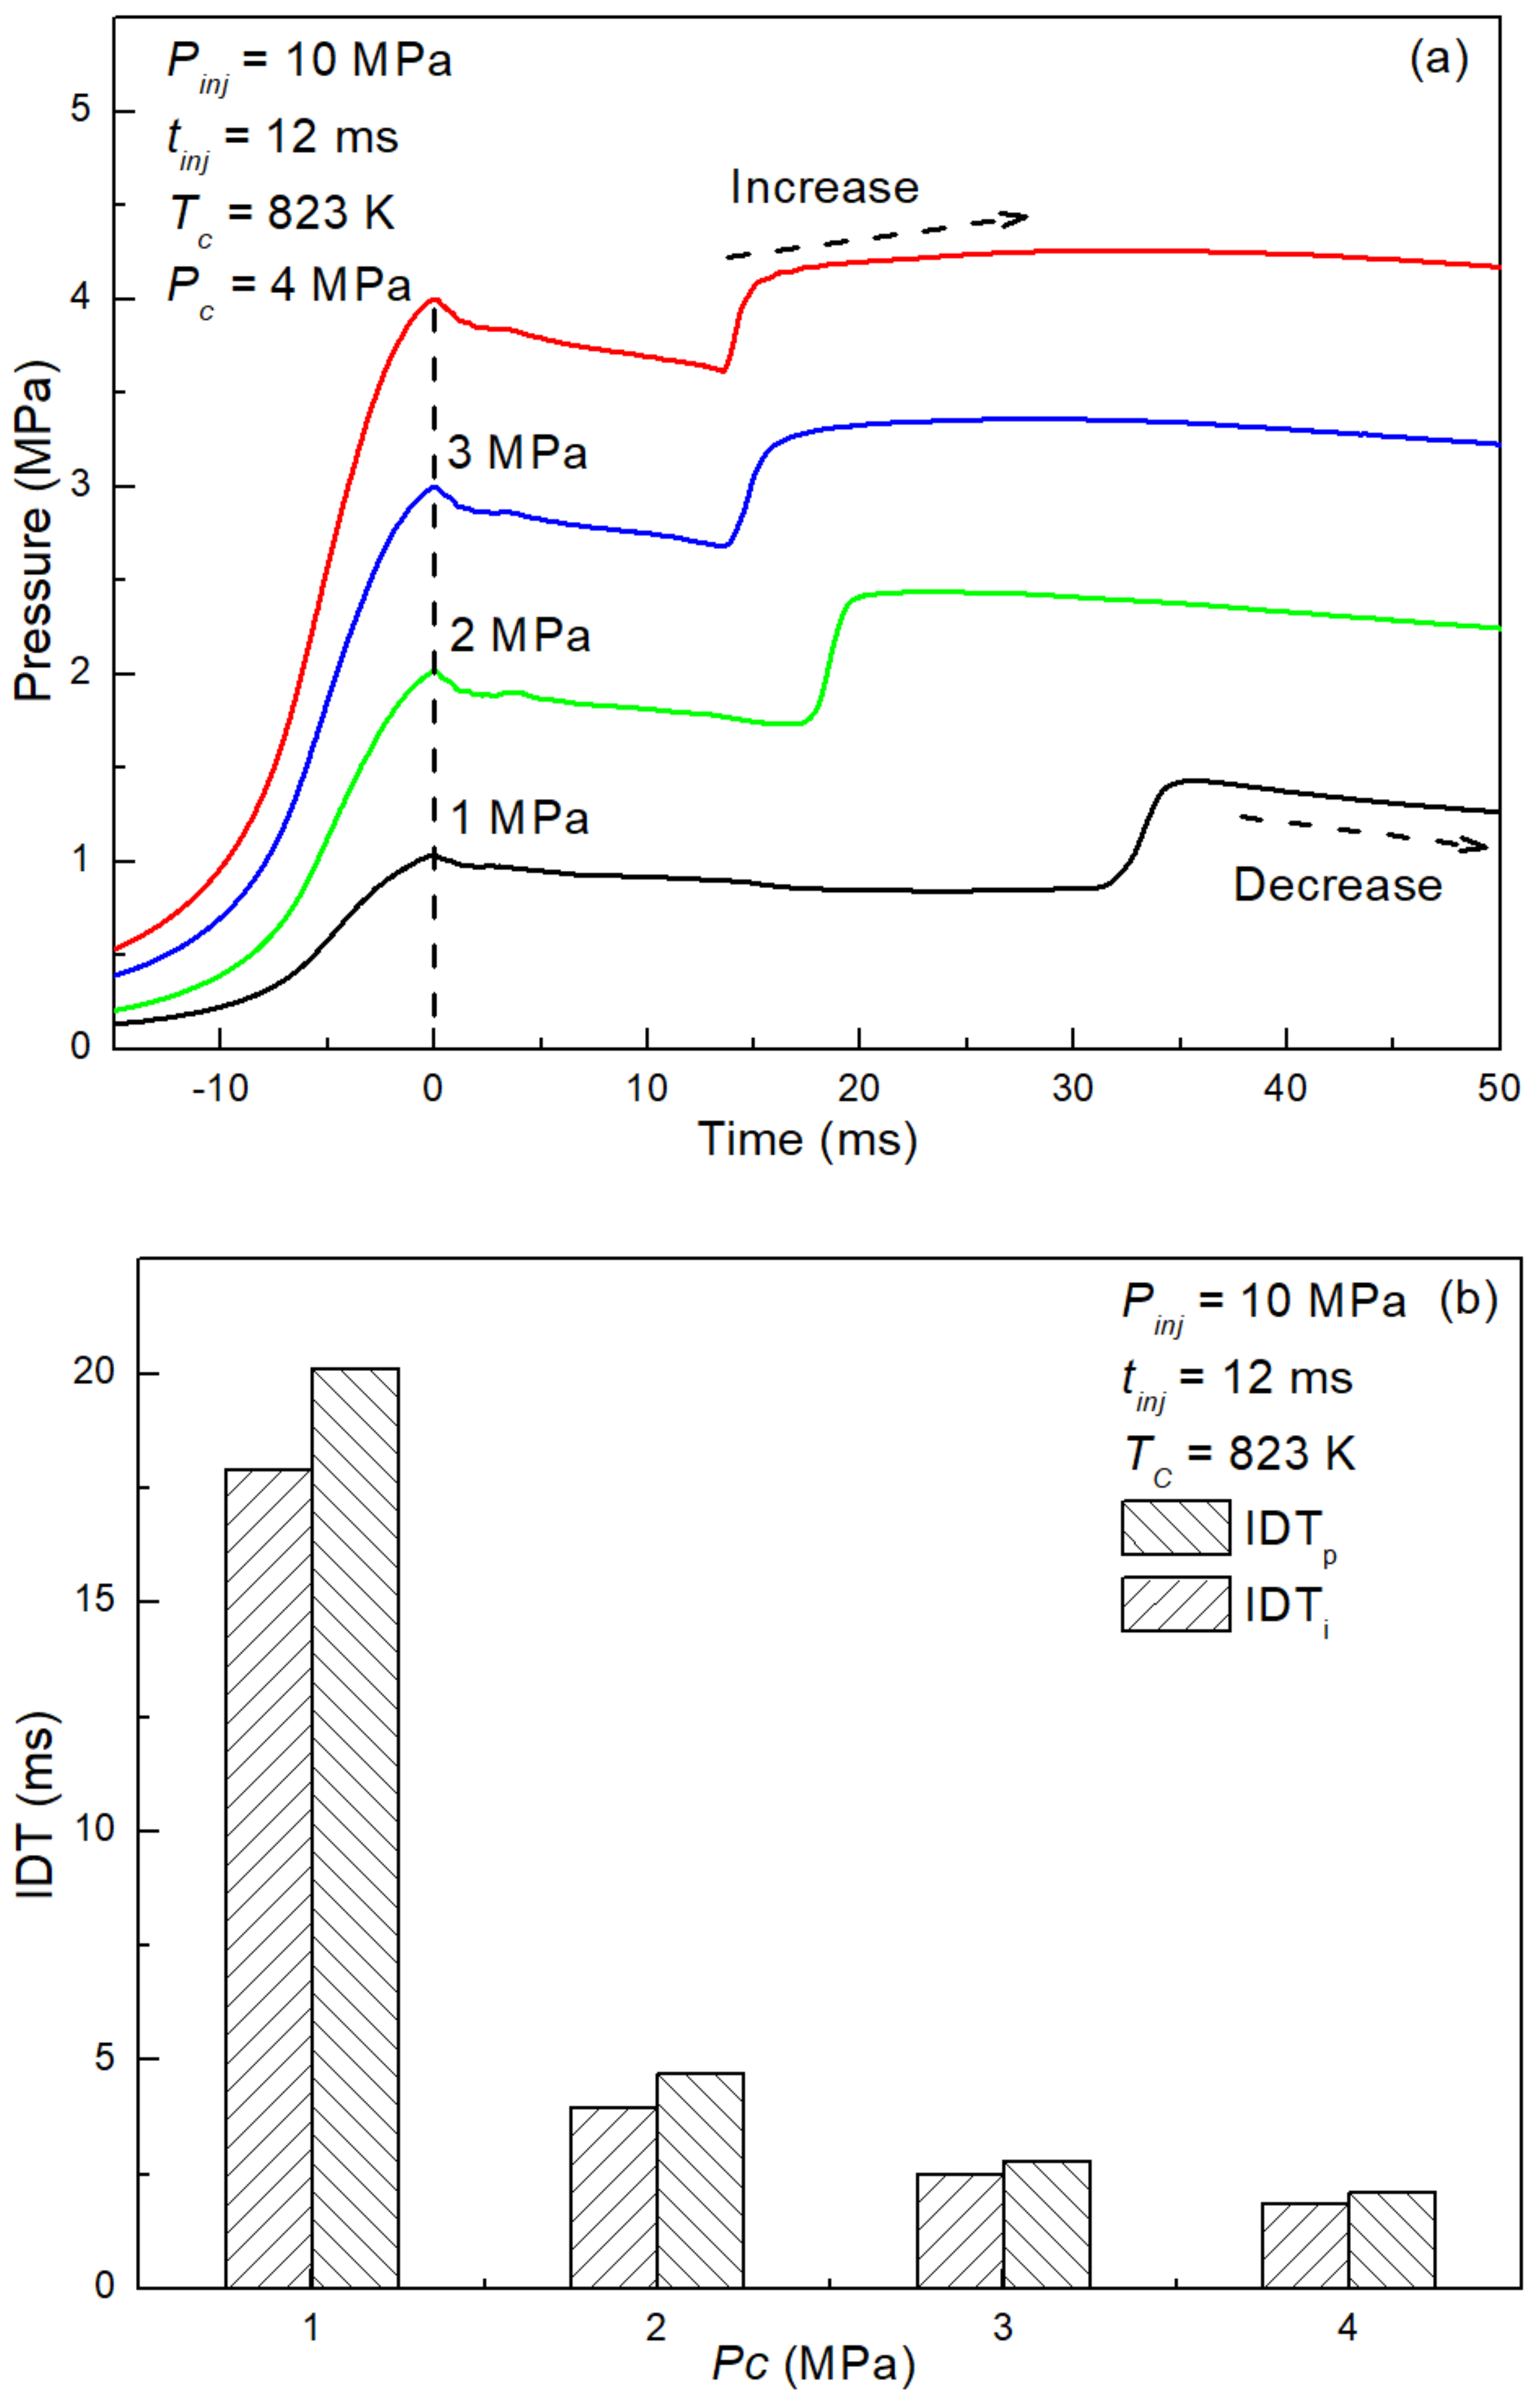
Parametric studies on the auto-ignition characteristics of RP-3 spray were conducted. In this section, the effects of ambient pressure, temperature, and diluents are discussed in terms of IDTs and spray evolution. The ambient pressure is exactly the chamber pressure, which depends on the compression ratio and the initial pressure. As such, only the initial pressure was changed to achieve different EOC pressures. Four tests with EOC pressures from 1 MPa to 4 MPa are shown in Figure 5. It is clearly shown in Figure 5a that high chamber pressure generated higher pressurizing rate, which eventually led to shorter IDTs. Unlike the gas-phase experiments [20], where the pressure trace quickly decreased after the ignition, a slow increase of pressure after the ignition was observed in this study. This phenomenon indicated that exothermic reactions were still proceeding after the ignition, and the pressure decreased only when the heat release from these reactions could not offset the heat loss from the cold boundary. Thus, the pressure decrease was much delayed in high EOC pressure conditions, as the high-pressure environment promoted the reactivity of reactions, whereas the opposite phenomenon was observed in low EOC pressure conditions. The image-based IDTs were found to be shorter than the pressure-based IDTs, as seen in Figure 5b, for all cases. This is consistent with the observation in our previous work for solid particle ignition [39], and the discrepancy between them showed an increasing trend with the EOC pressure rising.
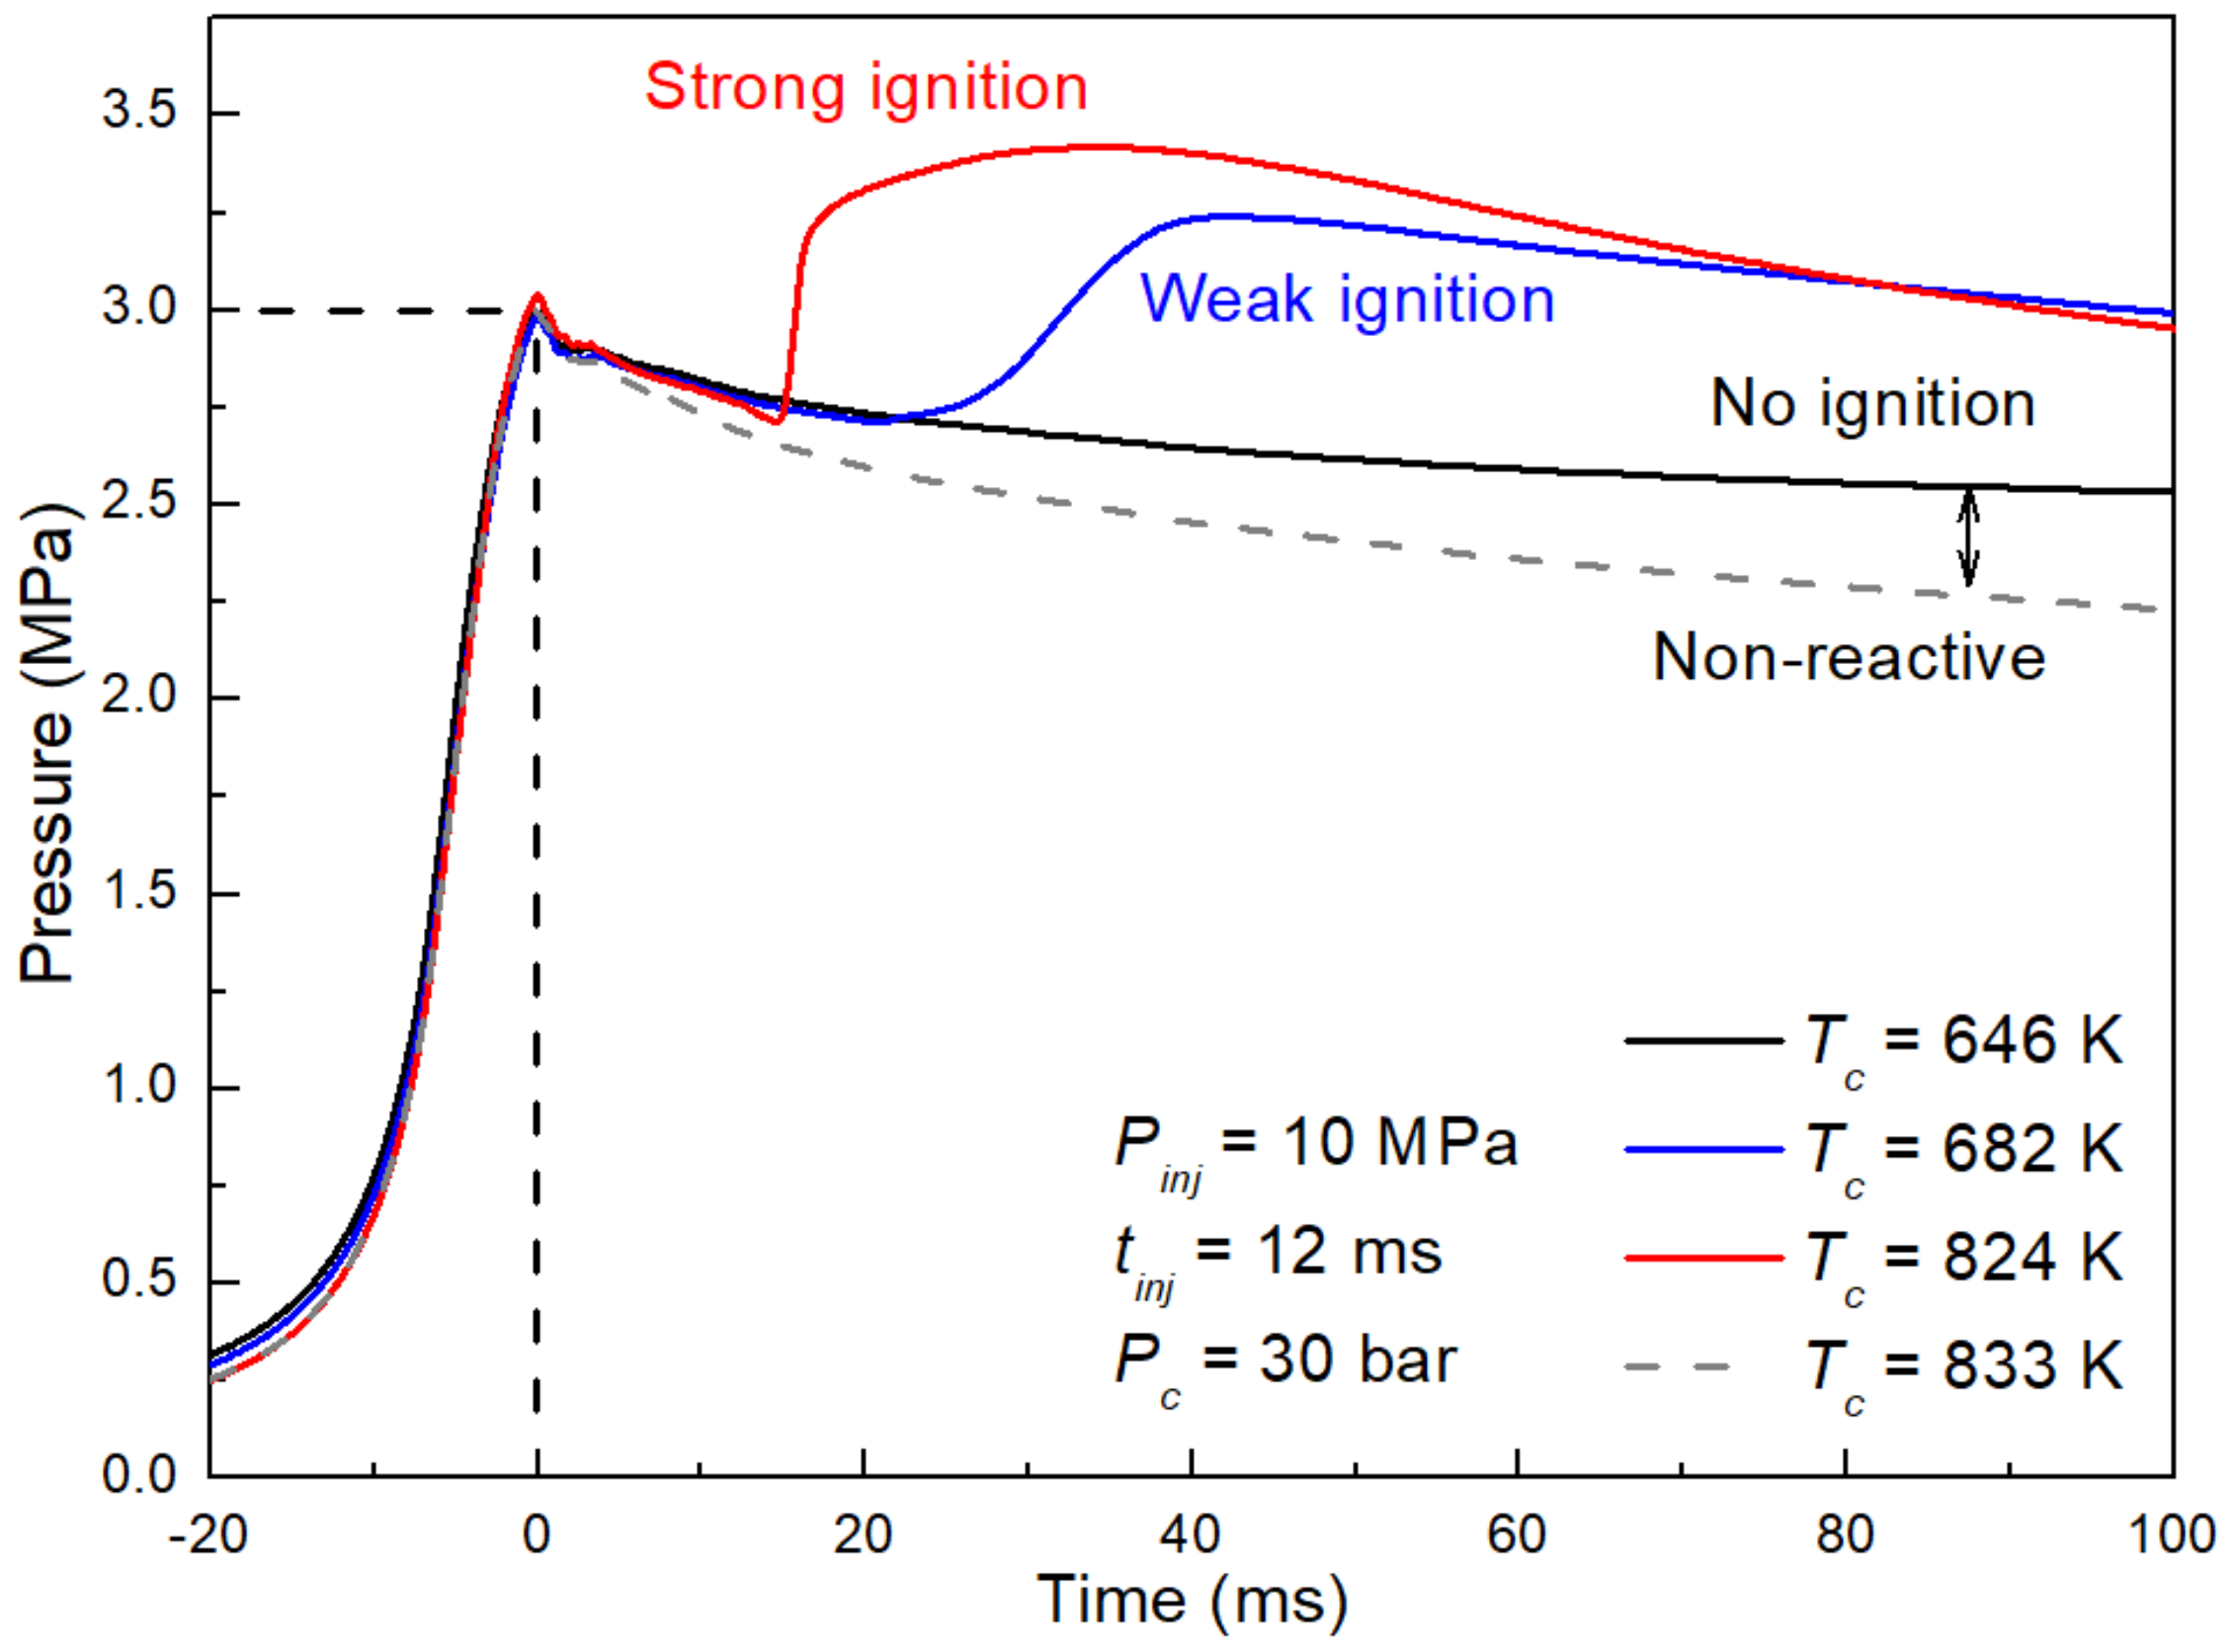
To study the temperature effect on spray combustion, tests with different EOC temperatures were conducted by monitoring the thermophysical properties of the mixture. For the pressure of 3 MPa, when the argon proportion of diluent gaseous was adjusted in the range between 24% and 64%, the EOC temperature was calculated to be between 646 K and 824 K. The pressure histories of relevant tests are shown as solid lines in Figure 6; it was found that three lines overlapped well before the injection, but different trends appeared after the ignition, and the intensity of autoignition became obviously more violent under higher EOC temperature conditions. To clearly show the heat loss effect, a corresponding non-reactive test with a mixture consisting of 80% argon and 20% nitrogen was also conducted at the same EOC pressure. Although the EOC temperature of the non-reactive test was slightly higher than that of the reactive tests, the pressure decrease rate of the non-reactive test was much quicker than that of the reactive tests, and the discrepancy between their pressure traces became much larger with time. This indicates that part of the exothermic reactions happened even in the no-ignition test.
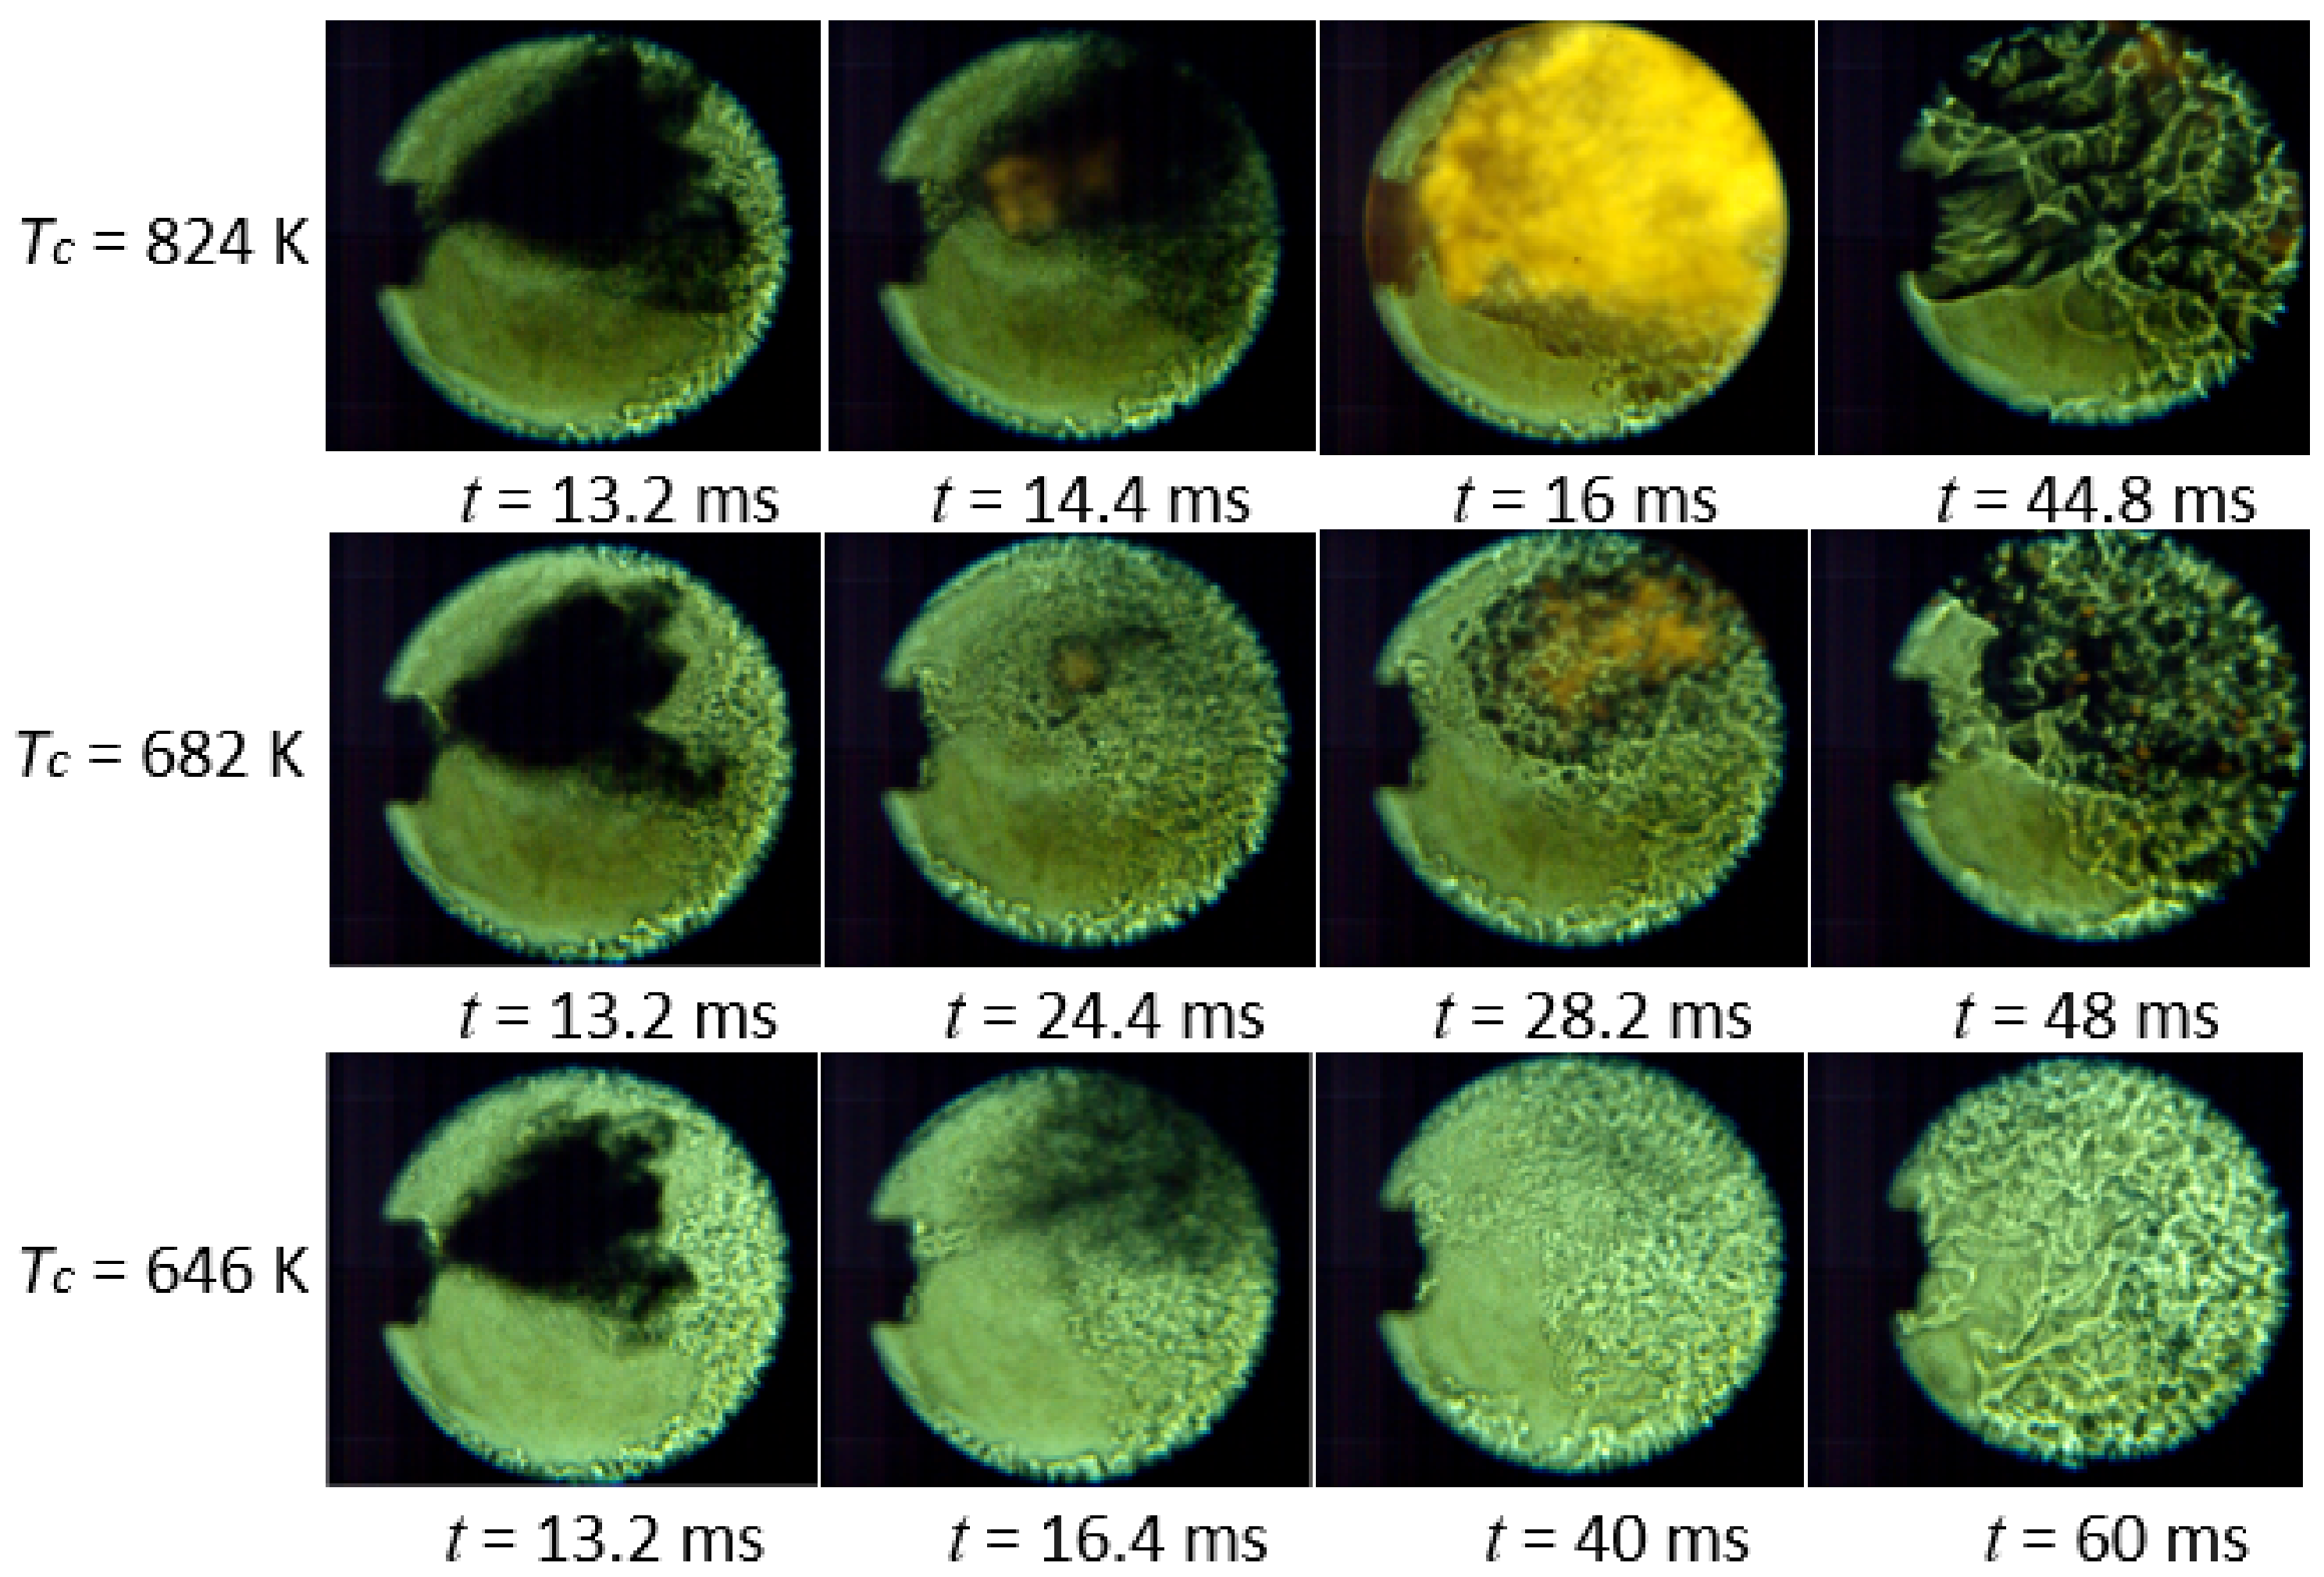
To further illustrate the effect of diluents, the evaporation and combustion of spray and flame propagation for the above cases are compared in Figure 7. At the end of the injection (t = 13.2 ms), the fuel spray at the EOC temperature of 646 K was speculated to have the worst vaporization performance, as the low ambient temperature inhibited the fuel vaporization. For the test at the EOC temperature of 682 K, the flame kernel appeared before the spray fully vaporized, and then it auto-ignited the surrounding fuel until all the liquid fuel was ignited. As the EOC temperature decreased to 682 K, the formation of the flame kernel was much delayed, the fuel spray was well vaporized in the chamber, and a weak flame propagation was observed. The initial flame kernel only ignited the surrounding fuel in a small range; moreover, some other flame kernels were also formed elsewhere and started individual propagation. Thus, distinct boundaries of different flame areas were shown in this weak ignition test, and this clarified the discrepancies of peak pressure and pressure rise rate at ignition for the different tests shown in Figure 6. When the EOC temperature further decreased to 646 K, the fuel spray vaporized well at this condition, whereas the fuel reactivity was inhibited. As a result, extensive density variation after the fuel vaporization was observed, and no flame kernel was formed.
3.2. Effects of Injection Pressure and Injection Delay on Spray Combustion
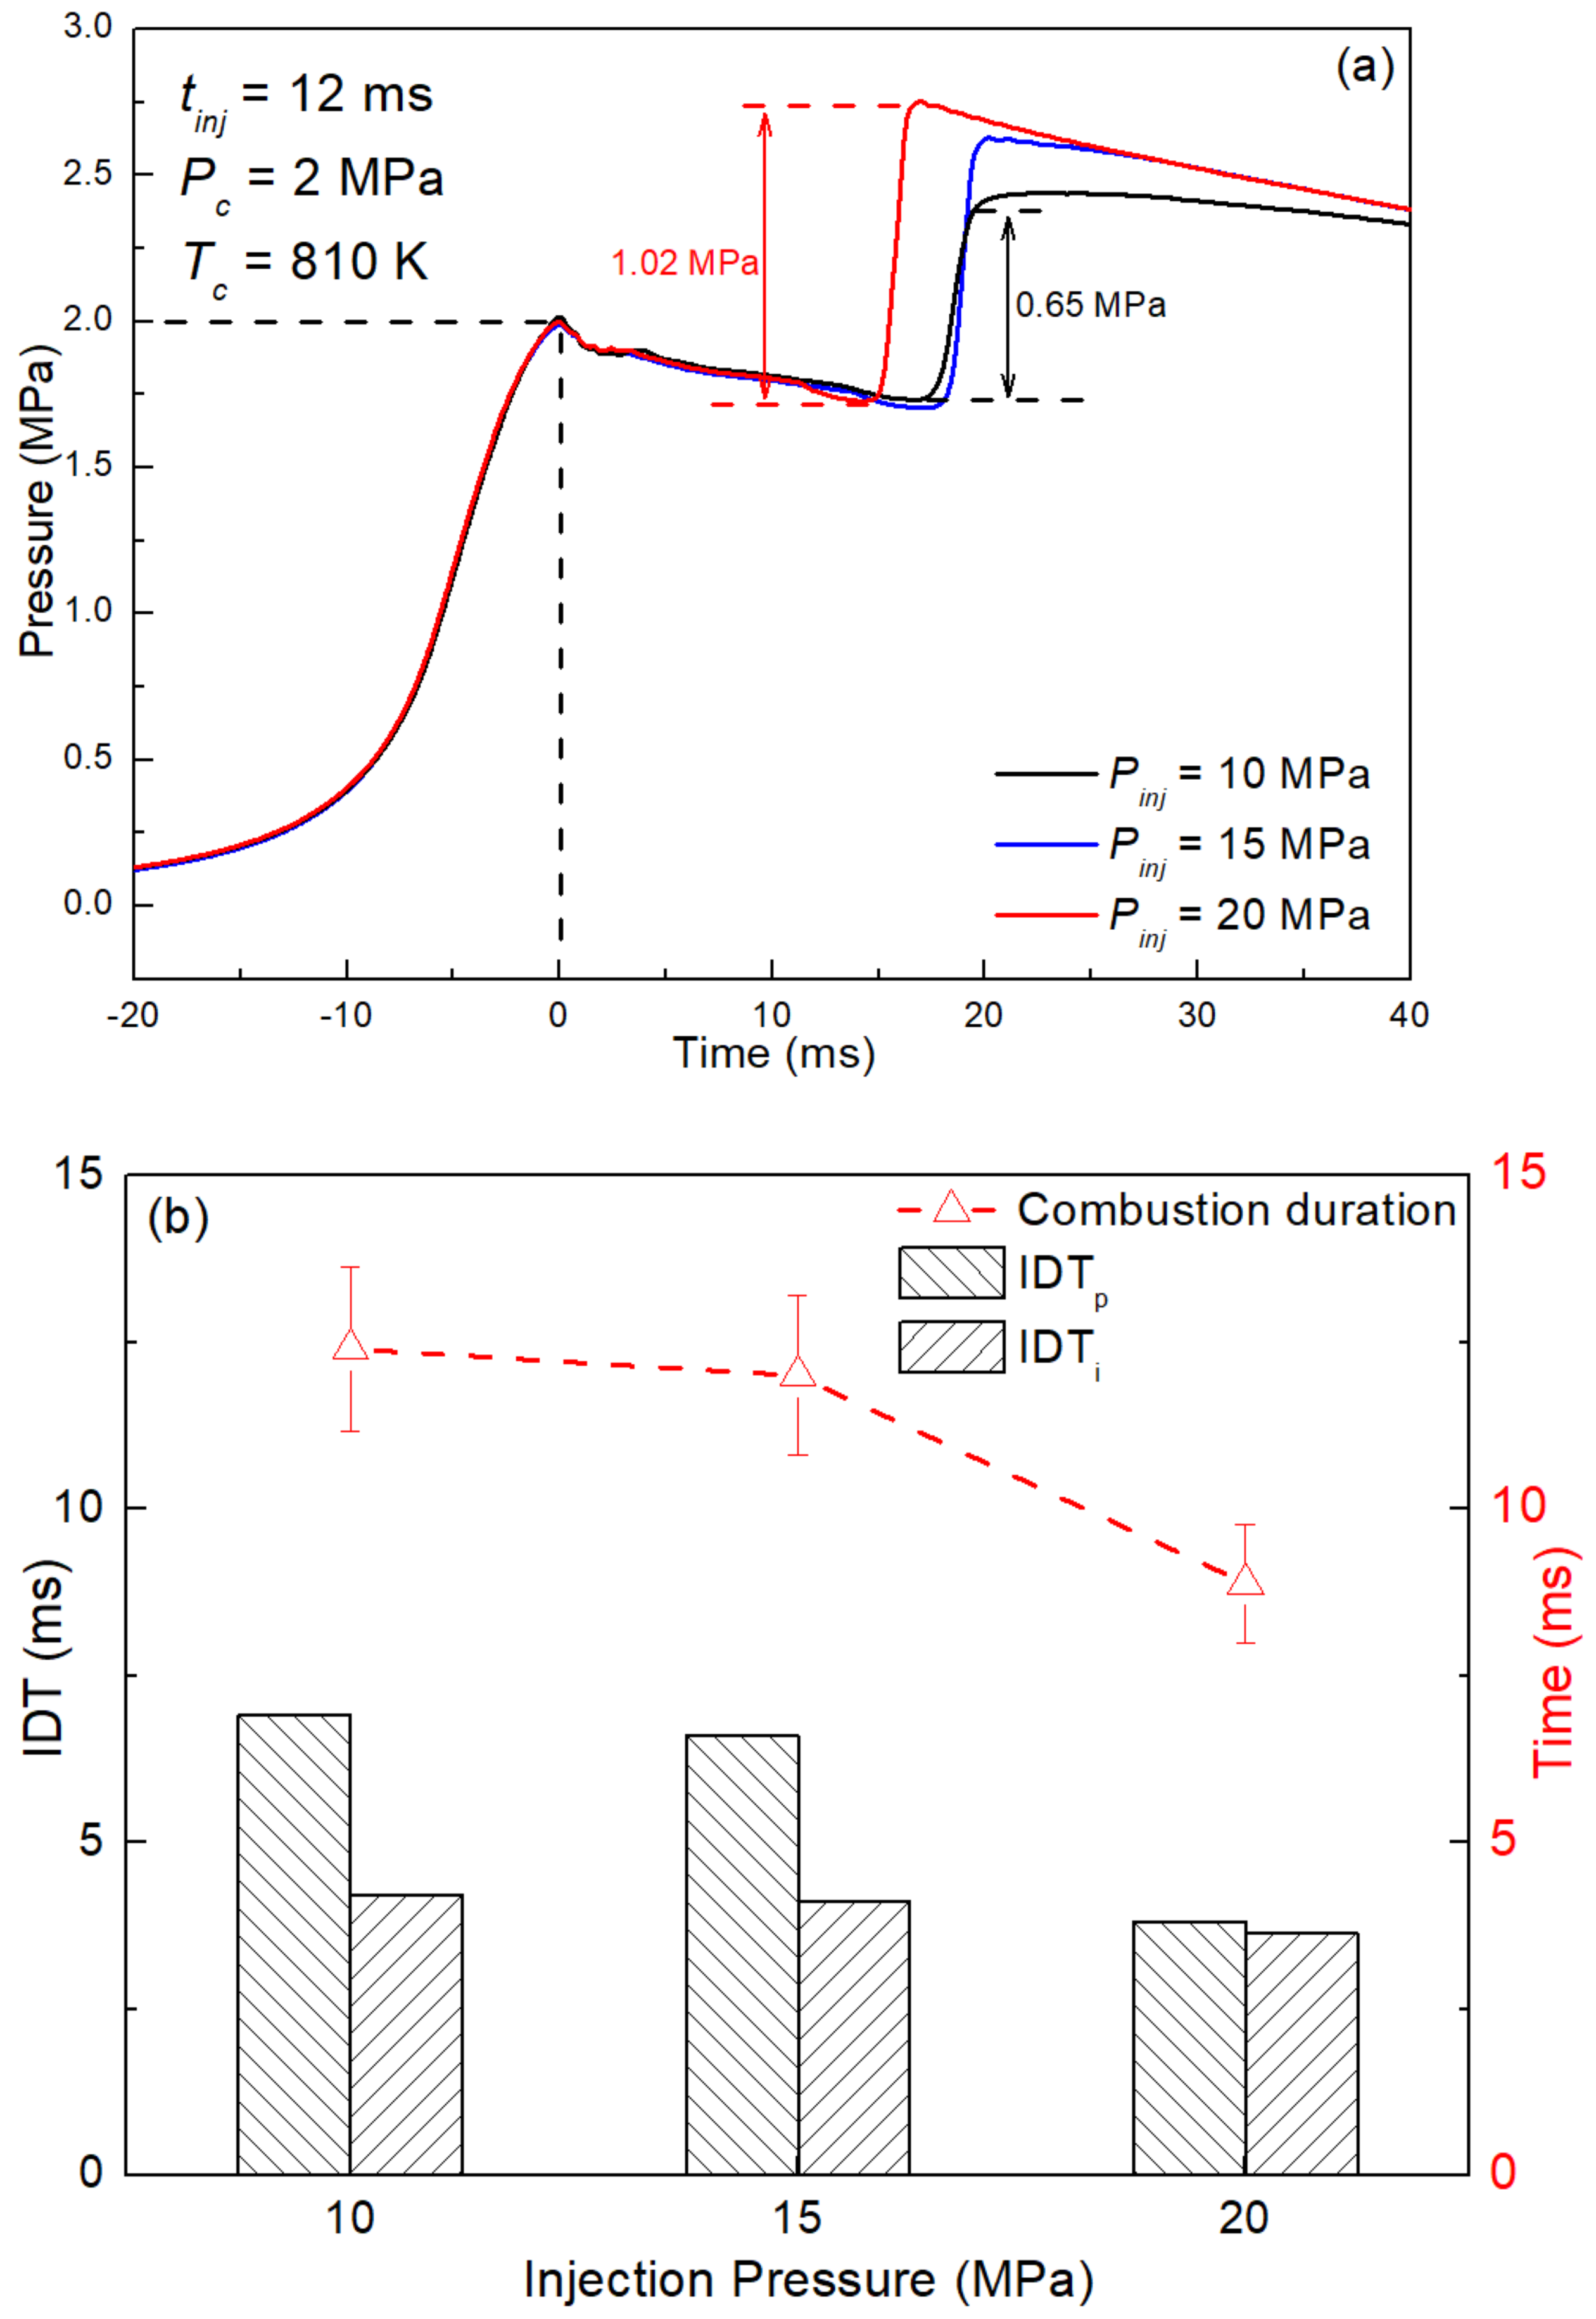
In this section, the effects of injection parameters are discussed. Figure 8a shows three tests with injection pressures ranging from 10 MPa to 20 MPa. All the pressure histories overlapped well before the injection, and all the traces began to rise to the peak pressure as the reactions proceeded. We note that the pressuring rates of the traces were similar, but their individual pressure increases were different from each other. Generally, high injection pressure achieves longer spray tip penetration and helps evaporation. Thus, the test with high injection pressure will have a greater increase of pressure as more vaporized fuel is ignited and combusted, which is consistent with the present experiment. The IDTs of these tests were also investigated, as shown in Figure 8b; little difference was observed, especially in IDTi, which indicates that injection pressure was not the leading factor for the formation of a flame kernel at this condition. To prove whether the influence of injection pressure on the IDT is weak, comprehensive study in the future is proposed. However, limited by the current variation range of injection pressure, another key combustion parameter, namely, combustion duration, was used here to evaluate the effect of injection pressure. Combustion duration is defined by the time interval from the flame kernel to the extinguishment of the flame, and its uncertainty (10%) mainly comes from the identification of flame extinguishment. Combustion duration showed a decreasing trend with the increase of injection pressure, which indicated that high injection pressure contributes to better blending of the fuel and oxygen and fast flame propagation. This is also shown in Figure 8a, namely, that pressure traces with higher injection pressure dropped more quickly after the rapid pressure increase.
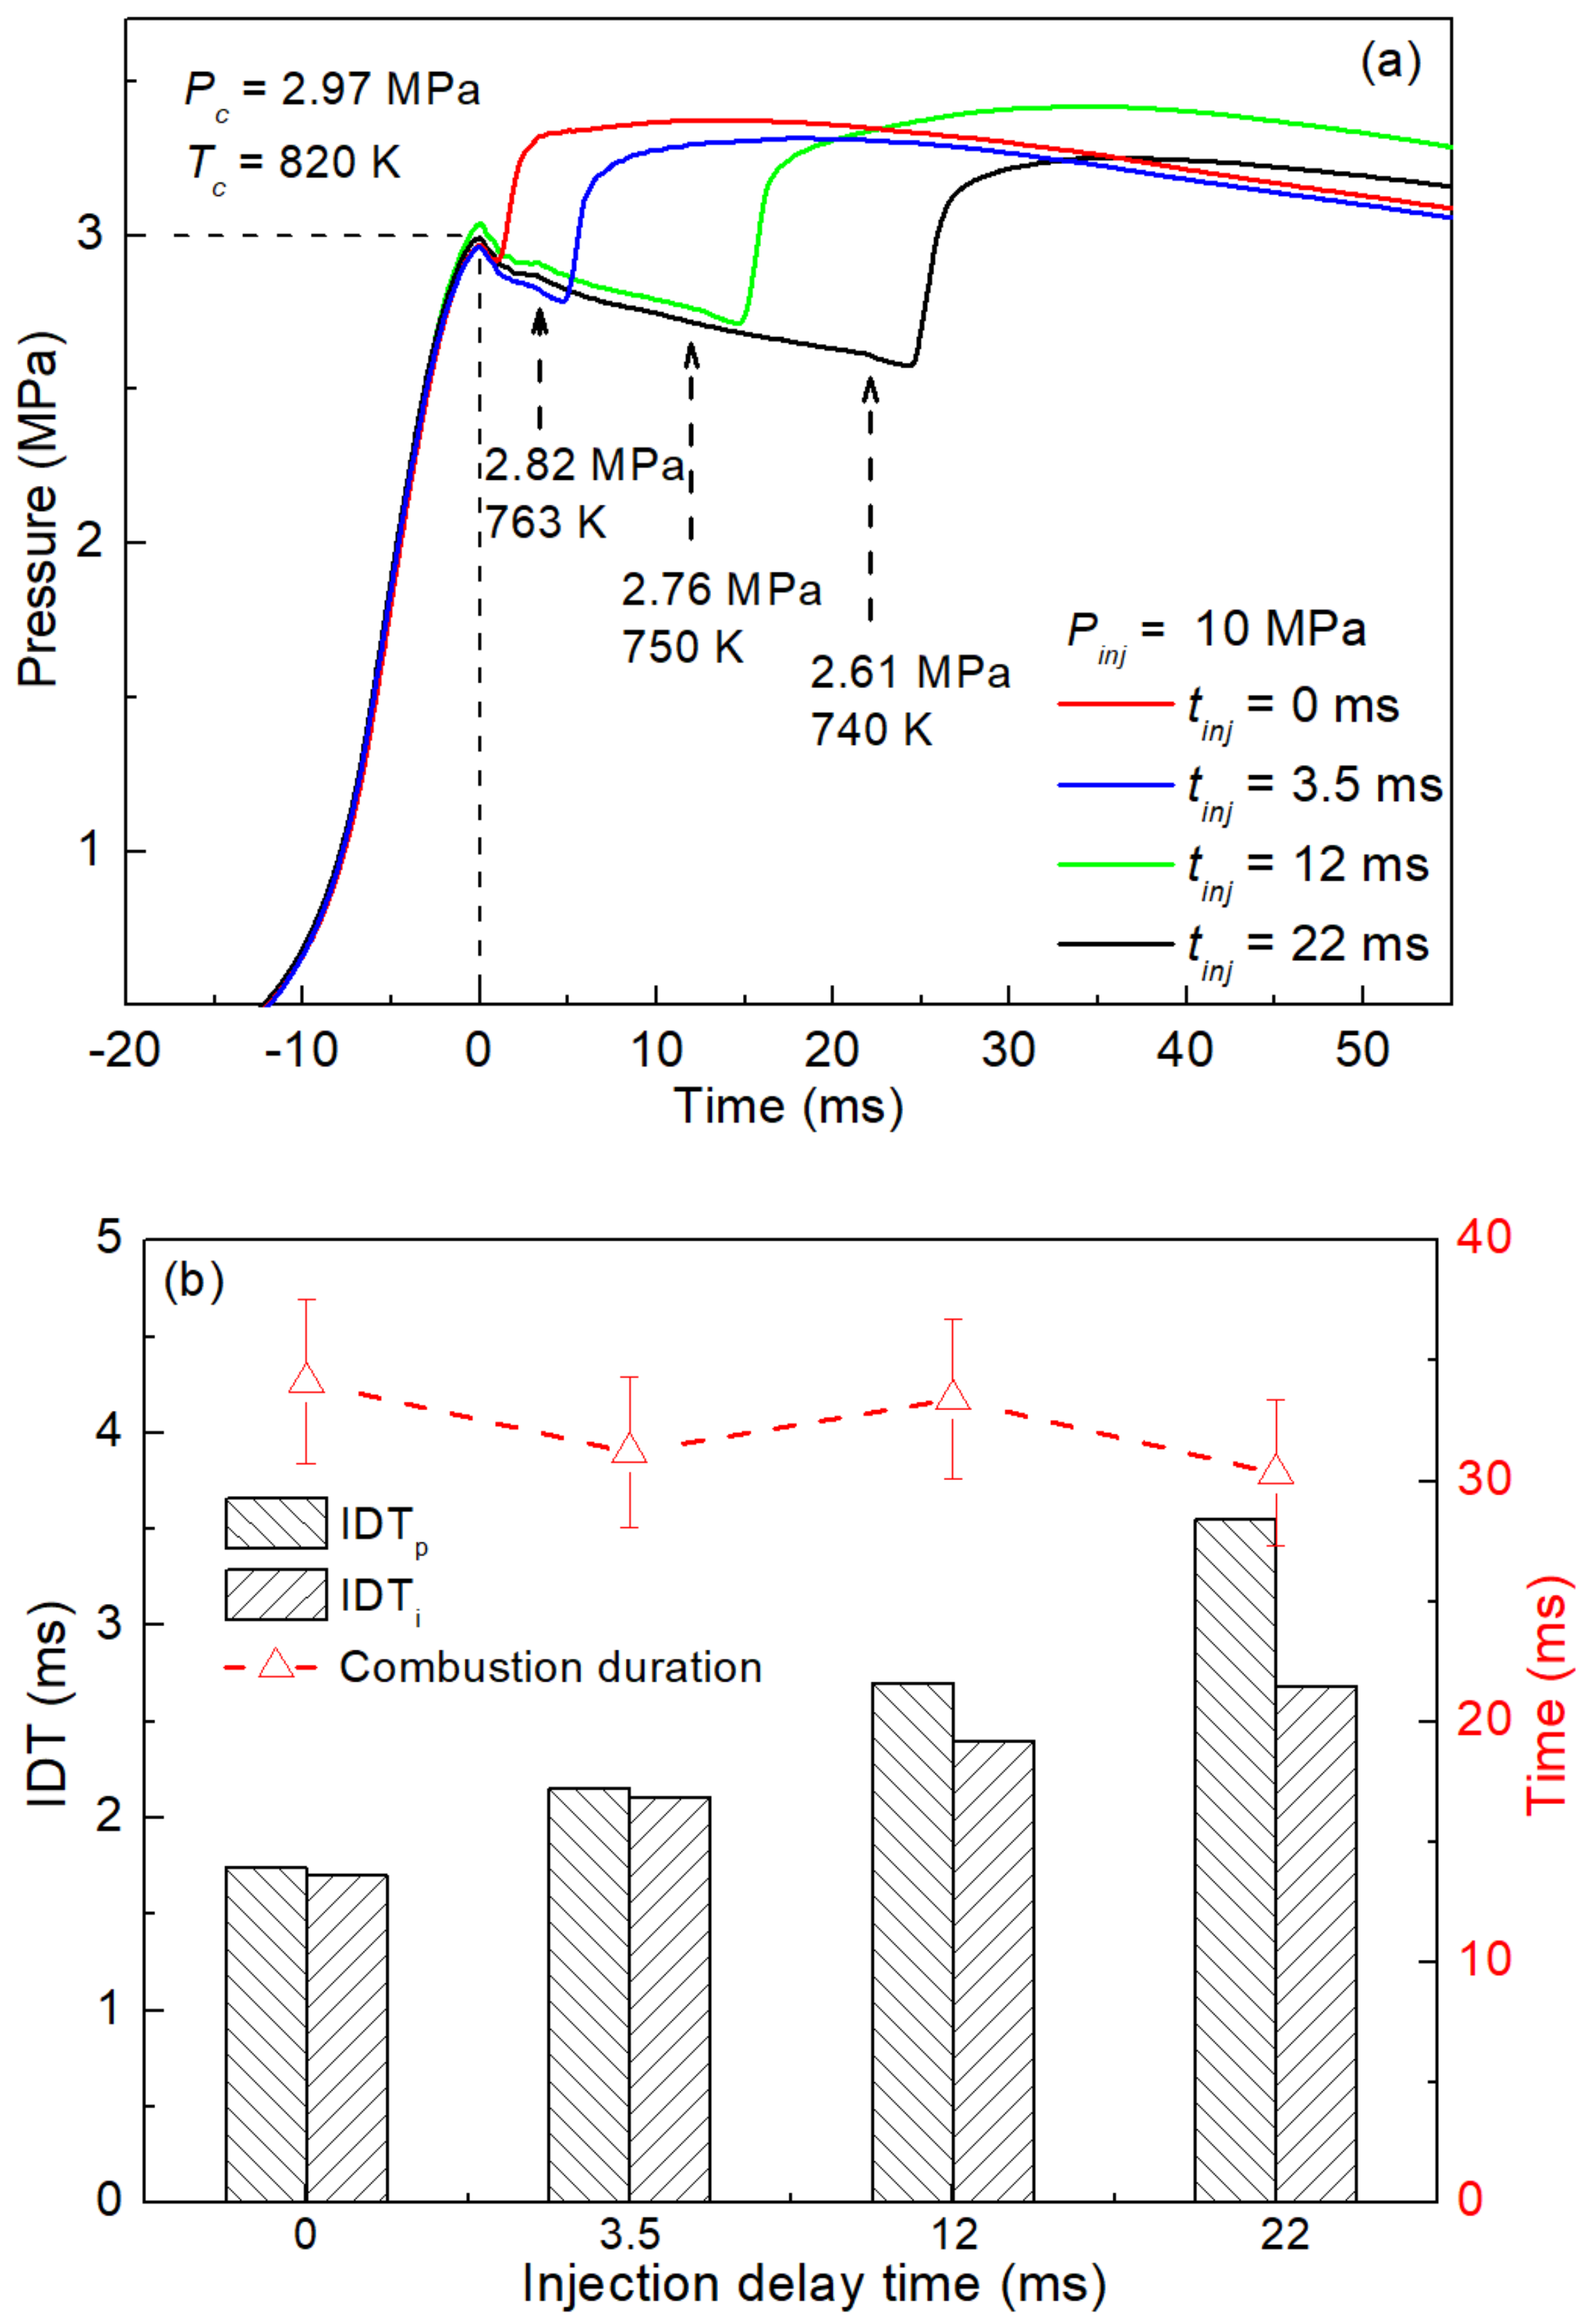
Figure 9a shows four tests under different injection delay times with other conditions being equal, and all the pressure histories experienced a slow increase after the rapid pressure rise. The reason for this phenomenon is the combustion of a small amount of fuel that was not fully vaporized until later on. From these tests under different ambient environments, it could be speculated that the fuel vaporization and blending with oxygen mainly depends on the injection pressure. As for the effect of injection delay, it is essentially the combination of effects of pressure and temperature. After the EOC, the chamber pressure and temperature decreased continuously due to heat loss. Then the fuel was injected into the chamber, and the decrease of pressure became a bit faster, as fuel vaporization is an endothermic process. For the most delayed case, the pressure decreased from 2.97 MPa to 2.61 MPa during the EOC to the injection (t = 22 ms), and the temperature was estimated to decrease from 820 K to 740 K simultaneously. The quantitative comparisons in terms of IDTs and combustion durations are shown in Figure 9b; the IDTi was shorter than IDTp for all the cases, and both became longer when the injection was more delayed. It is straightforward that low temperature and low pressure inhibited the fuel reactivity and retarded the pressure increase rate. However, the trend of combustion duration was unclear; when the IDTs became longer, there was more time for fuel vaporization before the ignition, which was beneficial for flame propagation and offset the effect of heat loss. This non-monotonic effect is worth further study in the future.
3.3. Heat Release Rate of Spray Combustion at Different Conditions
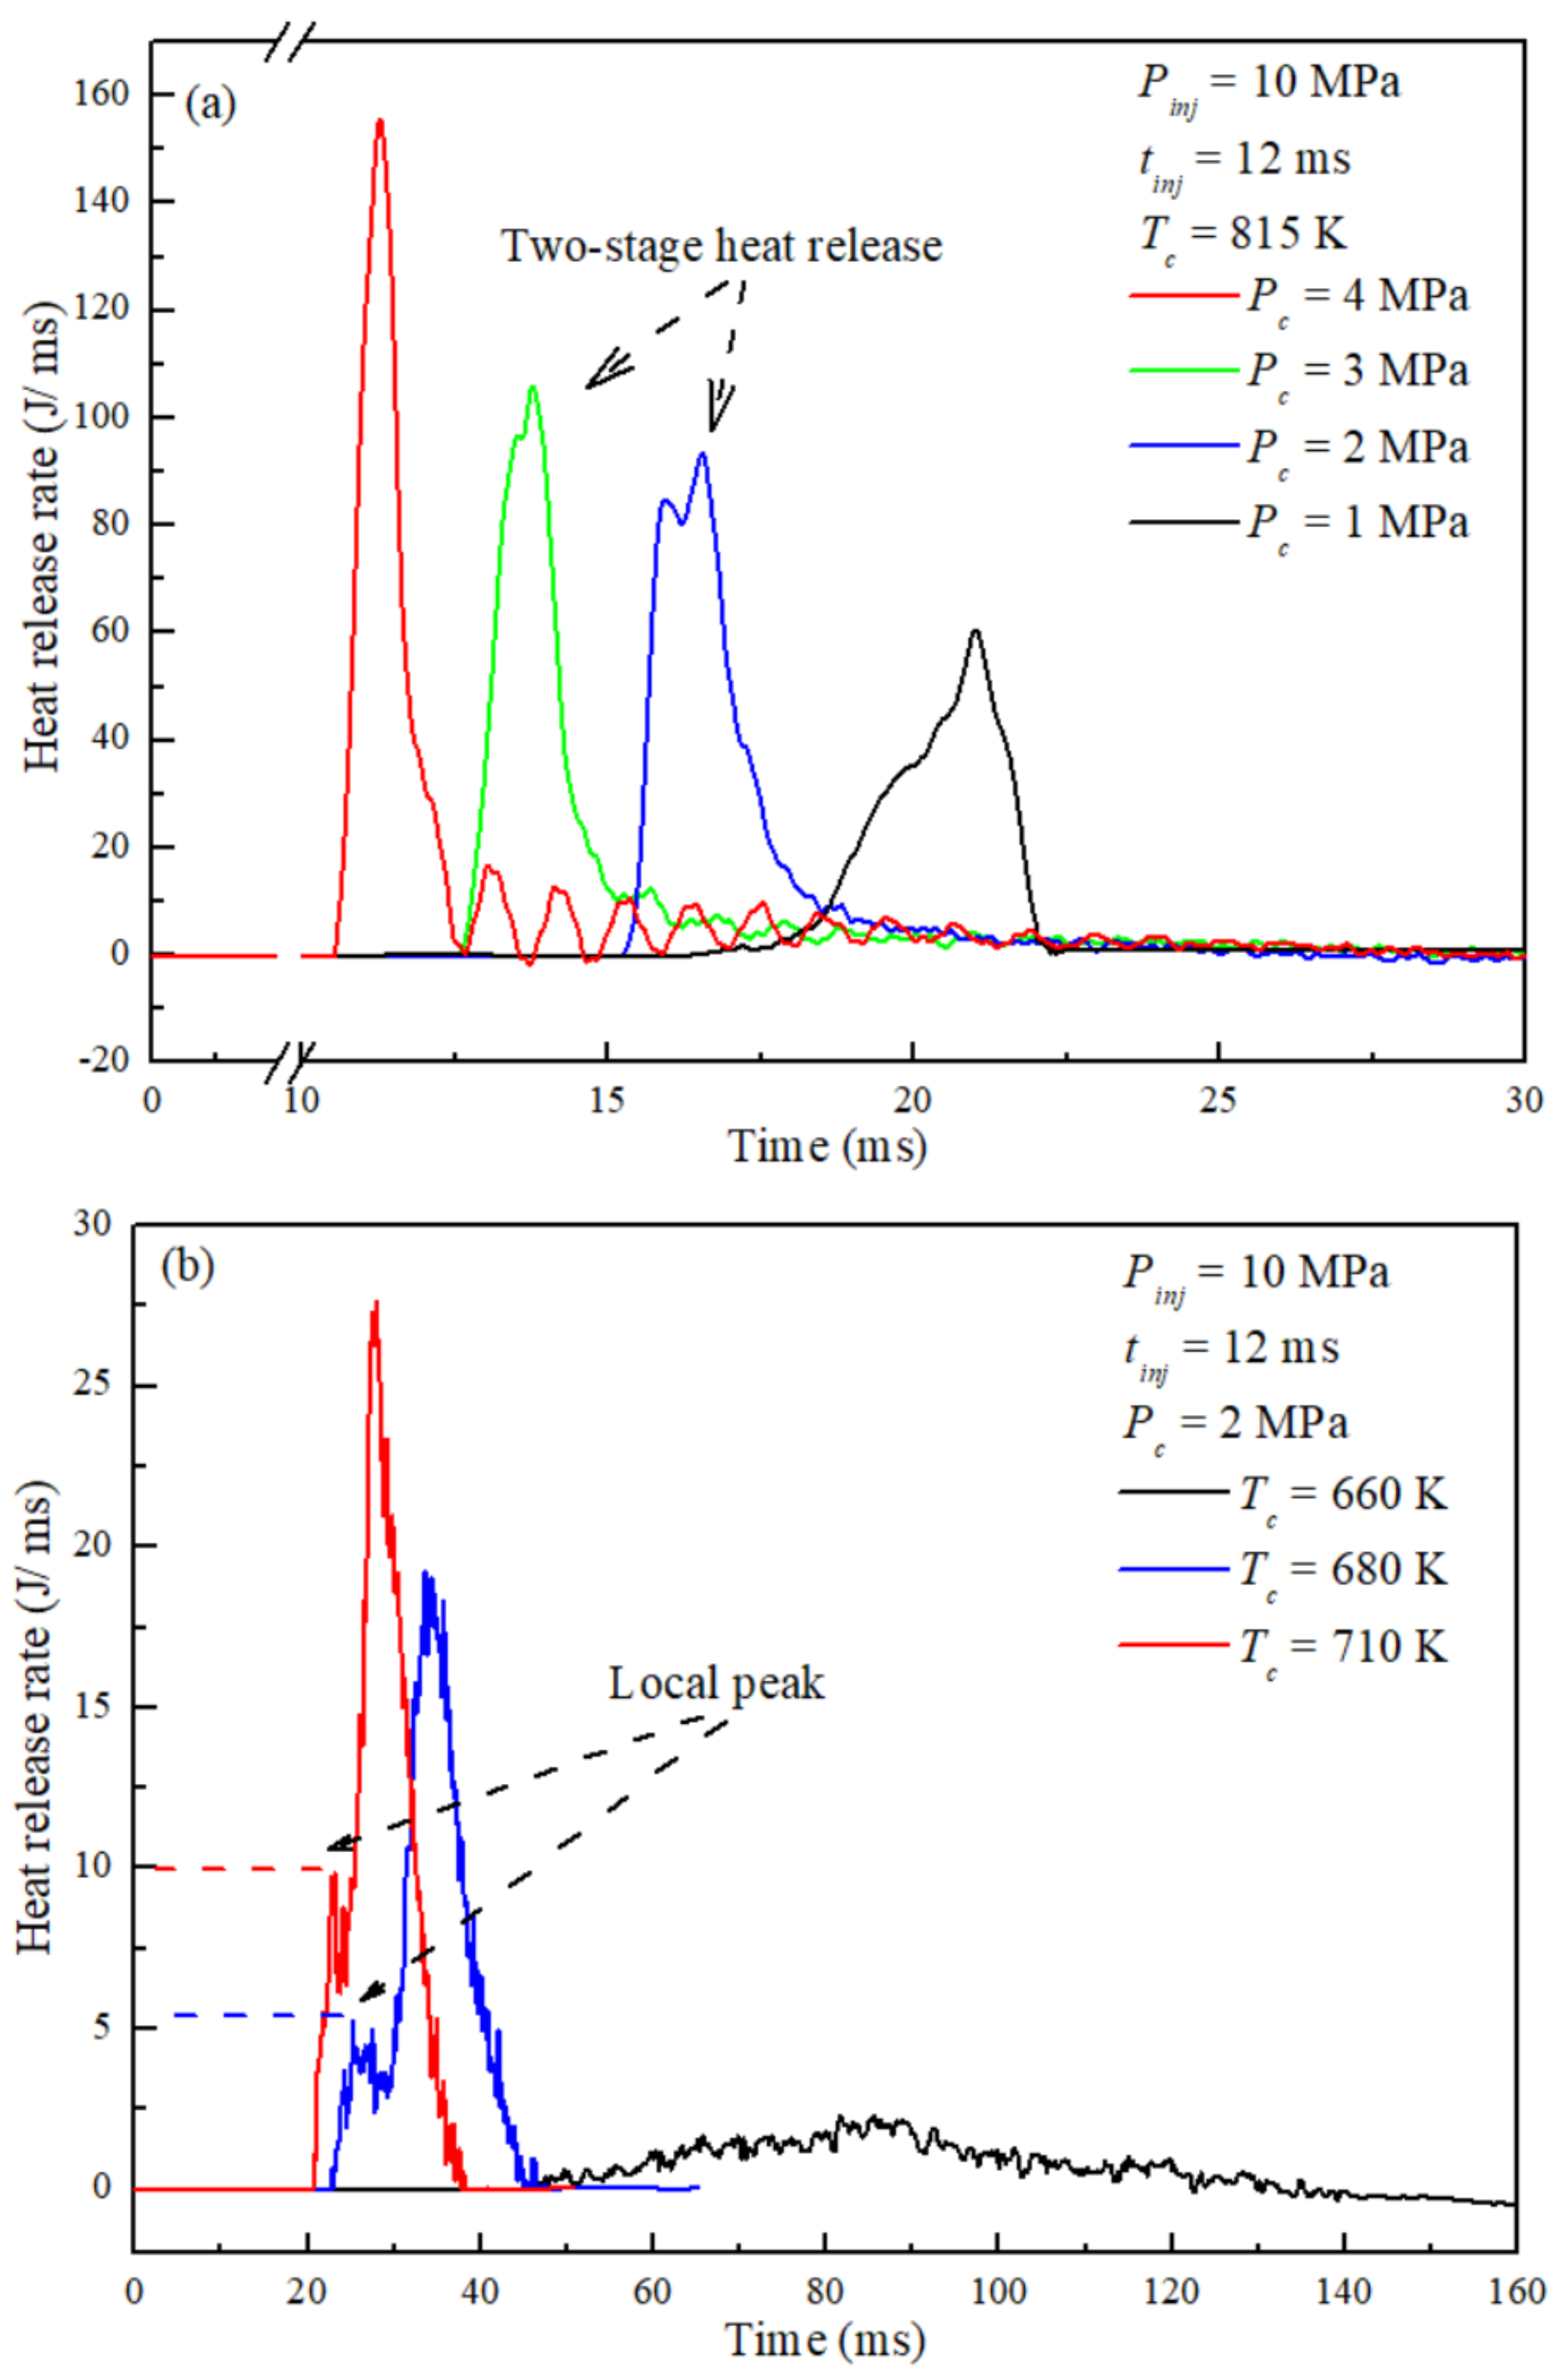
Figure 10 shows the calculated HRR through Equation (2) and the measured dynamic pressures at different EOC conditions. All the HRR traces maintained zero before the ignition and soared to the peak during the flame propagation. This trend of HRR history is consistent with the pressure evolution, and the peak value of HRR appeared during the rapid pressurizing period. Because the fuel spray was not fully combusted during the rapid pressure rise, the remaining fuel was then ignited afterwards, which caused several increases. As seen in Figure 10a, the highest peak of HRR was observed at the highest EOC pressure test, as the fuel reactivity was the strongest at this condition, and the attenuate trend after the peak value indicated that part of the fuel was later ignited because of the local equivalence ratio difference. With the decrease in EOC pressure, the decrease of fuel reactivity resulted in a longer IDT, which enables fuel to mix better with oxygen; thus, most of the fuel was combusted during the pressurizing period, and the attenuated trend in HRR history was less obvious. Additionally, the two-stage heat release phenomenon was found to be more prominent in lower EOC pressure tests, which is speculated to be related to the negative temperature coefficient (NTC) behavior of RP-3 kerosene. For many hydrocarbon fuels, there is a temperature region where the IDT increases with the temperature rise, and two types of chain-branching reactions result in a two-stage heat release; this temperature region is called the NTC region and is related to the equivalence ratio and the pressure. The NTC region of gas-phase RP-3 kerosene was measured to range around 750 K to 850 K by Mao et al. [20], and it shrinks when the pressure rises because of the enhancement of reactivity for all the reactions [40]. This illustrates that the two-stage heat release phenomenon became less obvious in the higher pressure test, as observed. As seen in Figure 10b, three tests with different EOC temperatures were compared; the peak value of the HRR history decreased with the decrease in temperature from 710 K to 680 K, and the local peak value of the first stage heat release also dropped from 10 J/ms to 5 J/ms. For the lowest temperature test, the HRR maintained less than 5 J/ms, which is consistent with its very weak ignition and combustion performance. The total heat release could be induced from the time integration of HRR, and the theoretical ideal heat release could be calculated from the lower heating value and the injection mass of RP-3, which are provided in Table 2 and Table 3. For the tests shown in Figure 10, when the EOC pressure was enhanced from 1 MPa to 4 MPa, the combustion efficiency was estimated to range from 20% to 30%. Furthermore, when the EOC temperature increased from 660 K to 710 K, the combustion efficiency was enhanced 5% to 25%, which indicates that high pressure and temperature conditions are conducive to complete fuel combustion.
3.4. Ignition Intensity Region and Ignition Delay Time Correlation for RP-3 Kerosene Spray
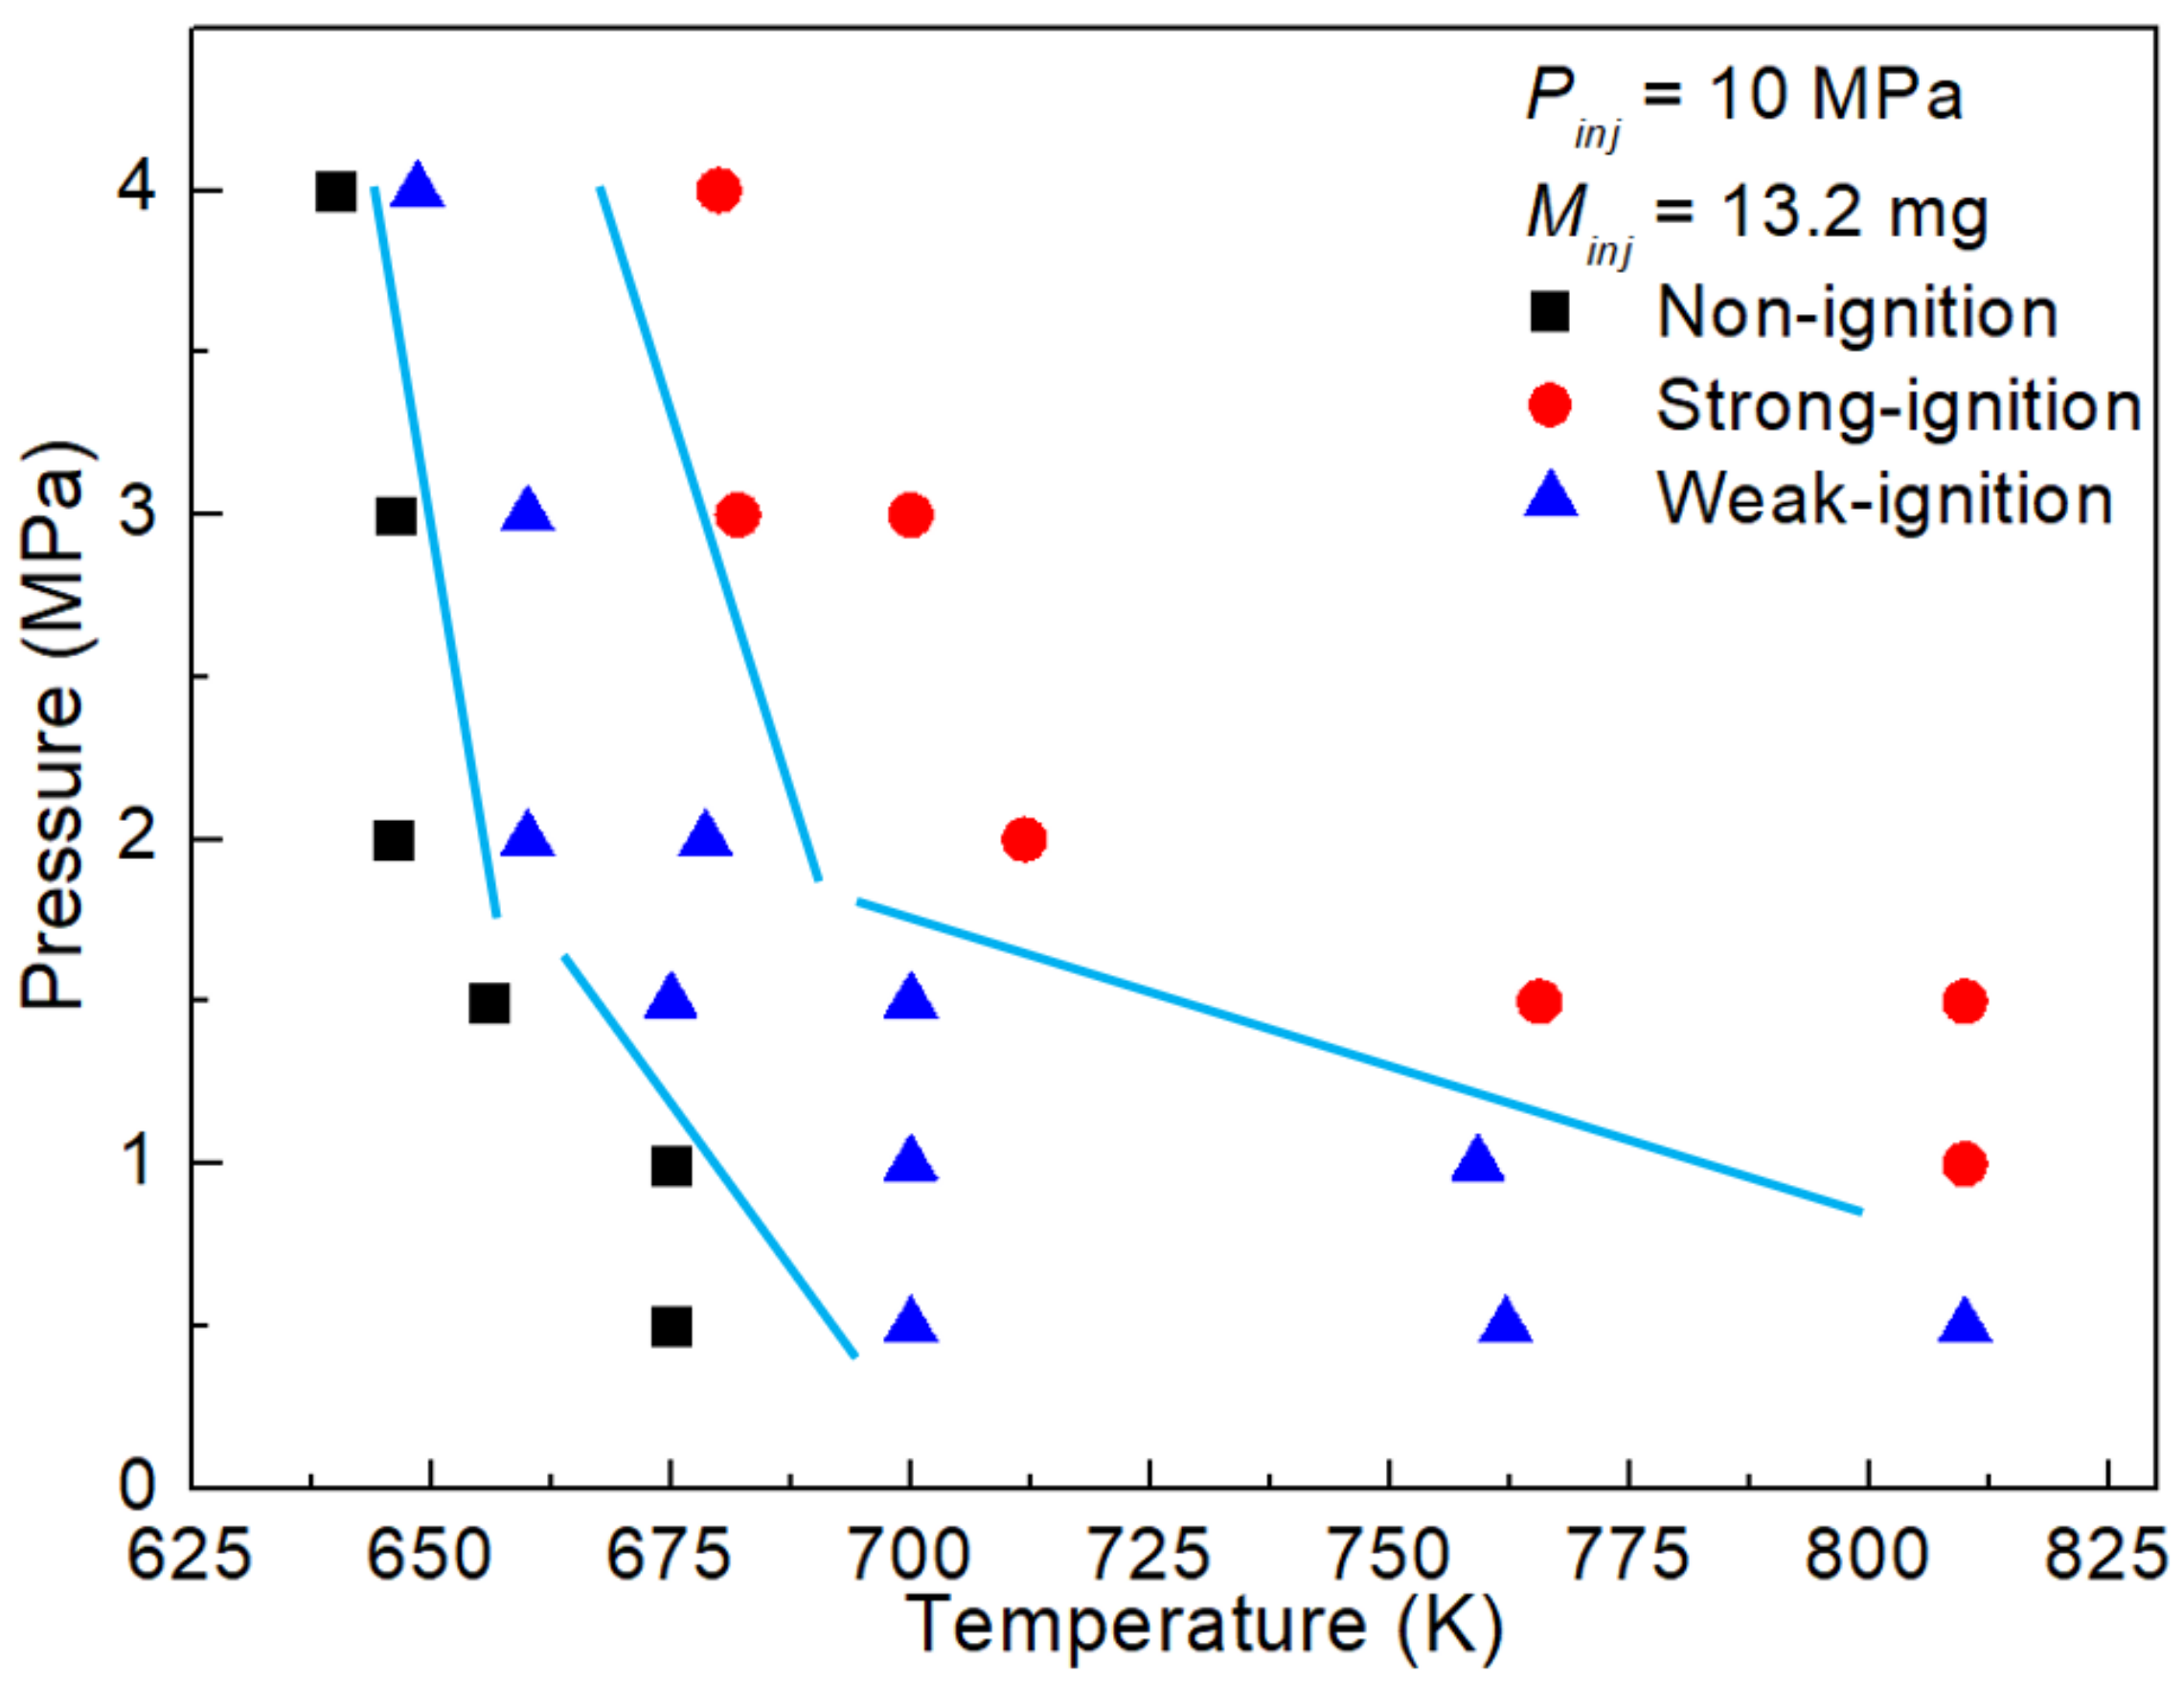
The experimental distributions of the IDTs for RP-3 spray are the most reliable database for validating spray combustion models. Based on the tests conducted in this study, the ignition performance of RP-3 spray is strongly related to the temperature and pressure of the environment. Furthermore, among the ignited tests, tardy pressure increases and small amounts of total heat release were found to have much longer IDTs; thus, a threshold of 15 ms for IDTi was empirically set here to distinguish the weak ignition from the strong ignition. Then the ignition performance of RP-3 spray could be classified into non-ignition, strong ignition, and weak ignition according to the thermodynamic state at the timing of injection, and three videos of typical tests are given in Supplementary Materials S2. Figure 11 shows the auto-ignition performance of RP-3 kerosene of the tests with the injection pressure of 10 MPa; the strong ignition shifts to weak ignition and finally turns into non-ignition with the decrease of temperature and pressure. Based on the trends concluded in the previous section, with the increase of the injection pressure, the fuel spray is ignited easier because of the better blending of fuel and oxygen, so the weak-ignition region will move towards the region of lower temperature and pressure.
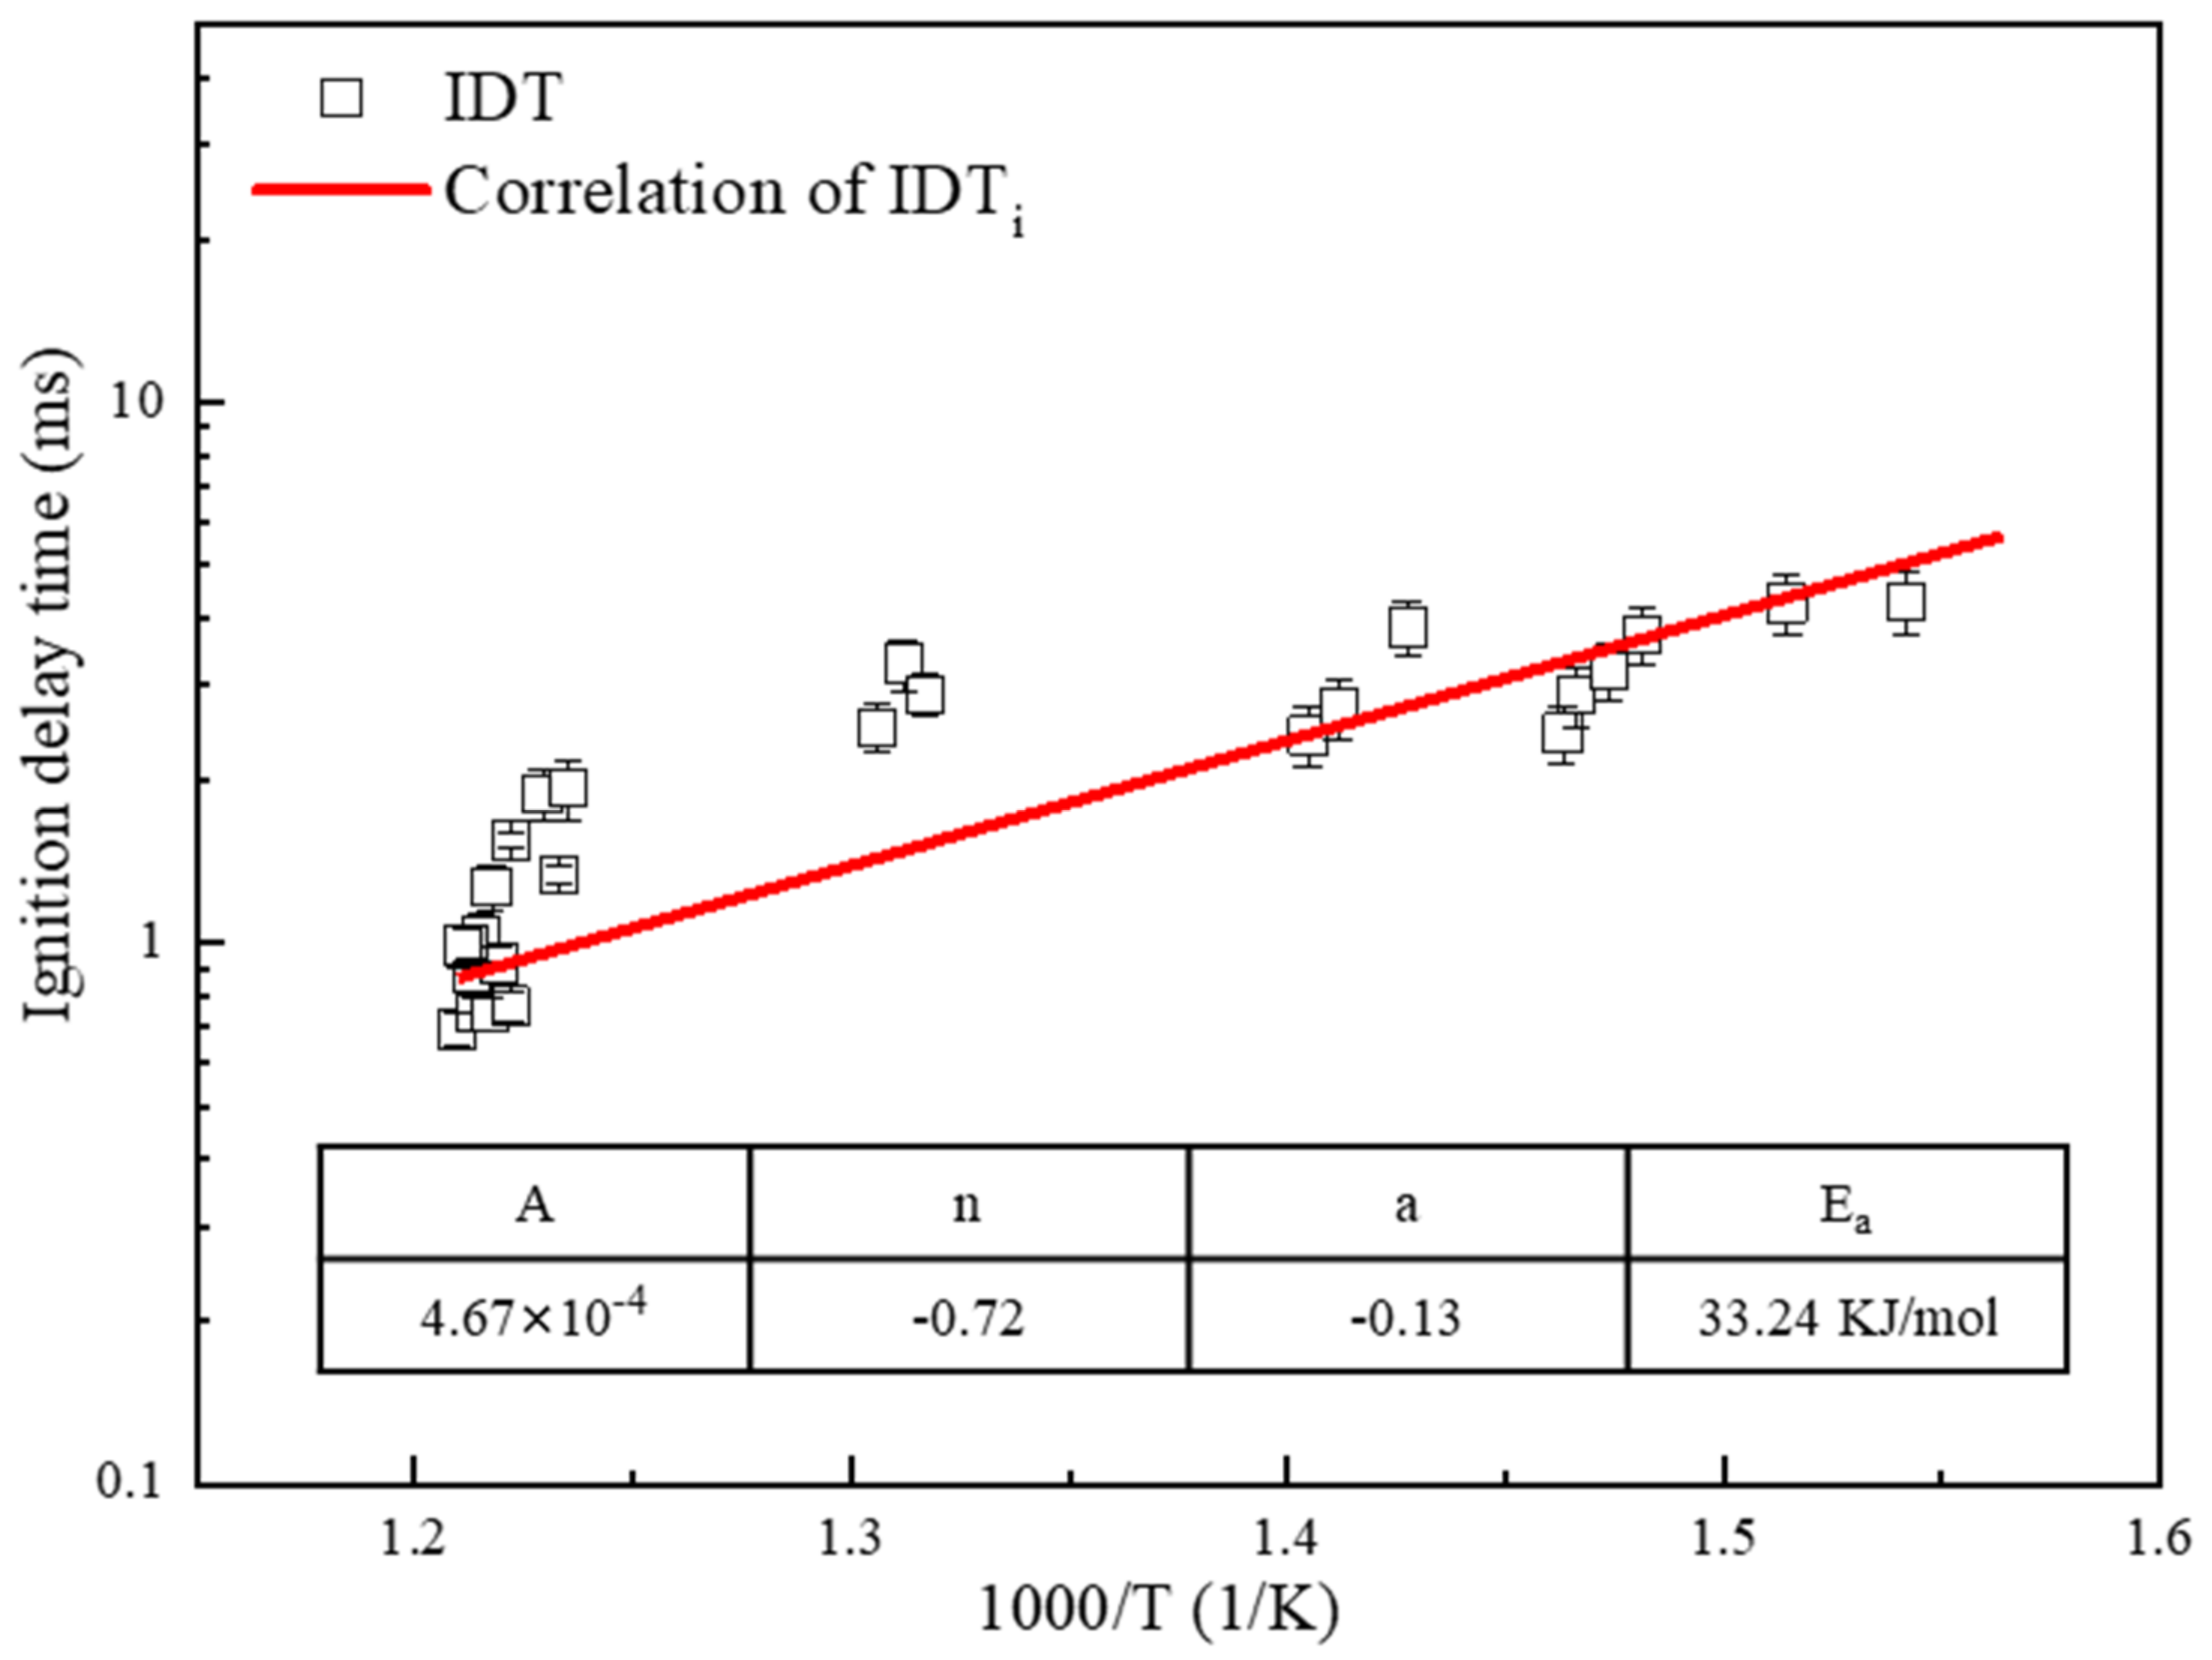
To further study the relative sensitivity of IDT to individual parameters, the distribution of IDT in the present paper was characterized through a multiple linear regression correlation. This correlation analysis is widely used for engine simulation because it provides the opportunity to compare the results measured in different conditions. Assuming the IDT outside the non-ignition region is power-law-dependent on the Pc and Pinj, Arrhenius type dependence on Tc, correlation expression can be described by Equation (3):
The correlation results are shown in Figure 12 with the correlation coefficient R2 of 0.92. Note the expression showed an injection pressure exponent of −0.13; its absolute value is much lower than that of EOC pressure (−0.72), indicating that the sensitivity of IDT to EOC pressure is much stronger than the injection pressure. A similar effect of EOC pressure was also found in the study of Mao et al. (−0.71) [20] and Zhukov et al. (−0.67) [41], which proved that chemical reactions were mainly accelerated by the EOC pressure. The value of the global activation energy (Ea) of premixed gas mixtures, which is determined by the slope of IDT correlation in Arrhenius plot, represents the sensitivity of the IDT to the temperature. This value derived from the present correlation was 33.24 kJ/mol, which is close to the 32.62 kJ/mol of spray RP-3 in the crossflow reported by Zhang et al. [42], but much less than the 92.19 kJ/mol and 91.7 kJ/mol of gas-phase RP-3 derived by Mao et al. [20] and Zhang et al. [22], respectively. This suggests that the sensitivity of IDT to the temperature for non-premixed fuel spray is weaker than that for premixed gaseous fuel. As the IDT is also influenced by the breakup of liquid fuel and the global equivalence ratio, future research work requires more emphasis on the injection mass and injection width.
4. Conclusions
In this study, RP-3 kerosene at different engine-relevant conditions was tested in an RCM. Based on the recorded pressure history and images of the combustion process, good ignitability of RP-3 kerosene was proved even at a relatively low compression ratio. Multiple factors were found to influence the ignition and combustion performance of RP-3 kerosene spray, and the effects of ambient environment, injection pressure and injection delay were investigated individually. The main conclusions are summarized as follows:
- (1)
- The combustion process shows that the flame kernel is already formed before the rapid pressure increase, and then the maximum pressurizing rate appears, so the IDTi is shorter than IDTp for all cases. After the rapid pressure increase, the pressure reaches the peak value through a slow increasing of pressure, and the duration of this slow increase is longer in tests with lower injection pressure.
- (2)
- With higher ambient temperature or higher ambient pressure, the fuel reactivity is enhanced, and the IDTs will be shortened. Compared to weak ignition, strong ignition tests have greater pressurizing rates and maximum pressure; their flame is also brighter and has a quicker propagation speed.
- (3)
- Higher injection pressure is beneficial to the spray vaporization and blending with the oxygen, which helps shorten the combustion duration physically. Little effect of injection pressure on flame kernel formation was observed in this study, while longer injection delay will slightly increase the IDT due to the heat loss. Furthermore, the relation between injection delay and combustion duration is non-monotonic; longer injection delay allows better vaporization but also increases the heat loss, which requires further study.
- (4)
- The peak value of the HRR history appears during the rapid pressurizing period, and a two-stage heat release phenomenon was observed in the NTC region. Higher temperature and pressure are conducive to the complete combustion of fuel spray.
- (5)
- Based on the present tests, the ignition intensity region is determined, and the IDT correlation is derived. The correlation shows that the IDT of non-premixed fuel spray has a greater dependence on the ambient pressure than the injection pressure, and the IDT sensitivity to the temperature of the premixed gaseous fuel is stronger than that of the fuel spray.
Supplementary Materials
The following supporting information can be downloaded at: https://www.mdpi.com/article/10.3390/machines10080601/s1, Supplementary Materials S1: Experimental condition and pressure history, Supplementary Materials S2: Videos of RP-3 spray different ignition patterns.
Author Contributions
Z.M. and Y.L.: Investigation, Data curation, Writing—original draft; C.T.: Conceptualization, Funding acquisition, Writing—review and editing. Z.H. Discussion. All authors have read and agreed to the published version of the manuscript.
Funding
This work is supported by the National Natural Science Foundation of China (91941101 and 51722603), and the Fundamental Research Funds for the Central Universities.
Institutional Review Board Statement
Not applicable.
Informed Consent Statement
Not applicable.
Acknowledgments
The authors would like to thank the editors and reviewers for their valuable comments on this research.
Conflicts of Interest
The authors declare that they have no known competing financial interests or personal relationships that could have appeared to influence the work reported in this paper.
References
- Goh, G.D.; Agarwala, S.; Goh, G.L.; Dikshit, V.; Sing, S.L.; Yeong, W.Y. Additive Manufacturing in Unmanned Aerial Vehicles (UAVs): Challenges and Potential. Aerosp. Sci. Technol. 2017, 63, 140–151. [Google Scholar] [CrossRef]
- Pickett, L.M.; Laura, H. Fundamental Spray and Combustion Measurements of JP-8 at Diesel Conditions. SAE Int. J. Commer. Veh. 2008, 1, 108–118. [Google Scholar] [CrossRef]
- Fernandes, G.; Fuschetto, J.; Filipi, Z.; Assanis, D.; McKee, H. Impact of Military JP-8 Fuel on Heavy-duty Diesel Engine Performance and Emissions. Proc. Inst. Mech. Eng. Part D 2007, 221, 957–970. [Google Scholar] [CrossRef]
- Gowdagiri, S.; Cesari, X.M.; Huang, M.; Oehlschlaeger, M.A. A Diesel Engine Study of Conventional and Alternative Diesel and Jet Fuels: Ignition and Emissions Characteristics. Fuel 2014, 136, 253–260. [Google Scholar] [CrossRef]
- Lee, J.; Bae, C. Application of JP-8 in a Heavy Duty Diesel Engine. Fuel 2011, 90, 1762–1770. [Google Scholar] [CrossRef]
- Kumar, P.A.; Nandgaonkar, M.R. Lubricants, Performance, Emission and Pump Wear Analysis of JP-8 Fuel for Military Use on a 558 kW, CIDI Diesel Engine. SAE Int. J. Fuels Lubr. 2010, 3, 238–245. [Google Scholar]
- Zhang, C.; Hui, X.; Lin, Y.; Sung, C.-J. Recent Development in Studies of Alternative Jet Fuel Combustion: Progress, Challenges, and Opportunities. Renew. Sustain. Energy Rev. 2016, 54, 120–138. [Google Scholar] [CrossRef] [Green Version]
- Chen, L.; Ding, S.; Liu, H.; Lu, Y.; Li, Y.; Roskilly, A.P. Comparative Study of Combustion and Emissions of Kerosene (RP-3), Kerosene-pentanol Blends and Diesel in a Compression Ignition Engine. Appl. Energy 2017, 203, 91–100. [Google Scholar] [CrossRef] [Green Version]
- Chen, L.; Liang, Z.; Liu, H.; Ding, S.; Li, Y. Sensitivity Analysis of Fuel Types and Operational Parameters on the Particulate Matter Emissions from an Aviation Piston Engine Burning Heavy Fuels. Fuel 2017, 202, 520–528. [Google Scholar] [CrossRef]
- Groendyk, M.; Rothamer, D. Effect of Increased Fuel Volatility on CDC Operation in a Light-duty CIDI Engine. Fuel 2017, 194, 195–210. [Google Scholar] [CrossRef]
- Lu, Y.; Pan, J.; Fan, B.; Otchere, P.; Chen, W.; Cheng, B. Research on the Application of Aviation Kerosene in a Direct Injection Rotary Engine-Part 1: Fundamental Spray Characteristics and Optimized Injection Strategies. Energy Convers. Manag. 2019, 195, 519–532. [Google Scholar] [CrossRef]
- Lu, Y.; Pan, J.; Fan, B.; Otchere, P.; Chen, W.; Cheng, B. Research on the Application of Aviation Kerosene in a Direct Injection Rotary Engine-Part 2: Spray Combustion Characteristics and Combustion Process under Optimized Injection Strategies. Energy Convers. Manag. 2020, 203, 112217. [Google Scholar] [CrossRef]
- Li, B.; Wang, Y.; Long, W.; Zhu, J.; Tian, J.; Cui, J.; Wang, Y. Experimental Research on the Effects of Kerosene on the Pre-injection Spray Characteristics and Engine Performance of Dual-direct Injection Diesel Jet Controlled Compression Ignition Mode. Fuel 2020, 281, 118691. [Google Scholar] [CrossRef]
- Ning, L.; Duan, Q.; Wei, Y.; Zhang, X.; Yang, B.; Zeng, K. Experimental Investigation on Combustion and Emissions of A Two-stroke DISI Engine Fueled with Aviation Kerosene at Various Compression Ratios. Fuel 2020, 259, 116224. [Google Scholar] [CrossRef]
- Liu, G.; Ruan, C.; Li, Z.; Huang, G.; Zhou, Q.; Qian, Y.; Lu, X. Investigation of Engine Performance for Alcohol/Kerosene Blends as in Spark-ignition Aviation Piston Engine. Appl. Energy 2020, 268, 114959. [Google Scholar] [CrossRef]
- Zhao, J.; Zhao, B.; Wang, X.; Yang, X. Atomization Performance and TG Analysis of Fischer–Tropsch Fuel Compared with RP-3 Aviation Fuel. Int. J. Hydrogen Energy 2017, 42, 18626–18632. [Google Scholar] [CrossRef]
- Liu, C.; Liu, F.; Yang, J.; Mu, Y.; Hu, C.; Xu, G. Experimental Investigations of Spray Generated by a Pressure Swirl Atomizer. J. Energy Inst. 2019, 92, 210–221. [Google Scholar] [CrossRef]
- Wu, H.; Zhang, F.; Zhang, Z. Fundamental Spray Characteristics Of Air-assisted Injection System Using Aviation Kerosene. Fuel 2021, 286, 119420. [Google Scholar] [CrossRef]
- Liu, J.; Hu, E.; Zeng, W.; Zheng, W. A New Surrogate Fuel for Emulating the Physical and Chemical Properties of RP-3 Kerosene. Fuel 2020, 259, 116210. [Google Scholar] [CrossRef]
- Mao, Y.; Yu, L.; Wu, Z.; Tao, W.; Wang, S.; Ruan, C.; Zhu, L.; Lu, X. Experimental and Kinetic Modeling Study of Ignition Characteristics of RP-3 Kerosene over Low-to-high Temperature Ranges in a Heated Rapid Compression Machine and a Heated Shock Tube. Combust. Flame 2019, 203, 157–169. [Google Scholar] [CrossRef]
- Yang, Z.-Y.; Zeng, P.; Wang, B.-Y.; Jia, W.; Xia, Z.-X.; Liang, J.; Wang, Q.-D. Ignition Characteristics of an Alternative Kerosene from Direct Coal Liquefaction and Its Blends with Conventional RP-3 Jet Fuel. Fuel 2021, 291, 120258. [Google Scholar] [CrossRef]
- Zhang, C.; Li, B.; Rao, F.; Li, P.; Li, X. A Shock Tube Study of the Autoignition Characteristics of RP-3 Jet Fuel. Proc. Combust. Inst. 2015, 35, 3151–3158. [Google Scholar] [CrossRef]
- Zhang, C.; Zou, P.; Wang, B.; Xue, X.; Lin, Y.; Sung, C.-J. In Comparison of Flame Dynamics at Stable and Near-LBO Conditions for Swirl-Stabilized Kerosene Spray Combustion. In Proceedings of the ASME Turbo Expo 2015: Turbine Technical Conference and Exposition, Montreal, QC, Canada, 15–19 June 2015. [Google Scholar]
- Du, W.; Zhang, Q.; Li, M.; Hou, J. Ignition and Combustion Characteristics of Wall-impinged Kerosene (RP-3) Fuel Spray with Varying Injection Parameters. Therm. Sci. 2019, 24, 169. [Google Scholar] [CrossRef]
- Shi, Z.; Lee, C.-f.; Wu, H.; Wu, Y.; Zhang, L.; Liu, F. Optical Diagnostics of Low-temperature Iignition and Combustion Characteristics of Diesel/Kerosene Blends under Cold-start Conditions. Appl. Energy 2019, 251, 113307. [Google Scholar] [CrossRef]
- Wu, Y.; Yang, M.; Tang, C.; Liu, Y.; Zhang, P.; Huang, Z. Promoting “Adiabatic Core” Approximation in a Rapid Compression Machine by an Optimized Creviced Piston Design. Fuel 2019, 251, 328–340. [Google Scholar] [CrossRef]
- Liu, Y.; Tang, C.; Zhan, C.; Wu, Y.; Yang, M.; Huang, Z. Low Temperature Auto-ignition Characteristics of Methylcyclohexane/Ethanol Blend Fuels: Ignition Delay Time Measurement and Kinetic Analysis. Energy 2019, 177, 465–475. [Google Scholar] [CrossRef]
- Liu, Y.; Tang, C.; Wu, Y.; Yang, M.; Huang, Z. Low Temperature Ignition Delay Times Measurements of 1,3,5-trimethylbenzene by Rapid Compression Machine. Fuel 2019, 241, 637–645. [Google Scholar] [CrossRef]
- Yang, M.; Wu, Y.; Tang, C.; Liu, Y.; Huang, Z. Auto-ignition Behaviors of Nitromethane in Diluted Oxygen in a Rapid Compression Machine: Critical Conditions for Ignition, Ignition Delay Times Measurements, and Kinetic Modeling Interpretation. J. Hazard. Mater. 2019, 377, 52–61. [Google Scholar] [CrossRef]
- Zhan, C.; Tong, S.; Tang, C.; Huang, Z. The Spray Vaporization Characteristics of Gasoline/Diethyl Ether Blends at Sub-and Super-critical Conditions. Appl. Therm. Eng. 2020, 164, 114453. [Google Scholar] [CrossRef]
- Sun, W.; Huang, W.; Qin, X.; Deng, Y.; Kang, Y.; Peng, W.; Zhang, Y.; Huang, Z. Water Impact on the Auto-ignition of Kerosene/Air Mixtures under Combustor Relevant Conditions. Fuel 2020, 267, 117184. [Google Scholar] [CrossRef]
- Lee, D.; Hochgreb, S. Rapid Compression Machines: Heat Transfer and Suppression of Corner Vortex. Combust. Flame 1998, 114, 531–545. [Google Scholar] [CrossRef]
- Nasir, E.F.; Farooq, A. Time-resolved Temperature Measurements in a Rapid Compression Machine using Quantum Cascade Laser Absorption in the Intrapulse Mode. Proc. Combust. Inst. 2017, 36, 4453–4460. [Google Scholar] [CrossRef]
- Wu, Y.; Tang, C.; Yang, M.; Wang, Q.-d.; Huang, Z.; Zhao, P.; Curran, H.J. Evaluation of Non-ideal Piston Stopping Effects on the “Adiabatic Core” and Ignition Delay Time Simulation in Rapid Compression Machines. Combust. Flame 2020, 218, 229–233. [Google Scholar] [CrossRef]
- Goldsborough, S.S.; Santner, J.; Kang, D.; Fridlyand, A.; Rockstroh, T.; Jespersen, M.C. Heat Release Analysis for Rapid Compression Machines: Challenges and Opportunities. Proc. Combust. Inst. 2019, 37, 603–611. [Google Scholar] [CrossRef]
- Liu, C.; Song, H.; Zhang, P.; Wang, Z.; Wooldridge, M.S.; He, X.; Suo, G. A Rapid Compression Machine Study of Autoignition, Spark-ignition and Flame Propagation Characteristics of H2/CH4/CO/air Mixtures. Combust. Flame 2018, 188, 150–161. [Google Scholar] [CrossRef]
- Wang, M.; Kukkadapu, G.; Zhang, K.; Wagnon, S.W.; Mehl, M.; Pitz, W.J.; Westbrook, C.K.; Sung, C.-J. Autoignition of CRC Diesel Surrogates at Low Temperature Combustion Conditions: Rapid Compression Machine Experiments and Modeling. Combust. Flame 2020, 219, 178–197. [Google Scholar] [CrossRef]
- Li, J.; Zhu, J.; Wang, S.; Feng, Y.; Zhou, W.; Qian, Y.; Yu, L.; Lu, X. An Experimental and Modeling Study of Autoignition Characteristics of Two Real Low-octane Gasoline Fuels in a Heated Rapid Compression Machine at Elevated Pressures. Fuel 2021, 295, 120645. [Google Scholar] [CrossRef]
- Yang, M.; Liao, C.; Tang, C.; Xu, S.; Li, H.; Huang, Z. The Auto-ignition Behaviors of HMX/NC/NG Stimulated by Heating in a Rapid Compression Machine. Fuel 2021, 288, 119693. [Google Scholar] [CrossRef]
- Ji, W.; Zhao, P.; Zhang, P.; Ren, Z.; He, X.; Law, C.K. On the Crossover Temperature and Lower Turnover State in the NTC Regime. Proc. Combust. Inst. 2017, 36, 343–353. [Google Scholar] [CrossRef]
- Zhukov, V.P.; Sechenov, V.A.; Starikovskiy, A.Y. Autoignition of Kerosene (Jet-A)/Air Mixtures Behind Reflected Shock Waves. Fuel 2014, 126, 169–176. [Google Scholar] [CrossRef] [Green Version]
- Zhang, C.; He, C.; Xue, X.; Lin, Y.; Li, J.; Liu, C. Statistical Characteristics of Spray Autoignition of Transient Kerosene Jet in Cross Flow. Chin. J. Aeronaut. 2021, 34, 73–84. [Google Scholar] [CrossRef]
Figure 1.
Schematic layout of the updated combustion chamber.

Figure 2.
Time sequence of different trigger signals.

Figure 3.
Typical pressure history of RP-3 kerosene spray combustion and the definitions of ignition delay times.
Figure 3.
Typical pressure history of RP-3 kerosene spray combustion and the definitions of ignition delay times.

Figure 4.
Combustion visualization of RP-3 kerosene spray generated by a multi-orifice injector.

Figure 5.
Effect of EOC pressure on pressure history (a) and IDT (b).

Figure 6.
Effect of EOC temperature on spray ignition.

Figure 7.
Effect of ambient temperature on ignition intensity and flame propagation.

Figure 8.
Effects of injection pressure on pressure history (a), and IDT and combustion duration (b).
Figure 8.
Effects of injection pressure on pressure history (a), and IDT and combustion duration (b).

Figure 9.
Effects of injection delay on pressure history (a), and IDT and combustion duration (b).

Figure 10.
Heat release rate histories of tests under different EOC pressures (a) and EOC temperatures (b).
Figure 10.
Heat release rate histories of tests under different EOC pressures (a) and EOC temperatures (b).

Figure 11.
Ignition performance of RP-3 kerosene under a wide temperature and pressure regime.

Figure 12.
IDT correlation of ignited tests for RP-3 kerosene spray.


Table 1.
Overview of RCM experimental set-up and test conditions.
| Tested Fuel | RP-3 Kerosene |
|---|---|
| Piston stroke length | 332 mm |
| Chamber length | 30 mm (20–100 Adjustable) |
| Clearance volume | 51.23 cm3 |
| Cylinder bore | 50.8 mm |
| Driving pressure (air) | 0.35 MPa |
| Compression ratio | 11 |
| Compressed temperature | 600–900 K |
| Compressed pressure | 0.5–5 MPa |
| Pressure data collecting | 100 kHz |
| Trigger signal (impulse) | 5 V |
| Nozzle orifice diameters | 0.5 mm × 6 |
| Injection pressure | 10/15/20 MPa |
| Injection width | 1.2 ms |
| Camera sample rate | 25,000 fps |
| Exposure time | 9.8 μs |
| Resolution | 480 424 |
Table 2.
Main physical–chemical properties of RP-3.
| Property | Value |
|---|---|
| Density at 20 °C (kg/L) | 0.81 [12] |
| H/C ratio | 1.96–2.04 [12,19,20,31] |
| Molecular weight (g/mol) | 149–166 [12,19,20,31] |
| Flashing point (°C) | 38 [12] |
| Boiling point (°C) | 176 [12] |
| Cetane number | 38–46 [12] |
| Lower heating value (MJ/kg) | 42.3–45.7 [12,19,20,31] |
| Kinematic viscosity (mm2/s) | 1.81 [12] |
Table 3.
Total mass of RP-3 kerosene per injection.
| Injection Pressure/MPa | 10 | 15 | 20 | 30 |
|---|---|---|---|---|
| Mass/mg | 13.2 | 13.8 | 14.7 | 15.8 |
Publisher’s Note: MDPI stays neutral with regard to jurisdictional claims in published maps and institutional affiliations. |
© 2022 by the authors. Licensee MDPI, Basel, Switzerland. This article is an open access article distributed under the terms and conditions of the Creative Commons Attribution (CC BY) license (https://creativecommons.org/licenses/by/4.0/).
Share and Cite
MDPI and ACS Style
Mai, Z.; Liu, Y.; Tang, C.; Huang, Z. Experimental Investigation on Auto-Ignition Characteristics of Kerosene Spray Flames. Machines 2022, 10, 601. https://doi.org/10.3390/machines10080601
AMA Style
Mai Z, Liu Y, Tang C, Huang Z. Experimental Investigation on Auto-Ignition Characteristics of Kerosene Spray Flames. Machines. 2022; 10(8):601. https://doi.org/10.3390/machines10080601
Chicago/Turabian StyleMai, Zhaoming, Yang Liu, Chenglong Tang, and Zuohua Huang. 2022. "Experimental Investigation on Auto-Ignition Characteristics of Kerosene Spray Flames" Machines 10, no. 8: 601. https://doi.org/10.3390/machines10080601
Note that from the first issue of 2016, this journal uses article numbers instead of page numbers. See further details here.