
Research on the Power Loss of High-Speed and High-Load Ball Bearing for Cryogenic Turbopump
Abstract
:1. Introduction
2. Theoretical Models of Ball Bearing for Cryogenic Turbopump
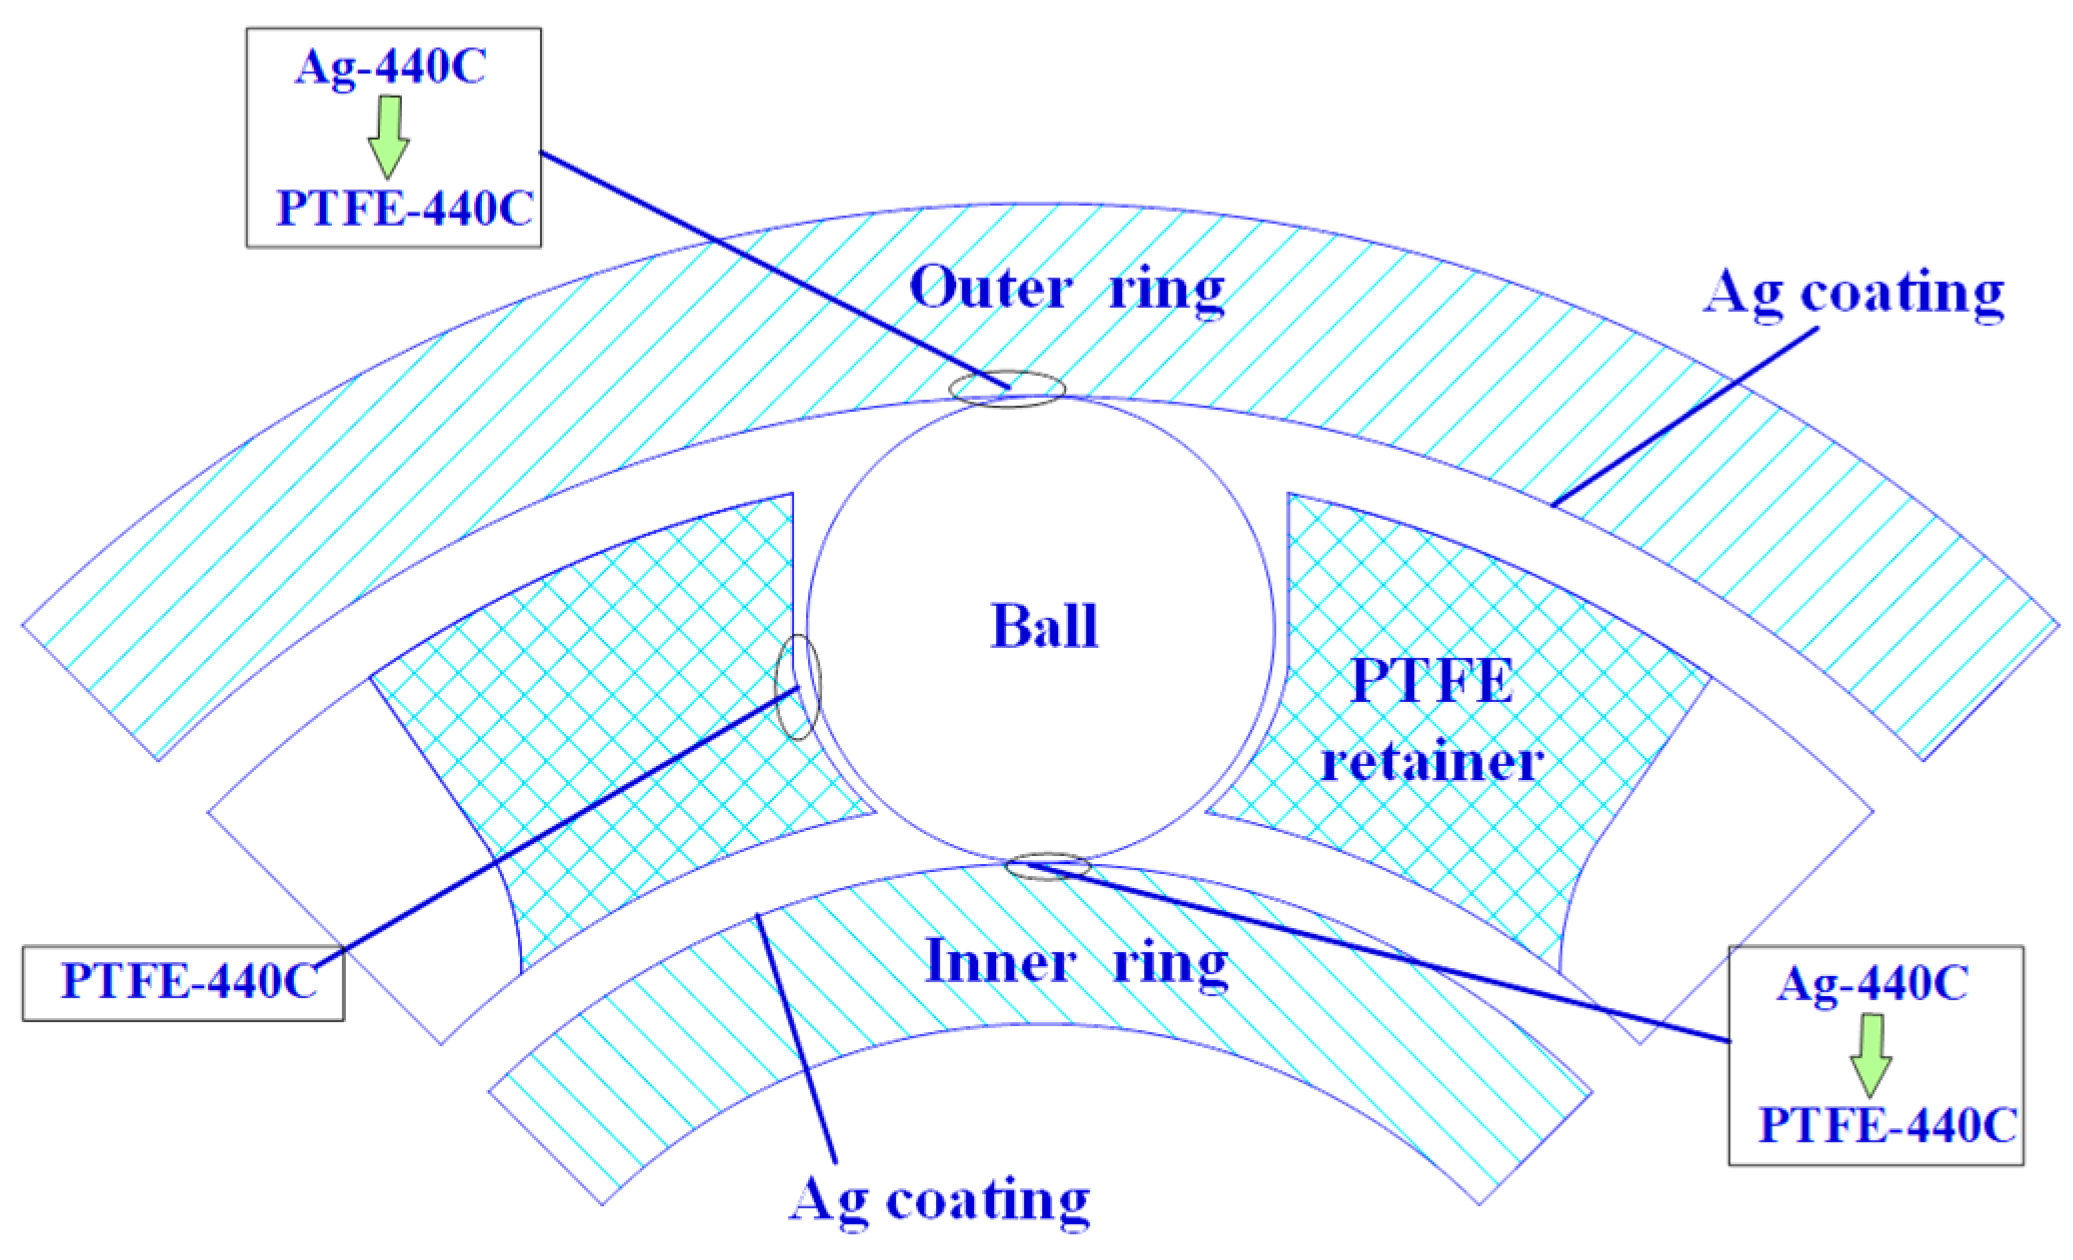
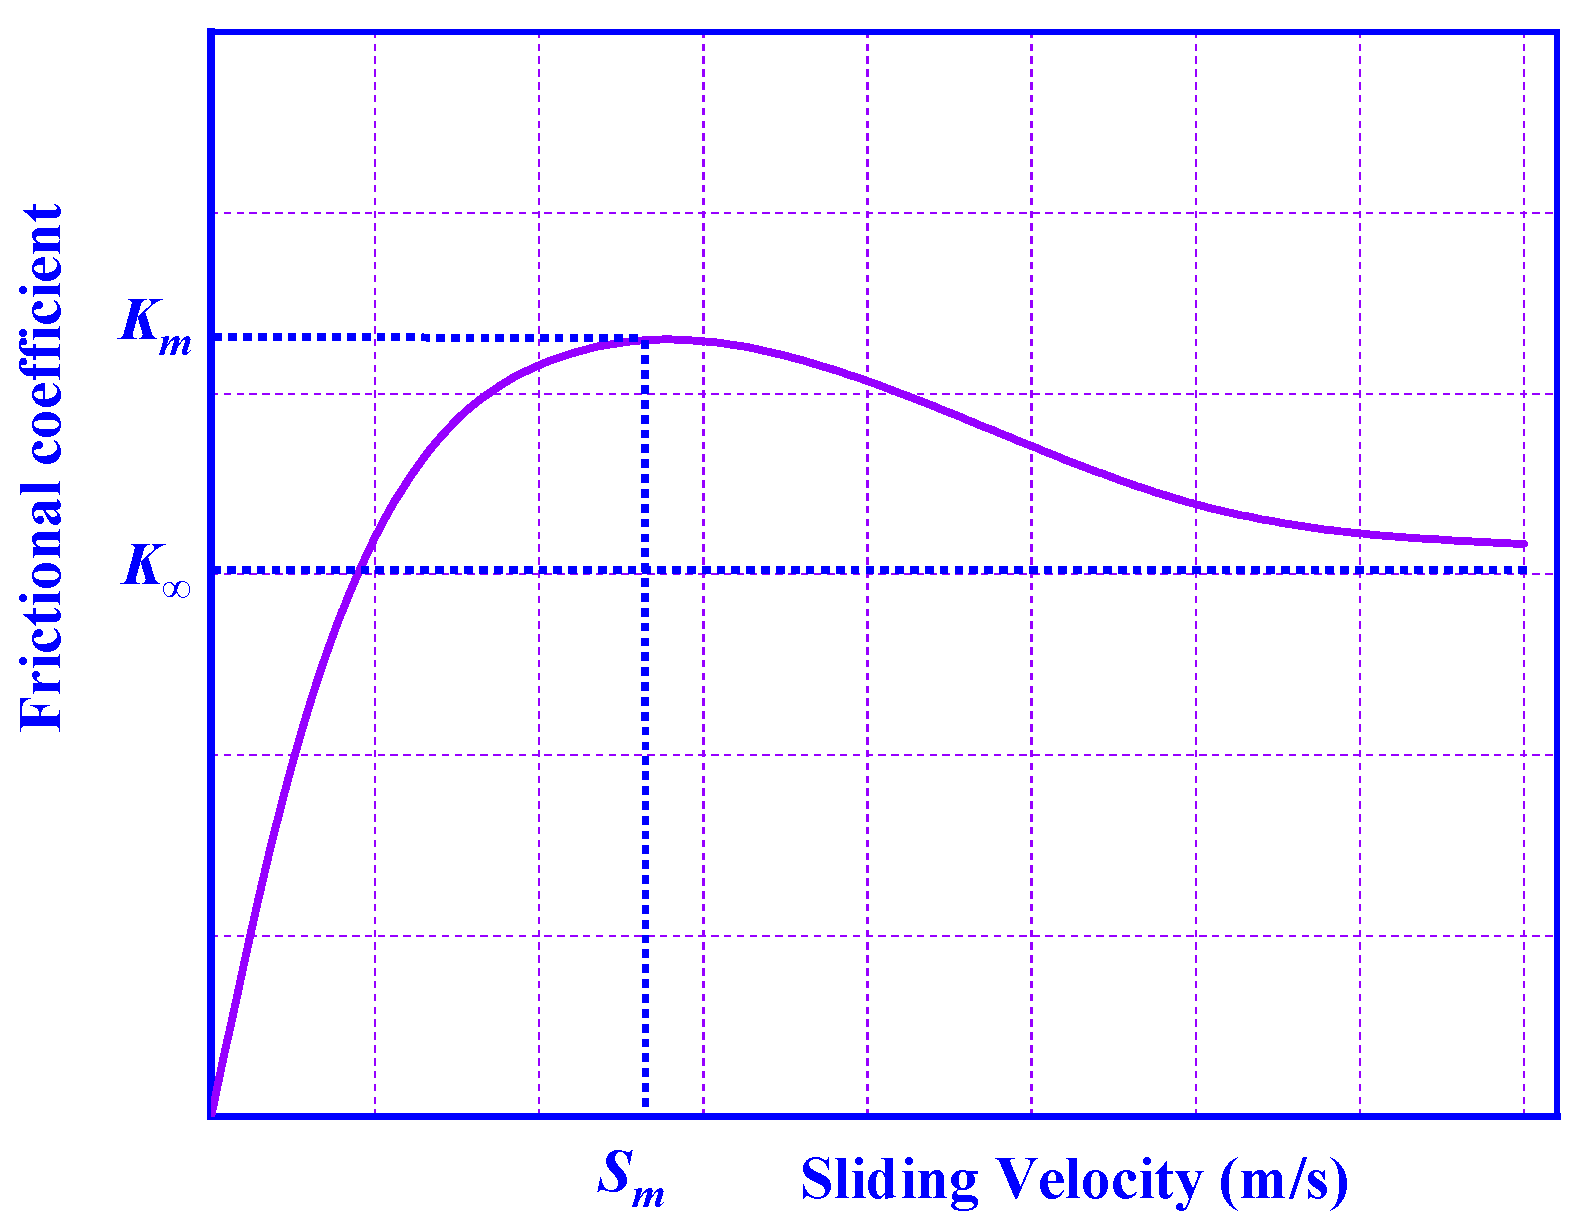
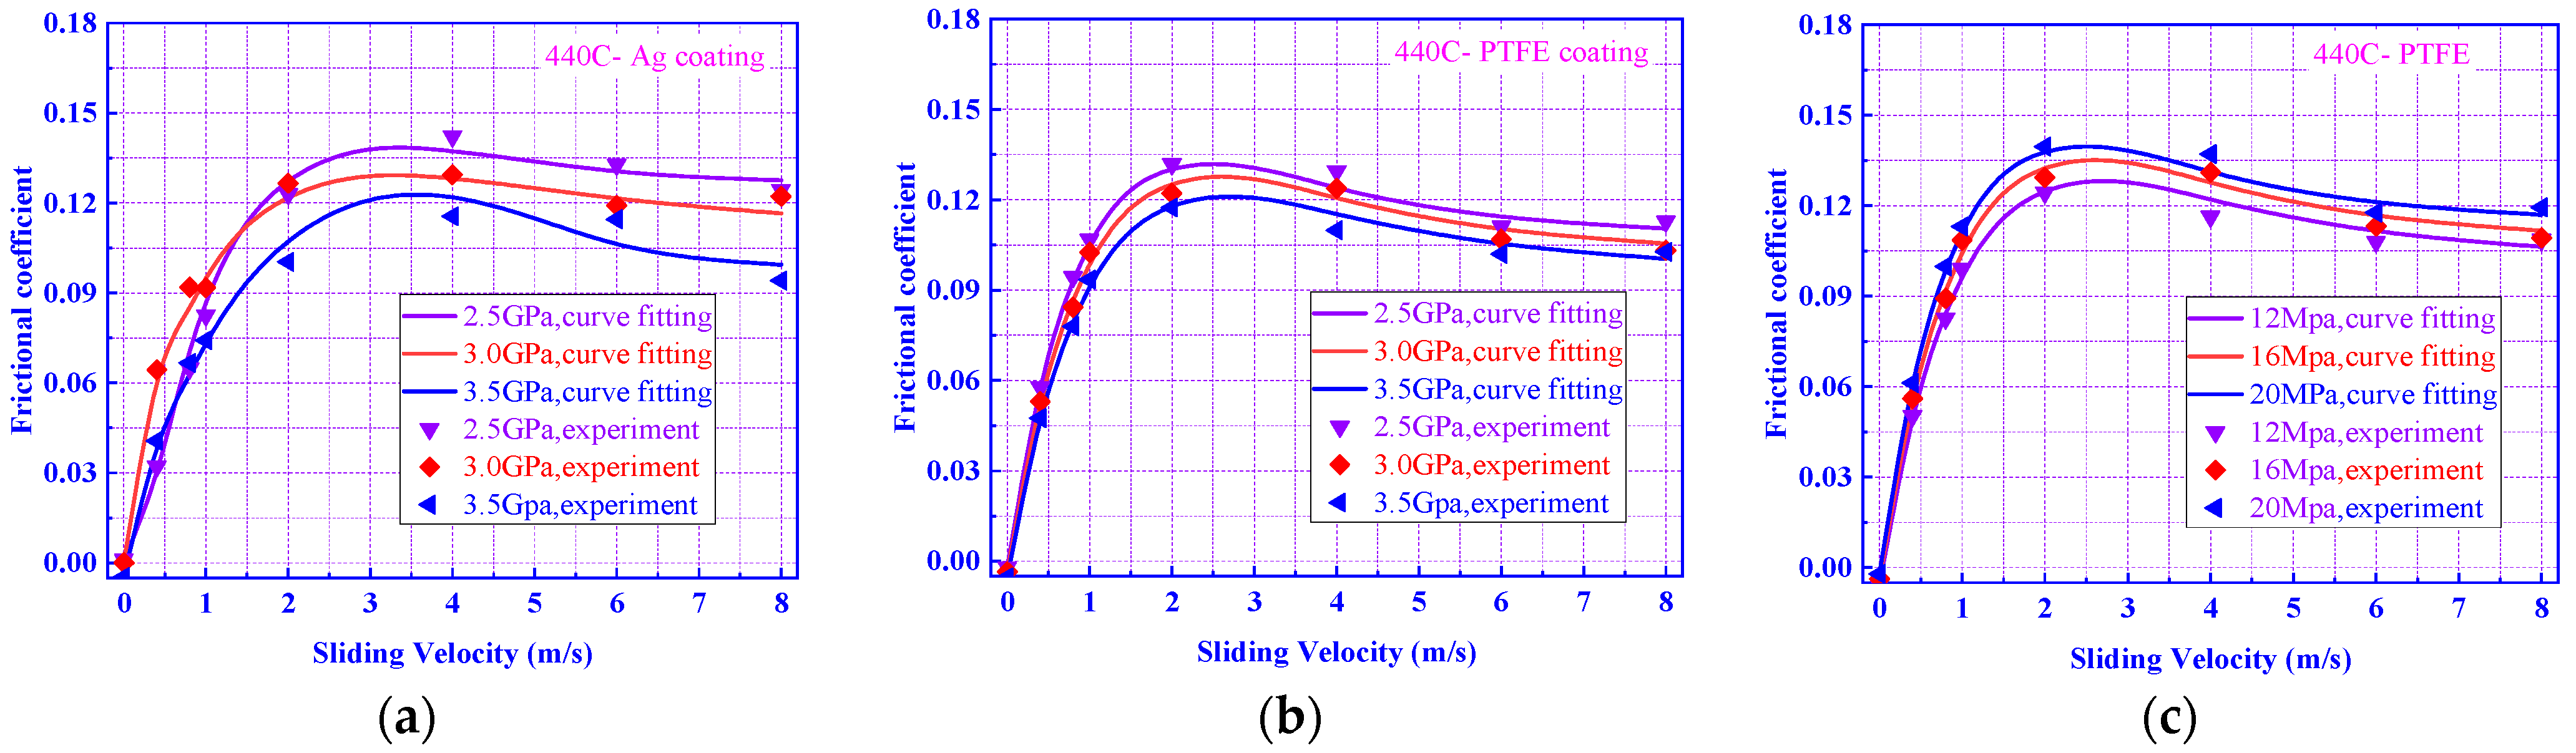
2.1. Frictional Coefficients of Bearing’s Contact Interfaces
2.2. Dynamic Model of Ball Bearing
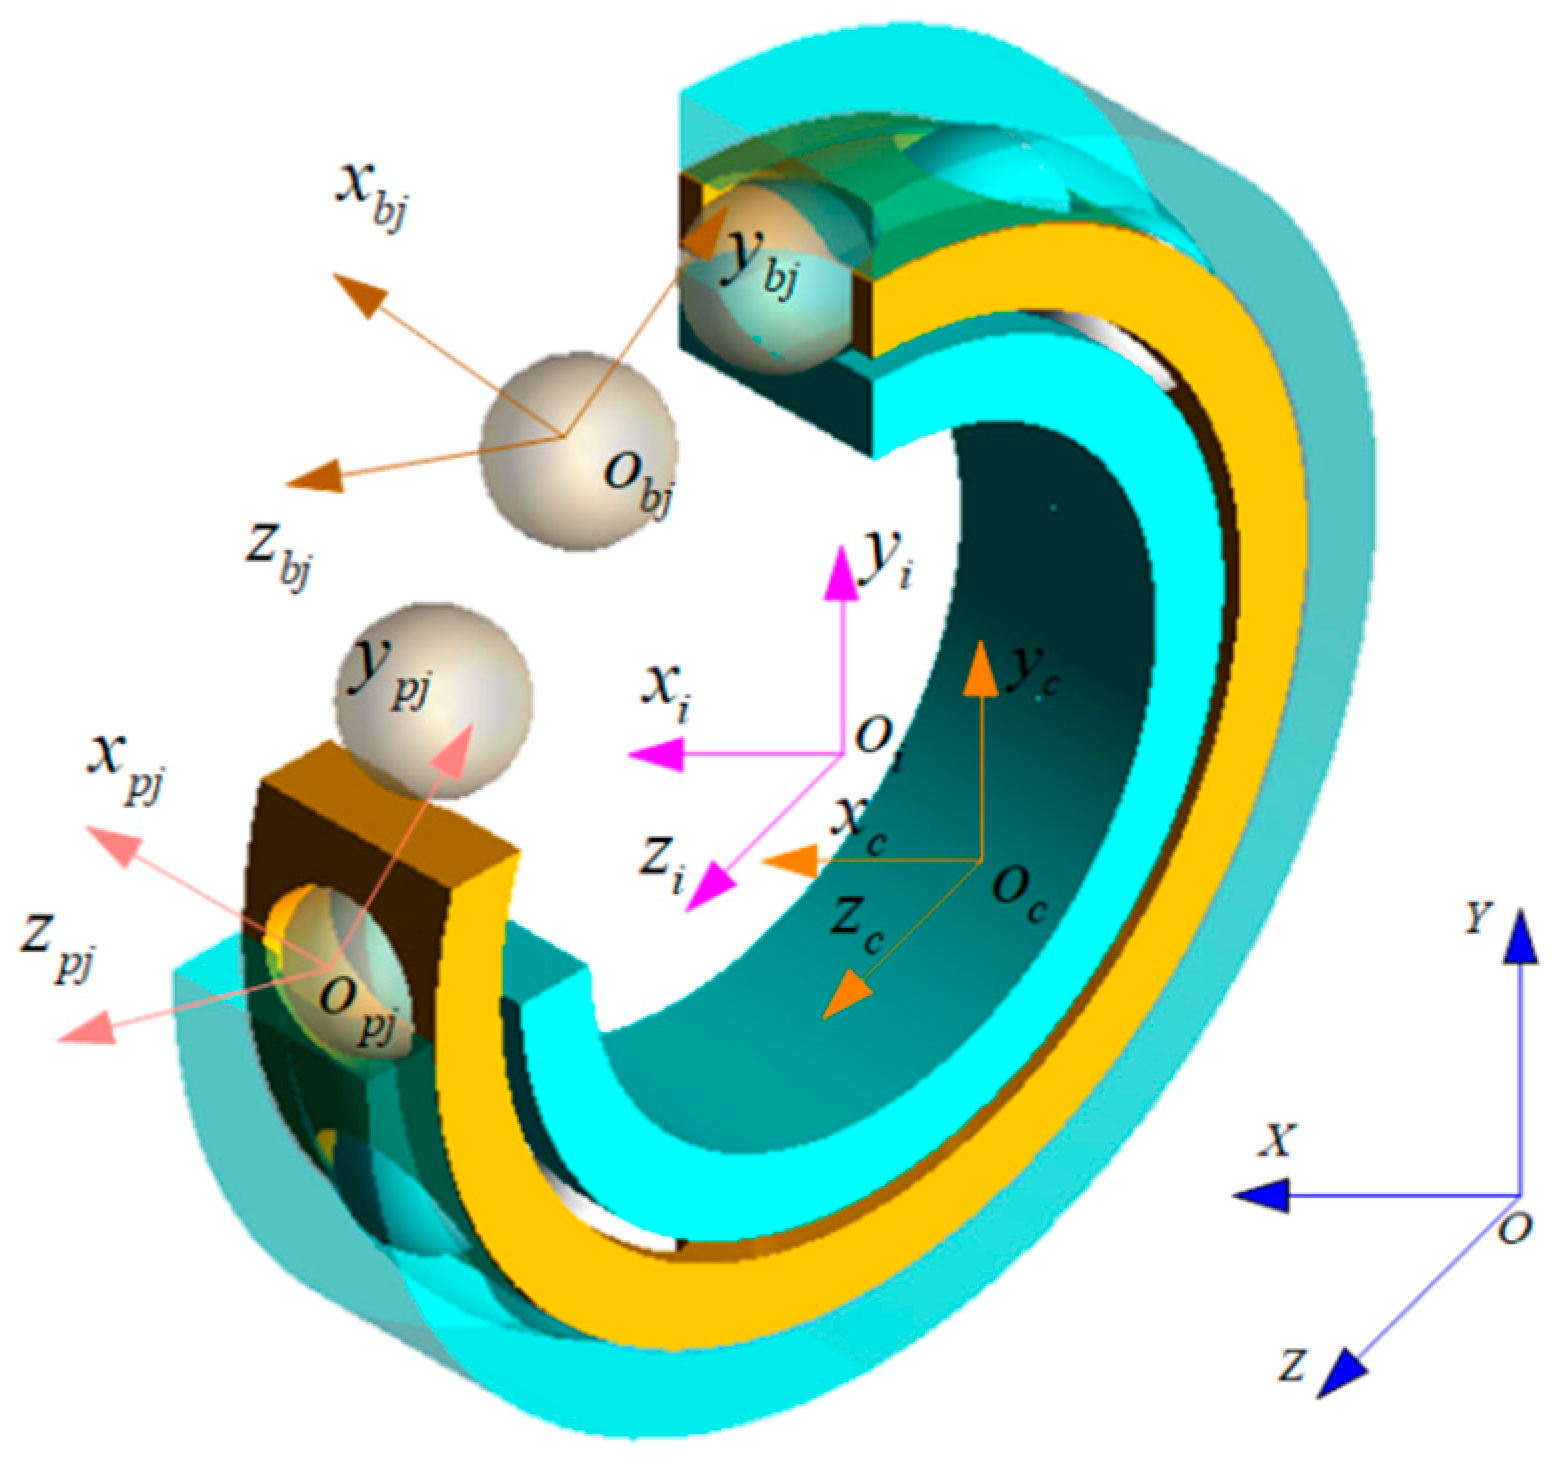
2.2.1. Coordinate System
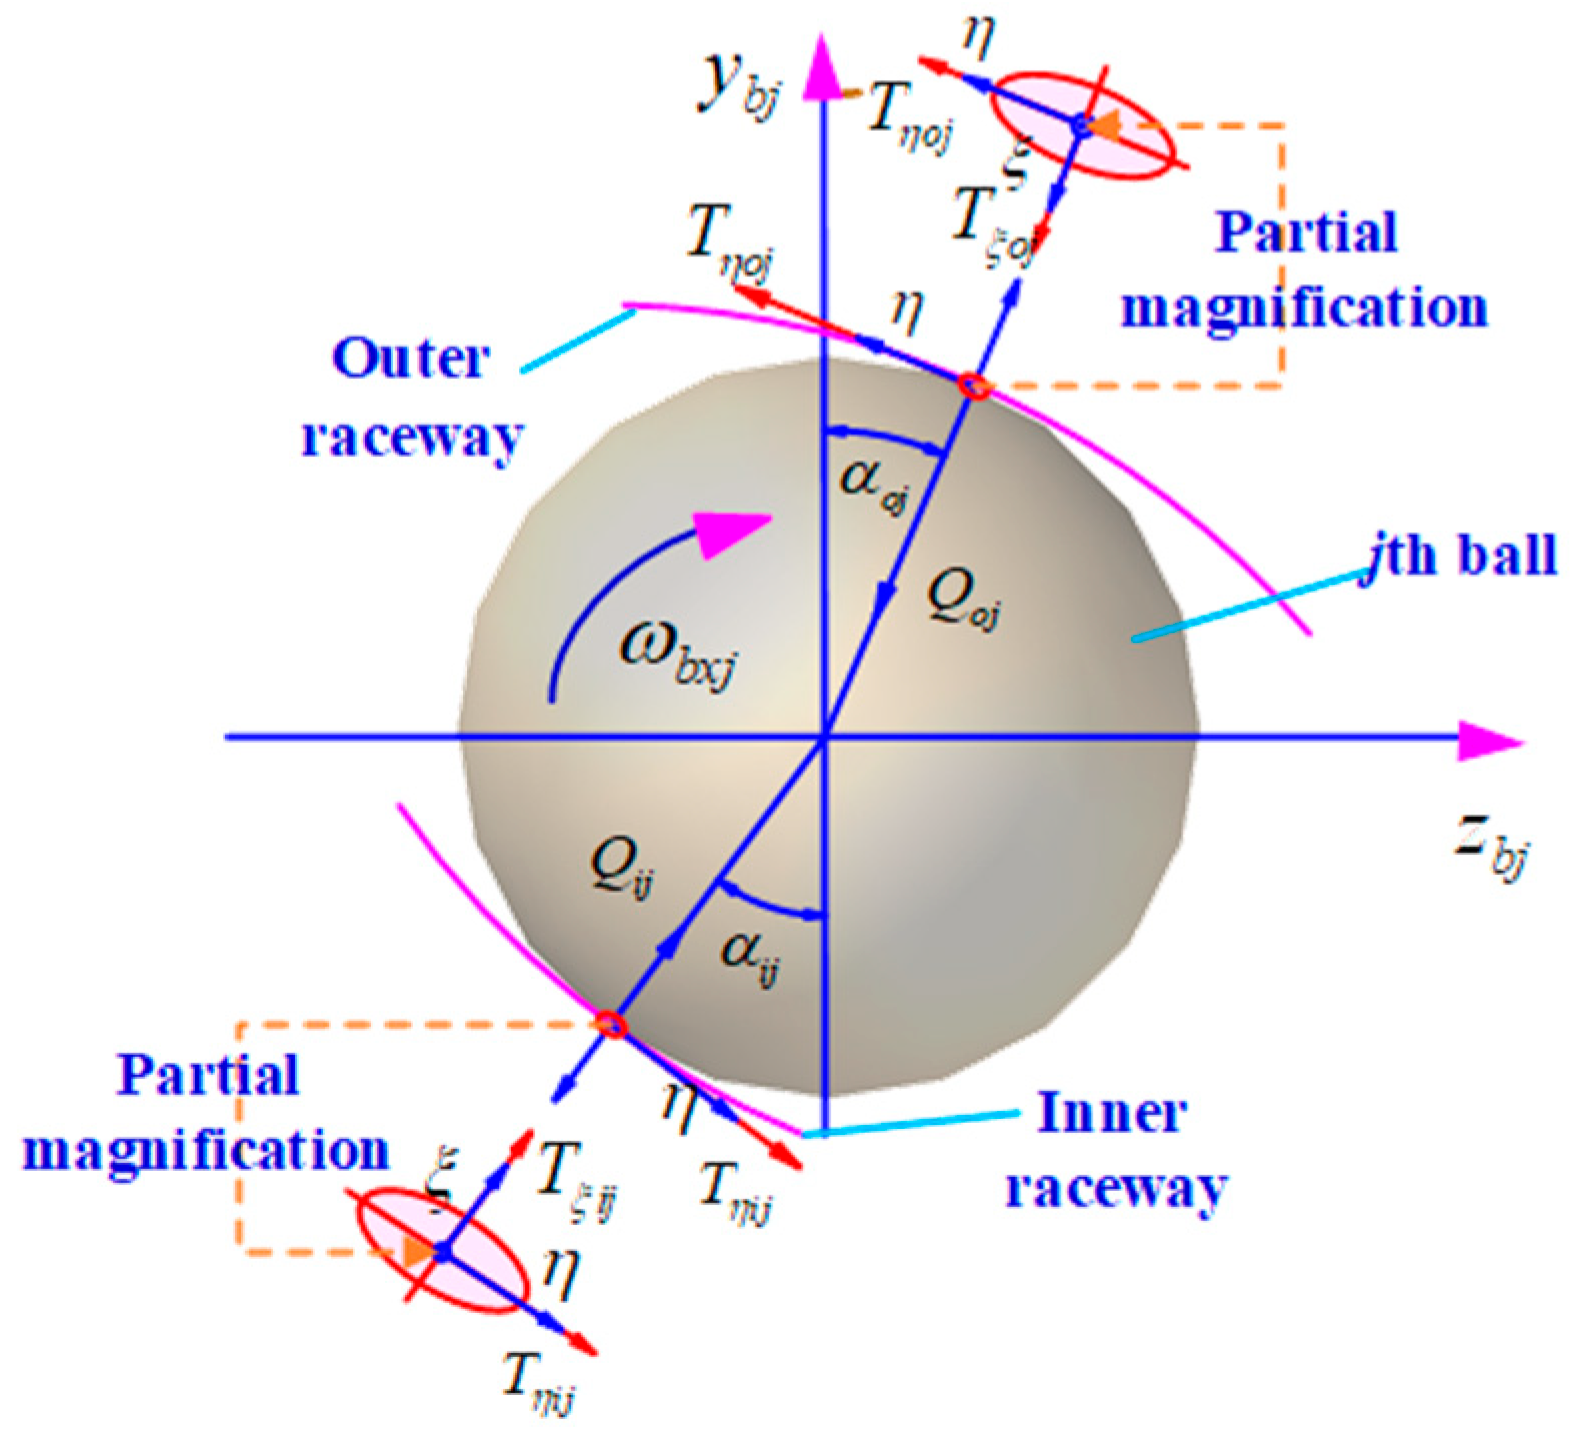
2.2.2. Nonlinear Dynamics Differential Equations of the jth Ball
2.2.3. Nonlinear Dynamics Differential Equations of the Cage
2.2.4. Nonlinear Dynamics Differential Equations of the Inner Ring
2.3. Power Loss Model of the Ball Bearing
- (1)
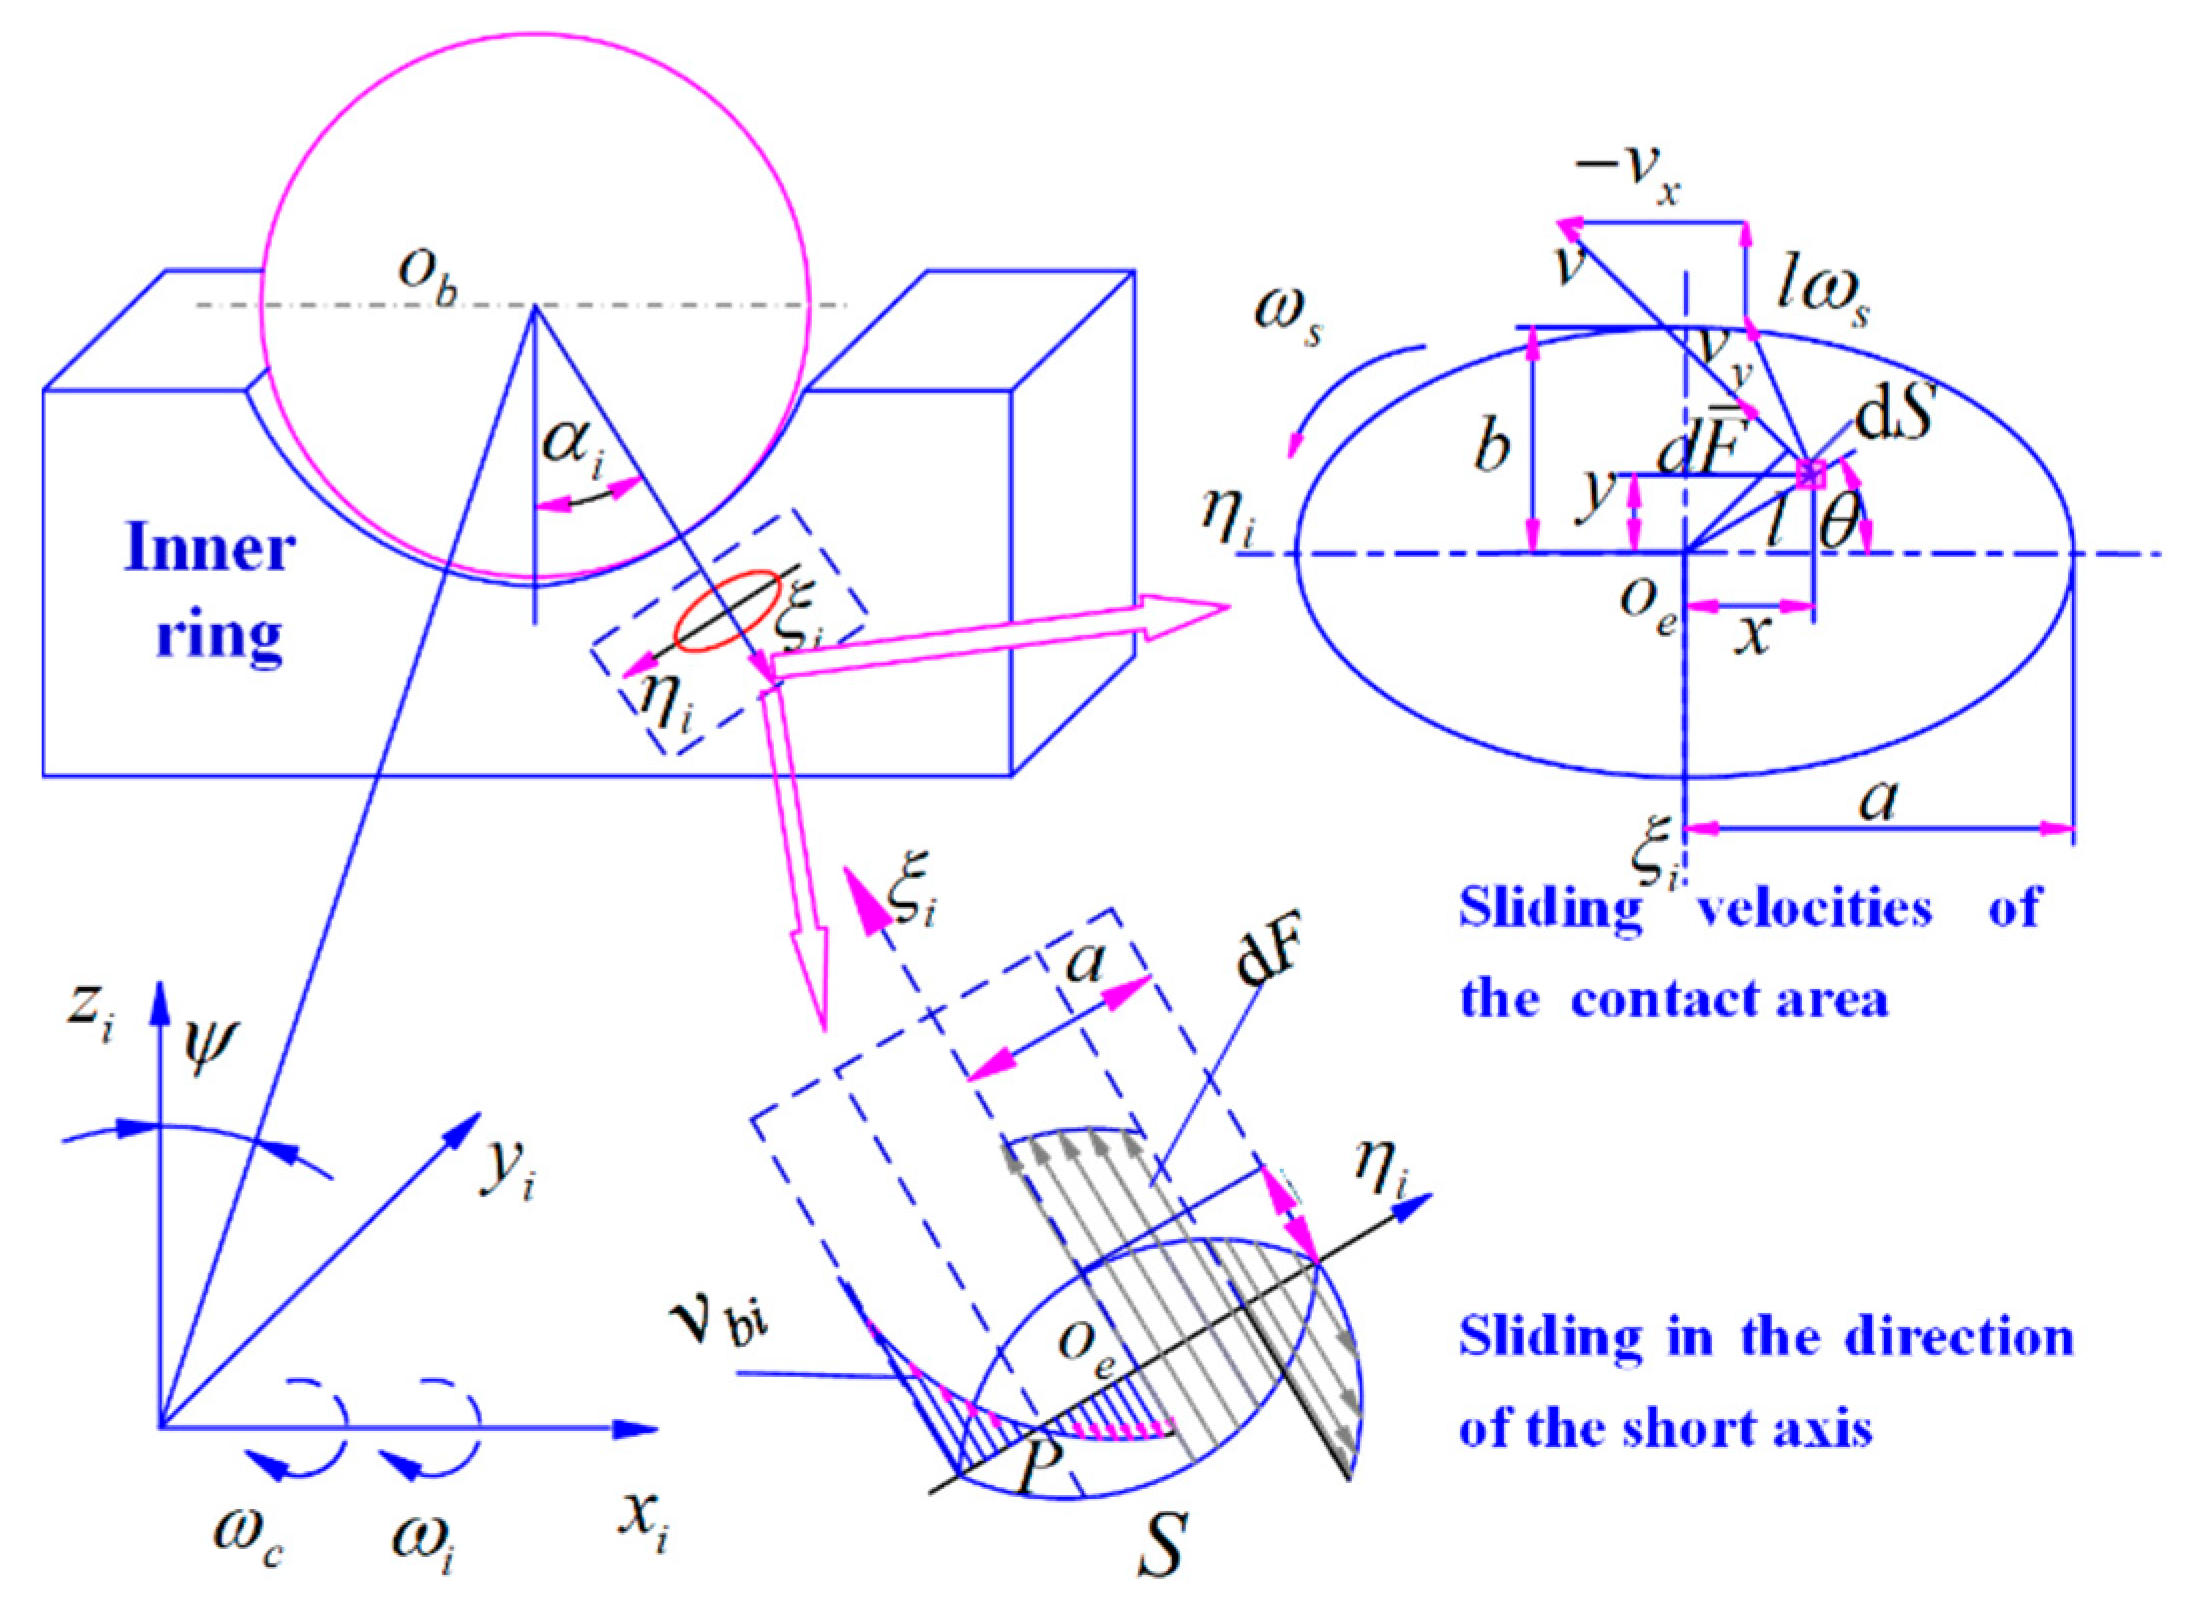
- The power loss of the ball sliding along the direction of the short axis:
- (2)
- Power loss due to the spinning sliding of the ball:
- (3)
- Power loss due to the elastic hysteresis
- (4)
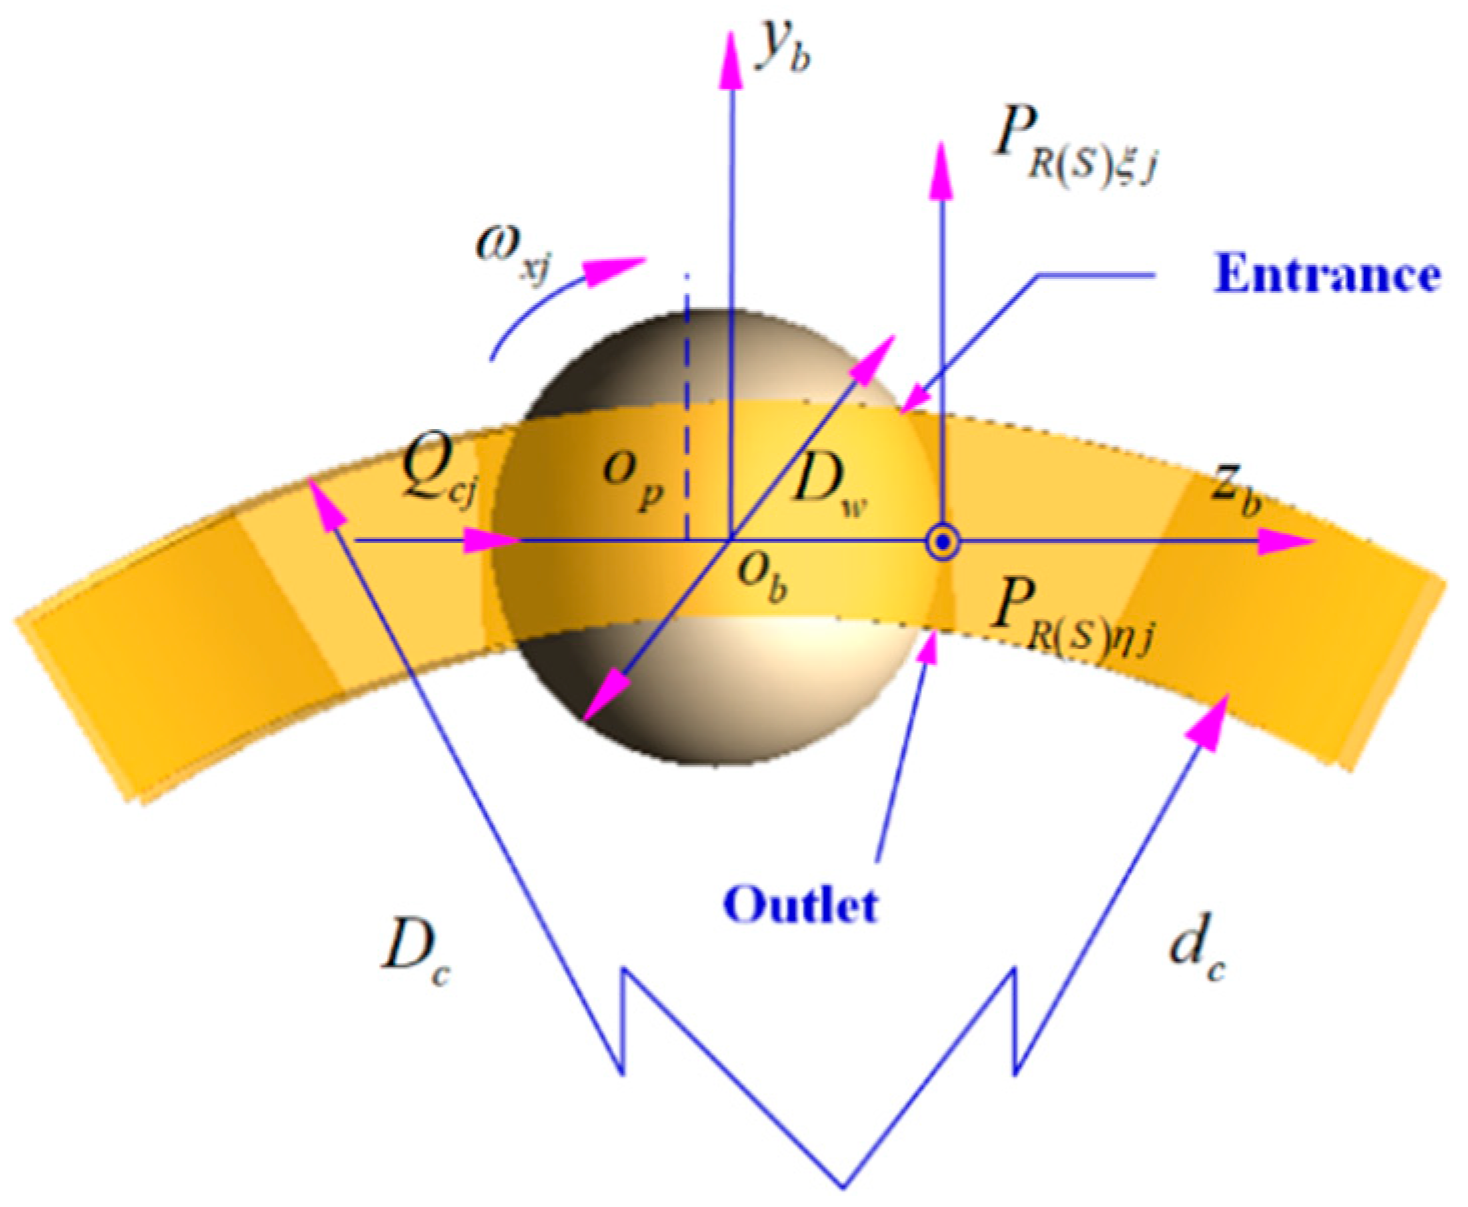
- Power loss due to the contact between the ball/ ring and the cage:
- (5)
- Power loss due to churning and drag
- (6)
- Total power loss
3. Analysis of Power Loss of the Ball Bearings of a Cryogenic Turbopump
3.1. Component of Power Loss
3.2. Influence of Structural Parameters on Power Loss
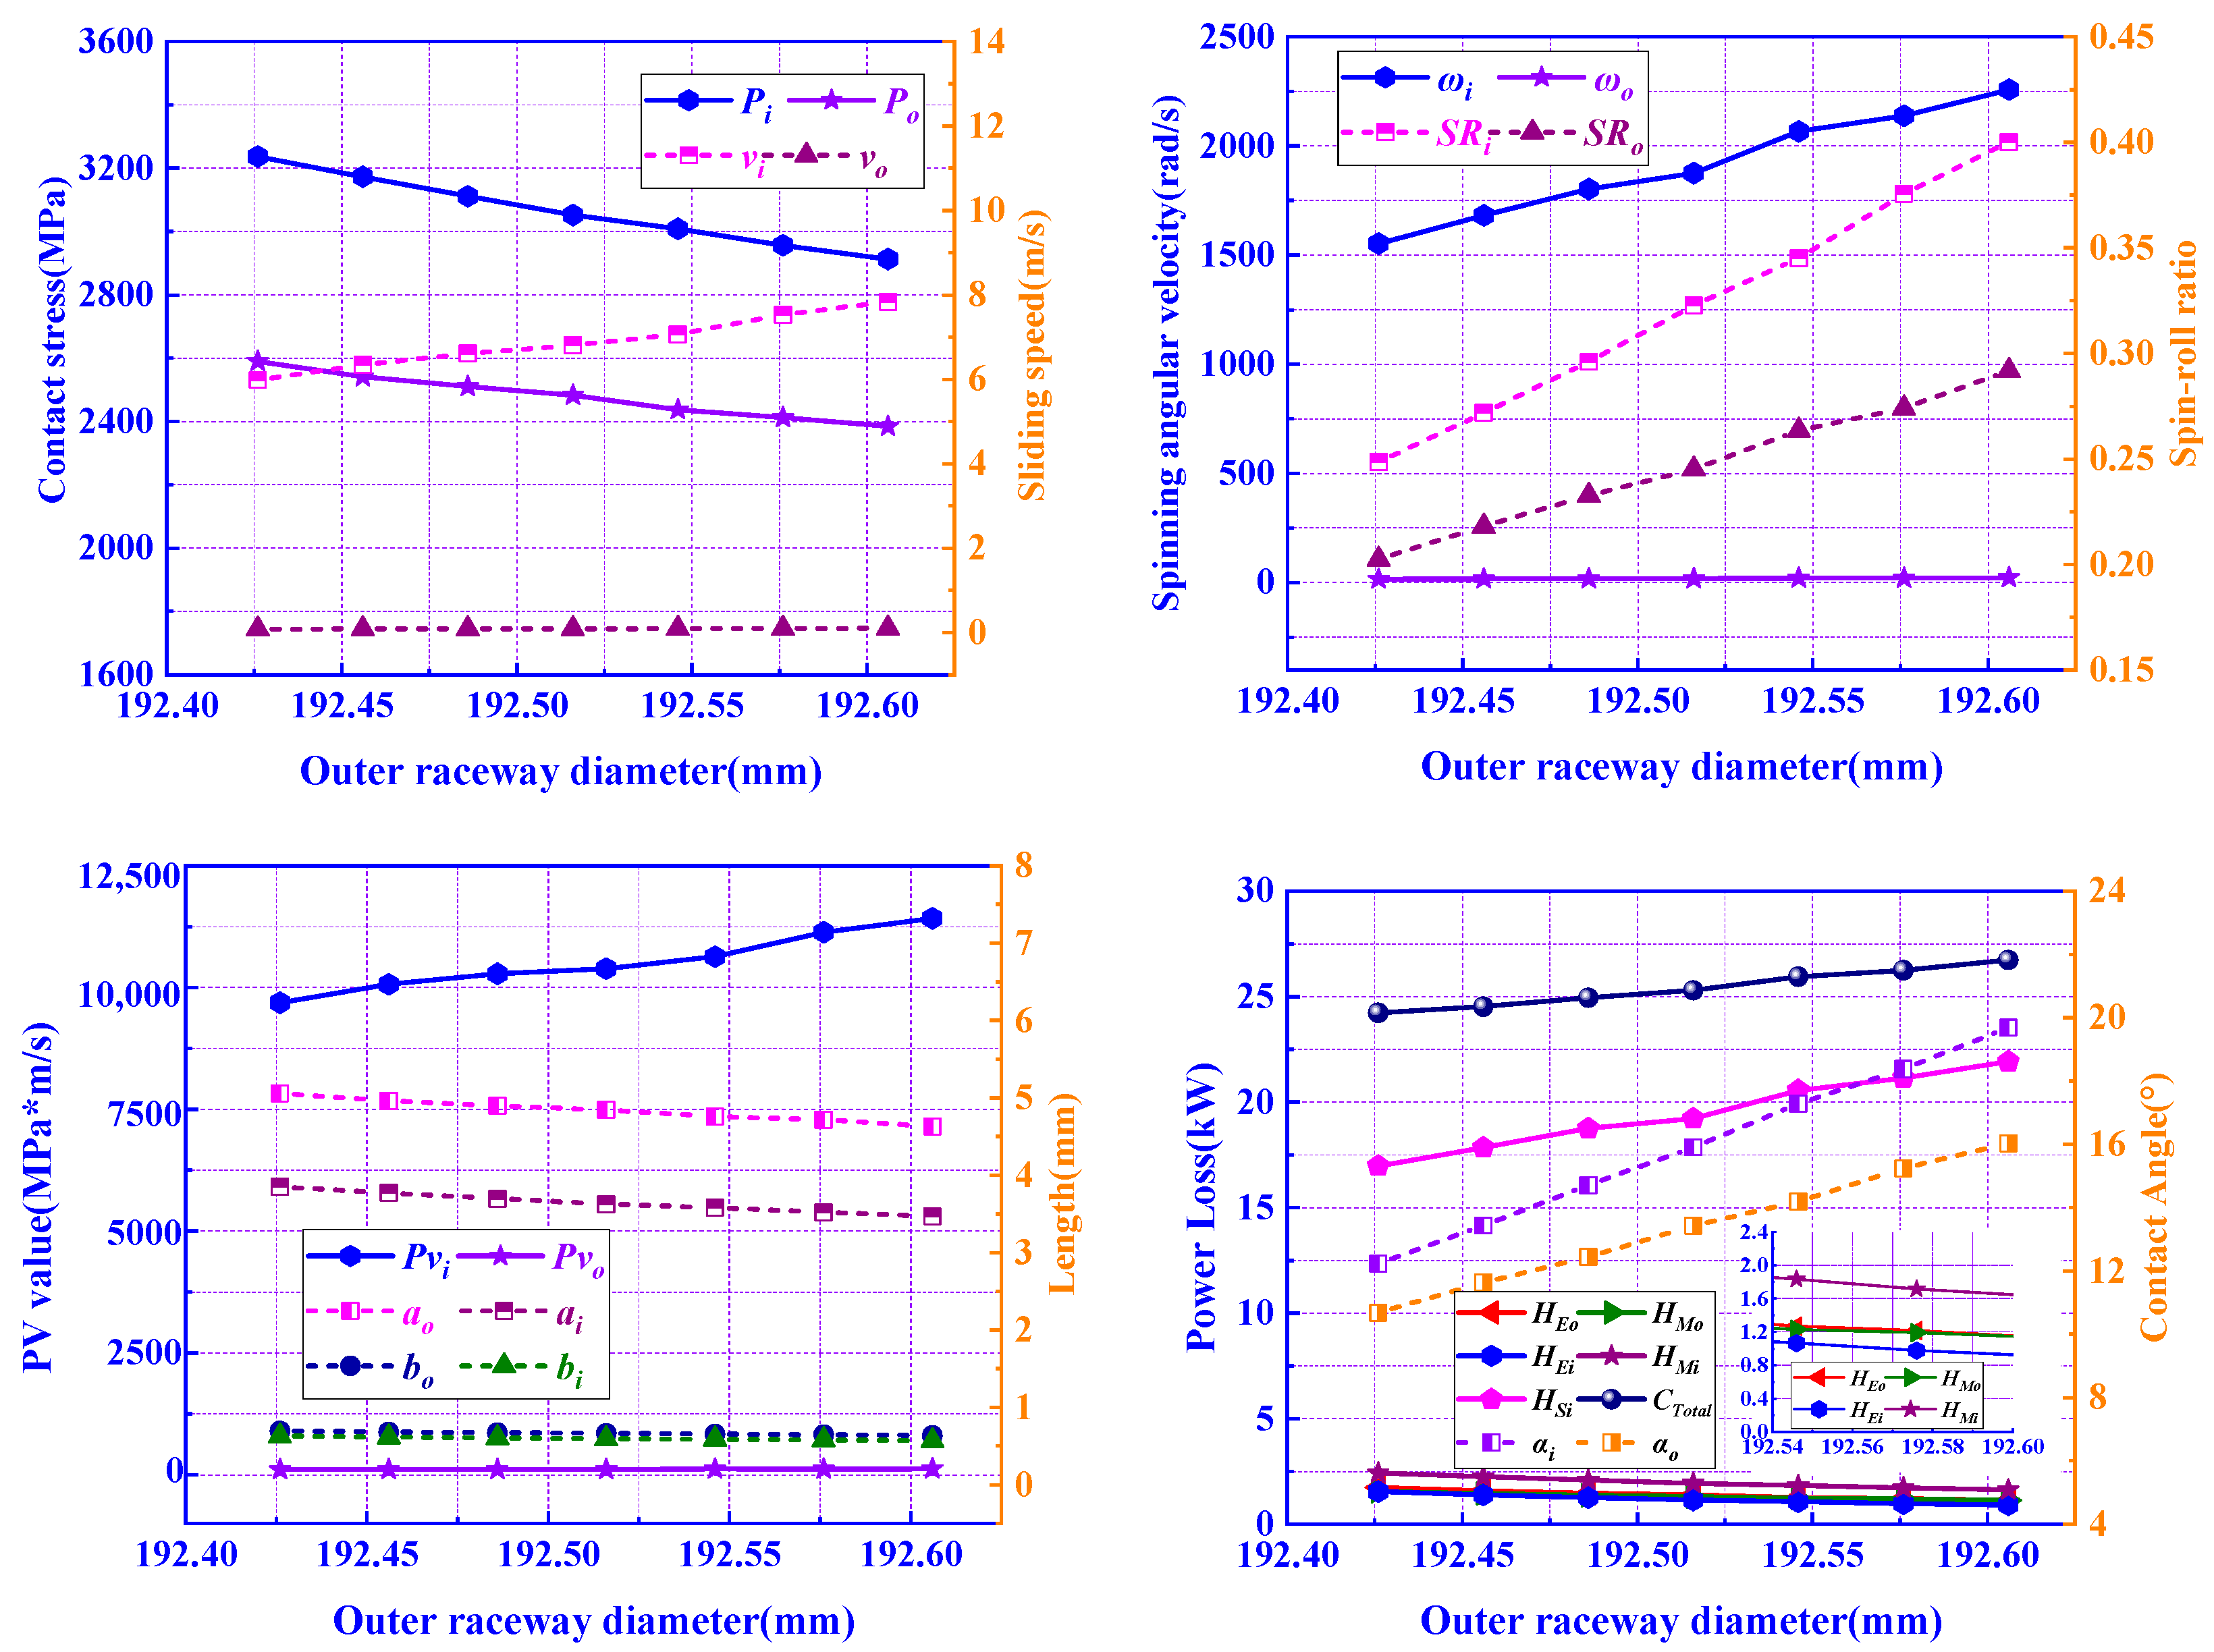
3.2.1. Influence of Outer Raceway Diameter De on Power Loss
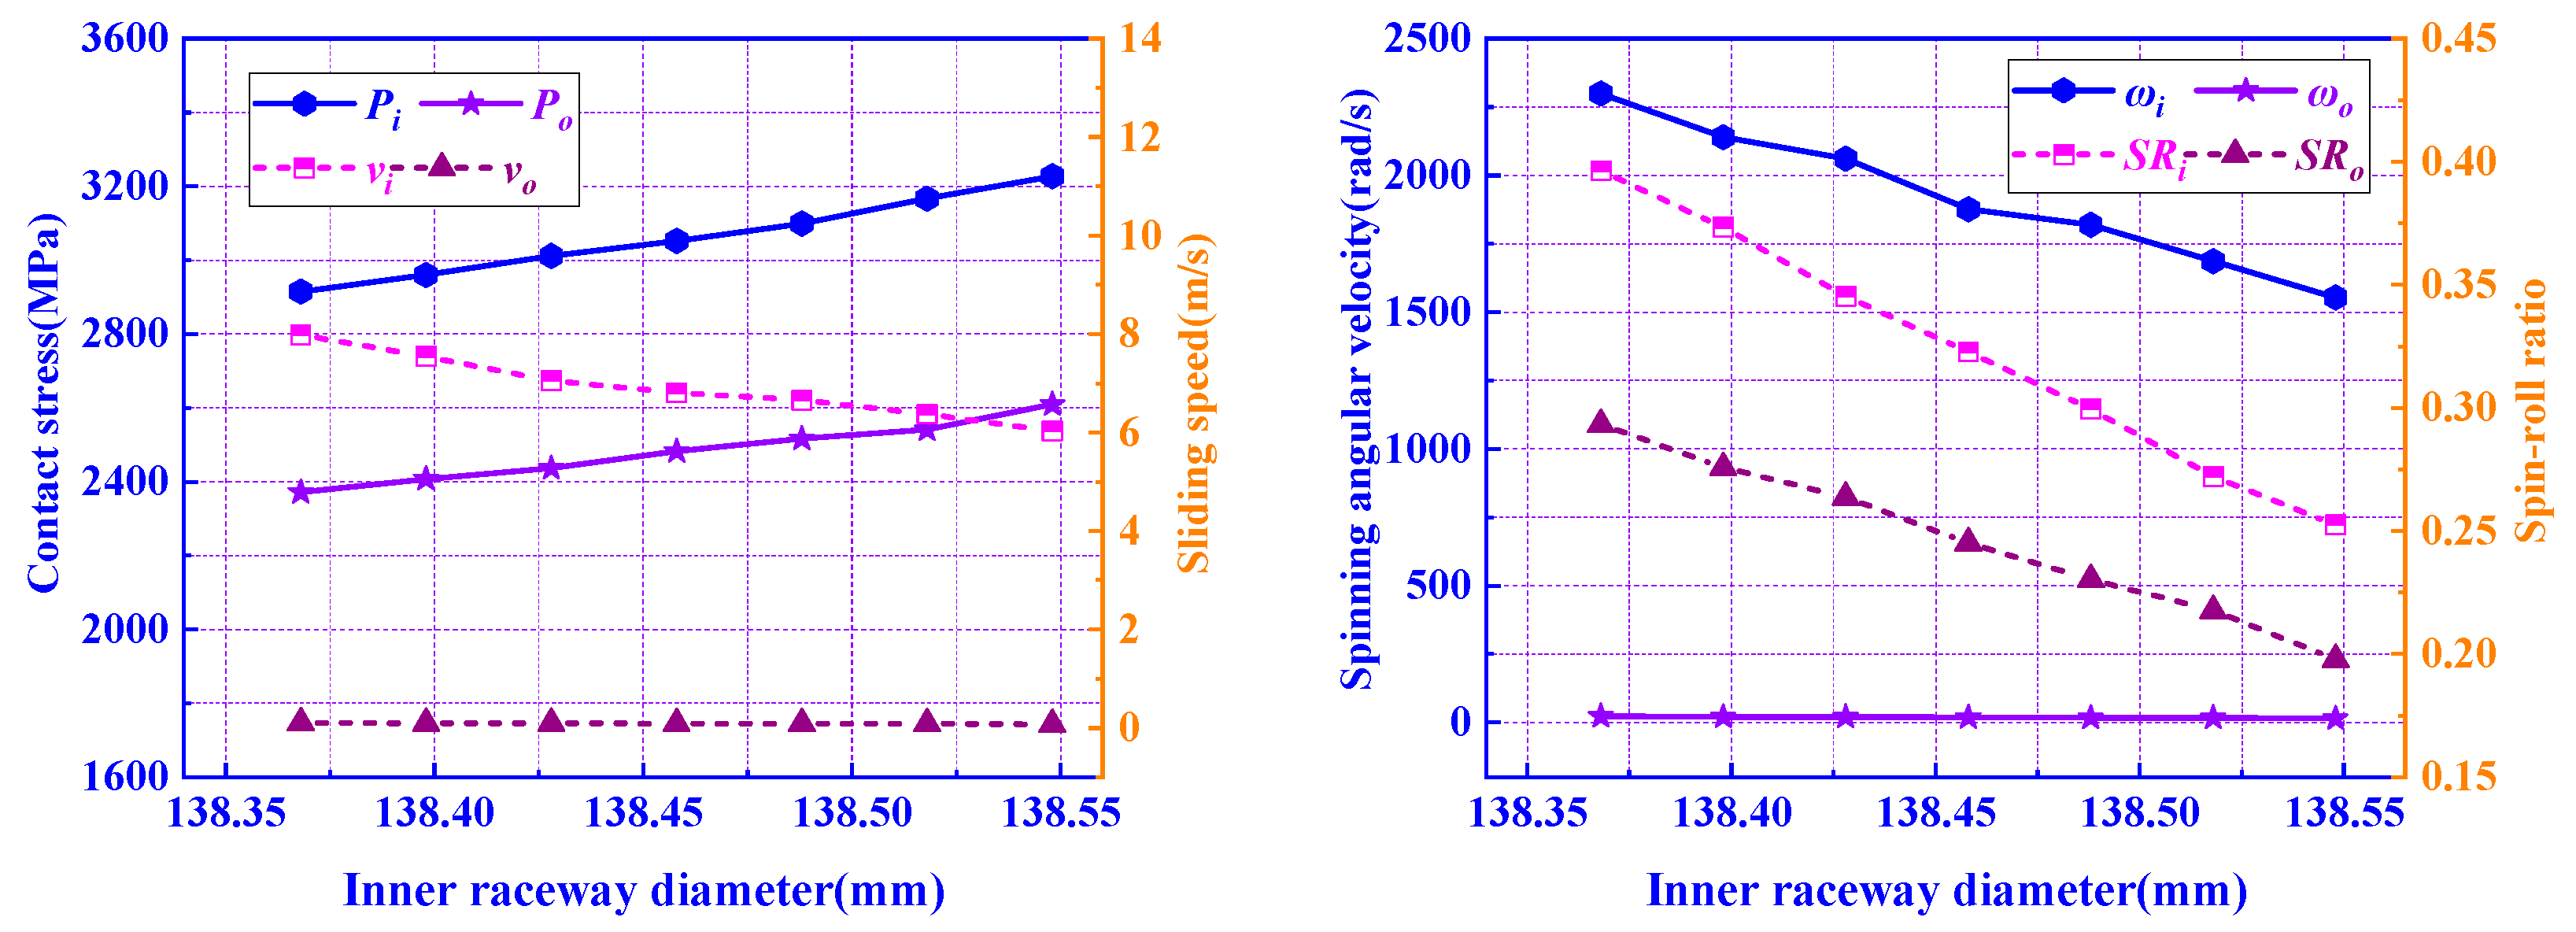
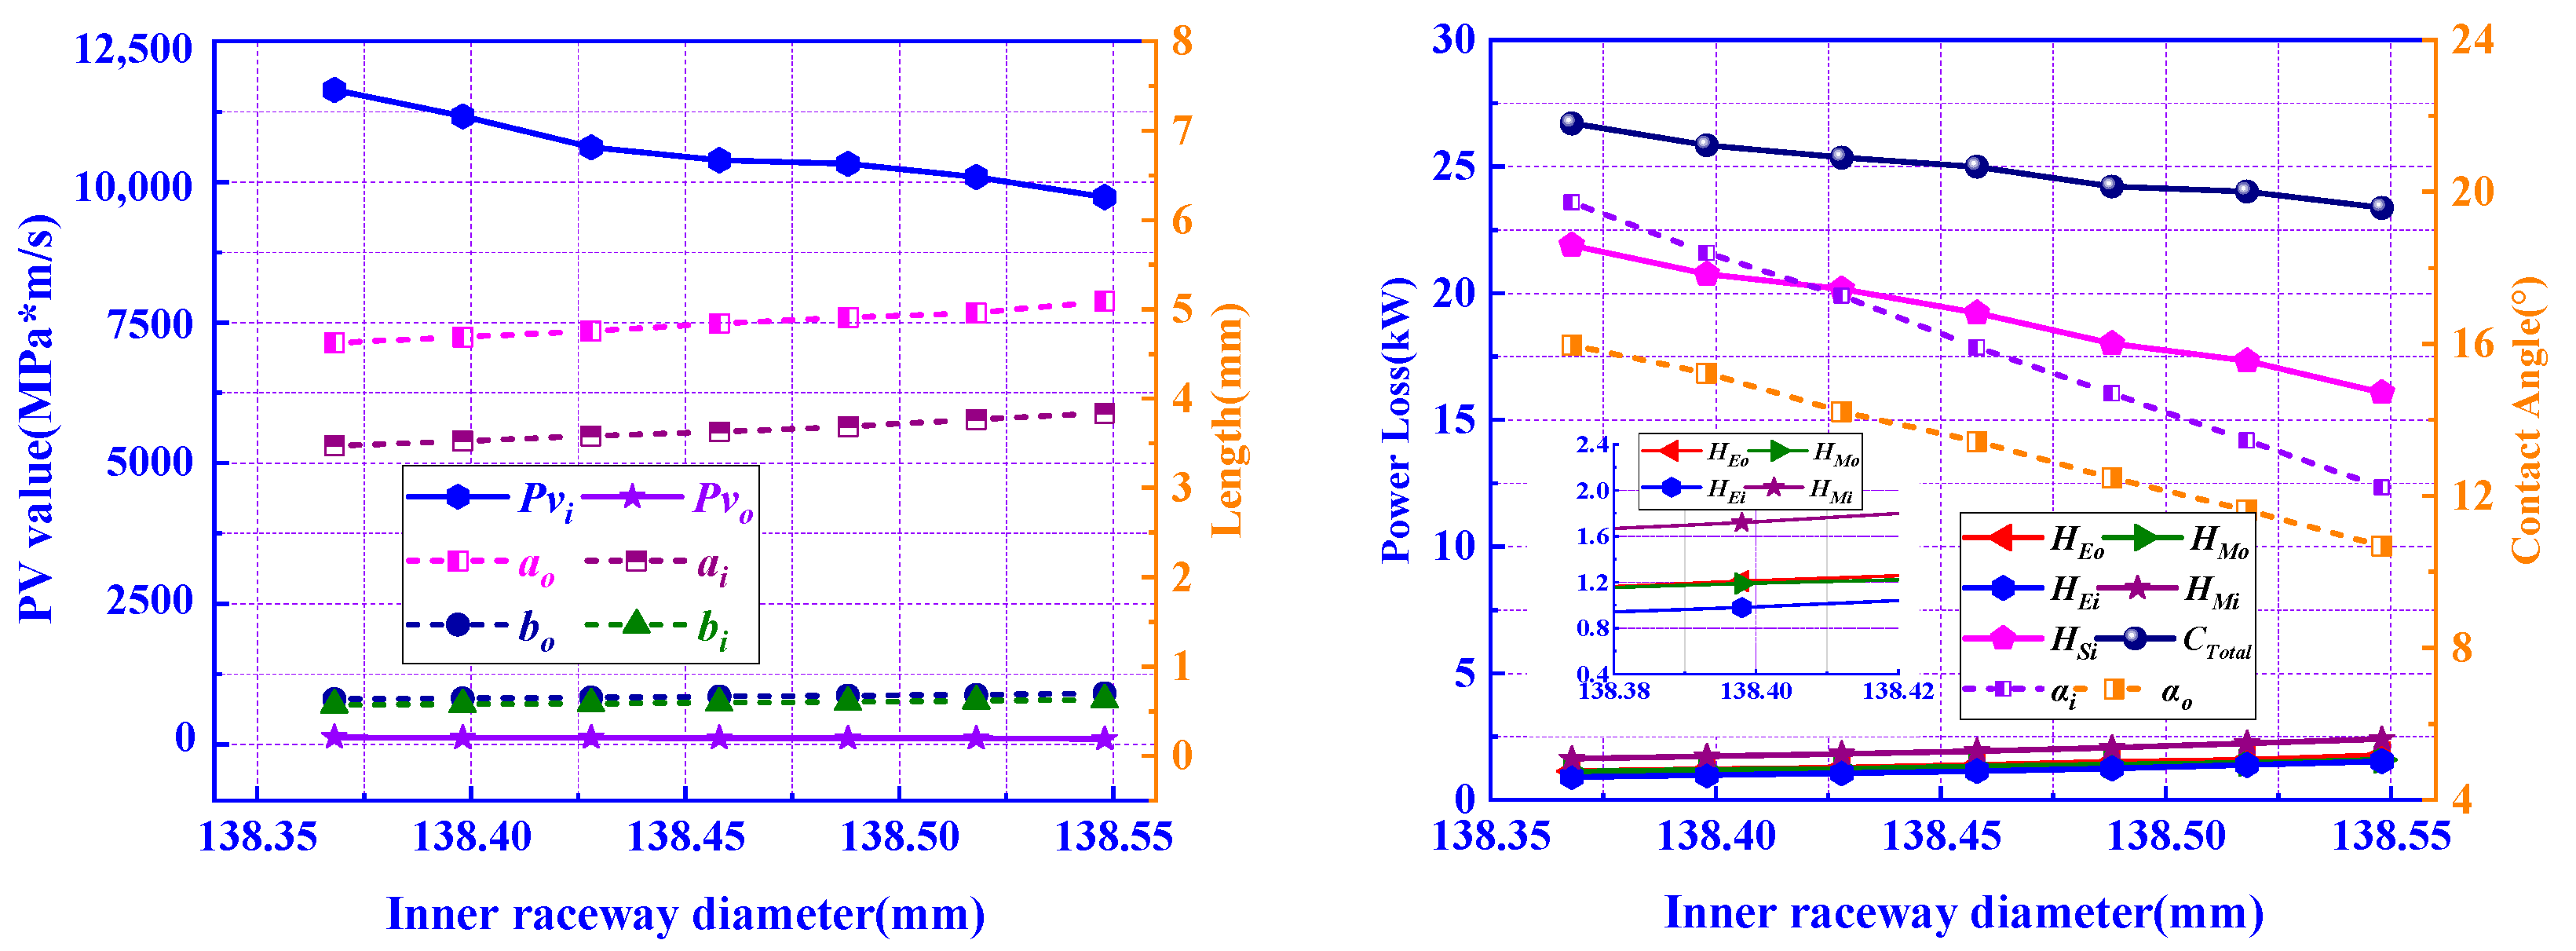
3.2.2. Influence of Inner Raceway Diameter di on Power Loss
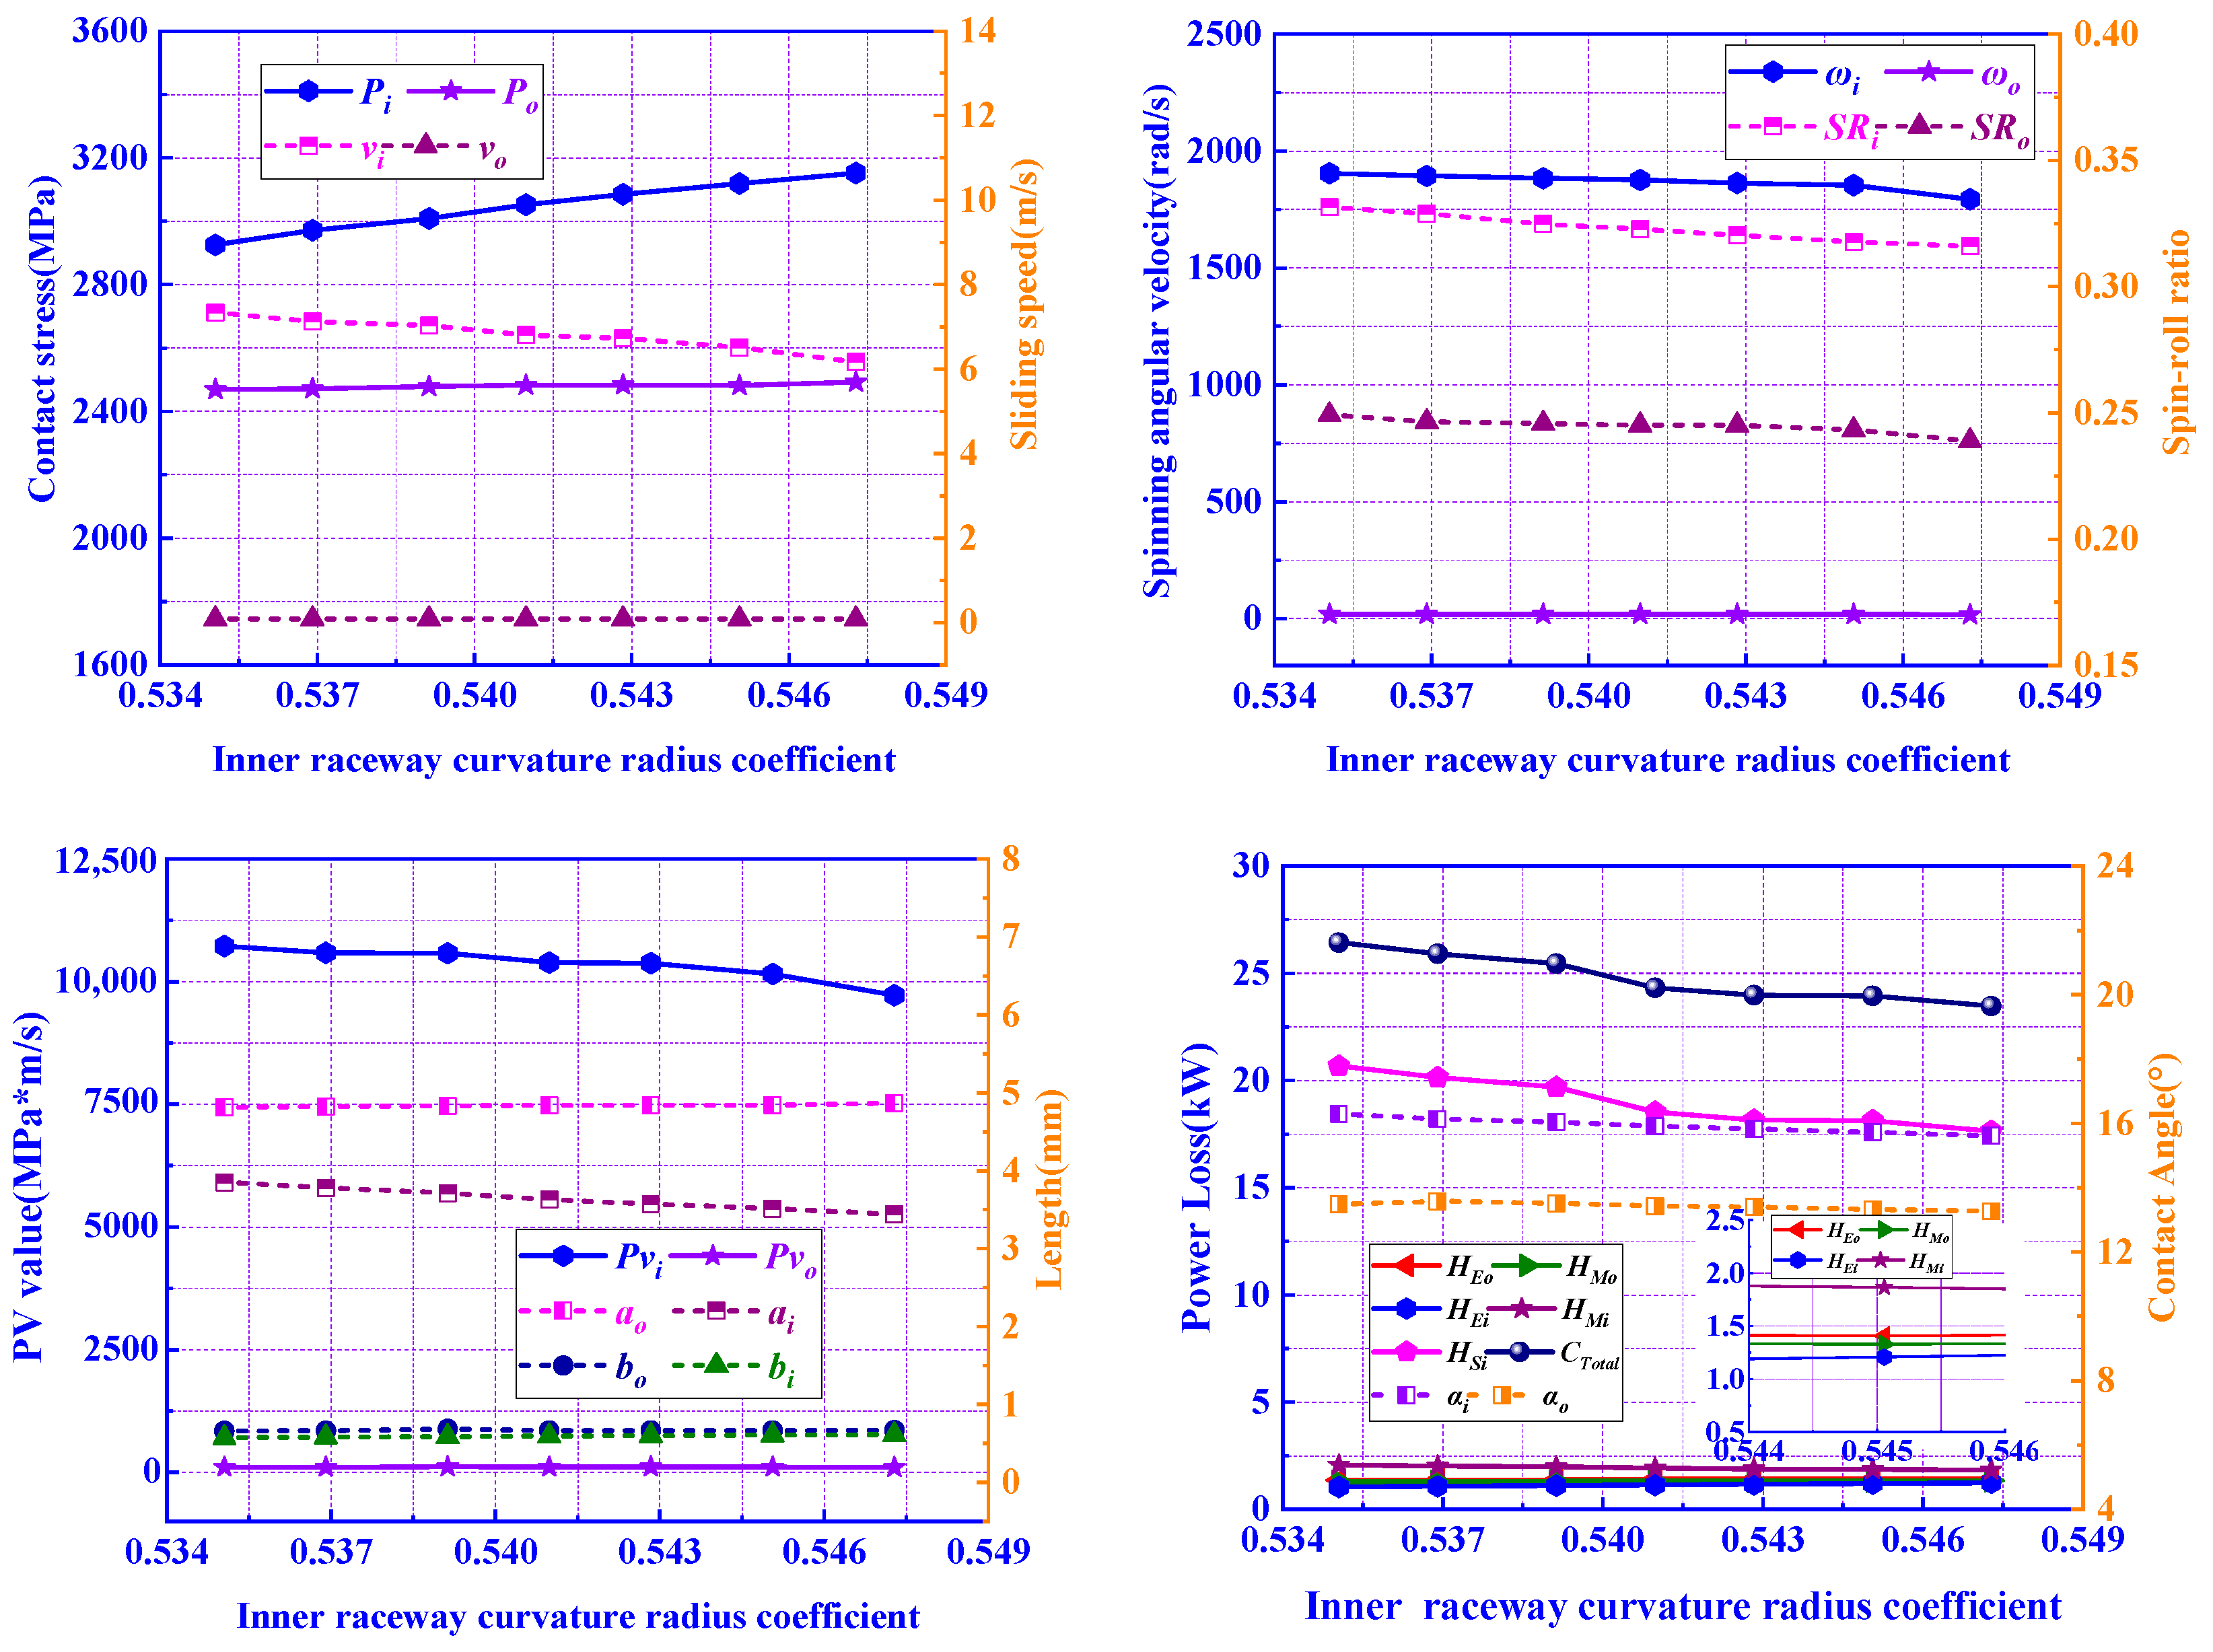
3.2.3. Influence of Inner Raceway Curvature Radius Coefficient fi on Power Loss
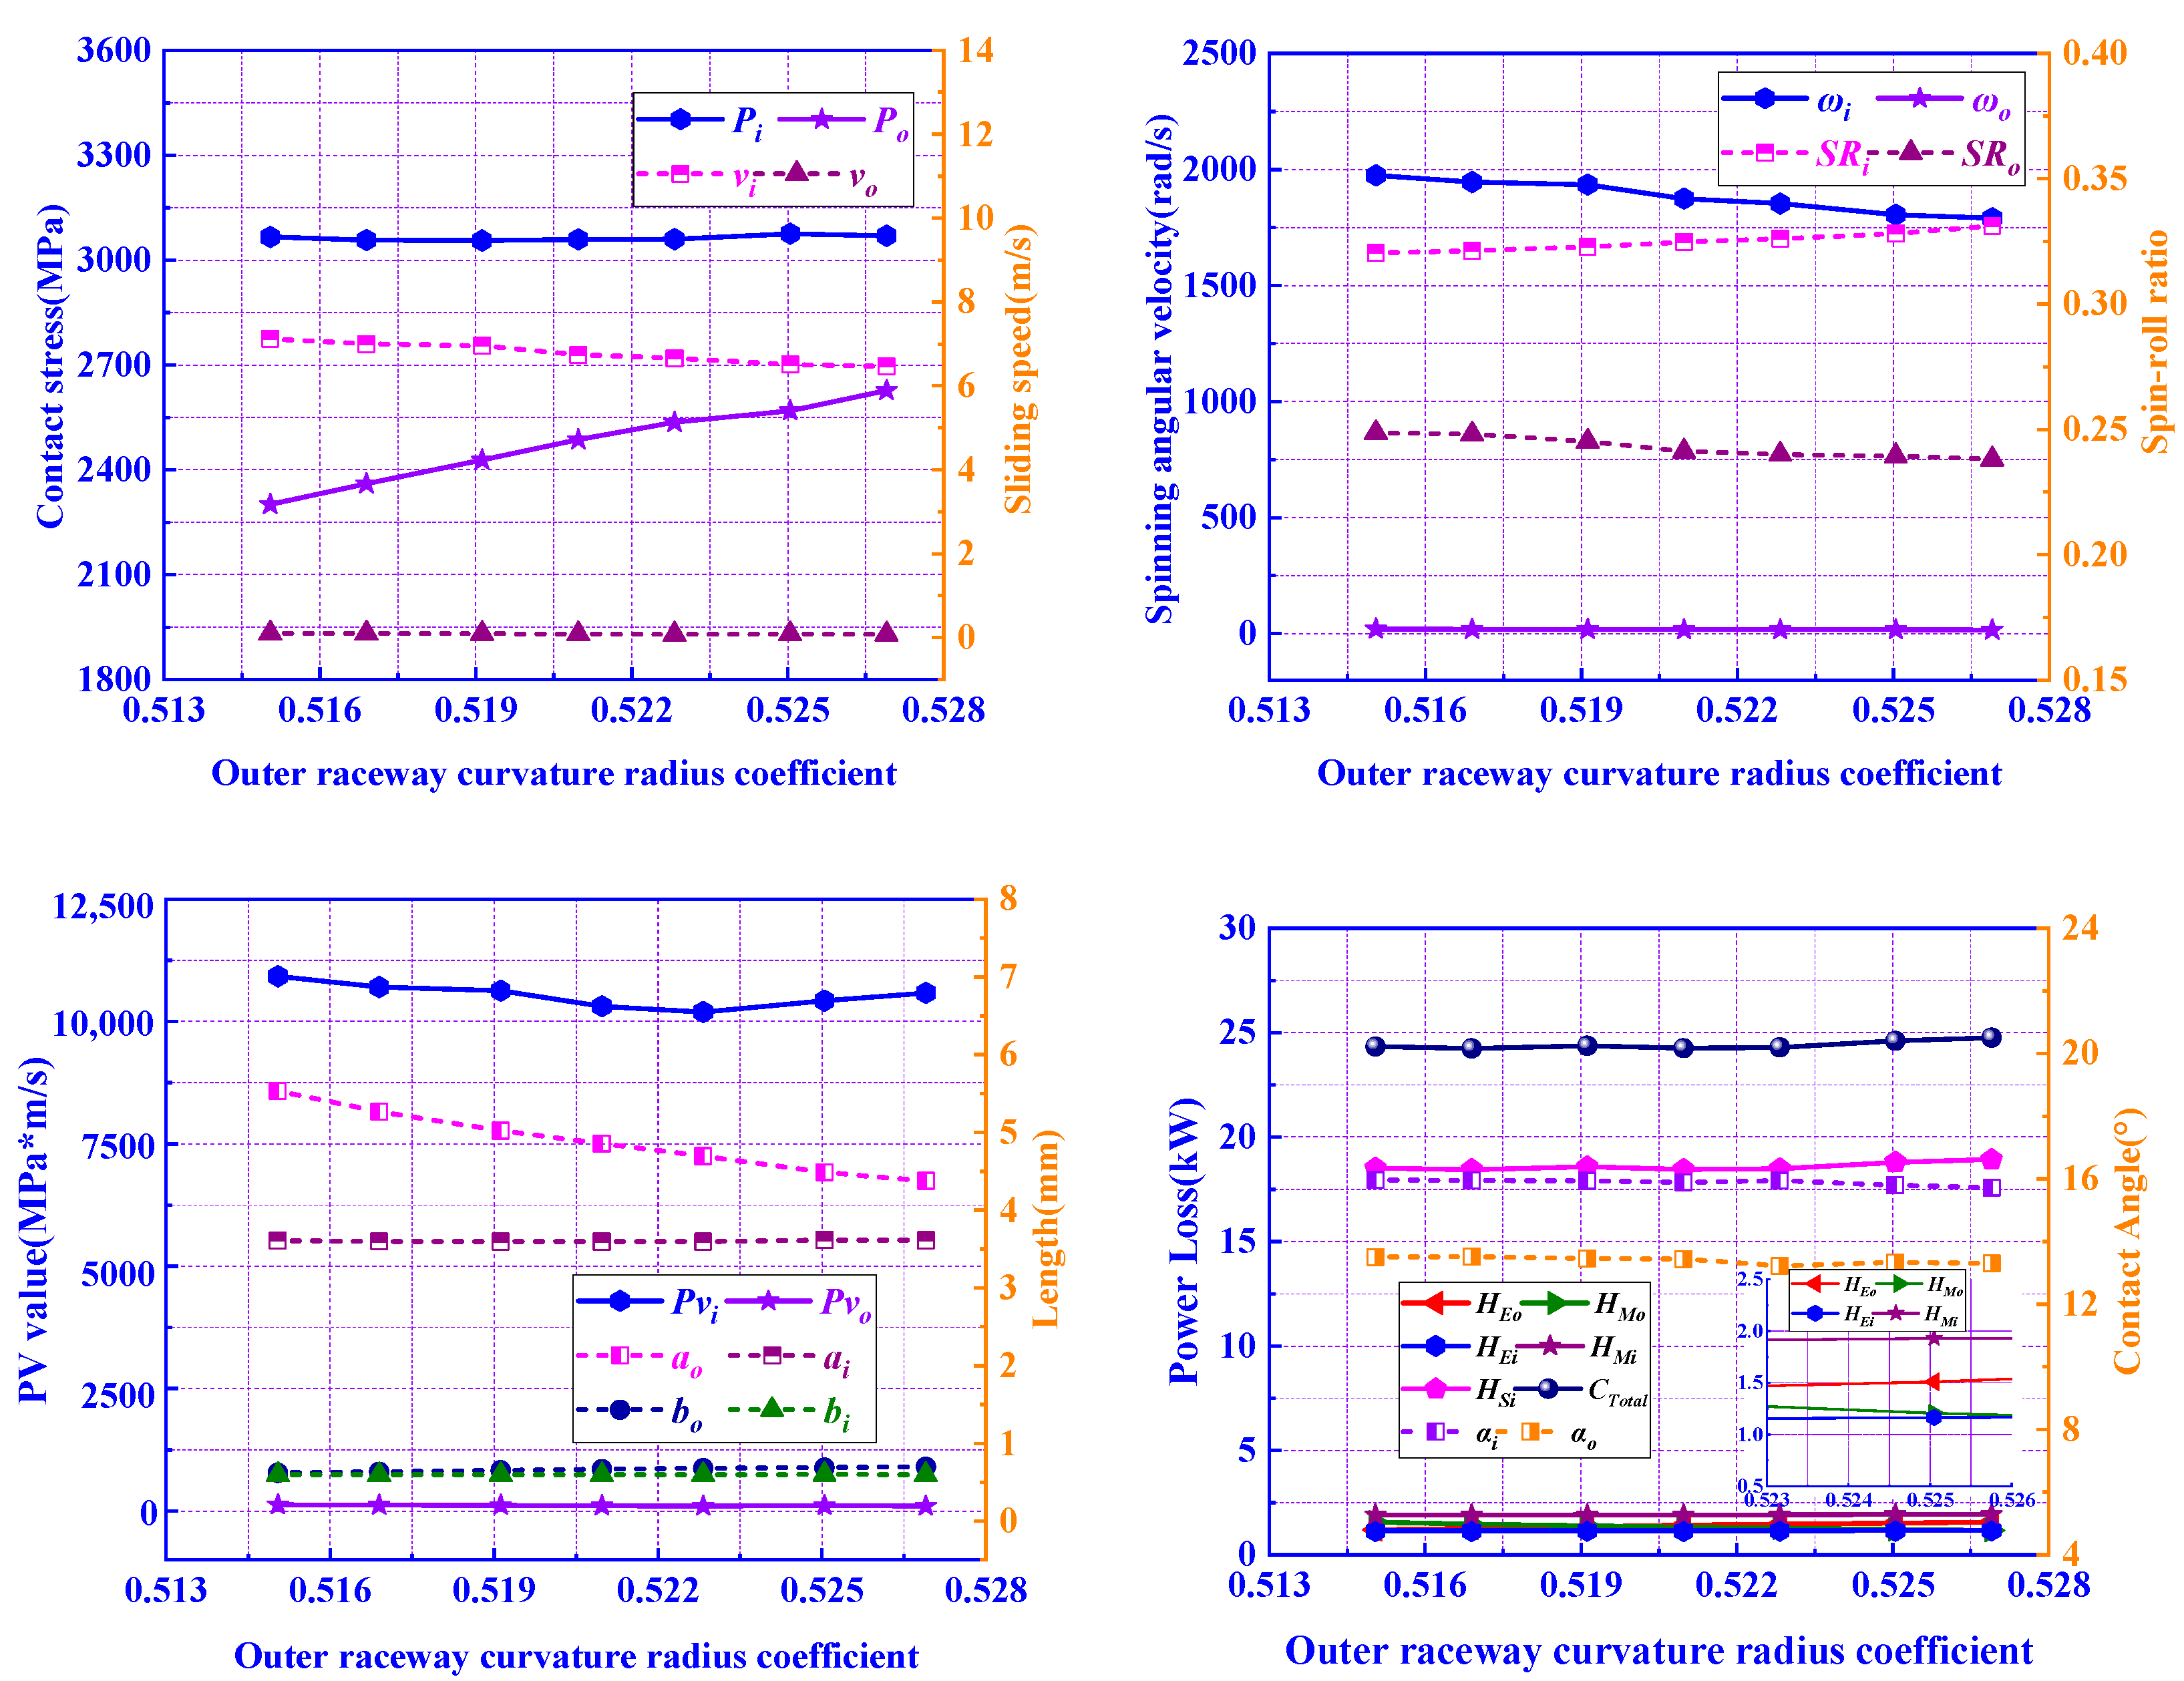
3.2.4. Influence of Outer Raceway Curvature Radius Coefficient fo on Power Loss
3.3. Influence of Working Conditions on Power Loss
3.3.1. Influence of Axial Load Fa on Power Loss
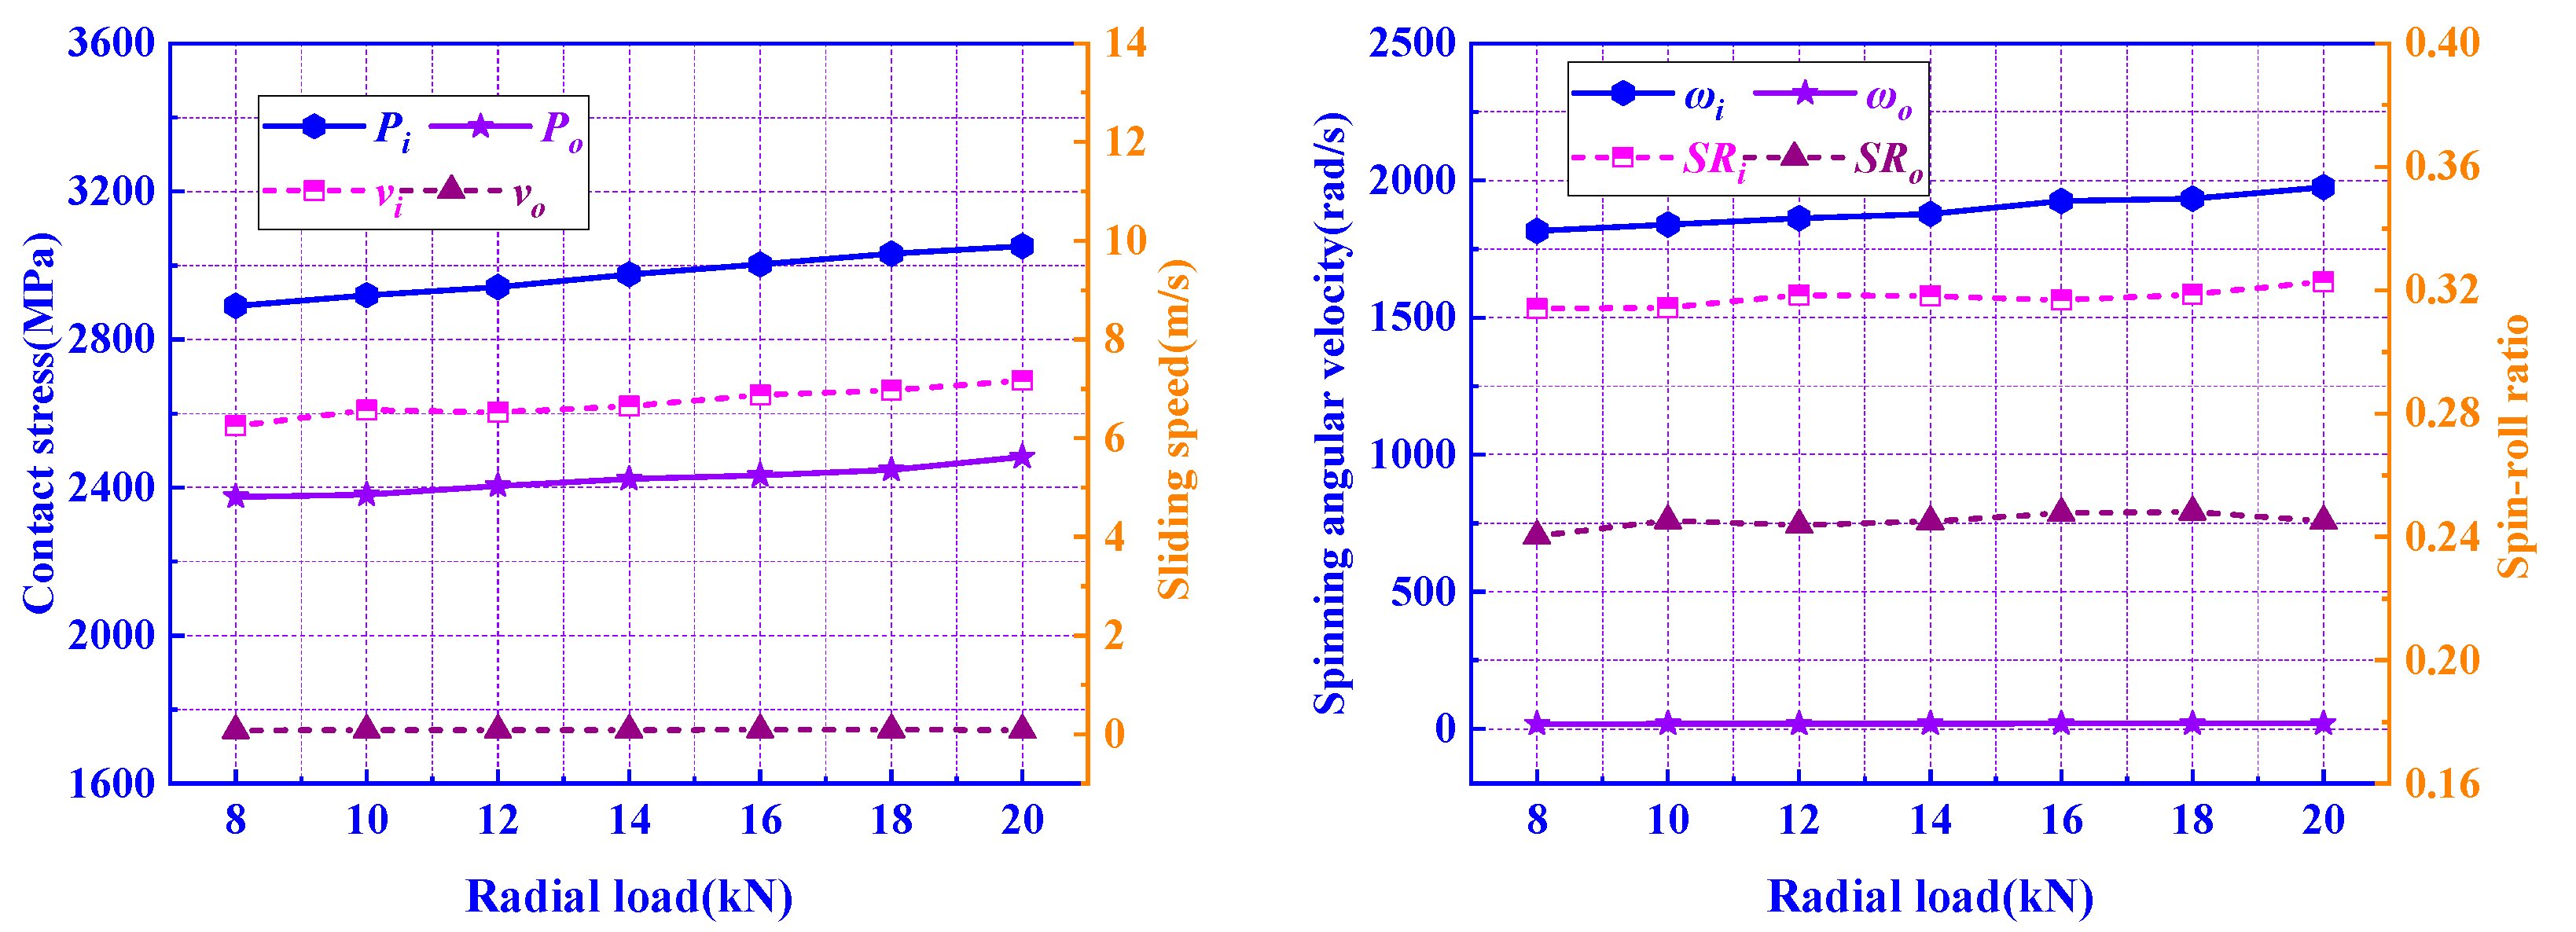
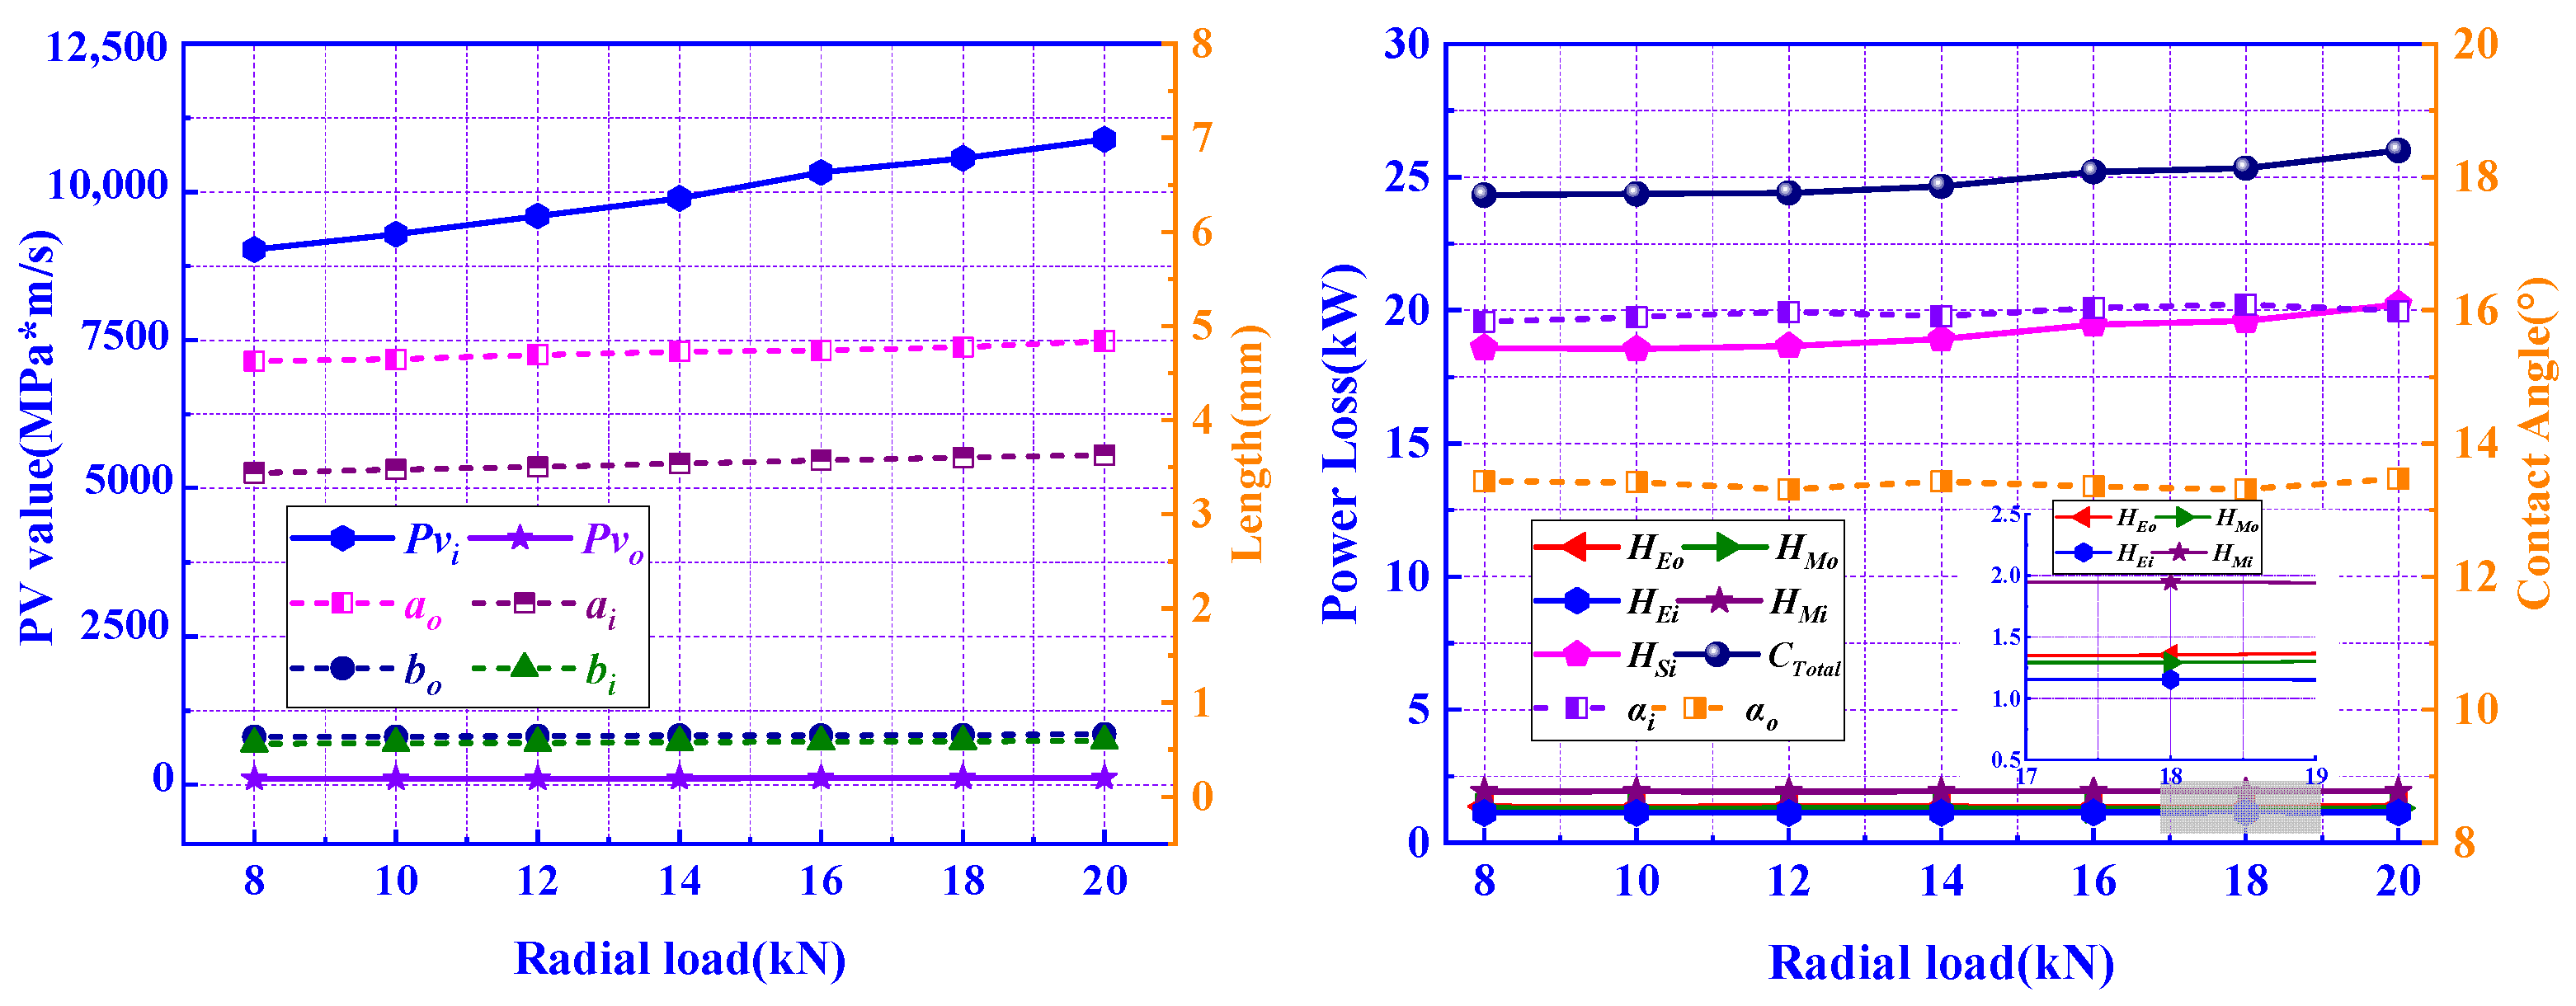
3.3.2. Influence of Radial Load Fr on Power Loss
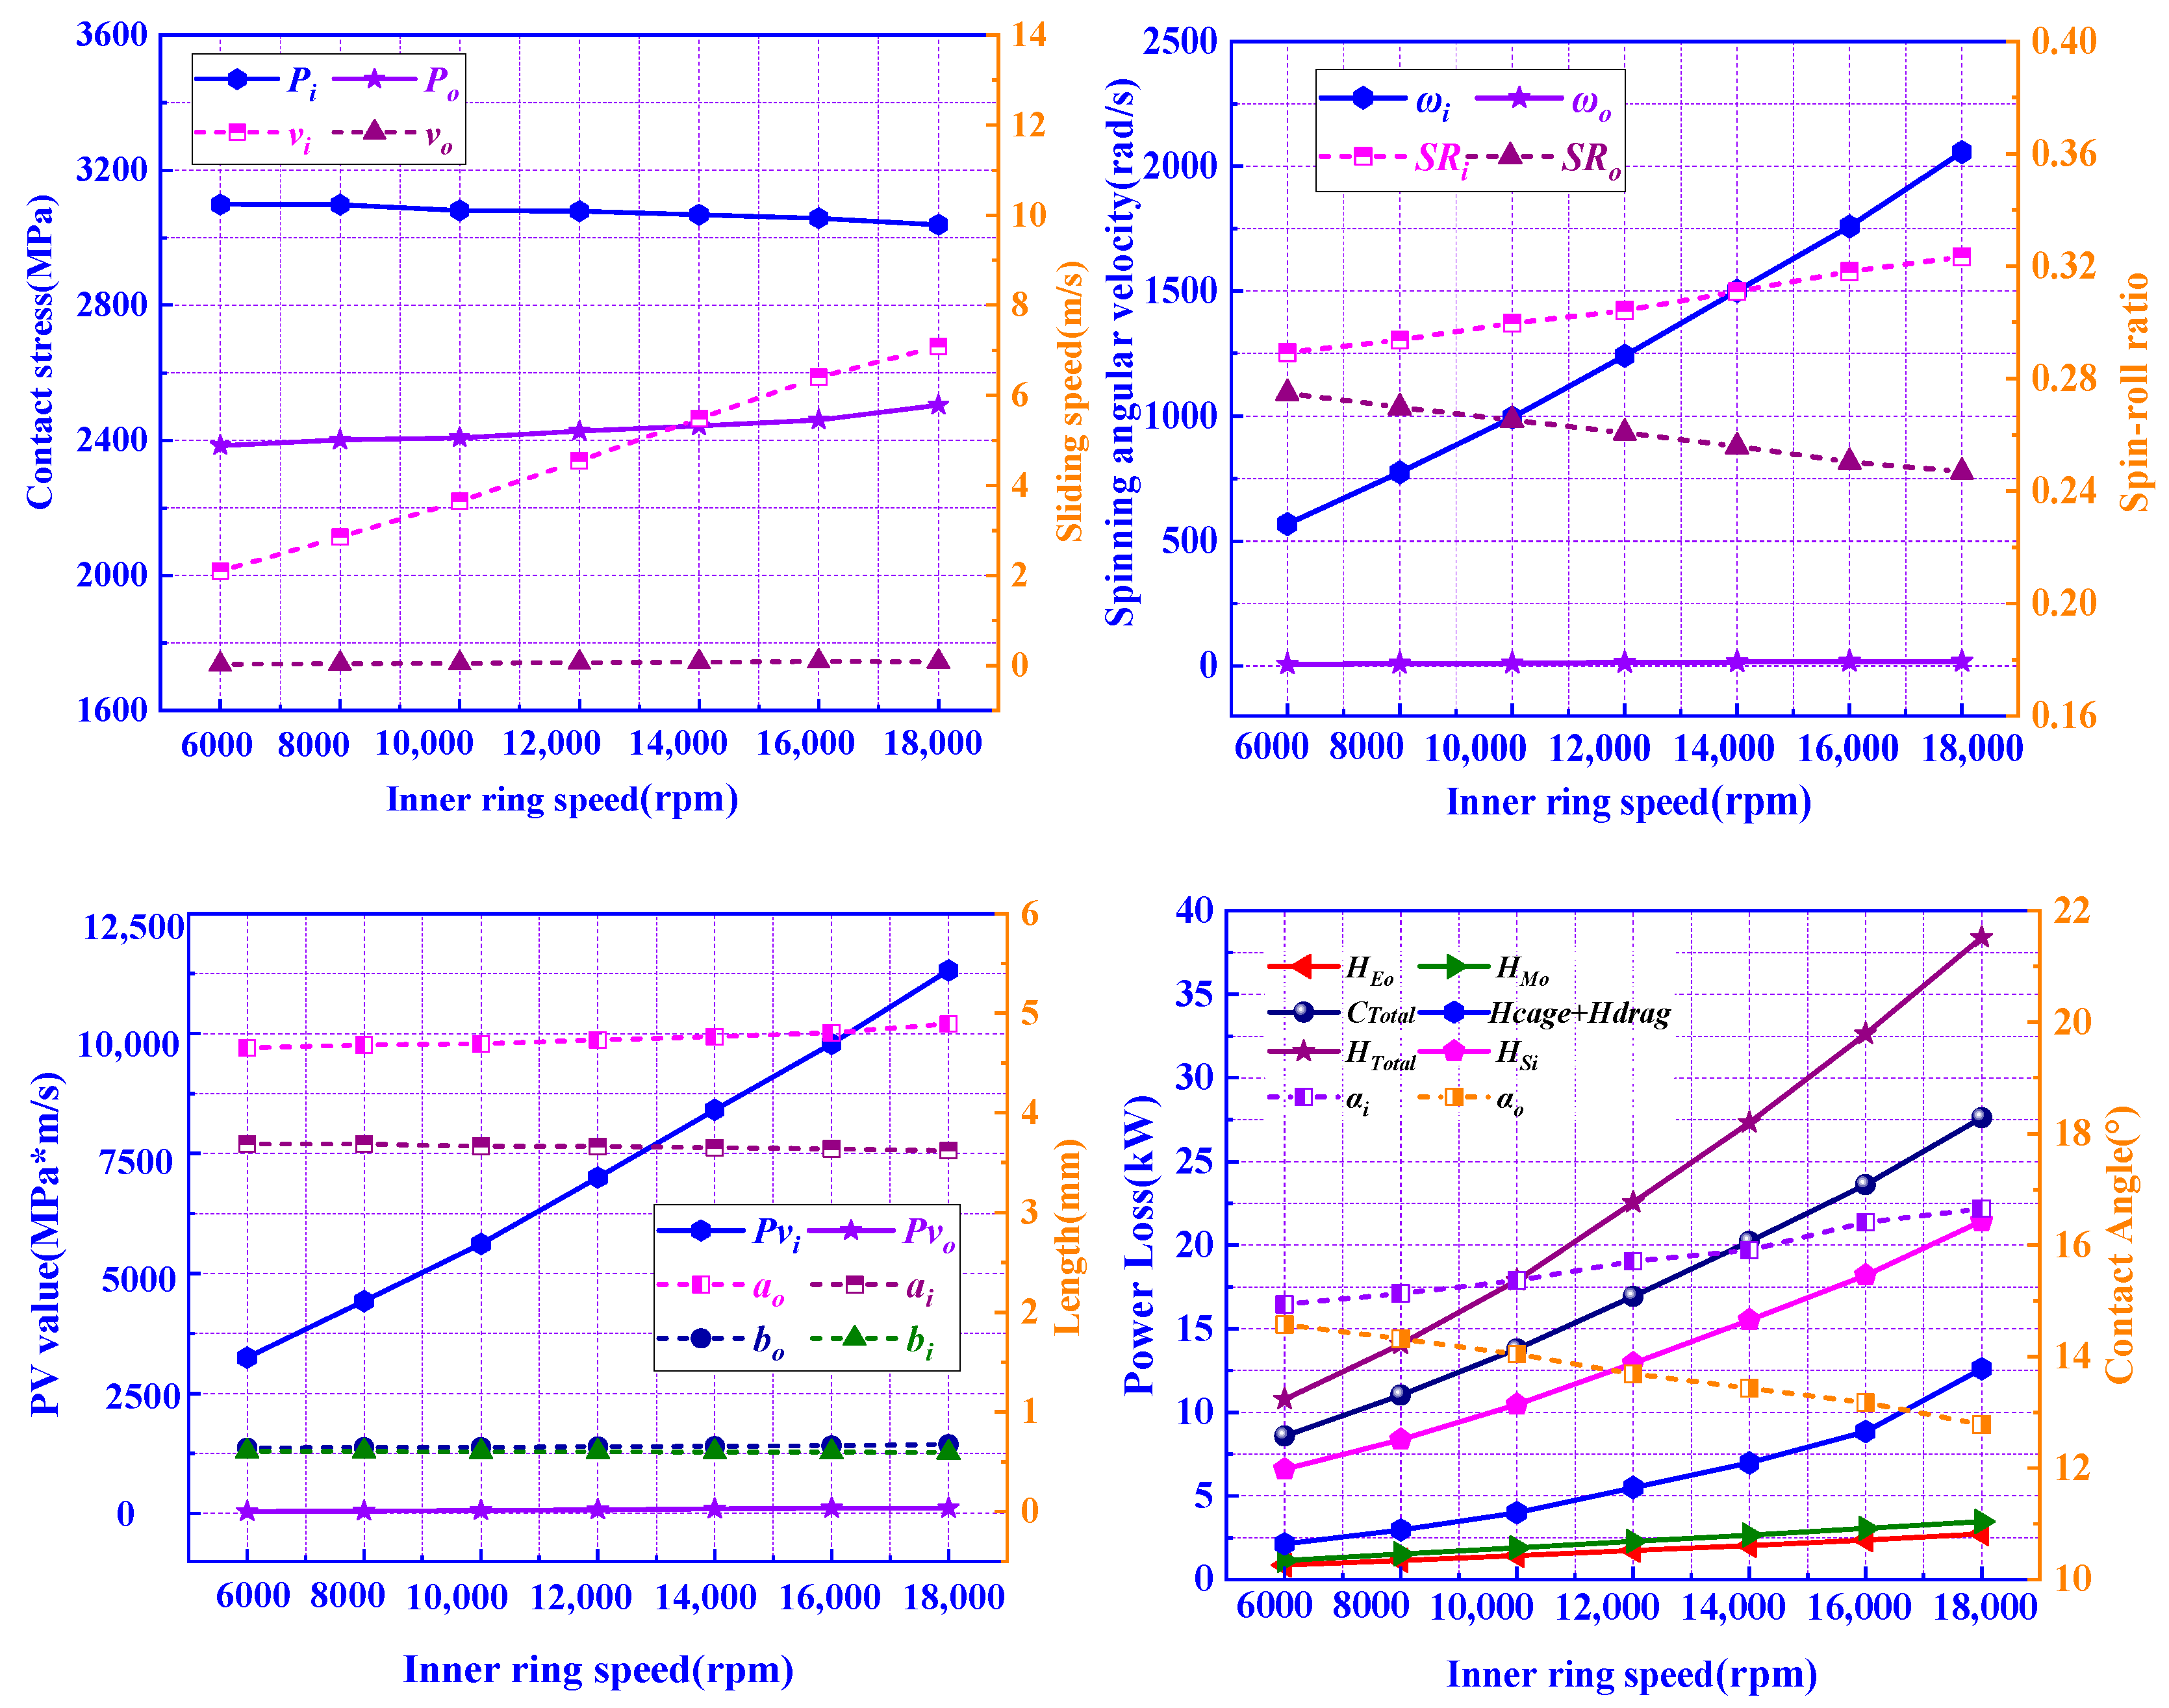
3.3.3. Influence of Bearing Speed ni on Power Loss
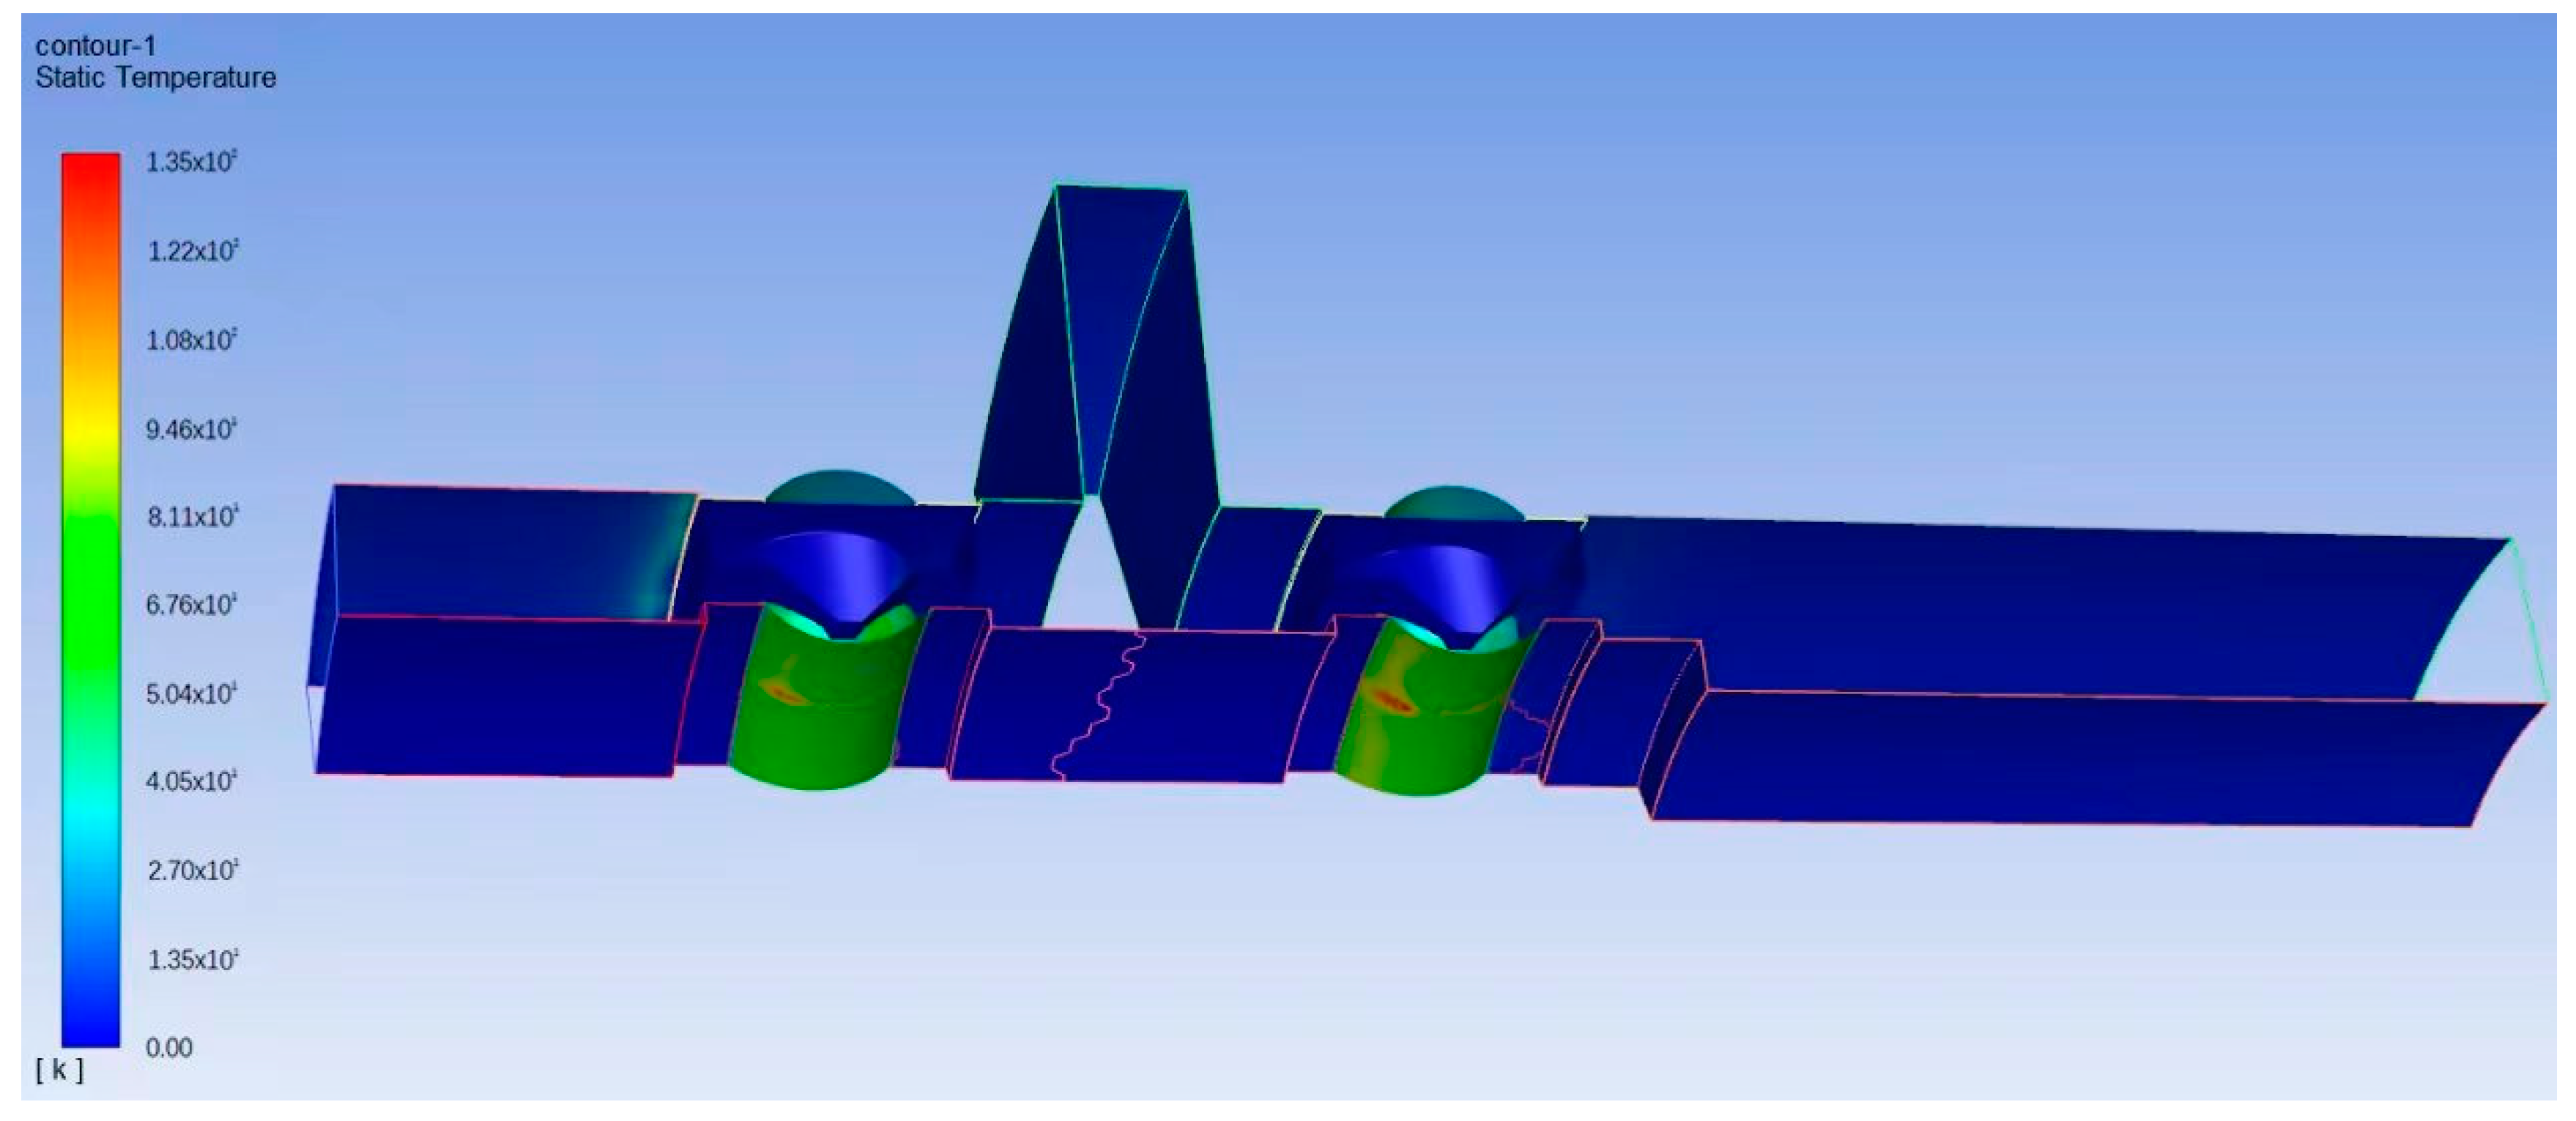
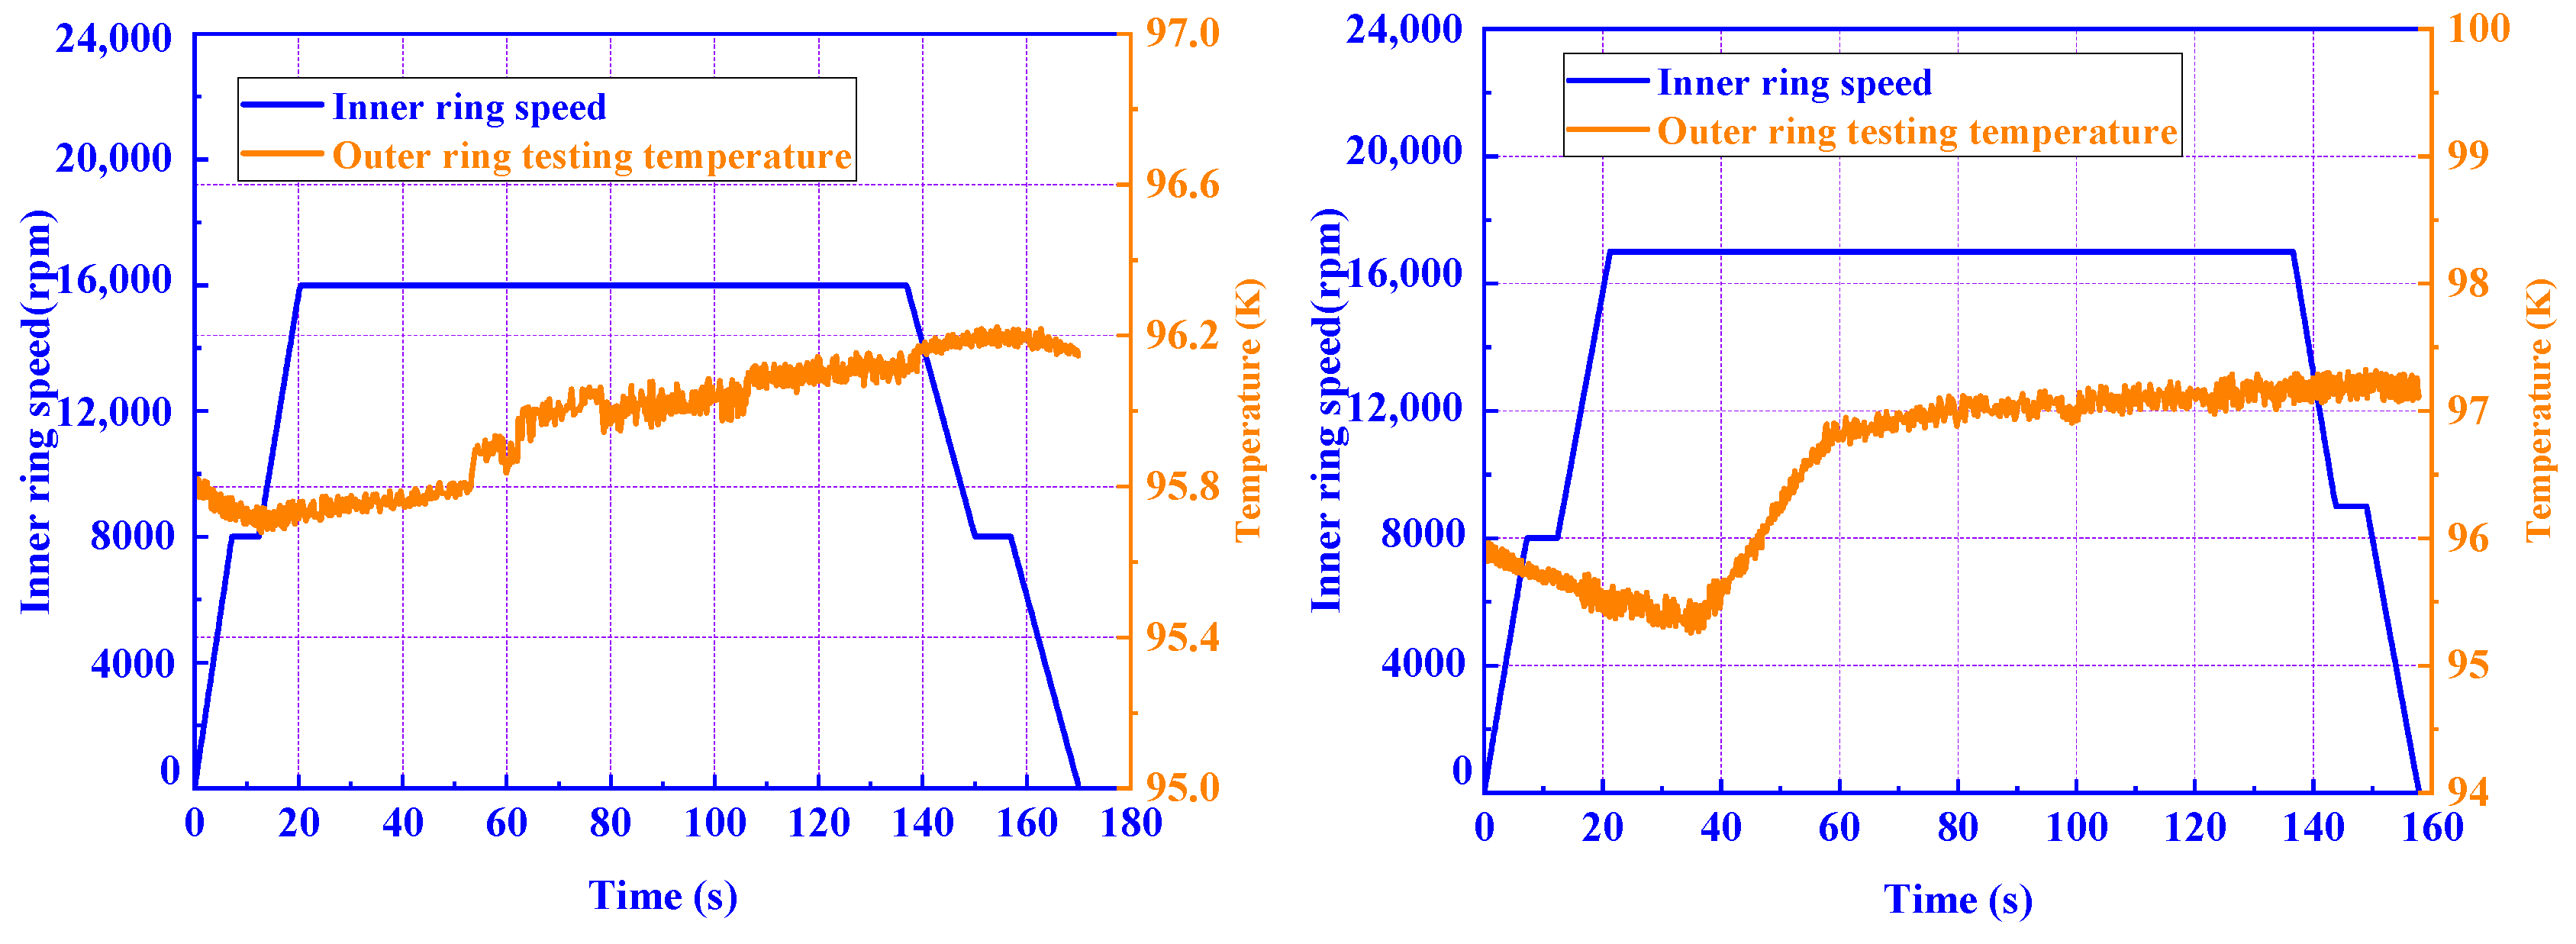
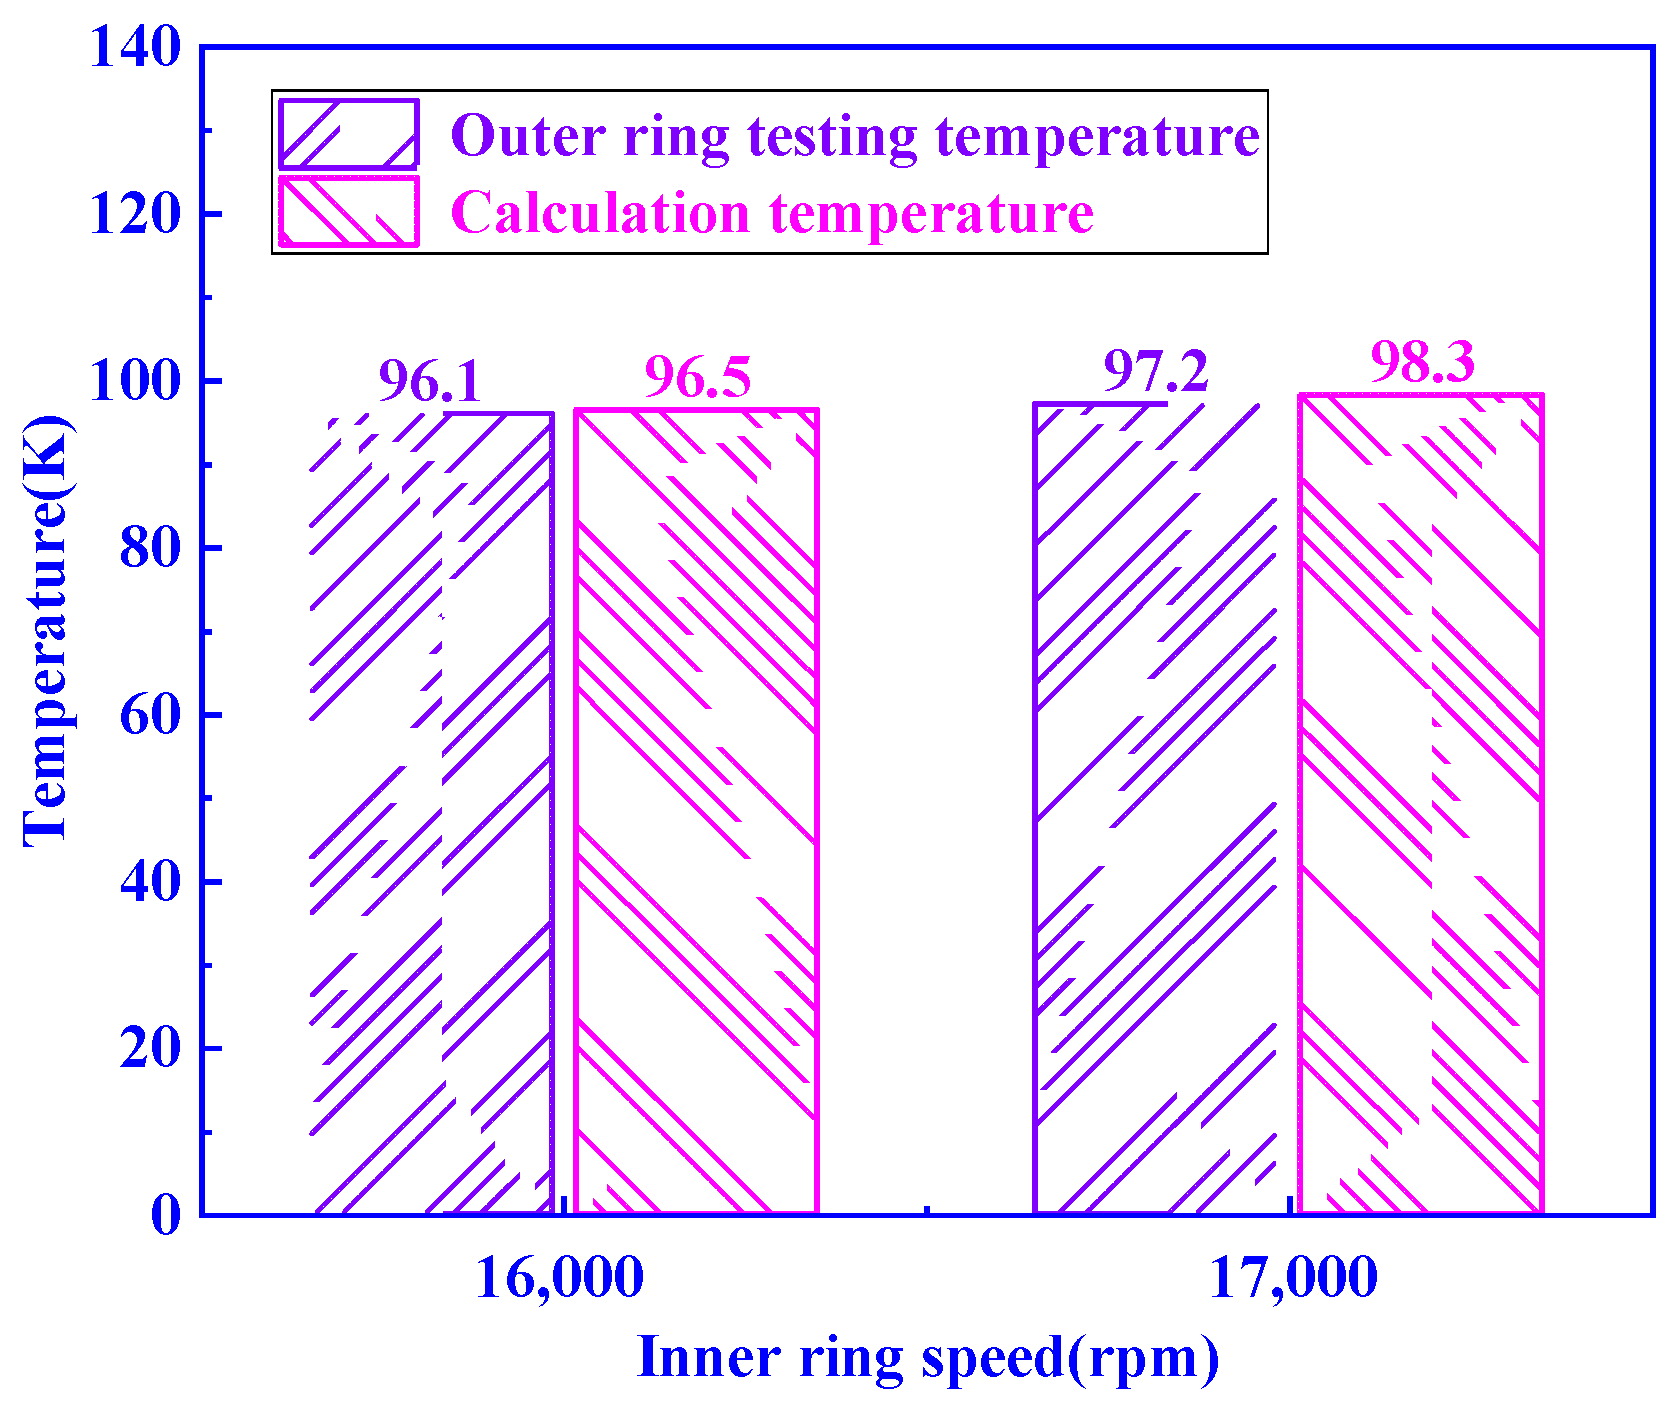
4. Temperature Field Analysis and Test Verification
5. Conclusions
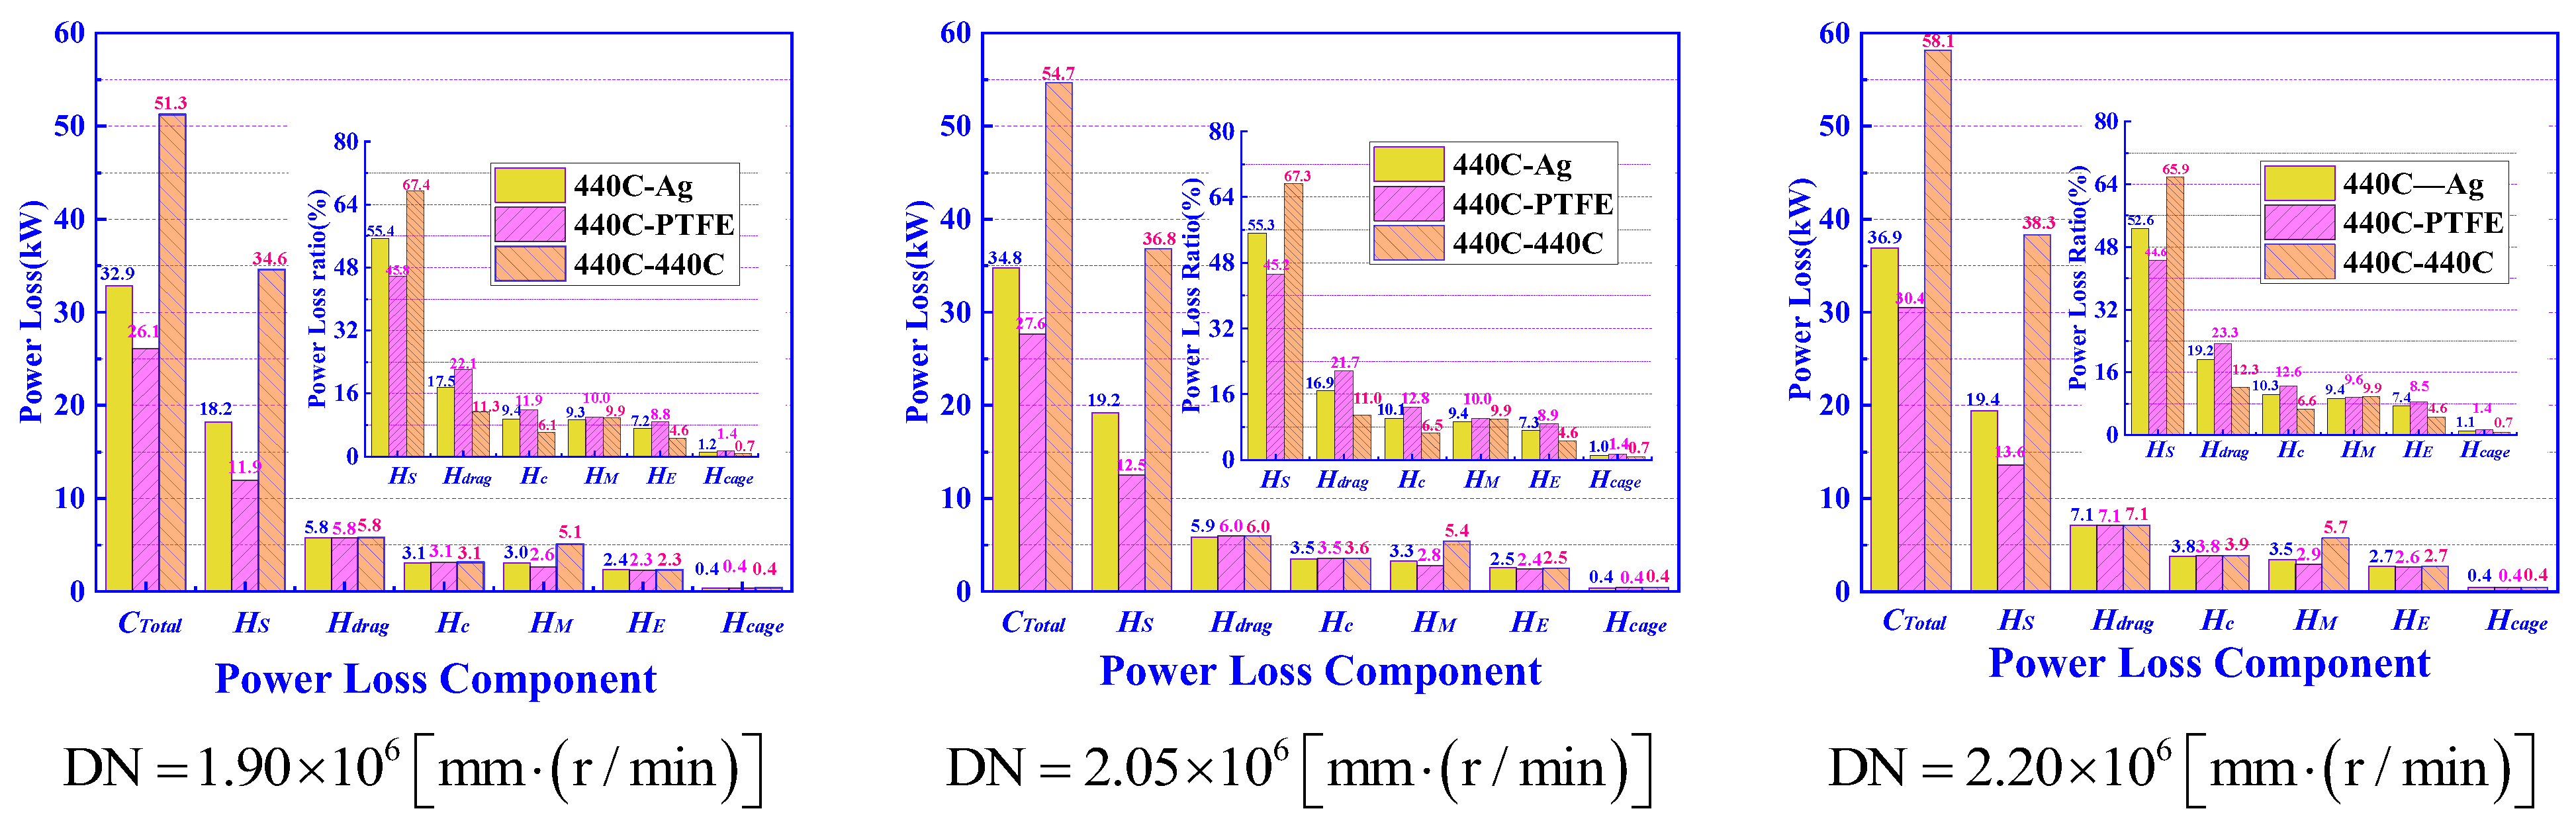
- The total of , , and represents more than 80% of the power loss of a ball bearing within a cryogenic turbopump, and in particular represents the largest percentage (over 45%) throughout. So special attention should be paid to the spin-roll ratio of the ball, which can be a key indicator for this type of ball bearing. At the same time, and cannot be ignored when the ball bearing is working at high speed. The structural design of the cage and the flow of cryogenic fluid should be the focus of the next study.
- A relatively small radial clearance and contact angle of a ball bearing within a cryogenic turbopump are suggested.
- An inner raceway curvature radius coefficient with a larger value is suggested to reduce the power loss, but this will increase the maximum contact stress significantly. Therefore, there is a reasonable range of to balance power loss and fatigue life. The outer raceway curvature radius coefficient has a minor effect on the power loss compared to , but a larger leads to a larger contact stress that is harmful to the bearing’s fatigue life. Therefore, a relatively small value of is suggested. For the ball bearing in this paper, = 0.540 and = 0.520 are suggested.
- When a ball bearing is working at a larger ratio of to , the power loss of the ball bearing does not change much. A larger axial force is the key factor to impact the working states of the ball bearing, which leads to a significant change in the power loss.
Author Contributions
Funding
Institutional Review Board Statement
Informed Consent Statement
Data Availability Statement
Conflicts of Interest
References
- Nosaka, M.; Kato, T. Cryogenic tribology in high-speed bearings and shaft seals of rocket turbopumps. In Tribology—Fundamentals and Advancements; IntechOpen: London, UK, 2013; pp. 109–153. [Google Scholar]
- Dieter, K.H.; David, H.H. Modern Engineering for Design of Liquid-Propellant Rocket Engines. In Progress in Astronautics and Aeronautics; AIAA: Reston, VA, USA, 1992; Volume 147, pp. 155–218. [Google Scholar]
- NASA. Liquid Rocket Engine Turbopump Bearing, NASA SP-8048. 1971. Available online: https://ntrs.nasa.gov/api/citations/19710018535/downloads/19710018535.pdf (accessed on 23 October 2022).
- Gibson, H.G. Design Guide for Bearings Used in Cryogenic Turbopumps and Test Rigs; NTRS 20200000047; NASA Technical Reports Server: New York, NY, USA, 2019. [Google Scholar]
- Gibson, H.G.; Thom, R.; Moore, C.; Haluck, D. History of Space Shuttle Main Engine Turbopump Bearing Testing at the Marshall Space Flight Center. In Proceedings of the 57th JANNAF Joint Propulsion Meeting, Colorado Springs, CO, USA, 3–7 May 2010. [Google Scholar]
- Gibson, H.G. An Evaluation of Bearings Operating in a Cryogenic Environment with Silicon Nitride Rolling Elements; NASA TM-103524; NASA Marshall Space Flight Center: Huntsville, AL, USA, 1991; 20p. [Google Scholar]
- Moore, C.; Gibson, H.; Thom, R. Liquid Hydrogen Testing of Silicon Nitride Bearings for Use in High Speed Turbomachinery. In 32nd Aerospace Mechanisms Symposium; NASA Technical Reports Server: New York, NY, USA, 1998. [Google Scholar]
- Dufrane, K.F.; Merriman, T.L.; Kannel, J.W.; Stockwell, R.D.; Hauser, D.; Vanecho, J.A. Measurements of Elastohydrodynamic Film Thickness, Wear and Tempering Behavior of High Pressure Oxygen Turbopump Bearings; Technical Report; Battelle Laboratories: Columbus, OH, USA, 1984. [Google Scholar]
- Nosaka, M.; Oike, M.; Kikuchi, M.; Kamijo, K.; Tajiri, M. Tribo-characteristics of self-lubricating ball bearings for the LE-7 liquid hydrogen rocket-turbopump. Tribol. Trans. 1993, 36, 432–442. [Google Scholar] [CrossRef]
- Nosaka, M.; Oike, M.; Kikuchi, M.; Kamijo, K.; Tajiri, M. Self-lubricating performance and durability of ball bearings for the LE-7liquid oxygen rocket-turbopump. Lubr. Eng. 1993, 49, 677–688. [Google Scholar]
- Nosaka, M.; Oike, M.; Kikuchi, M.; Nagao, R.; Mayumi, T. Evaluation of durability for cryogenic high-speed ball bearings of LE-7 rocket turbopumps. Lubr. Eng. 1996, 52, 221–233. [Google Scholar]
- Nosaka, M.; Oike, M.; Kikuchi, M.; Mayumi, T. Tribo-characteristics of cryogenic hybrid ceramic ball bearings for rocket turbopumps: Self-lubricating performance. Tribol. Trans. 1997, 40, 21–30. [Google Scholar] [CrossRef]
- Nosaka, M.; Kikuchi, M.; Oike, M.; Kawai, N. Tribo-Characteristics of Cryogenic Hybrid Ceramic Ball Bearings for Rocket Turbopumps: Bearing Wear and Transfer Film. Tribol. Trans. 1999, 42, 106–115. [Google Scholar] [CrossRef]
- Nosaka, M.; Kikuchi, M.; Kawai, N.; Kikuyama, H. Effects of iron fluoride layer on durability of cryogenic high-speed ball bearings for rocket turbopumps. Tribol. Trans. 2000, 43, 163–174. [Google Scholar] [CrossRef]
- Chang, L.; Hall, P.B.; Thom, R. Scuffing Characteristics of High-Load Rolling/Sliding Contacts Operating in Liquid Oxygen–-Effects of Materials and Surface Roughness. Tribol. Trans. 1998, 41, 87–95. [Google Scholar] [CrossRef] [Green Version]
- Wang, L.Q.; Qi, Y.L.; Jiang, H.Y.; Qian, Z.D.; Su, W.M.; Wang, W.B. Tribo-characteristics of Hybrid Ceramic Ball Bearing in Liquid Nitrogen. Tribology 1999, 19, 122–125. (In Chinese) [Google Scholar]
- Nosaka, M.; Takada, S.; Kikuchi, M.; Sudo, T.; Yoshida, M. Ultra-high-speed performance of ball bearings and annular seals in liquid hydrogen at up to 3 million DN (120,000 rpm). Tribol. Trans. 2004, 47, 43–53. [Google Scholar] [CrossRef]
- Ma, M.; Deng, S.; Liang, B.; Ning, H. Design of lower temperature bearings in rocket engine. Bearing 2006, 6, 10–12. (In Chinese) [Google Scholar]
- Li, H.; Zhang, X.; Ma, M.; Li, S. Analysis on circumferential belt of steel balls for high-speed ball bearings under low temperature. Bearing 2011, 3, 29–30. (In Chinese) [Google Scholar]
- Nosaka, M. Cryogenic tribology of high-speed bearings and shaft seals in liquid hydrogen. Tribol. Online 2011, 6, 133–141. [Google Scholar] [CrossRef] [Green Version]
- Servais, C.; Bozet, J.-L.; Kreit, P.; Guingo, S. Experimental validation of a thermal model of a LOx flooded ball bearing. Tribol. Int. 2014, 80, 71–75. [Google Scholar] [CrossRef]
- Vartha, V.; Kumar, M.A.; Mathew, S.; Aneesh, R.; Bejoy, J.; Thomas, T.K.; Shajimon, A.C. Failure analysis of ball-bearing of turbo-pump used in Liquid Rocket Engine. Mater. Sci. Forum 2015, 83, 709–712. [Google Scholar] [CrossRef]
- Choe, B.S.; Lee, J.; Jeon, D.; Lee, Y. Numerical study of cage dynamics focused on hydrodynamic effects of guidance land clearances for different ball-pocket clearances in cryogenic environments. J. Eng. Gas Turbines Power 2018, 140, 042502. [Google Scholar] [CrossRef]
- Choe, B.; Lee, J.; Jeon, D.; Lee, Y. Experimental study on dynamic behavior of ball bearing cage in cryogenic environments, Part I: Effects of cage guidance and pocket clearances. Mech. Syst. Signal Process. 2019, 115, 545–569. [Google Scholar] [CrossRef]
- Choe, B.; Kwak, W.; Jeon, D.; Lee, Y. Experimental study on dynamic behavior of ball bearing cage in cryogenic environments, Part II: Effects of cage mass imbalance. Mech. Syst. Signal Process. 2019, 116, 25–39. [Google Scholar] [CrossRef]
- Wang, Q.; Zheng, F.; Wang, T. Tribological properties of polymers PI, PTFE and PEEK at cryogenic temperature in vacuum. Cryogenics 2016, 75, 19–25. [Google Scholar] [CrossRef]
- Miao, X.; Hu, M.; Li, A.; Wang, D.; Weng, L.; Li, X.; Zhang, G. Investigation on the lubricity of self-lubricating ball bearings for cryogenic turbine pump. Tribol. Int. 2018, 121, 45–53. [Google Scholar] [CrossRef]
- Kwak, W.; Lee, J.; Lee, Y.B. Theoretical and experimental approach to ball bearing frictional characteristics compared with cryogenic friction model and dry friction model. Mech. Syst. Signal Process. 2019, 124, 424–438. [Google Scholar] [CrossRef]
- Liu, F.; Su, B.; Zhang, G.; Ren, J.; Zhang, W. Development of a Cryogenic Tester with Air Bearing to Test Sliding-Rolling Contact Friction. Lubricants 2022, 10, 119. [Google Scholar] [CrossRef]
- Xia, Z.; Wu, Y.; Ma, T.; Bao, Z.; Tian, J.; Gao, L.; Sun, J.; Li, S. Experimental study on adaptability of full ceramic ball bearings under extreme conditions of cryogenics and heavy loads. Tribol. Int. 2022, 175, 107849. [Google Scholar] [CrossRef]
- Su, H.; Lv, C.; Shang, J.; Huang, B.H.; Feng, Y.; Wu, J.H. Performance study of preloaded cryogenic bearings in liquid hydrogen pump. IOP Conf. Ser. Mater. Sci. Eng. 2022, 1240, 012056. [Google Scholar] [CrossRef]
- Gupta, P.K.; Gibson, H.G. Real-Time Modeling of Thermal Interactions in Cryogenic Ball Bearings; NTRS 20190001244; NASA Technical Reports Server: New York, NY, USA, 2019. [Google Scholar]
- Gupta, P.K.; Gibson, H.G. Real-Time Dynamics Modeling of Cryogenic Ball Bearings with Thermal Coupling. J. Tribol. 2020, 143, 031201. [Google Scholar] [CrossRef]
- Tevaarwerk, J.L. Development of a Cryogenic Traction Tester; NASA Contract, No. NAS8-38552; NASA: Huntsville, AL, USA; MSFC: Huntsville, AL, USA, 1992. [Google Scholar]
- Kragelskii, I.V. Friction and Wear; Butterwonhs: London, UK, 1965. [Google Scholar]
- Mao, K.; Miao, X.S.; Chen, H.; Niu, X.Z. Experimental research on bearing life of turbopump in liquid rocket engine. J. Rocket Propuls. 2016, 42, 24–27. (In Chinese) [Google Scholar]
- Xu, J.; Li, C.; Miao, X.; Zhang, C.; Yuan, X. An Overview of Bearing Candidates for the Next Generation of Reusable Liquid Rocket Turbopumps. Chin. J. Mech. Eng. 2020, 33, 13. [Google Scholar] [CrossRef]


| Contact Interface | 440C-Ag Coating | 440C-PTFE Coating | 440C-PTFE | ||||||
|---|---|---|---|---|---|---|---|---|---|
| Contact Stress | 2.5 GPa | 3.0 GPa | 3.5 GPa | 2.5 GPa | 3 GPa | 3.5 GPa | 12 MPa | 16 MPa | 20 MPa |
| Sm (m/s) | 3.0 | 3.3 | 3.6 | 2.44 | 2.56 | 2.66 | 2.58 | 2.52 | 2.46 |
| Km | 0.138 | 0.128 | 0.121 | 0.130 | 0.126 | 0.119 | 0.125 | 0.127 | 0.137 |
| K∞ | 0.124 | 0.116 | 0.102 | 0.109 | 0.105 | 0.100 | 0.106 | 0.110 | 0.117 |
| Coordinate System Name | Coordinate System Symbol | Coordinate System Definition |
|---|---|---|
| Inertial coordinate system | X-axis coincides with rotating axis of bearing, and YZ-plane parallels to radial plane through bearing center. | |
| Coordinate system of the jth ball | obj coincides with ball’s mass center, ybj axis is along radial direction of bearing, and zbj axis is along circumferential direction of bearing. | |
| Coordinate system of cage’s | xc-axis coincides with rotating axis of cage, yczc-plane parallels to radial plane through cage center, oc coincides with geometric center of cage. | |
| Coordinate system of inner ring | xi-axis is along with rotating axis of inner ring, yizi-plane parallels with radial plane through inner ring mass center, oi coincides with geometric center of inner ring. | |
| Coordinate system of the jth cage pocket center | opj coincides with geometric center of cage pocket, ypj-axis is along radial direction of bearing, and zpj-axis is along circumferential direction of bearing. |
| Item | Value |
|---|---|
| Bearing outside diameter (mm) | 218 |
| Bearing bore diameter (mm) | 118 |
| Bearing width (mm) | 40 |
| Ball diameter (mm) | 26.988 |
| Material of inner ring, outer ring, ball | 440C |
| Material of cage | PTFE |
| Material of raceway coating | Ag |
| No. | Type | Variable |
|---|---|---|
| 1 | Inlet liquid nitrogen supply speed, pressure, temperature, area | Qin, Pin, Tin, Sin |
| 2 | Outlet pressure, temperature | Pout, Tout |
| 3 | cage revolution speed, ball rotation speed | nc, nr |
| 4 | Inner surface temperature, outer surface temperature | Tic, Toc |
| Medium | Density kg/m3 | Specific Heat J/(kg·K) | Thermal Conductivity W/(m·K) | Viscosity kg/m-s | Moles kg/kmol |
|---|---|---|---|---|---|
| LN2 | 808.4 | 1040 | 0.026 | 0.0001 | 28.01 |
| PTFE | 2160 | 960 | 0.25 | - | - |
| 440C | 7750 | 481 | 29.3 | - | - |
| ni (rpm) | nc (rpm) | nr (rpm) | α (°) | Ball-Outer Raceway (W) | Ball-Inner Raceway (W) | Ball-Cage (W) | Ball-Liquid (W) | Cage-Liquid (W) |
|---|---|---|---|---|---|---|---|---|
| 16,000 | 6805 | 43,177 | 17.6 | 190 | 1638 | 30 | 443 | 238 |
| 17,000 | 7239 | 45,833 | 18.0 | 211 | 1729 | 32 | 462 | 271 |
| Tin (K) | Tic (K) | Toc (K) | Tout (K) | Pin (MPa) | Pout (MPa) | Qin (kg/s) |
|---|---|---|---|---|---|---|
| 80 | 98 | 98 | 88 | 3.6 | 3.45 | 14 |
Publisher’s Note: MDPI stays neutral with regard to jurisdictional claims in published maps and institutional affiliations. |
© 2022 by the authors. Licensee MDPI, Basel, Switzerland. This article is an open access article distributed under the terms and conditions of the Creative Commons Attribution (CC BY) license (https://creativecommons.org/licenses/by/4.0/).
Share and Cite
Zhang, W.; Zhang, C.; Miao, X.; Li, L.; Deng, S. Research on the Power Loss of High-Speed and High-Load Ball Bearing for Cryogenic Turbopump. Machines 2022, 10, 1080. https://doi.org/10.3390/machines10111080
Zhang W, Zhang C, Miao X, Li L, Deng S. Research on the Power Loss of High-Speed and High-Load Ball Bearing for Cryogenic Turbopump. Machines. 2022; 10(11):1080. https://doi.org/10.3390/machines10111080
Chicago/Turabian StyleZhang, Wenhu, Chaojie Zhang, Xusheng Miao, Liang Li, and Sier Deng. 2022. "Research on the Power Loss of High-Speed and High-Load Ball Bearing for Cryogenic Turbopump" Machines 10, no. 11: 1080. https://doi.org/10.3390/machines10111080