Article

Output Power and Wake Flow Characteristics of a Wind Turbine with Swept Blades

1
College of Electrical, Energy and Power Engineering, Yangzhou University, Yangzhou 225127, China
2
Guangling College, Yangzhou University, Yangzhou 225000, China
3
Key Laboratory of Wind Energy and Solar Energy Technology, Inner Mongolia University of Technology, Hohhot 010051, China
*
Author to whom correspondence should be addressed.
These authors contributed equally to this work.
Machines 2022, 10(10), 876; https://doi.org/10.3390/machines10100876
Submission received: 2 September 2022 / Revised: 22 September 2022 / Accepted: 26 September 2022 / Published: 28 September 2022
(This article belongs to the Special Issue Aerodynamics Applied to Turbomachinery)

Abstract

:
To study the output power and wake flow characteristics of a wind turbine with swept blades, taking the blade tip offset and the location of the sweep start as two variables, the straight blade of the DTU-LN221 baseline airfoil was optimally designed with sweep. Then the designed wind turbine was numerically simulated, and the swept blade with the best optimal output power characteristics was selected for the wind tunnel test. The results indicate that for both forward and backward swept blades, increasing the blade tip offset and the sweep start location could decrease the power and thrust coefficients. Compared with the backward swept design, the forward swept design significantly improved the blades’ power characteristics. By adopting swept blades instead of straight blades, wind turbines could generate more power at high tip speed ratios, especially in yaw conditions. The streamwise velocity recovery of the wind turbine with swept blades was slower than that with straight blades as the lateral velocity near the wake region was higher than that with straight blades. Besides, the wind turbine with swept blades had a greater turbulence intensity of the wake near the wake center than that with straight blades with or without yaw condition.

1. Introduction

With the gradual depletion of traditional energy and the increasing pollution problem, it is urgent for China to explore clean energy alternatives and take the path of sustainable development. Among various renewable energy resources, wind energy is abundant and widely available. The development of wind energy is in line with the demands of energy structure adjustment, reducing greenhouse gas emissions, and strengthening energy security. Meanwhile, wind energy technologies have been relatively mature and have broad prospects for development and utilization [1]. Since wind power development in high-wind-speed areas has become saturated, development in low-wind-speed areas has gradually attracted people’s attention (i.e., the average wind speed range of 5–7 m/s) [2]. Low-wind-speed resources in China are mainly concentrated in the mid-east and south regions, which are close to the areas served by grid load, where the consumption of industrial development and urban power is tremendous. Hence, it is of great significance to develop and fully use low-speed wind energy nearby.
The blade is a critical component of wind turbines that is used to harvest energy. Current wind turbines with straight blades have a low wind energy utilization rate in low wind speed ranges. Studies have found that bird wings can freely control the flight direction and speed when facing weak wind [3,4]. Hence, such perfect low-wind-speed control performance could make great sense when investigating the aerodynamic characteristics of wind turbines with swept blades in low wind speed ranges. Inspired by the curved shape of bird wings, biomimetic blade designs are proposed in current research. However, research on the performance of wind turbines with swept blades mainly applies the numerical simulation method, and the small number of available experimental studies provides insufficient test data to contrast the performance [4]. Khalafallah et al. [5,6] simulated the wind turbine power and thrust coefficients with swept blades at different tip speed ratios. They also analyzed the flow field, pressure distribution, and local lateral and streamwise forces. The results show that, compared with straight blades, the power coefficient of the wind turbine with swept blades near the blade root could gain the highest value, and it raised along with the increase of thrust. The best performance was attained when the location of the sweep start was at 25% of the rotor radius. At the same time, the research indicated that horizontal axis wind turbines with forward and backward swept blades could generate more power than other straight blades and swept blades. Amano et al. [7] studied the design of backward swept blades to improve blade efficiency. The design aimed to select the appropriate cross-section direction and size according to the oncoming wind speed. It was found that swept blades could provide better performance at lower wind speeds, while at higher wind speeds, they provide lower output power than straight blades. Shen et al. [8] adopted the lifting surface method with free wake to analyze the improvement effect on aerodynamic characteristics of the wind turbines with swept blades in contrast to the wind turbines with straight blades. The prediction results revealed that the lift on the mid-posterior segment of the blade was less than the lift on the forward swept blade, while the front section of the blade provided more lift. In addition, applying the backward swept blade helped enhance the wind energy utilization coefficients of the wind turbine to a certain extent. Kaya et al. [9] evaluated the aerodynamic performance of the horizontal axis wind turbines with forward and backward swept blades. The effects of the sweep direction, location of the sweep starts, and blade tip offset on wind turbines’ aerodynamic performance were also investigated. In view of the results, the forward sweep blades leave wind turbines with higher thrust coefficients, but lower wind energy utilization.
Meanwhile, the backward swept blades could reduce thrust coefficients and the output power of the wind turbines. The lifting line method with prescribed wake was used by Chattot [10] to study the aerodynamic performance of wind turbines with swept blades. They found that a proper sweep of the blades could successfully improve it. Even so, since sweep blades make different effects, the aerodynamic performance depends on how blades were designed. Through the computational fluid dynamics method, Kong et al. [11] researched the aerodynamic performance of wind turbines with curved and swept blades, finding that the forward and backward sweep would have a certain impact on the pressure distribution at the leading edge of the blade. Owing to the large pressure on the suction surface of the blade that the bending brings, the aerodynamic characteristics of the wind turbines were reduced. Chen et al. [12] performed an optimal design on the straight blade. As a result of the numerical simulation calculation and analysis, the research indicated that the backward swept blade had a noticeable improvement effect on the dynamic stall phenomenon of wind turbines. With this discovery, wind turbines could maintain good aerodynamic performance in high wind speed ranges and boost the output power.
Genetic algorithm, particle swarm optimization, simulated annealing algorithm, and other optimization algorithms were generally used in the design of swept blades to select the optimal sweeping shape. Ding and Zhang [13] used the starting position of the swept curve and the first derivative of the swept curve at the tip of the blade as the design variables, the maximum AEP (annual energy production) and the minimum blade root loads as the optimization objectives, and the genetic algorithm for optimization. Based on the results, swept blades presented an increase in maximum AEP of 1.34% compared with baseline straight blades, and there was a reduction in blade root load, leading to a decrease in the wind turbine cost. Pavese et al. [14] examined the role of the backward swept blade in wind turbines. The backward swept blades produced structural coupling and torsion toward the tower. As the angle of attack decreased, the coupling eased the load on the wind turbine structure. The blade geometry could be altered by adjusting the three parameters to reduce the load. Wind turbines with moderate backward swept blades were superior since they did not have to significantly increase the blade root’s torsional limit and fatigue life to reduce their load. Sessarego et al. [15] explored the application of neural networks in an aeroelastic simulator with synthetic inflow turbulence. The bending and sweeping algorithms from the neural network were added to the blade design. The research showed that neural networks could efficiently design the wind turbine blade when considering complex aeroelastic simulation scenarios and turbulent inflow conditions. In order to obtain the correct load distribution of wind turbines with in-plane backward swept and out-of-plane curved blades, Li et al. [16] simulated the effects of blade shape on aerodynamic characteristics. What can be known from the study was that the passive load reduction of wind turbine blades could be achieved via geometric bending and torsion coupling, such as sweeping the blades backward. Gözcü et al. [17] designed the backward swept blades, which relieve the load on the blades by torsional deformation and result in an apparent enhancement in the environmental adaptability of the blade. Moreover, the distribution of the torsion angle and chord length of the swept blades were analyzed, providing the basis for further design. In the previously published data, Ashwill et al. [18] designed and manufactured the STAR swept blade (Sandia National Laboratories, Albuquerque, New Mexico, USA) with a radius of 27 m. The wind turbine with the STAR blade had an output power of 10–12% greater than the wind turbine with straight blades, whose rotor radius was 48 m, and their blade root moments were similar according to static and fatigue tests. The above tests have proved the aerodynamic superiority of swept blades. Besides, this technology is also widely used in the design of other turbomachines. The flow field’s stability and working efficiency could be significantly improved by the sweeping blade [19]. It has application value in the design verification of transonic blades in the aviation field [20], low-speed axial flow fans [21], multi-stage compressors [22], and other occasions.
To sum up, current research on swept blades for wind turbines still possesses the mentioned problems, as it is mainly based on numerical simulation calculations, and the experimental component accounts for a minor proportion. Therefore, making substantive progress and breakthroughs in the research is challenging. In addition, the designs of swept blades, especially for small horizontal axis wind turbines, are still constrained, lacking the test data for 104 orders of magnitude in the Reynolds number. In the light of the existing time-domain results, with the decline of the Reynolds number, the output aerodynamic efficiency of the rotating wind turbine also decreases [23,24,25]. In view of the current design methods, the research on wind turbine rotors in low wind speed ranges is insufficient. Therefore, this paper investigated the performance advantages of swept blades compared with straight blades by combining numerical simulation with wind tunnel test methods. Consequently, wind farms located in regions of low wind speeds can benefit from using the design of swept blades aimed at small horizontal axis wind turbines. This study is mainly conducted on the aerodynamic and wake characteristics of wind turbines with swept blades and straight blades, especially investigating the changes in wind turbines with swept blades. Finally, the conclusion from this investigation is presented. These results may provide a reference for simulations and algorithm predictions and have a guiding significance for the promotion of swept blades in wind fields with low wind speed.

2. Design and Numerical Calculation of Swept Blades

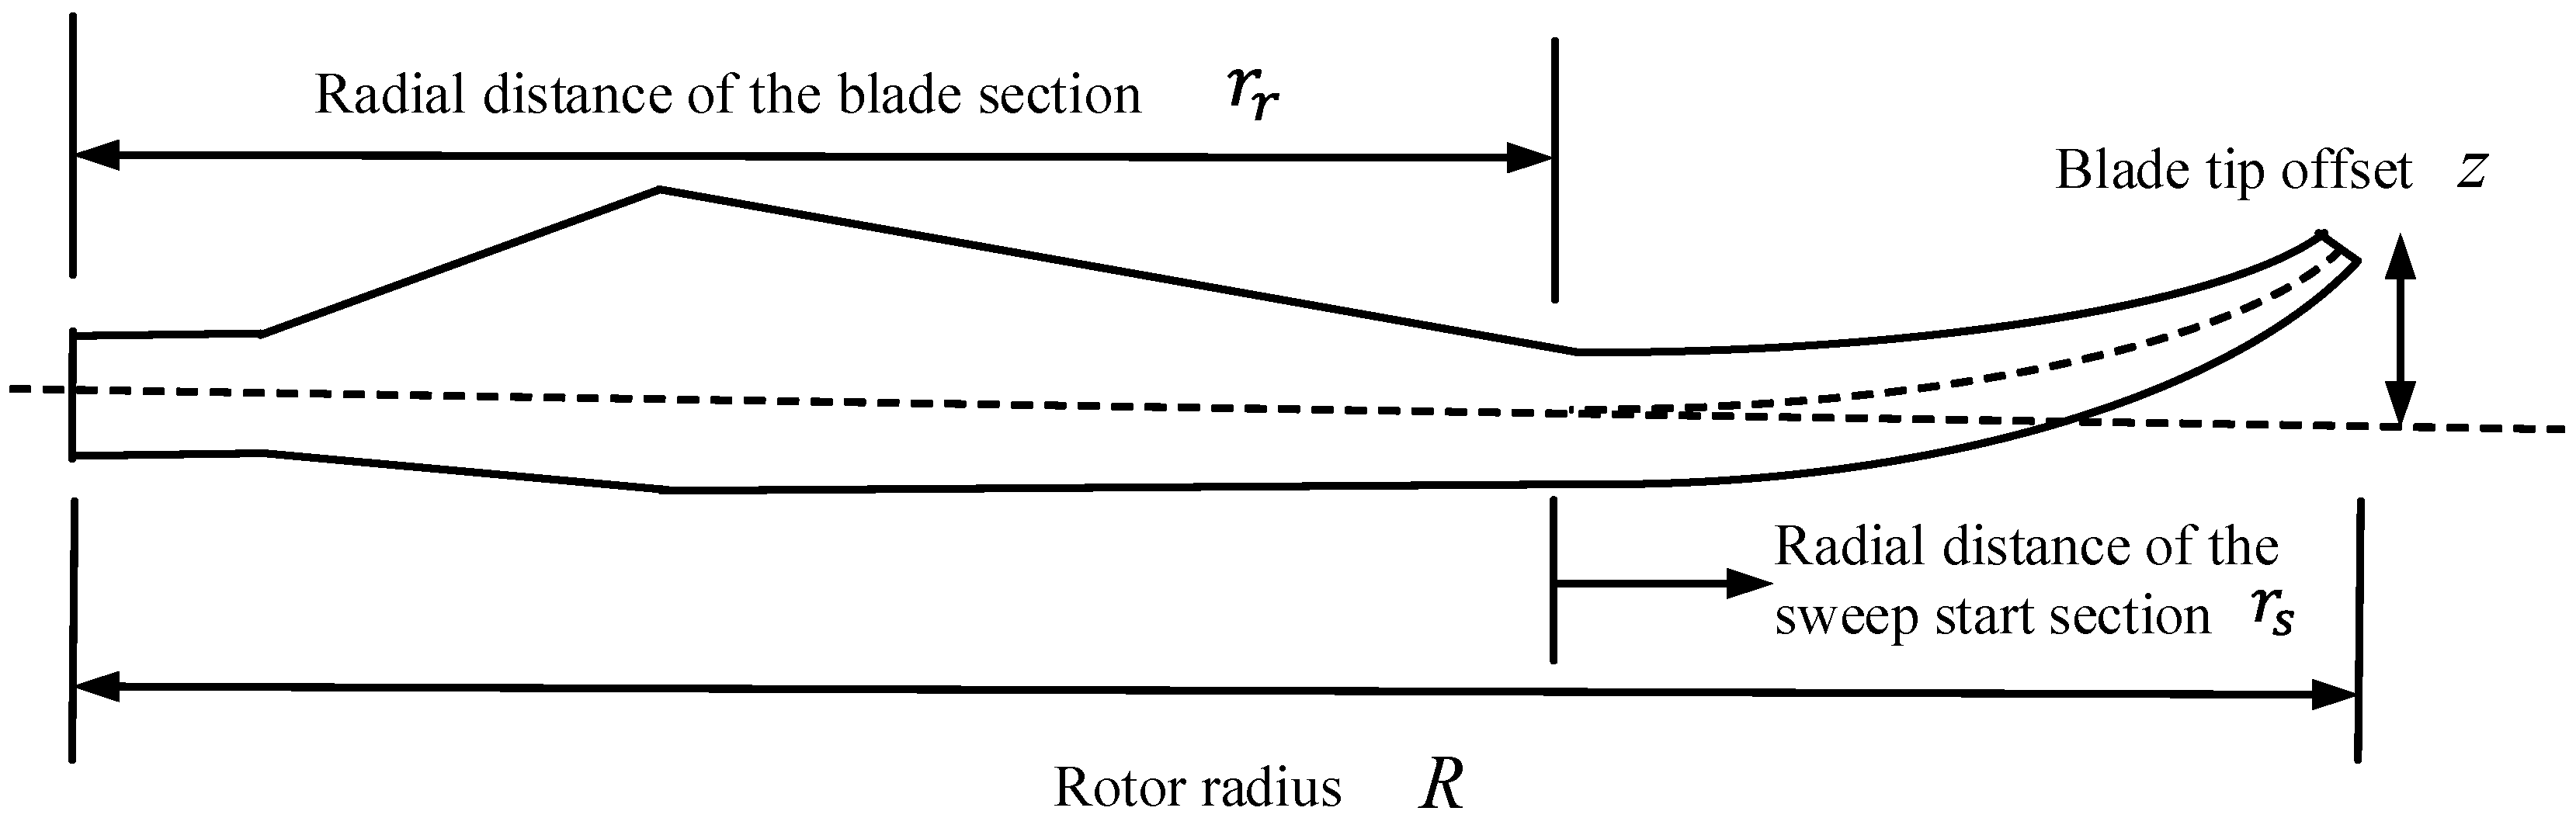
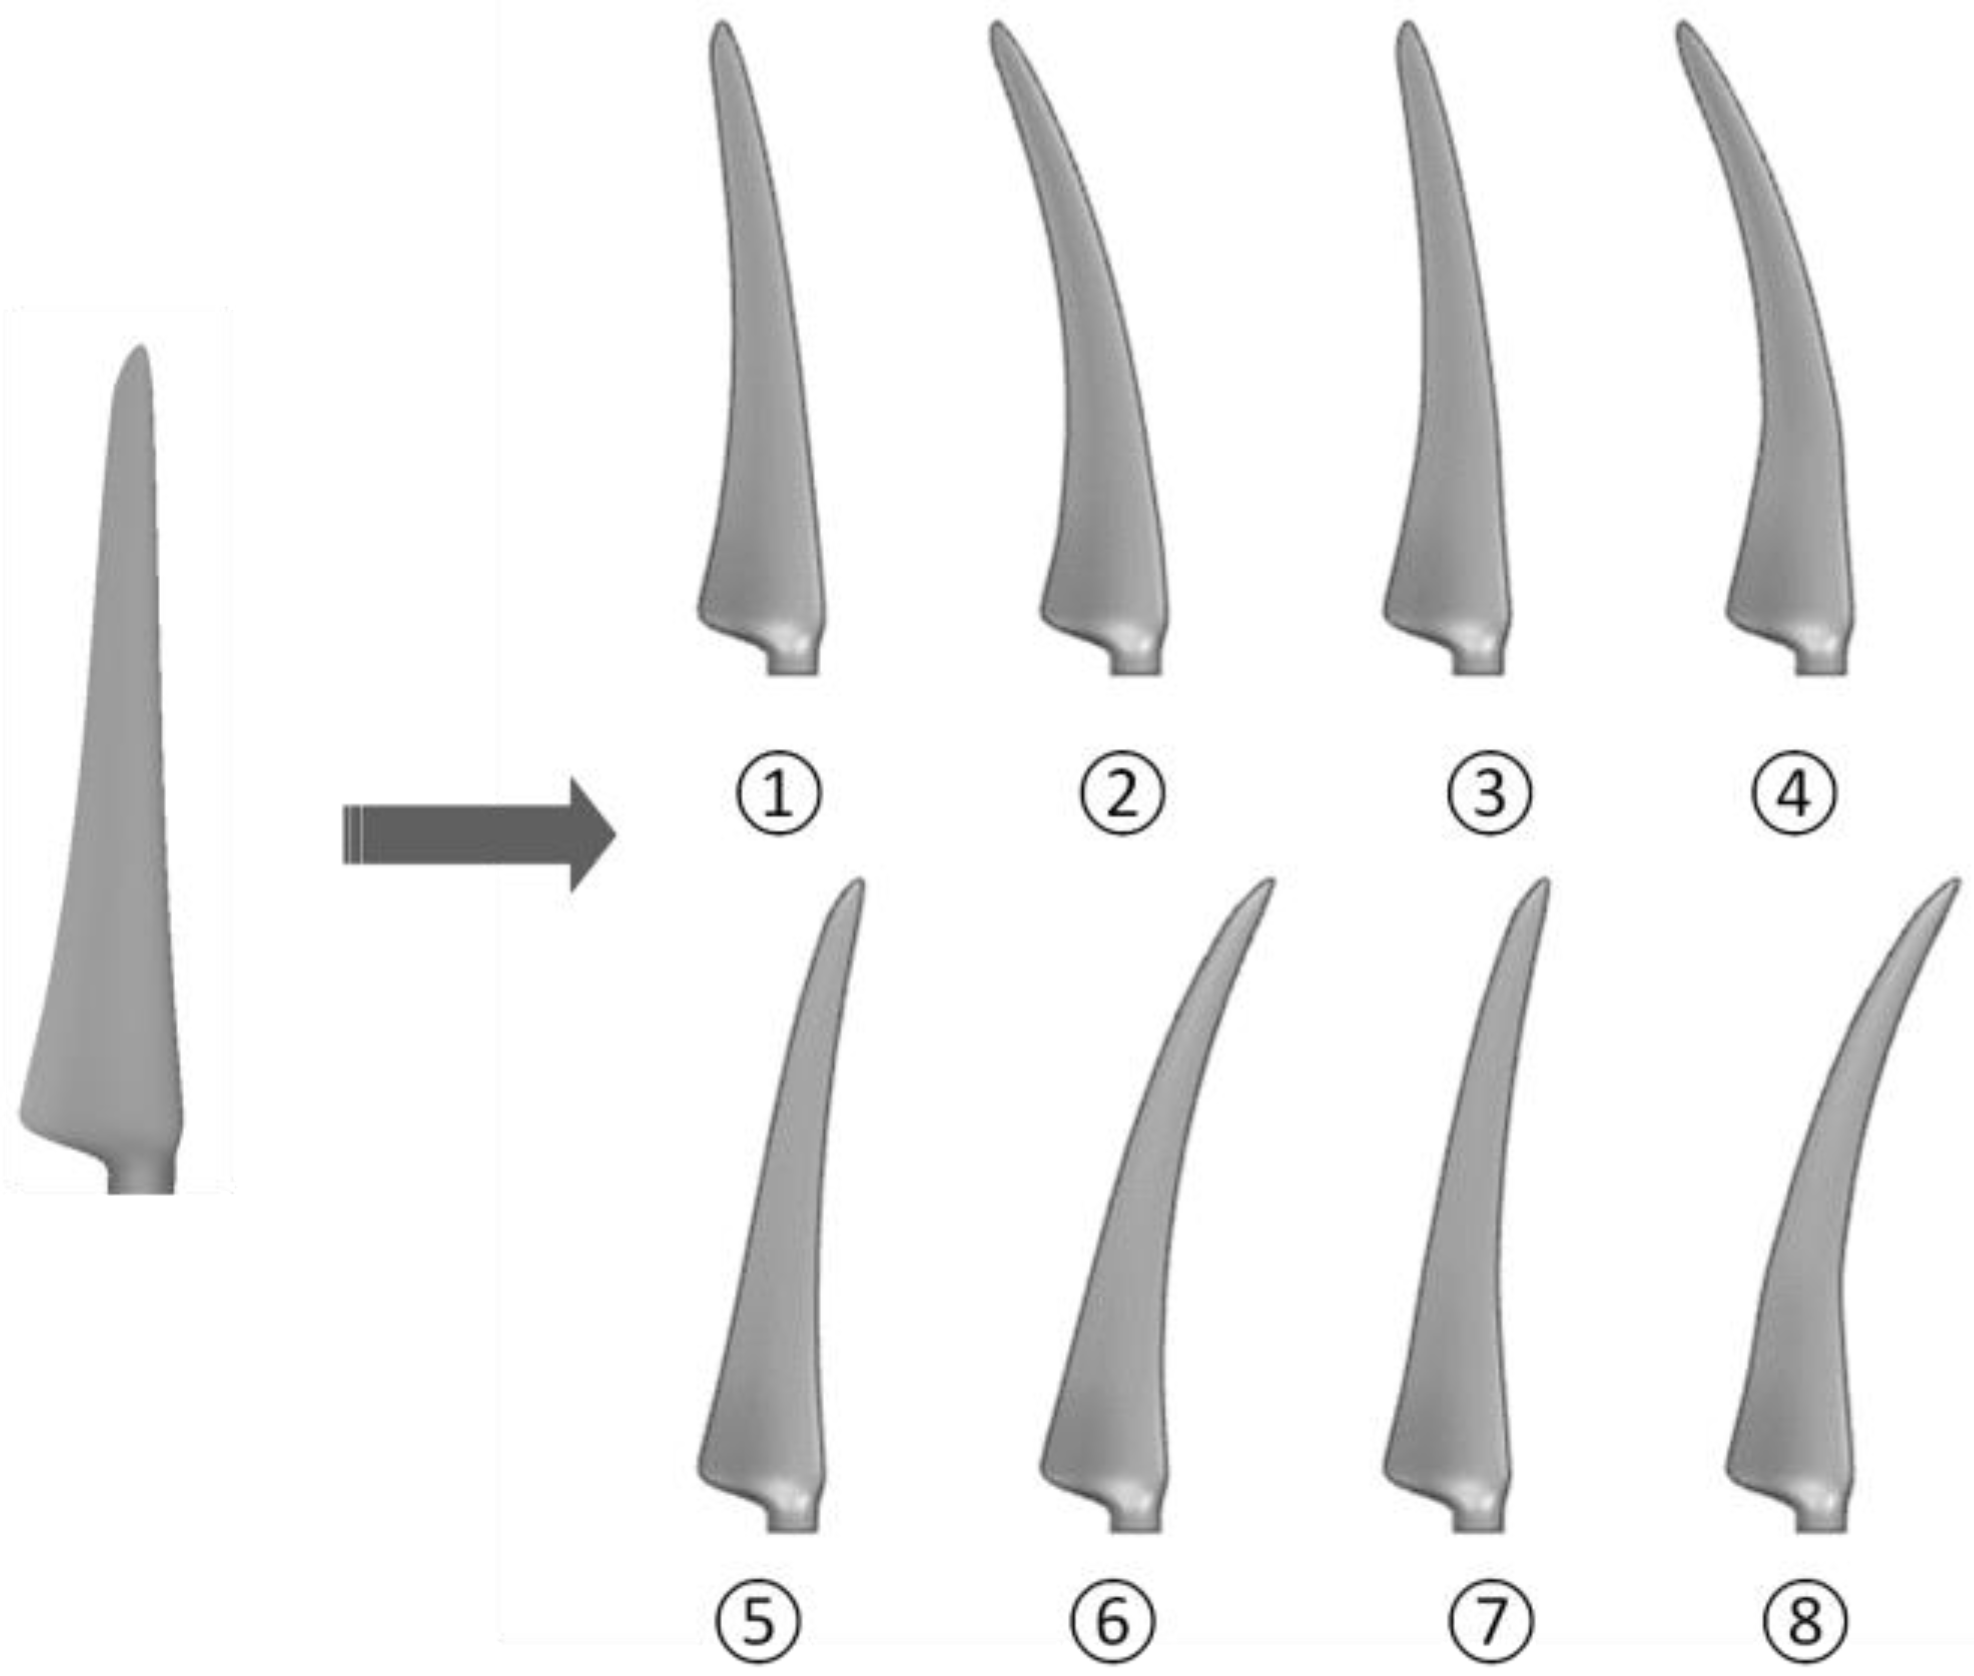
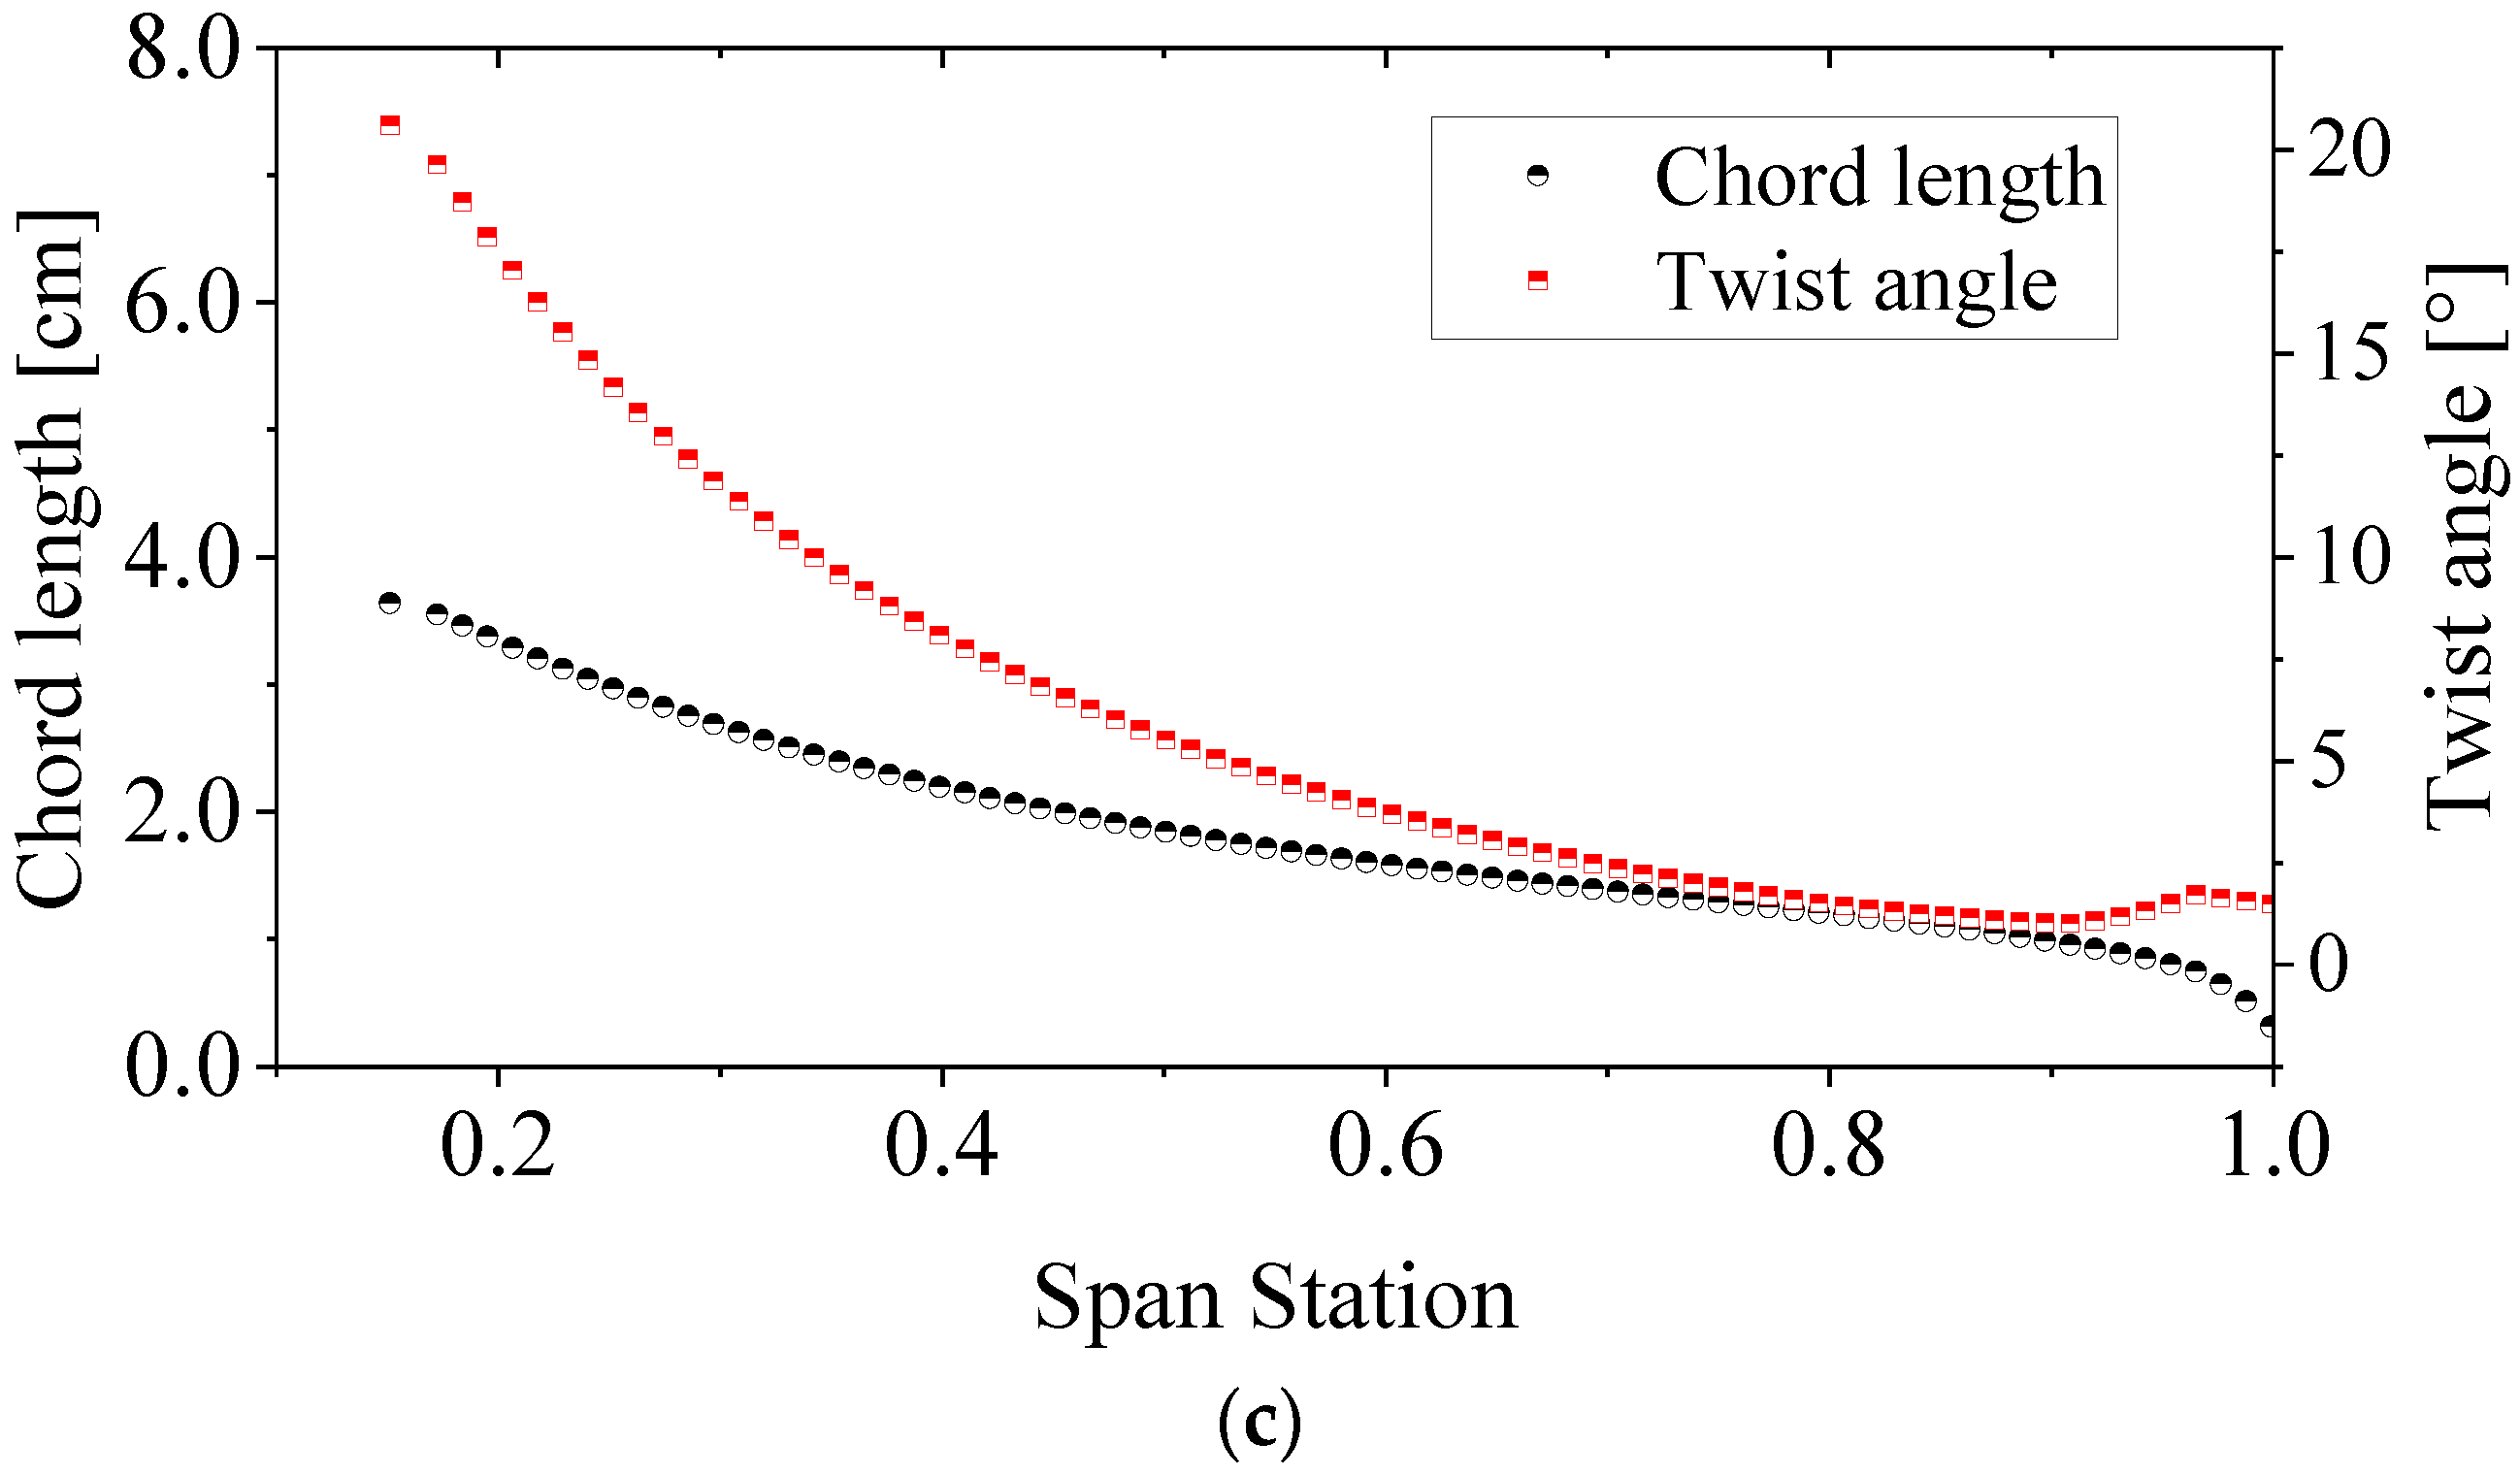
2.1. Preliminary Swept Blade Design

In this section, a three-dimensional parametric modeling and mesh generation for the designed swept blade was performed, and the numerical simulation was then conducted to determine the optimal design. For the design of the swept blades, although various formulas in the literature above should calculate the offset between each section of the blade and the blade pitch line, these are complex and cannot determine the tip offset [26,27]. Existing studies have shown that the tip offset significantly affects aerodynamic performance. Therefore, to make the design more convenient, we used an equation developed by Kaya et al. [9], which could select the blade tip offset, the location of the sweep start, and the intensity of the sweep. The offset of the blade tip section and sweep start position were determined, which are shown in Figure 1 and Equation (1).
z = r r r s R × P s R r s M 1 P r 1 P r s P r
where z is the offset of the blade section from the aerodynamic centerline of the straight blade, rr is the radial distance of the blade section, rs is the radial distance of the sweep start section, R is the rotor radius, Ps is the ratio of the tip offset z to the rotor radius (Ps = z/R), M is the sweep mode, Pr is the ratio of the radial distance of the blade section to the blade radius (Pr = rr/R), and Prs is the ratio of the radial distance of the location of sweep start to the blade radius (Prs = rs/R). The strength of the sweep M defines the strength of the sweep. Increasing the value of M would reduce the sweeping strength, while decreasing the value to close to one would increase the strength of the sweep. According to the definition from Ref. [9], when M was taken as 2, it can represent the average sweep strength. Therefore, the value was also chosen as M = 2 in this study.
For testing the aerodynamic characteristics of swept blades, two blade tip offsets and locations of the sweep start were designed, and two sweep directions, forward and backward, were used for classification, respectively. The design parameters are given in Table 1. Figure 2 provides the original straight blade [28] and the designs of eight wind turbine blades: four forward swept, and four backward swept. The blade numbers in this figure were correspond to that in Table 1. The tip offset and the location of the sweep start were considered as two variables when designing the sweep.

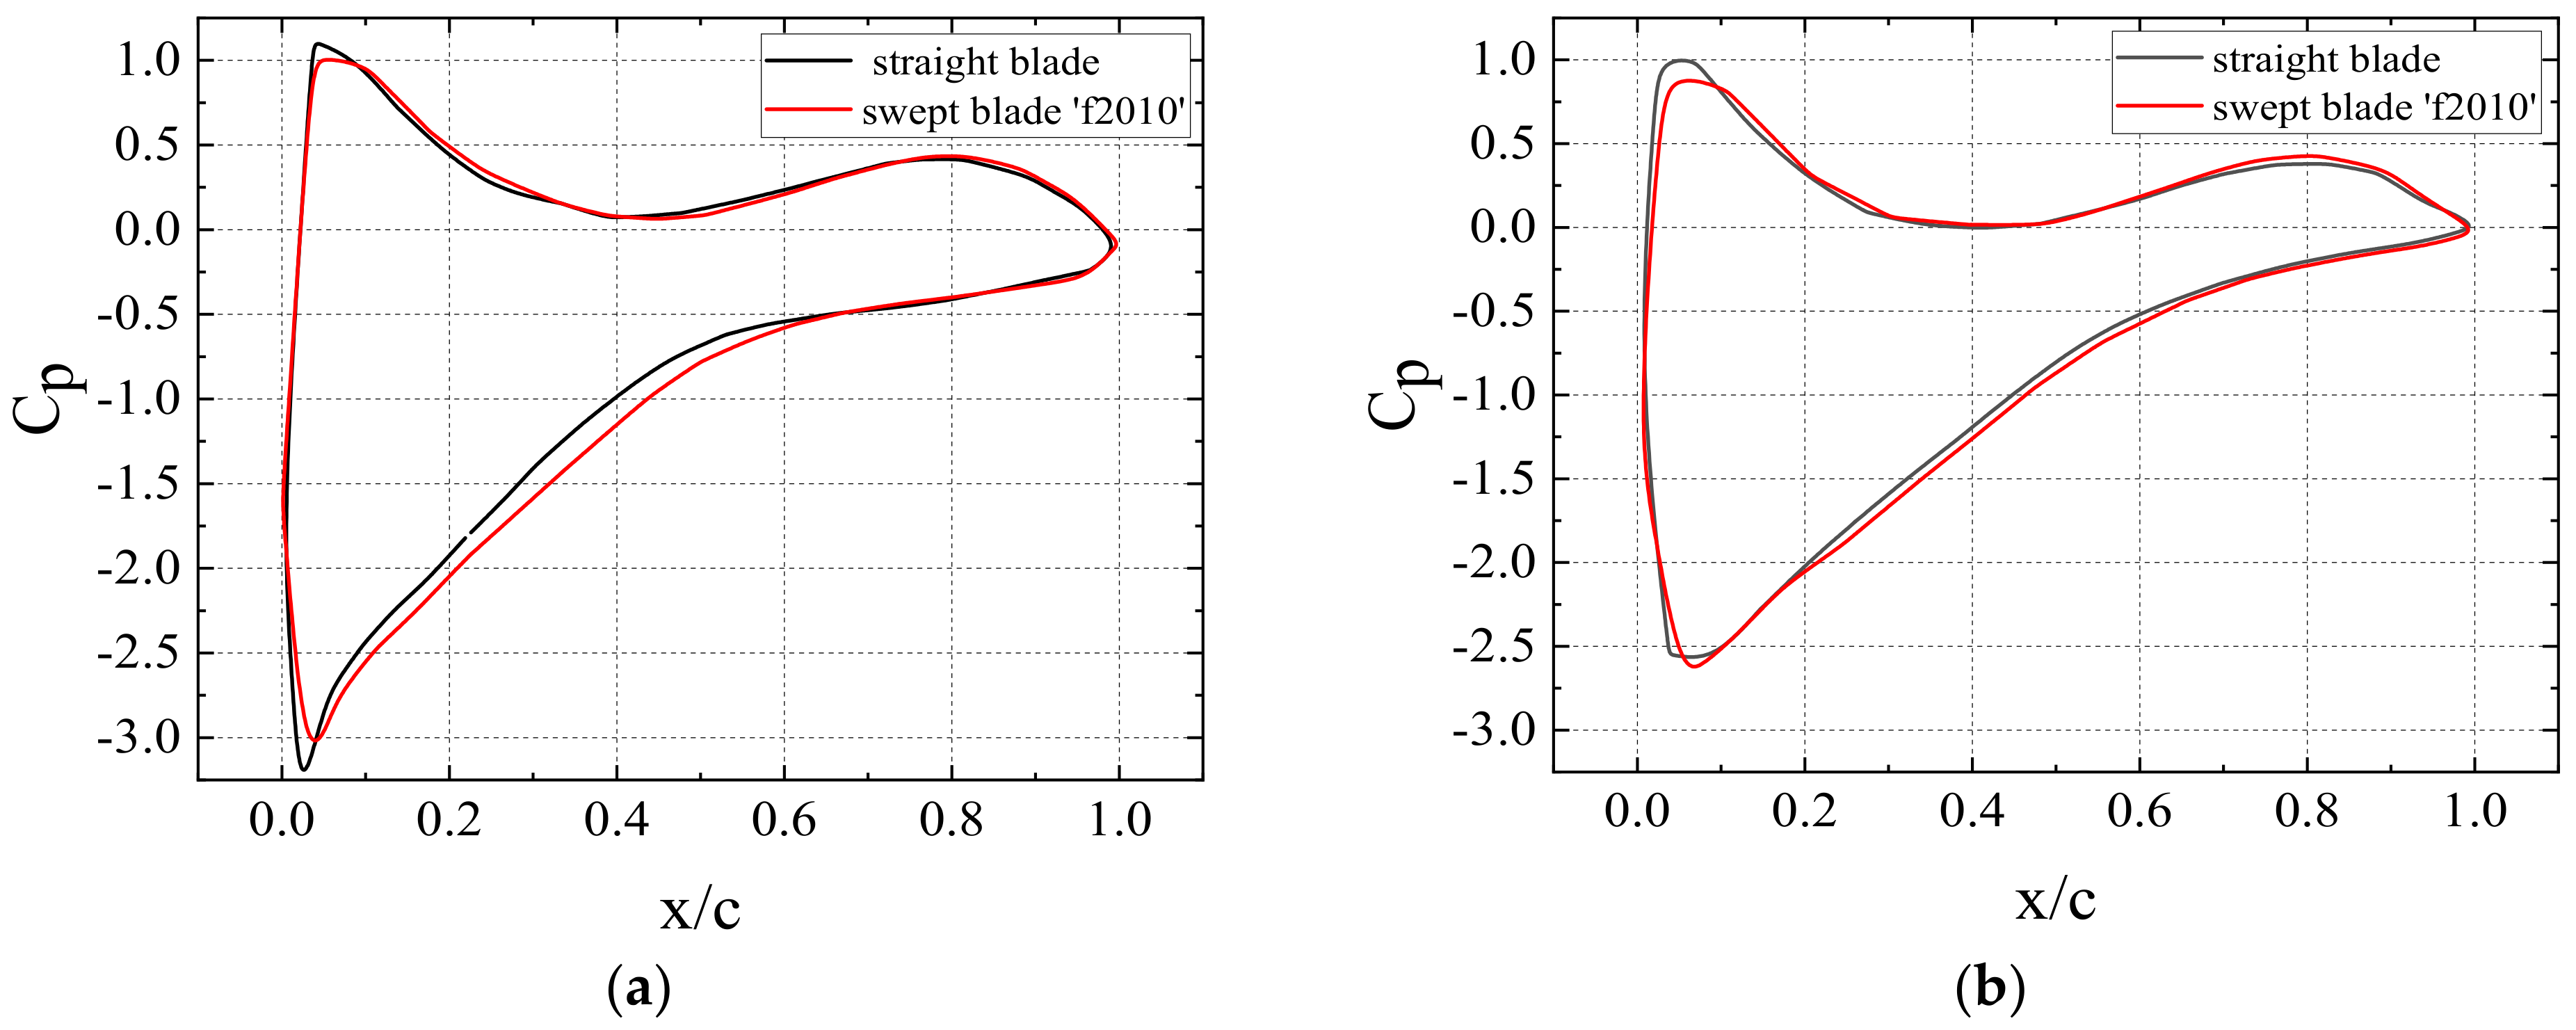
2.2. Numerical Calculation

In this paper, ANSYS Fluent software was used to simulate the three-dimensional airflow around the wind turbine adopting the moving reference frame (MRF) method. In order to facilitate comparative analysis, the numerical simulation and subsequent model tests should meet the similarity conditions. Hence, the size of the wind turbine was set to be consistent with the model test, and the simulated working conditions were similar to the test to meet the geometric and dynamic similarity conditions. The rotor diameters of the simulated and tested wind turbines in this paper were both 400 mm. The height of the tower was set to 400 mm, its shape was cylindrical, and the cross-section diameter was 16 mm. Besides, the calculated rotation domain diameter and the thickness were set to 500 mm and 50 mm, respectively. The distance from the center of the wind turbine to the inlet of the computational stationary domain was 1000 mm and to the outlet was 3000 mm. The cross-section of the stationary domain was a square with a side length of 1600 mm. The specific layout is presented in Figure 3.
The unstructured grid was used to divide the rotation domain and stationary domain and encrypt the rotor blade. The number of boundary layers was set to 20. After calculation, the height of the first layer of the grid was set to 0.0008, and the three-dimensional grid quality was more than 0.4. The specific grid details of the rotation domain are illustrated in Figure 4.
According to the conclusion from Ref. [9], the k-ω SST turbulence model could accurately predict the power characteristic of a rotating wind turbine when the tip speed ratio ranges from 2 to 6. Hence, numerical simulation was accomplished by adopting the k-ω SST turbulence model. The model took account of the influence of shear stress on the actual situation based on the standard k-ω turbulence model so that the calculation result could be more accurate.
Among the transport equations of the k-ω SST turbulence model, the turbulent kinetic energy transport equation is presented below
t ( ρ k ) + x i ρ k u ¯ i = x j μ + μ t σ k k x j + G k Y k
followed by the kinetic energy dissipation equation
t ( ρ ω ) + x i ρ k u ¯ j = x j μ + μ t σ ω ω x j + G ω + D ω Y ω
where ρ is the density of air, k is the turbulent kinetic energy, μ is the viscosity, ω is the specific dissipation rate, μt is the eddy viscosity coefficient, u ¯ j is the average value of fluctuating velocity in the j direction, σk and σω are the Turbulent Prandtl number of two equations, Yk and Yω are the dissipative term of two equations, Gk and Gω are used to represent the turbulence generation term, and Dω is the cross-diffusion term. For more variable meanings of Equations (2) and (3), one can refer to Refs. [29,30].
In order to test the independence of the numerical solution, three different computational grids were used to verify the grid independence of the wind turbine with straight blades. The specifications of the studied grids are shown in Table 2, which were named Fine, Middle, and Coarse, respectively. It can be seen that the difference in the power coefficient CP between Middle and Fine was negligible. The power coefficient of the turbine can be determined using Equation (4),
C p = M x ω 1 0.5 ρ u 0 2 π R 2
where Mx, ω1, u0 are the axial torque, the angular velocity of rotation, and the mean inflow velocity at hub height, respectively. Hence, it was finally determined that the number of grids in the rotation domain was 7.82 million, and the number of grids in the stationary domain was 6.14 million, so the total number of grids was 13.96 million.
The optimal tip speed ratio occurs at the position with a larger tip speed. Hence, the wind turbine with swept blades that meet the following conditions was taken as the research object, where the tip speed ratio was λ = 5, the rotor speed in the calculated rotation domain was set to 1670 rpm, and the wind speed of the incoming flow in the inlet was 7 m/s, which was consistent with the test conditions. Therefore, the possible optimization result could be identified by comparing the output power and thrust coefficients of wind turbines with swept blades and straight blades. Here, the thrust coefficient is calculated by Equation (5),
C T = T 0.5 ρ u 0 2 π R 2
where T is the force in the streamwise direction.
To better compare the results, it is necessary to propose a method of calibrating swept blades. In this method, there are two parameters, f and b, representing the sweep direction of the blade. Here f represents forward sweep (i.e., the sweep direction is the same as the rotation direction of the rotor). In contrast, b represents backward sweep, which means that the sweep direction is opposite. After the first indication letter, the first two digits function as the definition of the ratio of the spanwise length where the sweep starts to the radius of the rotor (rs/R). The last two digits define the ratio of tip offset to the rotor radius (z/R). For example, ‘f2010’ refers to the forward swept blade whose radial distance of the location of the sweep start is 20% of the rotor radius (rs/R = 0.20), and the blade tip has an offset of 10% (z/R = 0.10).
It can be seen from Table 3 that the power coefficients and thrust coefficients of wind turbines in the forward swept design and the backward swept design showed a similar pattern in terms of their varying trends. Increasing the tip offset would reduce the power coefficient of the wind turbine, as well as the thrust coefficient. As the radial distance of the location of the sweep start became larger, the power coefficient of the wind turbine decreased, and the thrust coefficient also decreased. This law was similar to how the tip offset affected the aerodynamic characteristics of wind turbines. When the blades had the same swept shape, in contrast with the backward direction, wind turbines with forward swept blades featured more perceptible improvements in output power. However, the thrust coefficients were also higher, which needs to be paid more attention to in practical applications. It can also be noticed that among the wind turbines with several sweep modes, the power characteristics of ‘f2010’ had been significantly ameliorated compared to the straight blades. The wind turbine with straight blades was taken as a baseline. The wind turbine with the forward swept blades ‘f2010’ had the highest power and thrust coefficients rise, which increased by 2.167% and 2.478%, respectively. Meanwhile, the wind turbine designed with the backward swept blades ‘b2010’ only had the power coefficients increase by a value of 0.497%, and the thrust coefficients increase by a value of 0.384%. According to the simulation of blades with several designed sweep modes, the power characteristics of the wind turbine with the swept blades ‘f2010’ achieved the best when λ = 5, while the turbine with the swept blades ‘b4020’ achieved the smallest thrust coefficients.
With the aim to study the power enhancement mechanism of the wind turbine with swept blades, the pressure coefficients of the straight blade and the swept blade ‘f2010’ at the sections 35%, 65%, 80%, and 95% of the rotor radius were compared, respectively, as displayed in Figure 5.
The figure reveals that the surface pressure coefficients tended to approach when the blades were located near the root. Meanwhile, at the blade tip section, at 80% and 95% of the rotor radius, the peak values of the surface pressure coefficients of the swept blade were smaller than those of the straight blade, which indicated that the blade swept design can effectively reduce the peak value of the surface pressure at the blade tip. In addition, at the tip of the swept blade, the surface pressure difference was a bit larger than that of the straight blade, which indicates a slight increase in the integrated area. Therefore, the lift of the swept blade at the blade tip increased, and wind turbines with swept blades could generate more power.
The above revealed that the wind turbine with the swept blades ‘f2010’ had a higher output power, and the aerodynamic performance was optimal when λ = 5. To further investigate the aerodynamic characteristics of the wind turbine with swept blades ‘f2010’, it was necessary to simulate both the straight and swept blades at different tip speed ratios. The calculation consequences are shown in Figure 6. In the case of a wind turbine with straight blades and the swept blades ‘f2010’, the power and thrust coefficients were close when the tip speed ratios were low, and both increased with the increase of the λ. However, at high tip speed ratios, the situation with straight blades and the swept blades ‘f2010’ were apparently different. The power and thrust coefficients of the wind turbine with the swept blades ‘f2010’ were considerably higher than those with straight blades. When λ = 5, the wind turbine with the swept blades ‘f2010’ had the most significant growth in power coefficients. In contrast, the increase in thrust coefficients kept increasing with the increase of λ. More detailed analysis and discussions will be introduced in the following experimental section.

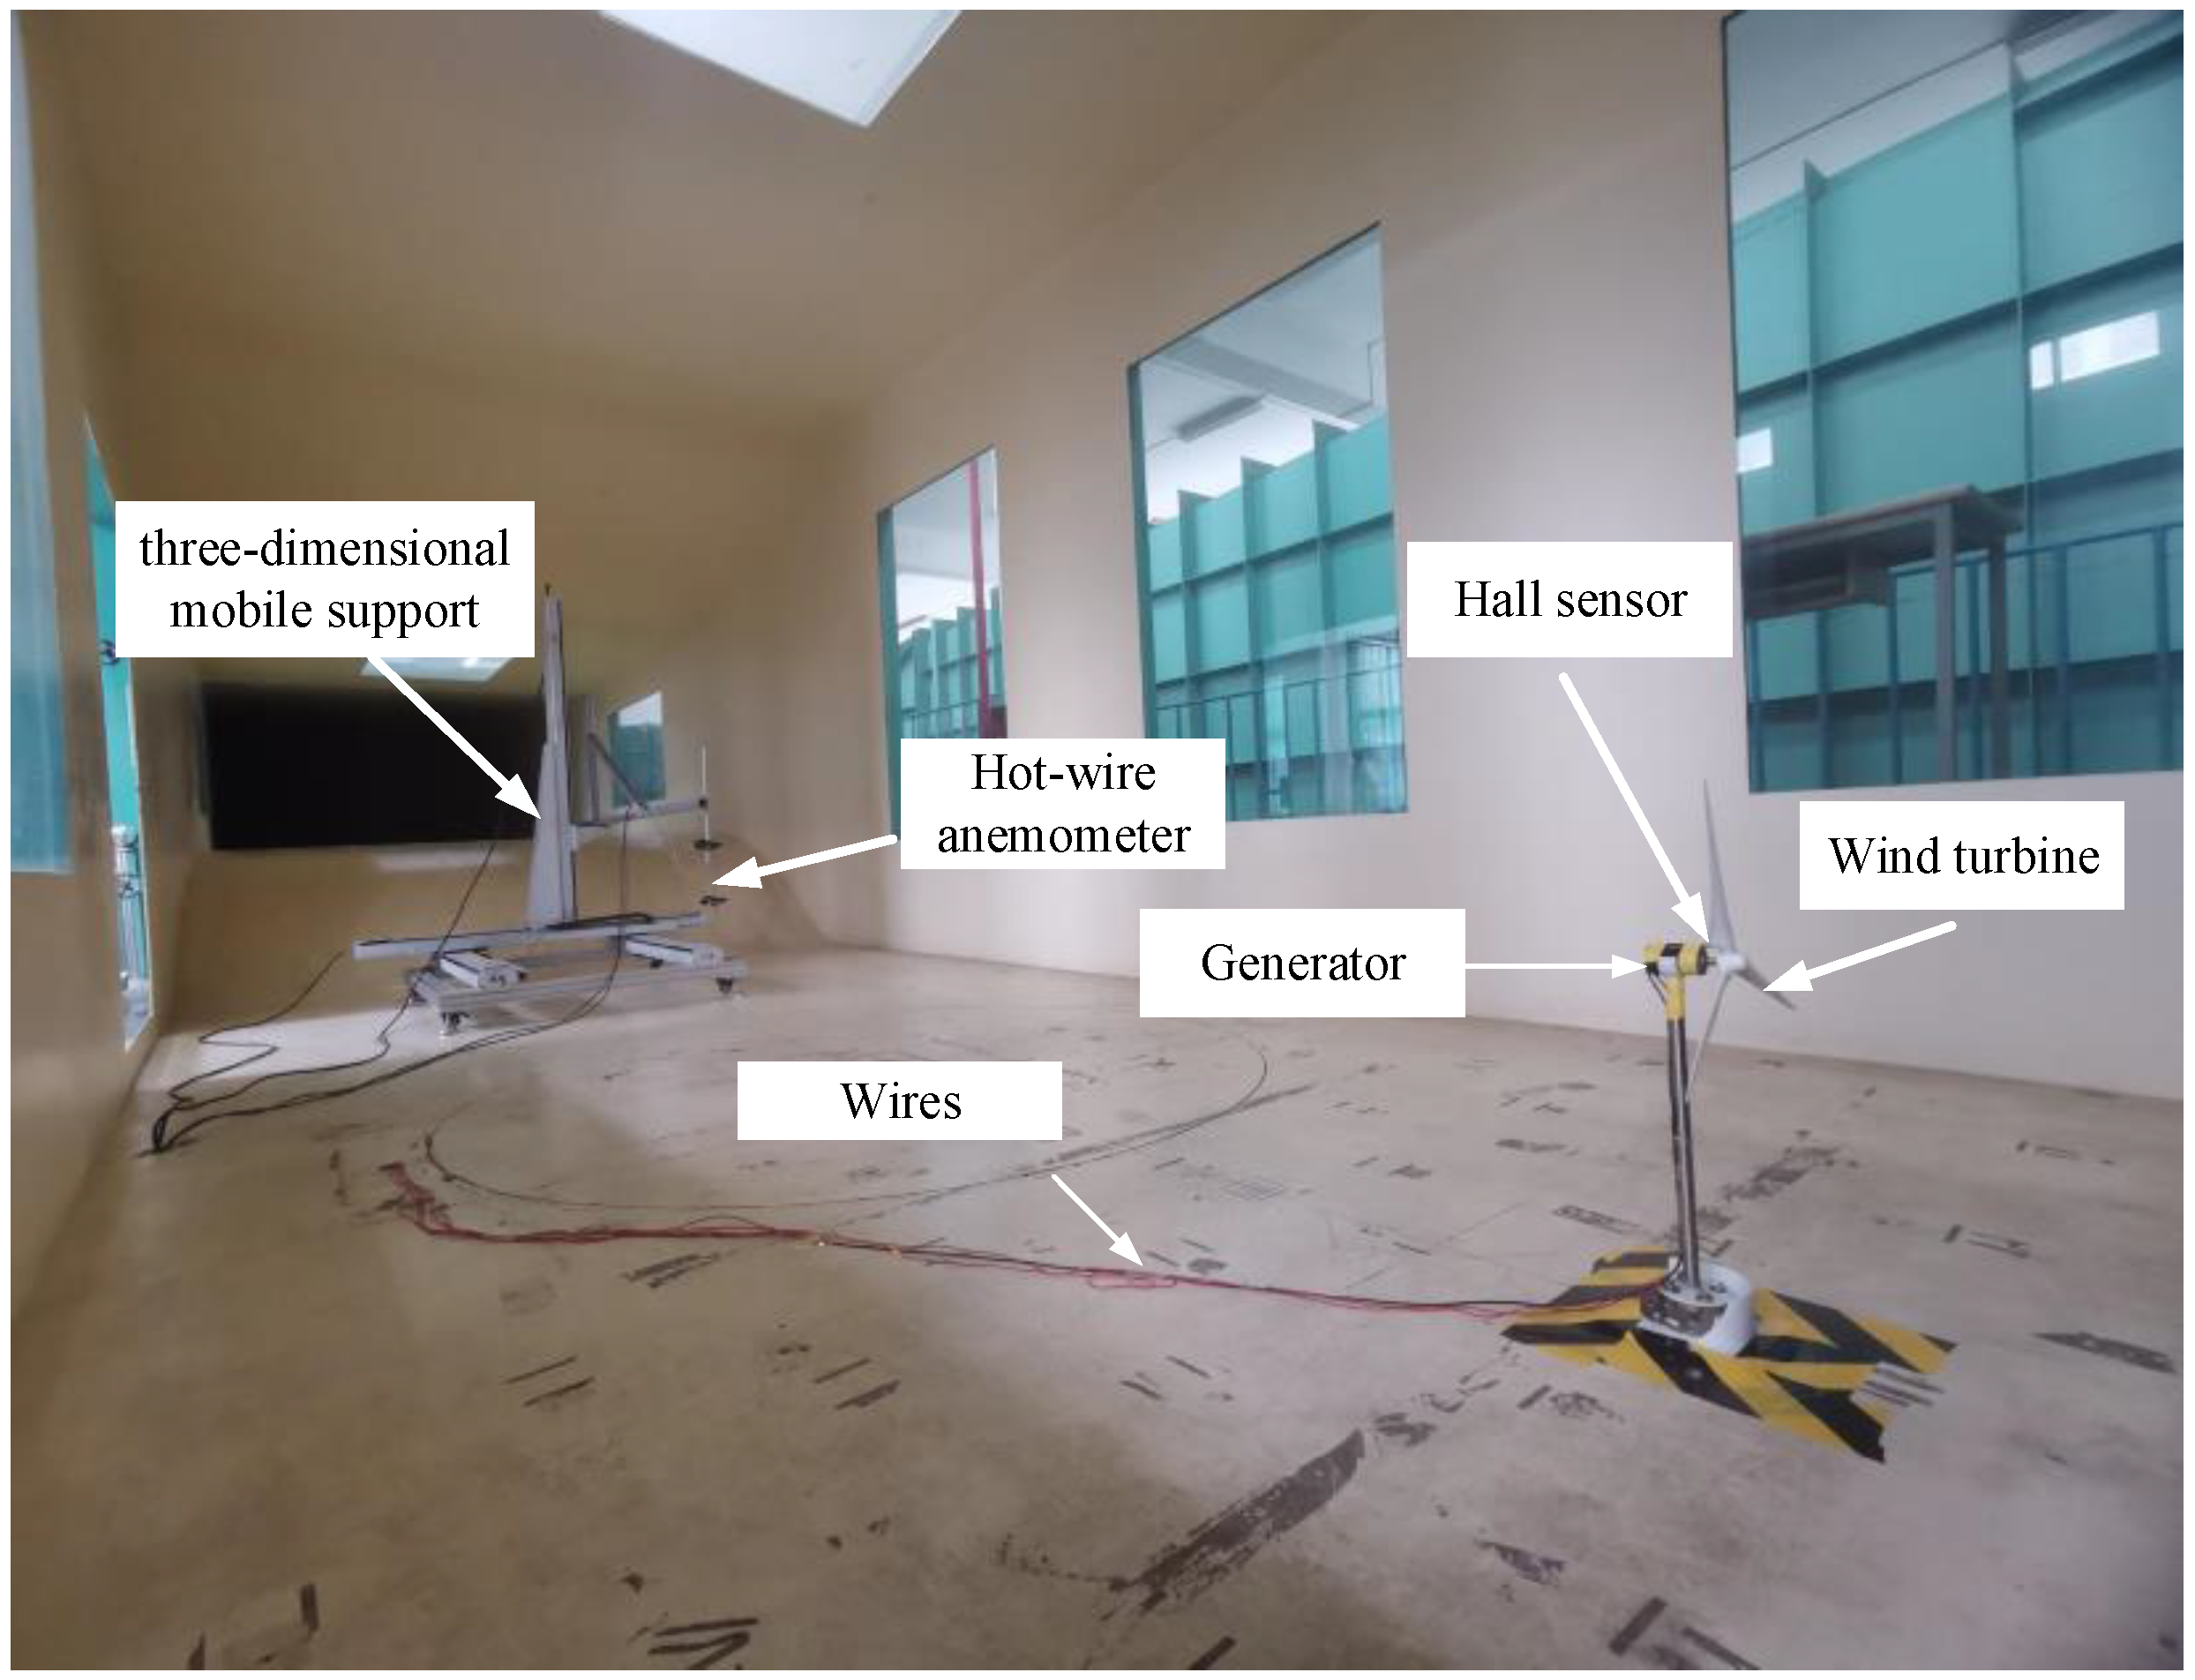
3. Experimental Setup

As mentioned above, swept blades can make a difference to the wind turbines’ output power and wake characteristics. Therefore, the test model and main research procedure are introduced in this section.

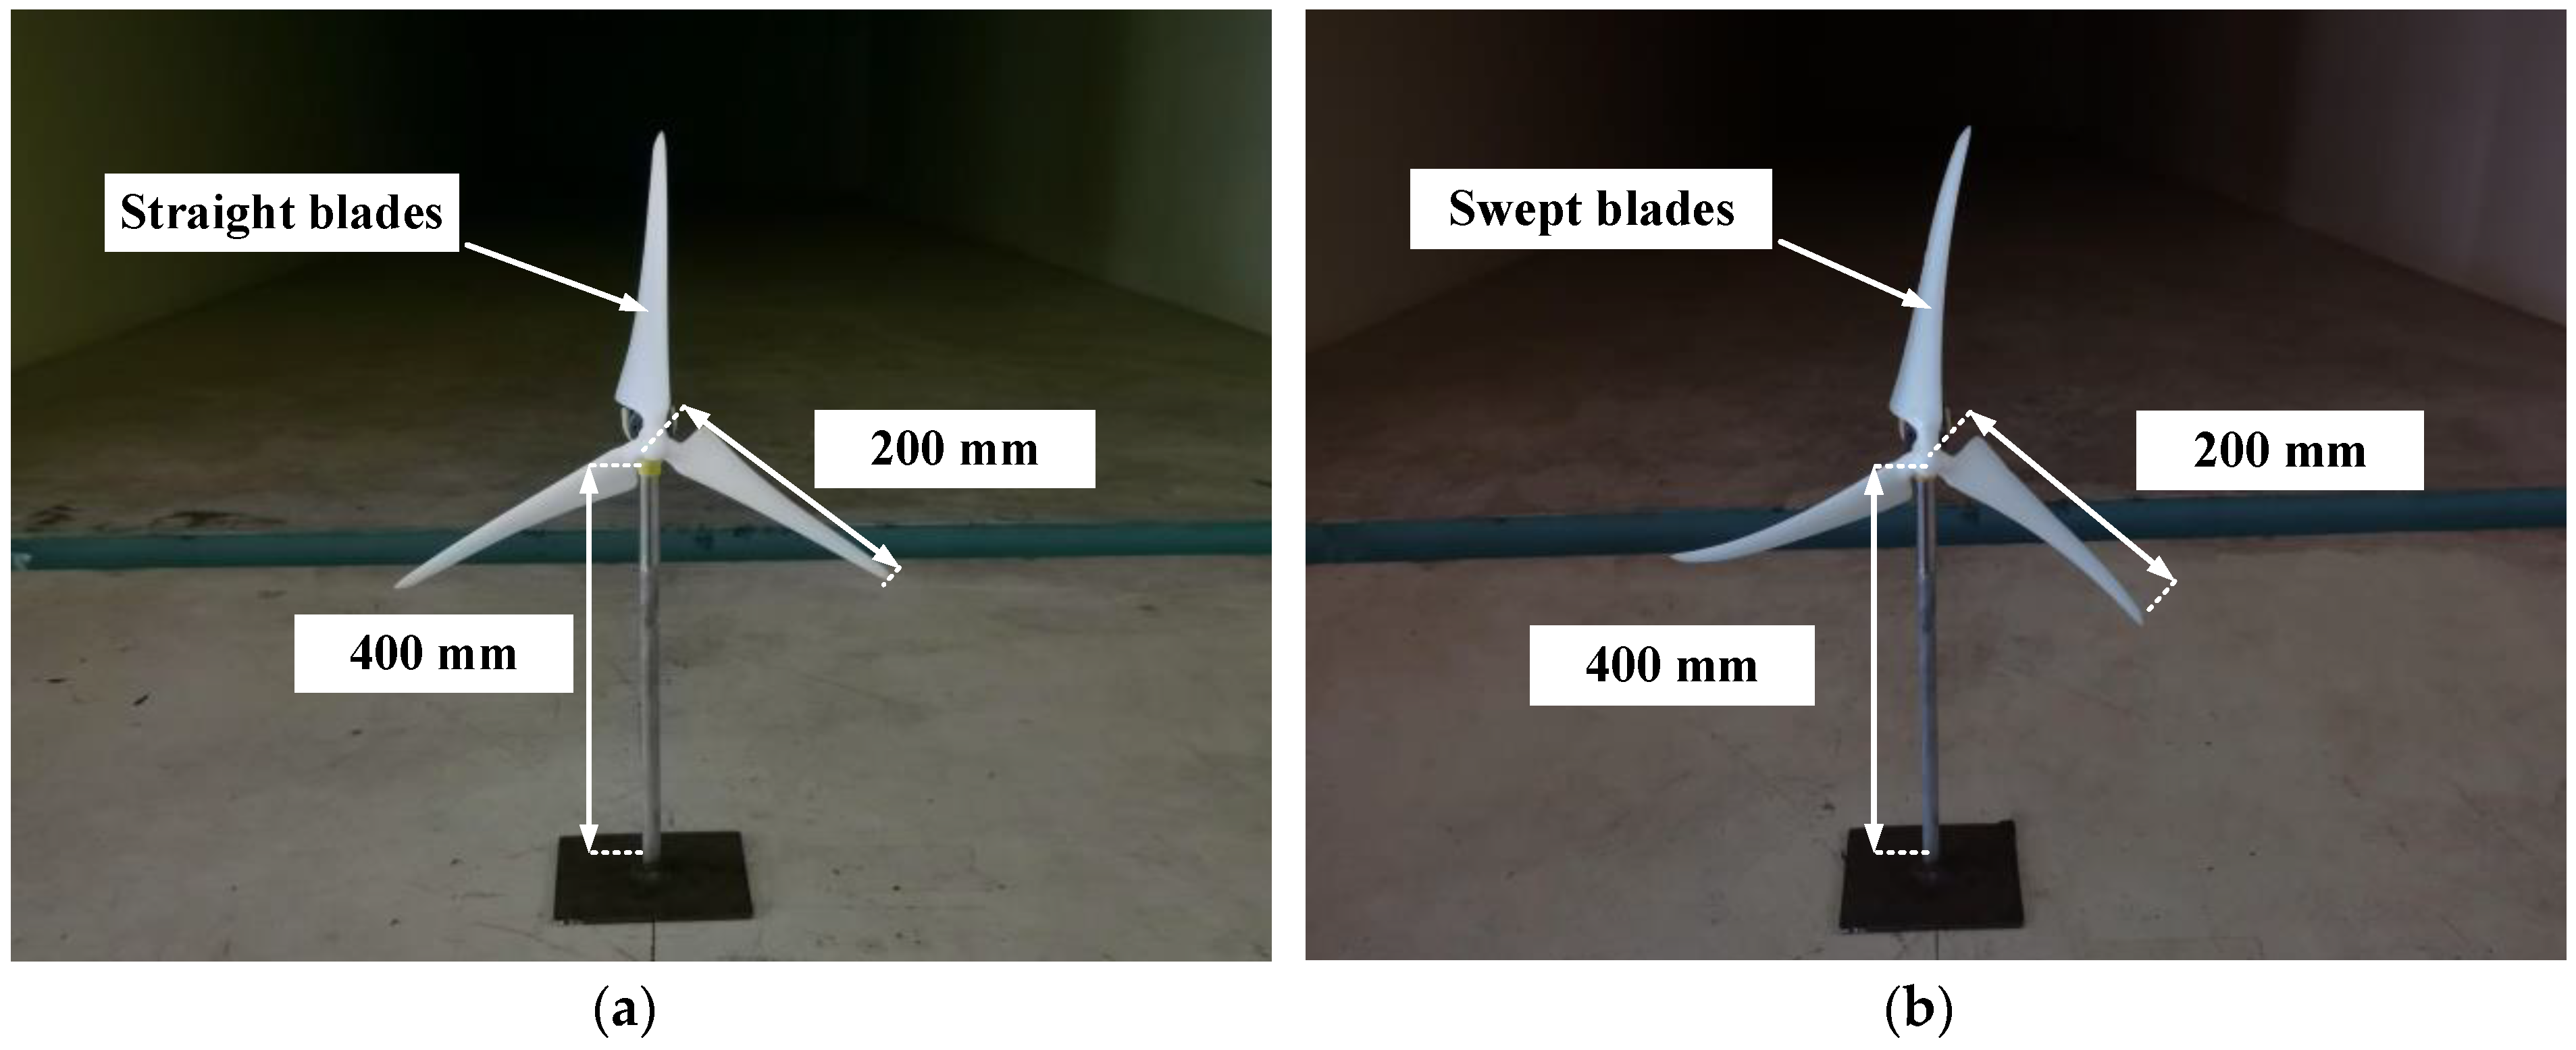
3.1. Test Setup and Test Model

The test was carried out in the low-speed wind tunnel at Yangzhou University. The wind tunnel had two test sections: high-speed and low-speed. The size of the former was 3.0 m in length, 1.5 m in width, 3.0 m in height, and the maximum wind speed was designed to be 50 m/s. The size of the latter was 3.0 m in length, 3.0 m in width, and 7.0 m in height, and the maximum wind speed was designed to be 25 m/s. The turbulence intensity of the flow field was less than 0.5%. The model wind turbine with the DTU-LN221 airfoil had a rotor diameter of 400 mm, and the center of the rotor was located 400 mm above the wind tunnel floor, as shown in Figure 7. The whole wind turbine rotors were printed by 3D printing technology, and a 12 V permanent magnet speed regulating direct current (DC) motor was adopted to achieve a rated speed of 3500 rpm. Due to the small scale of the turbine used in this test, the blockage ratio was 1.40%. Hence, the blockage effects were neglected in this test.

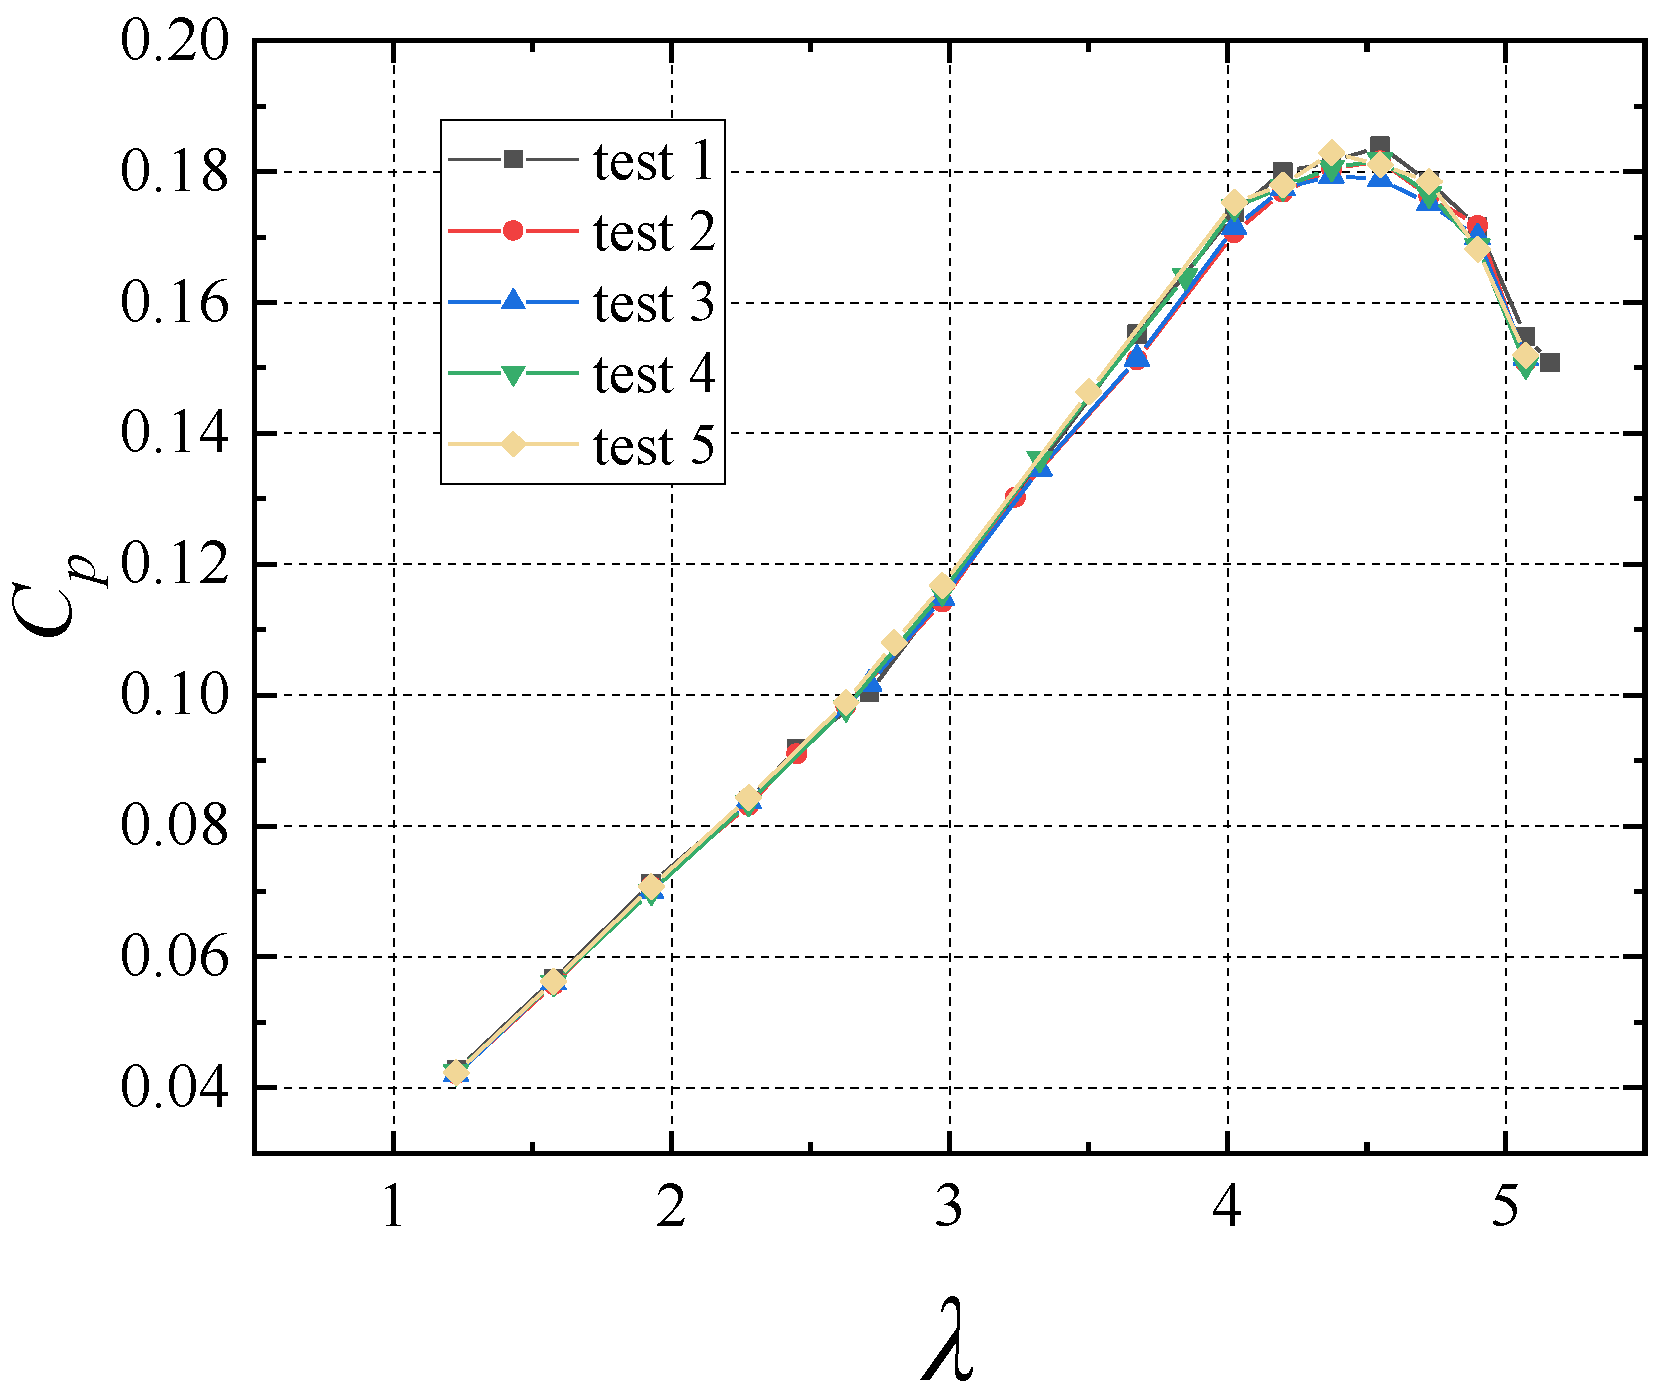
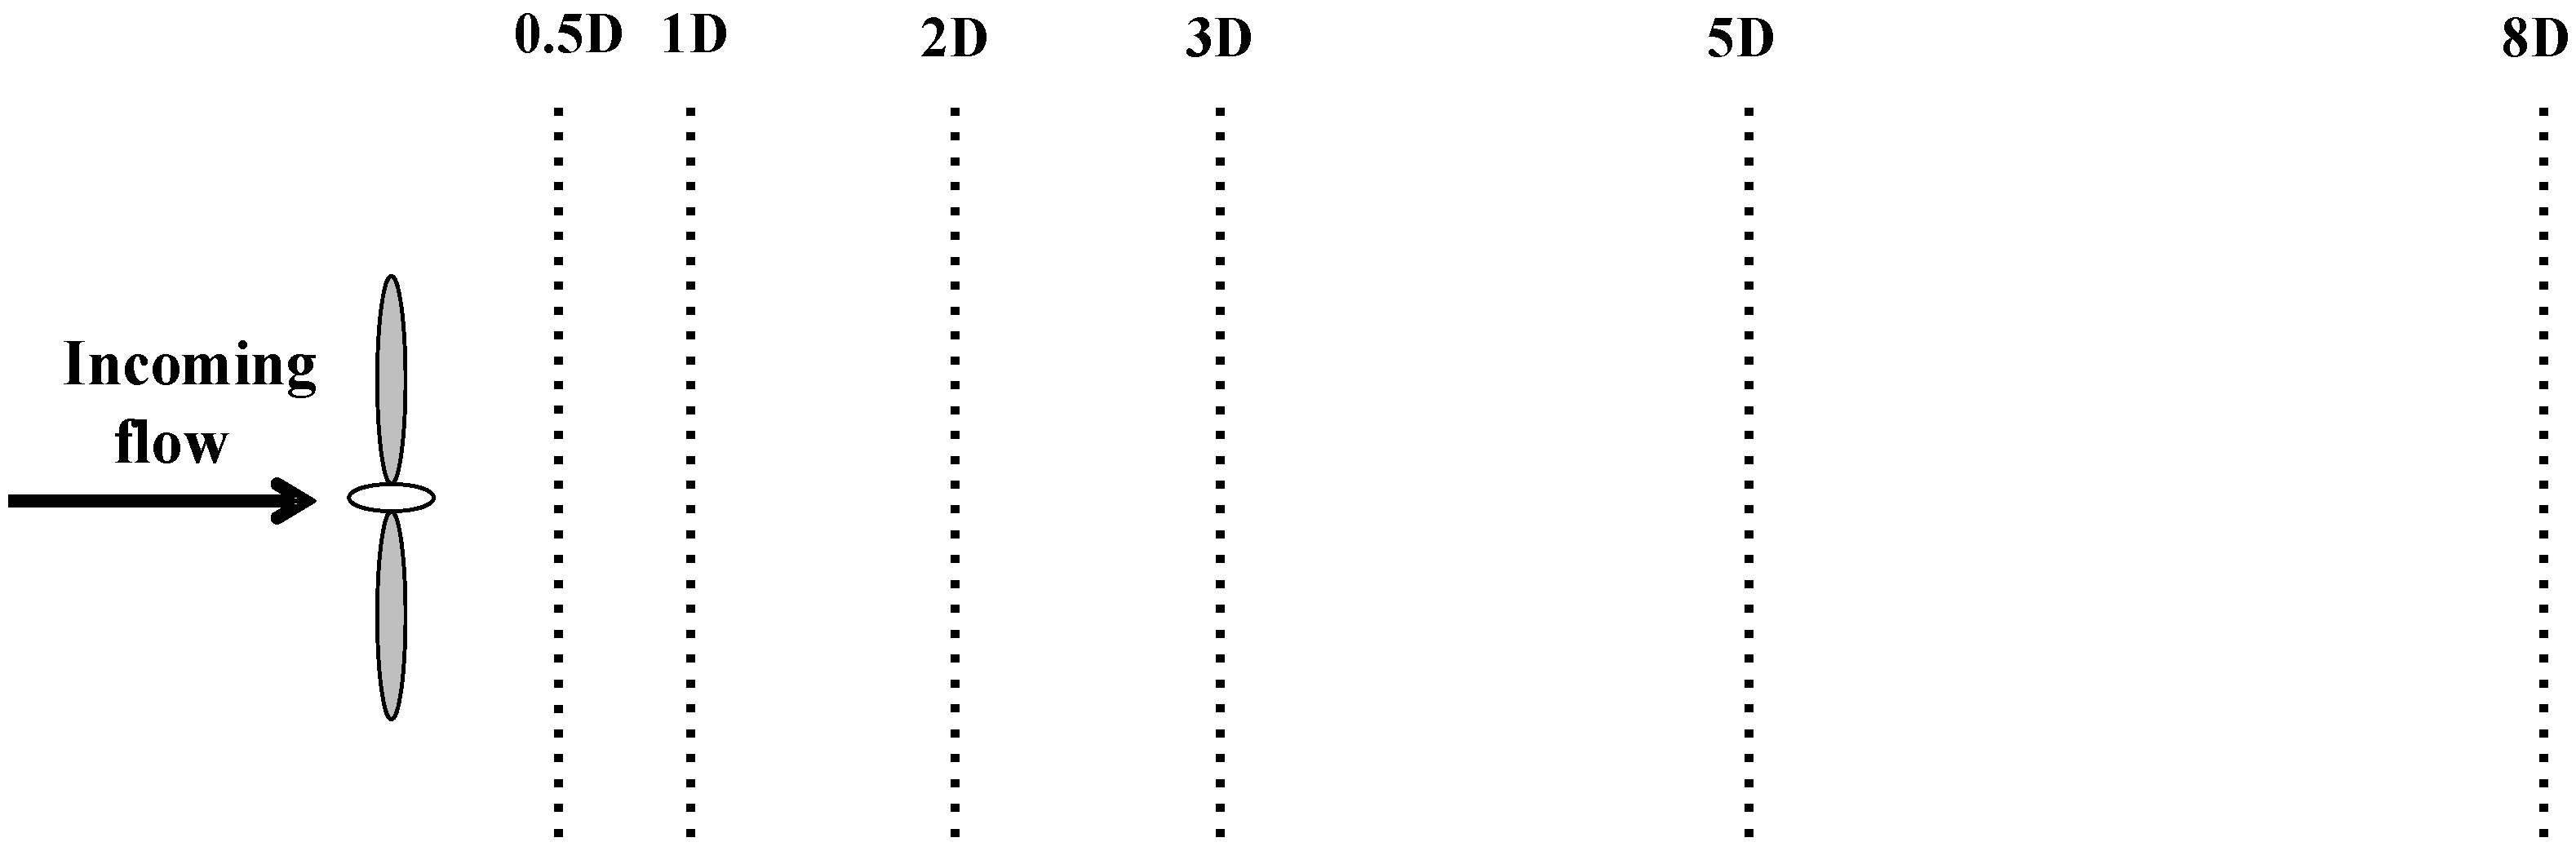
3.2. Experimental Procedure

Generally speaking, the power characteristic of the wind turbine was measured by a torque meter. The two ends of the torque meter were shaft connected with the hub and the motor with a controller, respectively. The rotation speed could be kept constant by adjusting the load, so the measured torque and rotation speed could obtain the output power of the wind turbine. Because of the large size of the torque meter, the shaft power of the wind turbines was obtained via an indirect method in this study. Similar to the method described in Ref. [31], the drive motor and the generator were first installed on two sides of the torque meter. Then, the input voltage of the drive motor and the access resistance of the generator were changed. Subsequently, we recorded the output current, torque data, and rotor speed, respectively, when the generator operated at different speeds, thereby calculating the output power. Thus, the relationship equation between the output power, the output current, and the rotor speed could be derived by fitting. The relationship is as follows,
P = 0.1298 + 0.07518 I + 0.001066 N + 0.001606 I 2 + 0.001425 I N + 5.25 × 10 8 N 2 ,
where P is the output power, in [W], I is the output current, in [A], and N is the rotor speed, in [rpm].
During the test, the positive and negative poles of the generator were connected to form a series circuit in which a PID controller and a 0.5 Ω sampling resistance were connected. A Hall sensor was installed behind the wind rotor to monitor its speed, and the data acquisition collector (USB-6210, National Instruments, Austin, TX, USA) collected the instantaneous circuit. So the output power could be obtained by adjusting the rotor speed of the wind turbine through the PID controller, and then the power coefficient curve of the wind turbine could be drawn. The repeatability tests were carried out at different periods to verify the feasibility of the test and the accuracy of the data. In order to ensure that enough data were collected in the rotation period, at least 50 periods were measured for each condition. Therefore, the sampling rate and numbers in every test were 10 kHz and 50,000, respectively. Besides, the wind turbine with straight blades was tested as a baseline case, and the test wind speed was 7 m/s. Figure 8 shows little difference in the average power coefficient curves drawn based on the five repeated tests. The Pearson correlation coefficients of any two tests were greater than 0.929, indicating that the test had good repeatability. Meanwhile, comparing the test results with the CFD simulation results, the power coefficient values obtained by the two methods were close. The simulation results were slightly larger due to the mechanical loss in the test process. When the tip speed ratios were λ = 2, 3, and 4, the relative errors were 7.42%, 6.19%, and 5.56%, respectively, and the errors were constrained within 10%. The possible reasons for the slight difference between the numerical simulation and the test were that when the tip speed ratio was relatively low, a large area of flow separation could occur on the blade surface. For significant unsteady characteristic conditions, such as large separation and deep stall, the time-averaged results may be delayed compared to the experimental values. Moreover, the rotor was made by 3D printing and directly connected with the motor shaft. The possible vibration in the test would cause a slight deformation of the blade, resulting in deviation of the aerodynamic force. Besides, according to the numerical calculation results of MEXICO wind tunnel measurements [32], it is evident that different numerical methods would lead to different results. It cannot be considered that there is a functional relationship between deviation and tip speed ratio. To solve this question, we need to carry out a series of numerical simulations to clarify this in the following research.
The wake field in the test was measured by a two-dimensional hot-wire anemometer probe (55P61, Dantec Dynamics A/S, Copenhagen, Denmark) with an accuracy of 0.001 V and relative error less than 0.1%. Similar to Li et al., the hot-wire was used to measure the wind turbine wake under different conditions [33].
The three-dimensional mobile support was fixed with a fixed frame holding the hot wire probe. By moving it electrically, displacement can be achieved within the left and right, front and back directions, meeting the measurement range required by the test, as represented in Figure 9. The test measuring points were distributed in the horizontal plane at hub heights 0.5D, 1D, 2D, 3D, 5D, and 8D behind the wind rotor (where D is the rotor diameter). One measuring point was arranged every 1 cm with the hub as the center. Considering that the radius of the wind rotor was 20 cm, the measuring range extended from the hub center to both sides to 30 cm, and 61 measuring points were arranged at each section position, as illustrated in Figure 10. The test measurement points were distributed at hub heights of 0.5D, 1D, 2D, 3D, 5D, and 8D after the rotor, and the spacing between the adjacent measurement points was 1 cm. Besides, stochastic uncertainties may occur in the measurement due to the discretization of the instantaneous velocities. However, according to the experimental configuration in Ref. [33], the stochastic uncertainties can be overcome by a large number of samples (the sampling rate and numbers were 1 kHz and 65,536). Hence, to ensure accurate analysis, the sampling rate and numbers were set at 5 kHz and 100,000 in this study.

4. Results of the Wind Turbine with Swept Blades

From the previous simulation calculation, the power characteristics of the wind turbine with forward swept blades ‘f2010’ had a distinct improvement at λ = 5 compared to the straight blade. To further study the aerodynamic characteristics of the swept blade, wind tunnel tests were conducted on the wind turbine models with straight blades and the swept blades ‘f2010’. We selected four yaw conditions of 0°, 10°, 20°, and 30° to explore the power characteristics at different values of λ through wind tunnel experiments, and measured the wake of the wind turbines in 0° and 20° yaw conditions to study the wake characteristics.

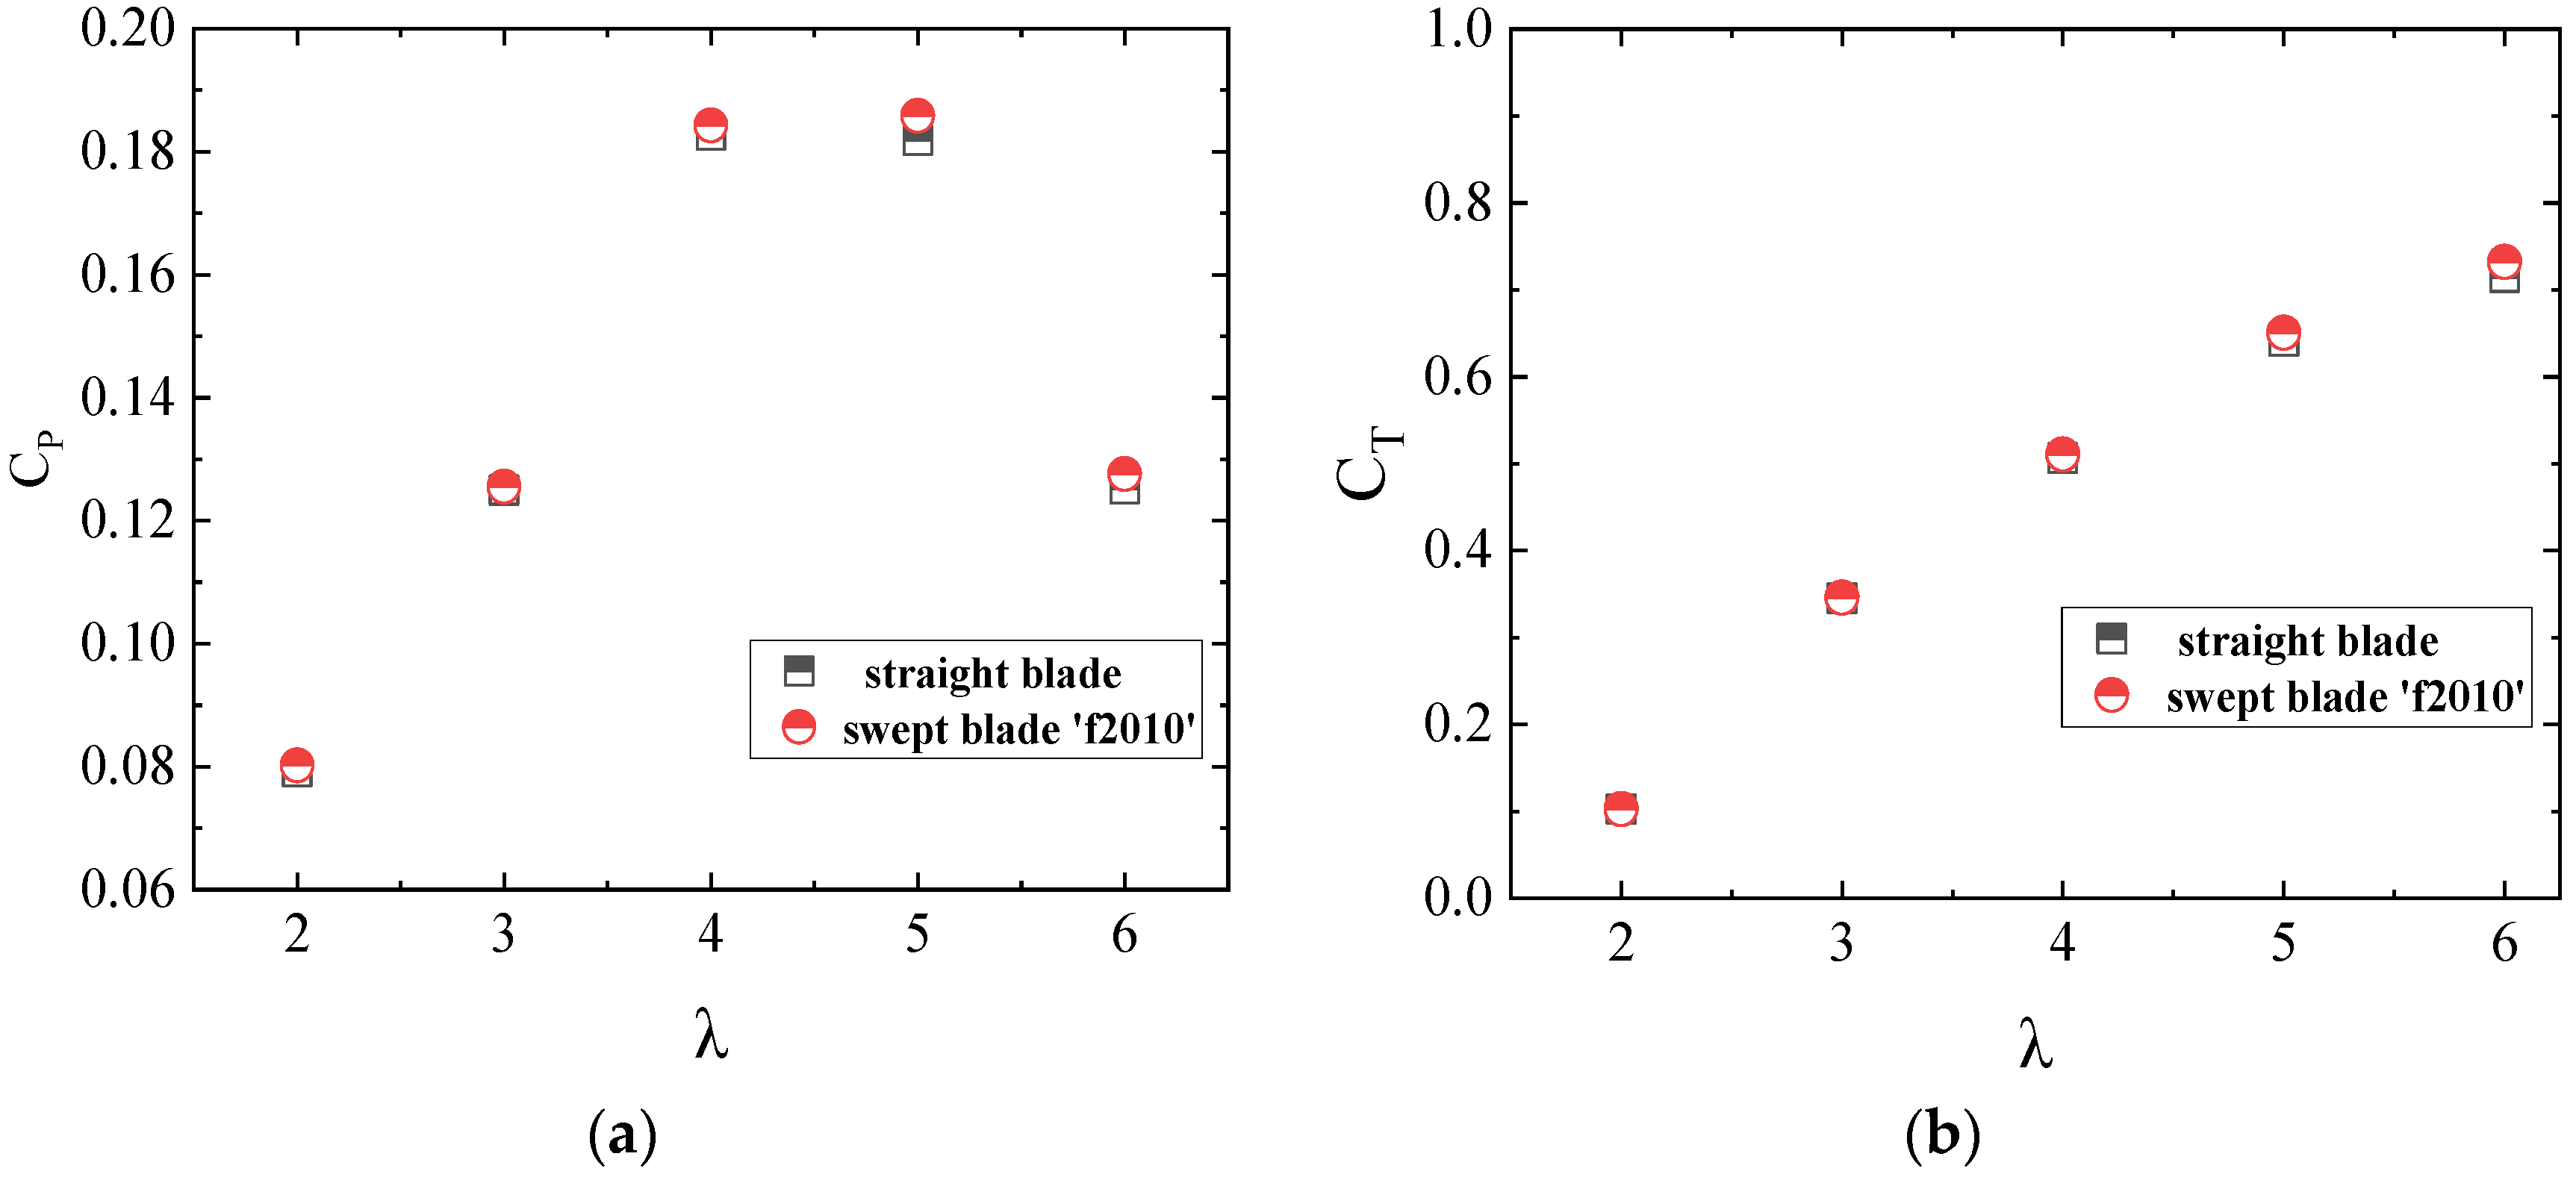
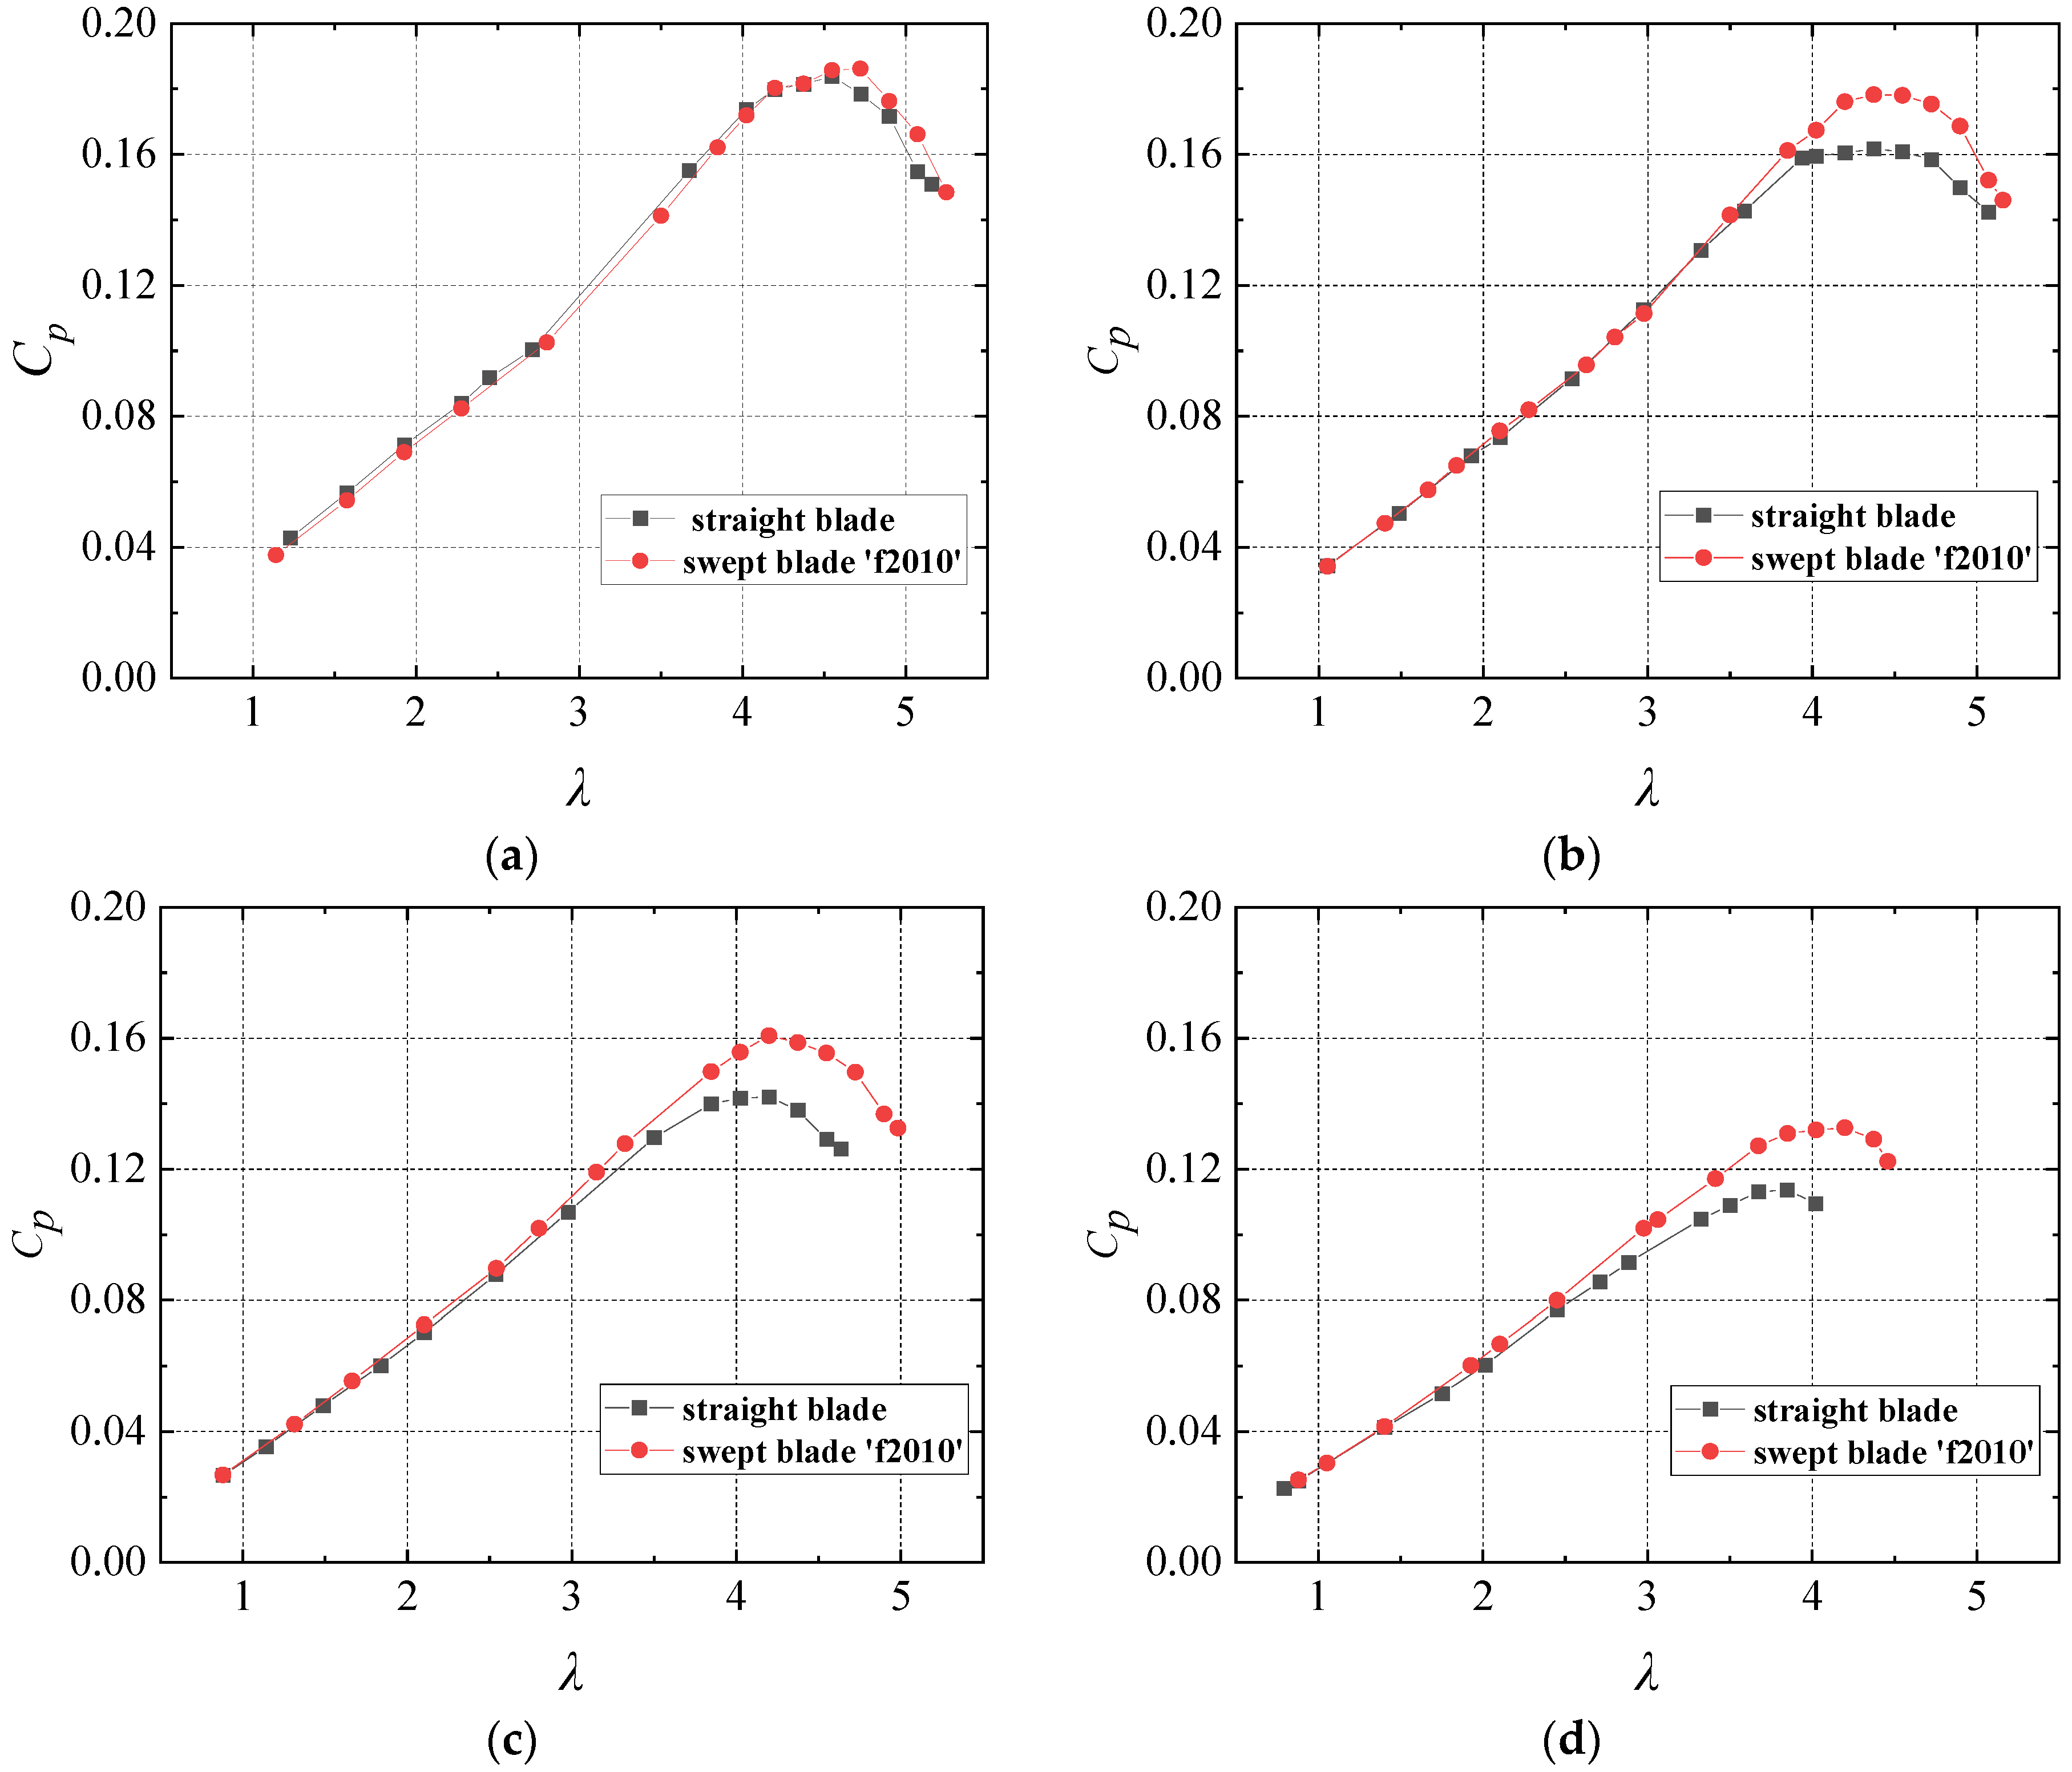
4.1. Analysis of Power Characteristics

Figure 11 illustrates the power coefficient curves of the wind turbines with straight blades and the swept blades ‘f2010’ in different yaw conditions. At low tip speed ratios, both produced almost the same output power at the same yaw angle. As the tip speed ratio increased to a larger value, the power characteristics of the wind turbine with the swept blades ‘f2010’ were improved compared with the wind turbine with straight blades, and the output power increased obviously, especially in yaw conditions.
At yaw angles 0°, 10°, 20°, and 30°, the maximum power coefficients of the wind turbine with the swept blades ‘f2010’ were increased by 1.3%, 10.3%, 13.2%, and 16.7%, respectively, in contrast with the straight blades. When the power coefficients reached the maximum, the yaw moved the value of λ forward. Besides, with the swept blades ‘f2010’, the wind turbine with the highest power coefficient had larger values of λ than the one with straight blades. In different yaw conditions, the improved range of wind turbine power of the swept blades ‘f2010’ differed from that of straight blades. For example, the output power of the wind turbine with the swept blades ‘f2010’ began to increase at λ = 4.5, 3.5, 2.5, and 1.5, respectively, in four yaw conditions, indicating that the larger the yaw angle is, the greater the improvement range of the wind turbine output power is. The probable reason may be that, in the case of yaw conditions, the projected area of the rotor plane decreases in the inflow direction, so the energy flowing into the wind turbine will decrease. The optimal tip speed ratio decreases with the increase of the yaw angle [34]; correspondingly, the tip speed ratio of the blade to start acting on the slightly curved blade also decreases. In addition, with the increase of the yaw angle, the radial force of the swept blades changes more prominently, and the change of radial force could lead to a more significant streamline curvature [5]. The effect of swept blades will be better and more evident with the increase of the yaw angle.
For a small wind turbine composed of DTU-LN221 airfoil, the swept design could make the wind turbine have better aerodynamic characteristics at a high tip speed ratio. Such a power improvement was also significant in the yaw condition. Compared with other flow control methods, which increase the output power by 4.9% [35] and 0.85% [36], this passive control method was more straightforward and practical.

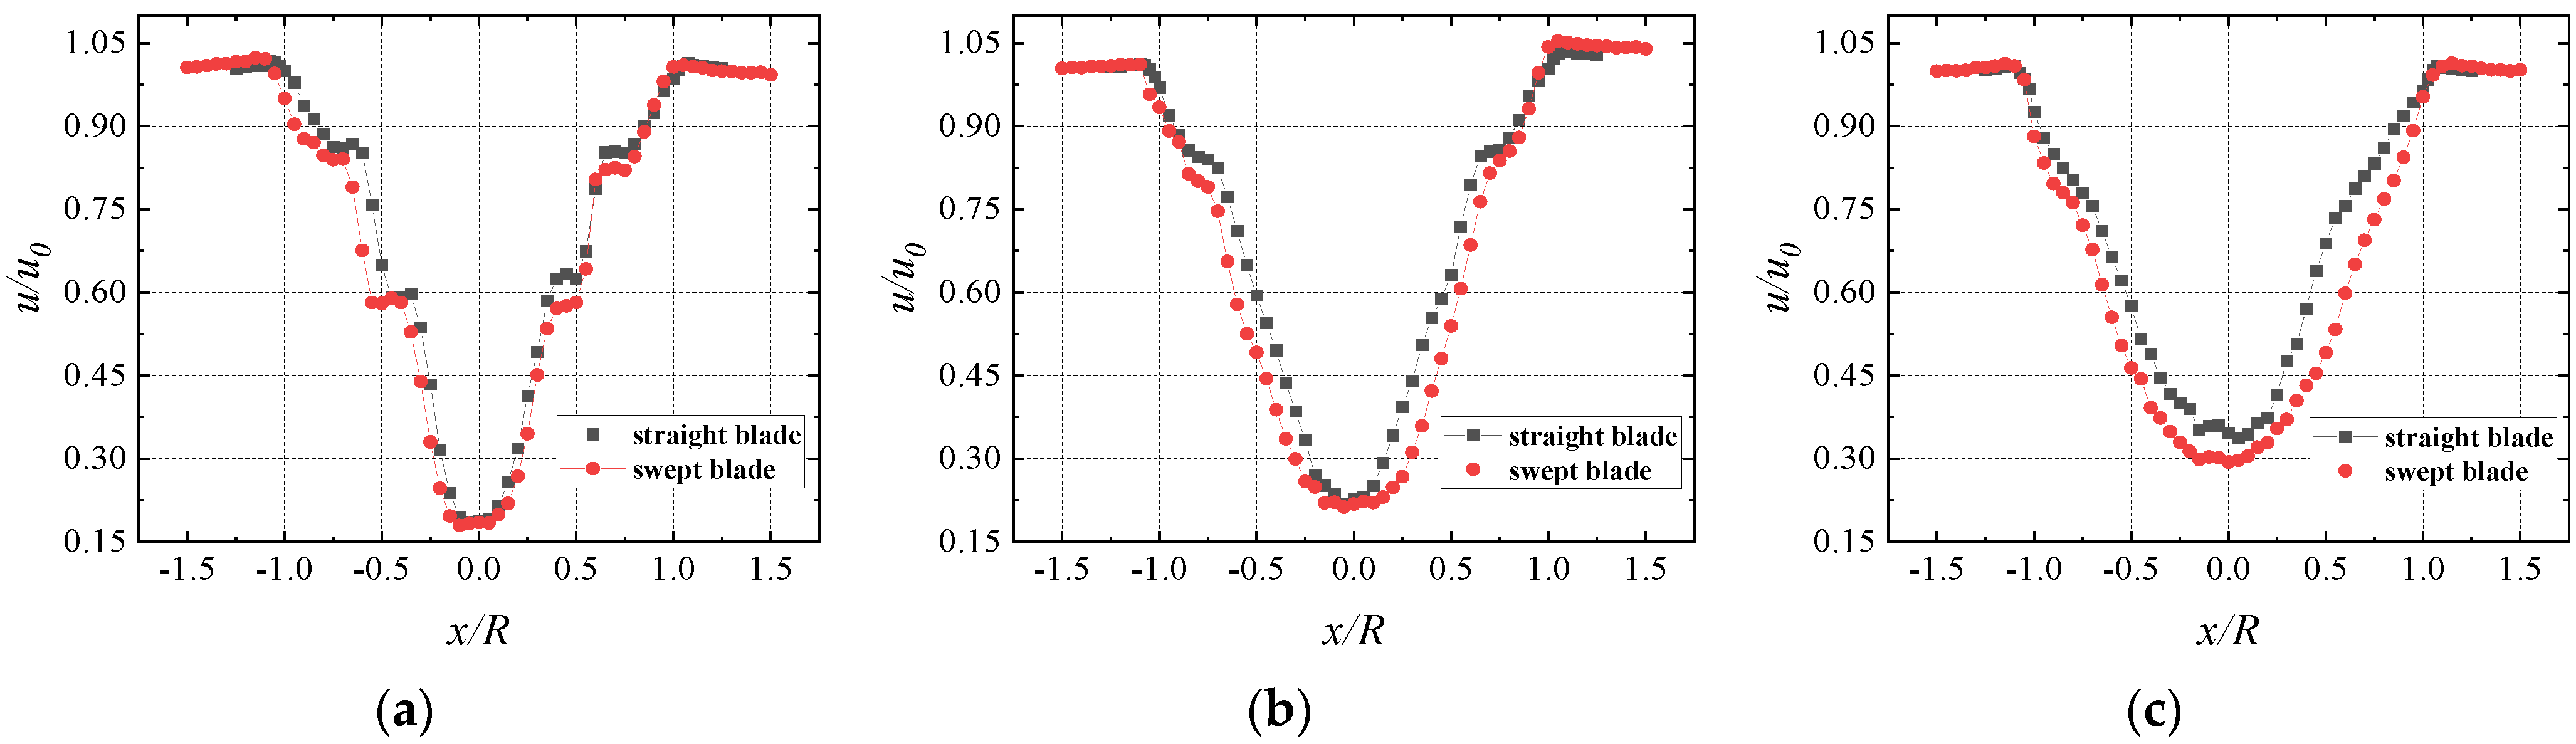
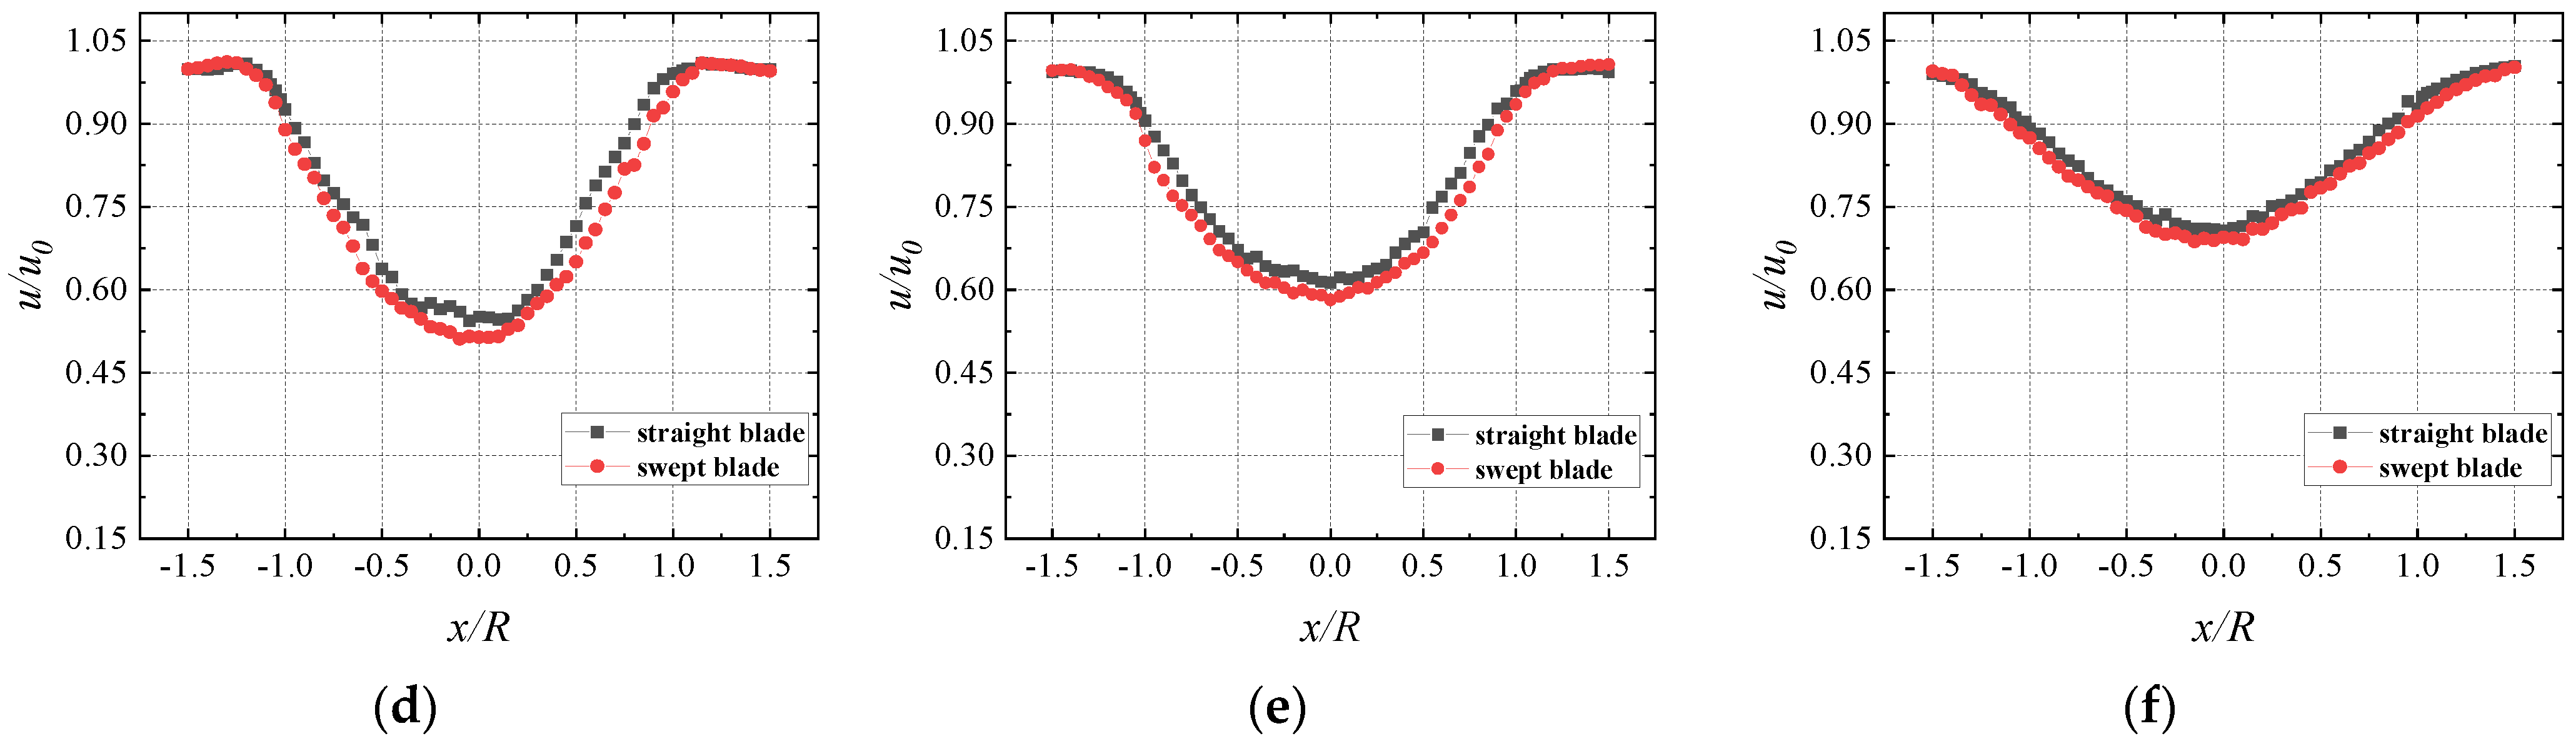
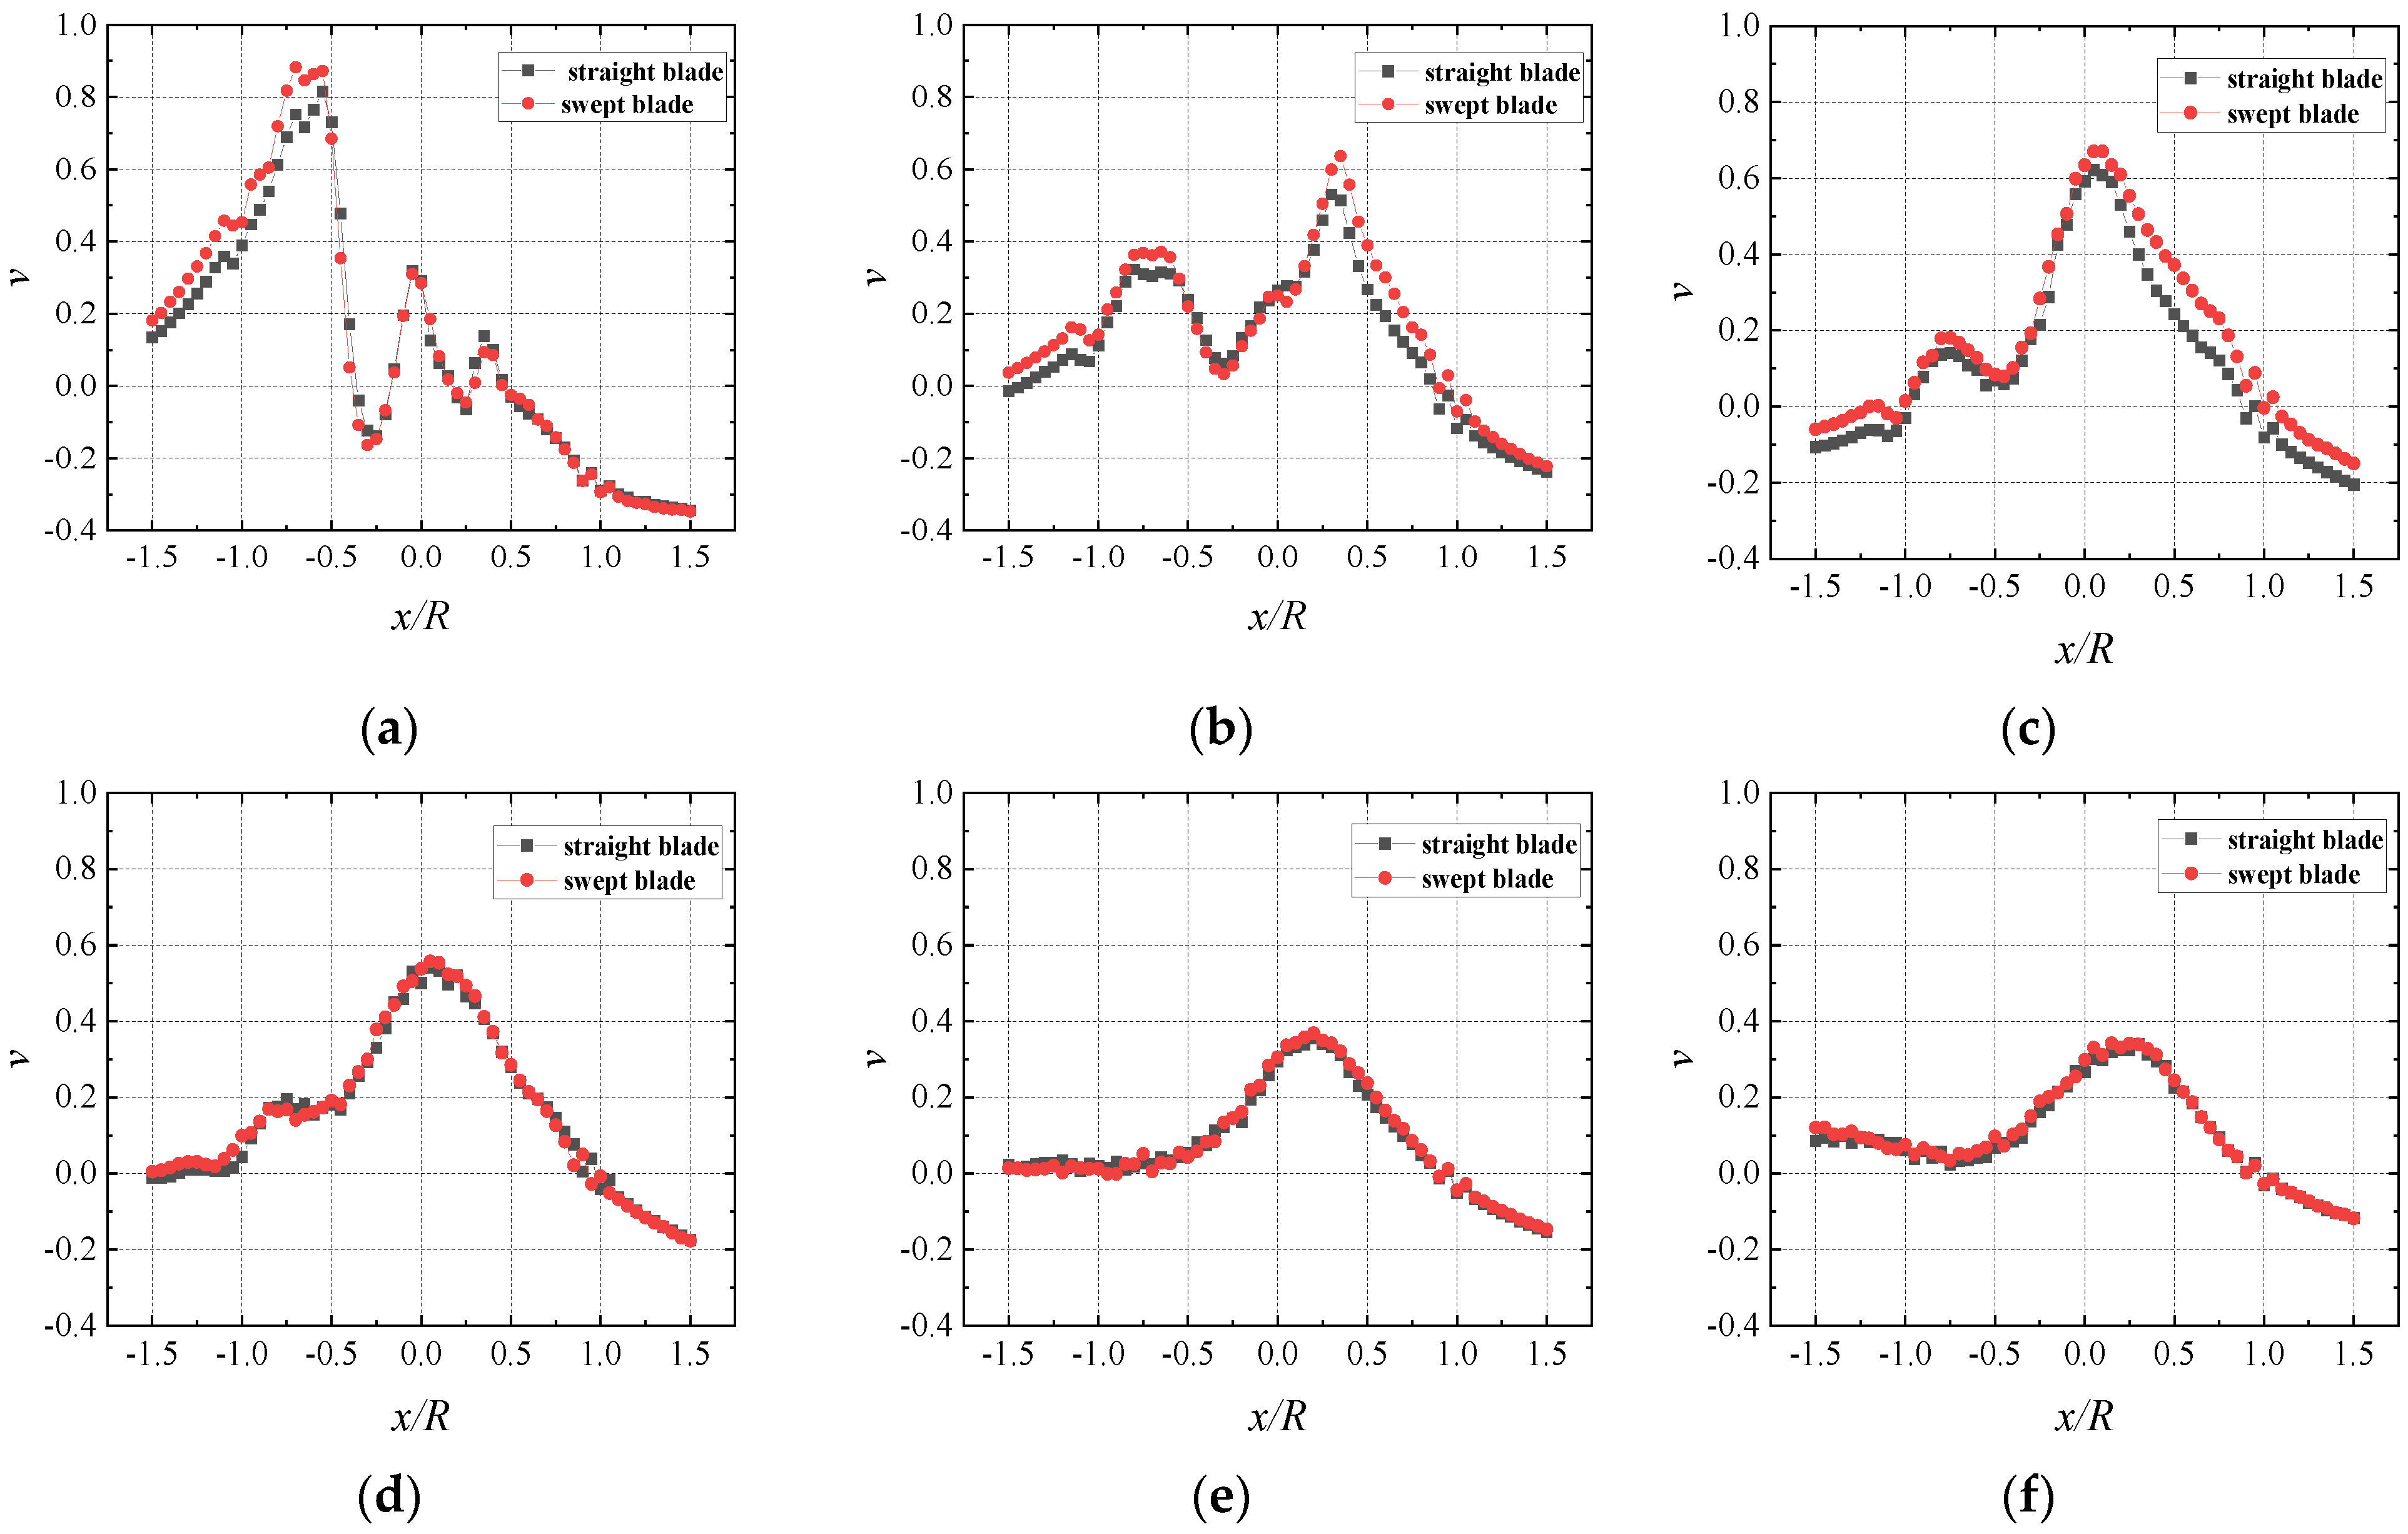
4.2. Analysis of Wake Velocity Characteristics

Figure 12 reveals the streamwise time-averaged velocity distributions of the wake of the wind turbines with straight blades and swept blades when λ = 4.67 without yaw. The wake velocity was dimensionless, namely u/u0. It can be seen from the figures that, owing to the rotation effect of the turbine, the wake of the wind turbines with straight blades and swept blades presented the phenomenon of velocity deficit. The streamwise time-averaged velocity distribution at different sections of the wake area basically presented a symmetrical distribution along the centerline of the rotor. As the wake continued to develop downstream, the velocity distribution gradually changed to a ‘V’ shape. At 0.5D and 1D sections in the near wake region, the minimum wake velocities at the rotor center of the wind turbine with swept blades and straight blades were nearly the same. Because of the intense development of tip vortices and central vortices in the near wake region, the radial distribution of velocities at the center height of the rotor fluctuated wildly, showing a ‘W’ distribution. Moreover, because of the tip acceleration effect, the velocities at the blade tip were high, the velocity deficit in the central vortex region was prominent, and the minimum streamwise velocities only recovered to about 18.5% and 21.7% of the incoming flow. As the position moved towards the blade tip, the wake progressively recovered. Additionally, it can be clearly seen from the figures that the wake recovery of the wind turbine with swept blades was slower than the one with straight blades, and the speed deficit of the wind turbine with swept blades at the same position was severe as well. As the wake of the wind turbine recovered, at the 2D, 3D, 5D, and 8D sections, the minimum velocity at the rotor center of the wind turbine with swept blades and straight blades recovered 29.8%, 51.1%, 59.0%, 68.7%, and 33.7%, 54.4%, 61.3%, and 70.7% of the incoming wind speed, respectively. Therefore, the wake recovery of the wind turbine with swept blades was slightly slower than that with straight blades. It is important to note that although the shape of the blades only changed near the tip position, the swept blades decreased the average wake velocities in the whole wake region. Such results indicated that the flow near the tip of the swept blade has an expansion effect along the spanwise direction. This may be due to the vortices behind the rotor pulsing dramatically, and the collision probability increasing accordingly. Hence, the wake changed in other positions.
The lateral velocities of the wake produced by the wind turbine without yaw were low, but they would become larger in yaw conditions. As shown in Figure 13, in the near wake region, due to the blade tip turbulence, the formation of the wake vortex was relatively intense, and the lateral velocity fluctuations of the wind turbine wake with both two blades were high. When the wake progressively developed downstream, the changes in the lateral velocity of the section gradually flattened. As seen from the swept blade, the maximum lateral velocities at 0.5D, 1D, 2D, 3D, 5D, and 8D sections were 0.88, 0.64 0.63, 0.56, 0.36, and 0.34 m/s, respectively, showing a steadily decreasing trend. Furthermore, the lateral time-averaged velocity distributions of the wind turbine with swept blades at 0.5D, 1D, and 2D sections in the near wake region were slightly larger than that with straight blades, while at 3D, 5D, and 8D, the two trends were the same, and the lateral average velocity distribution curves essentially coincided.

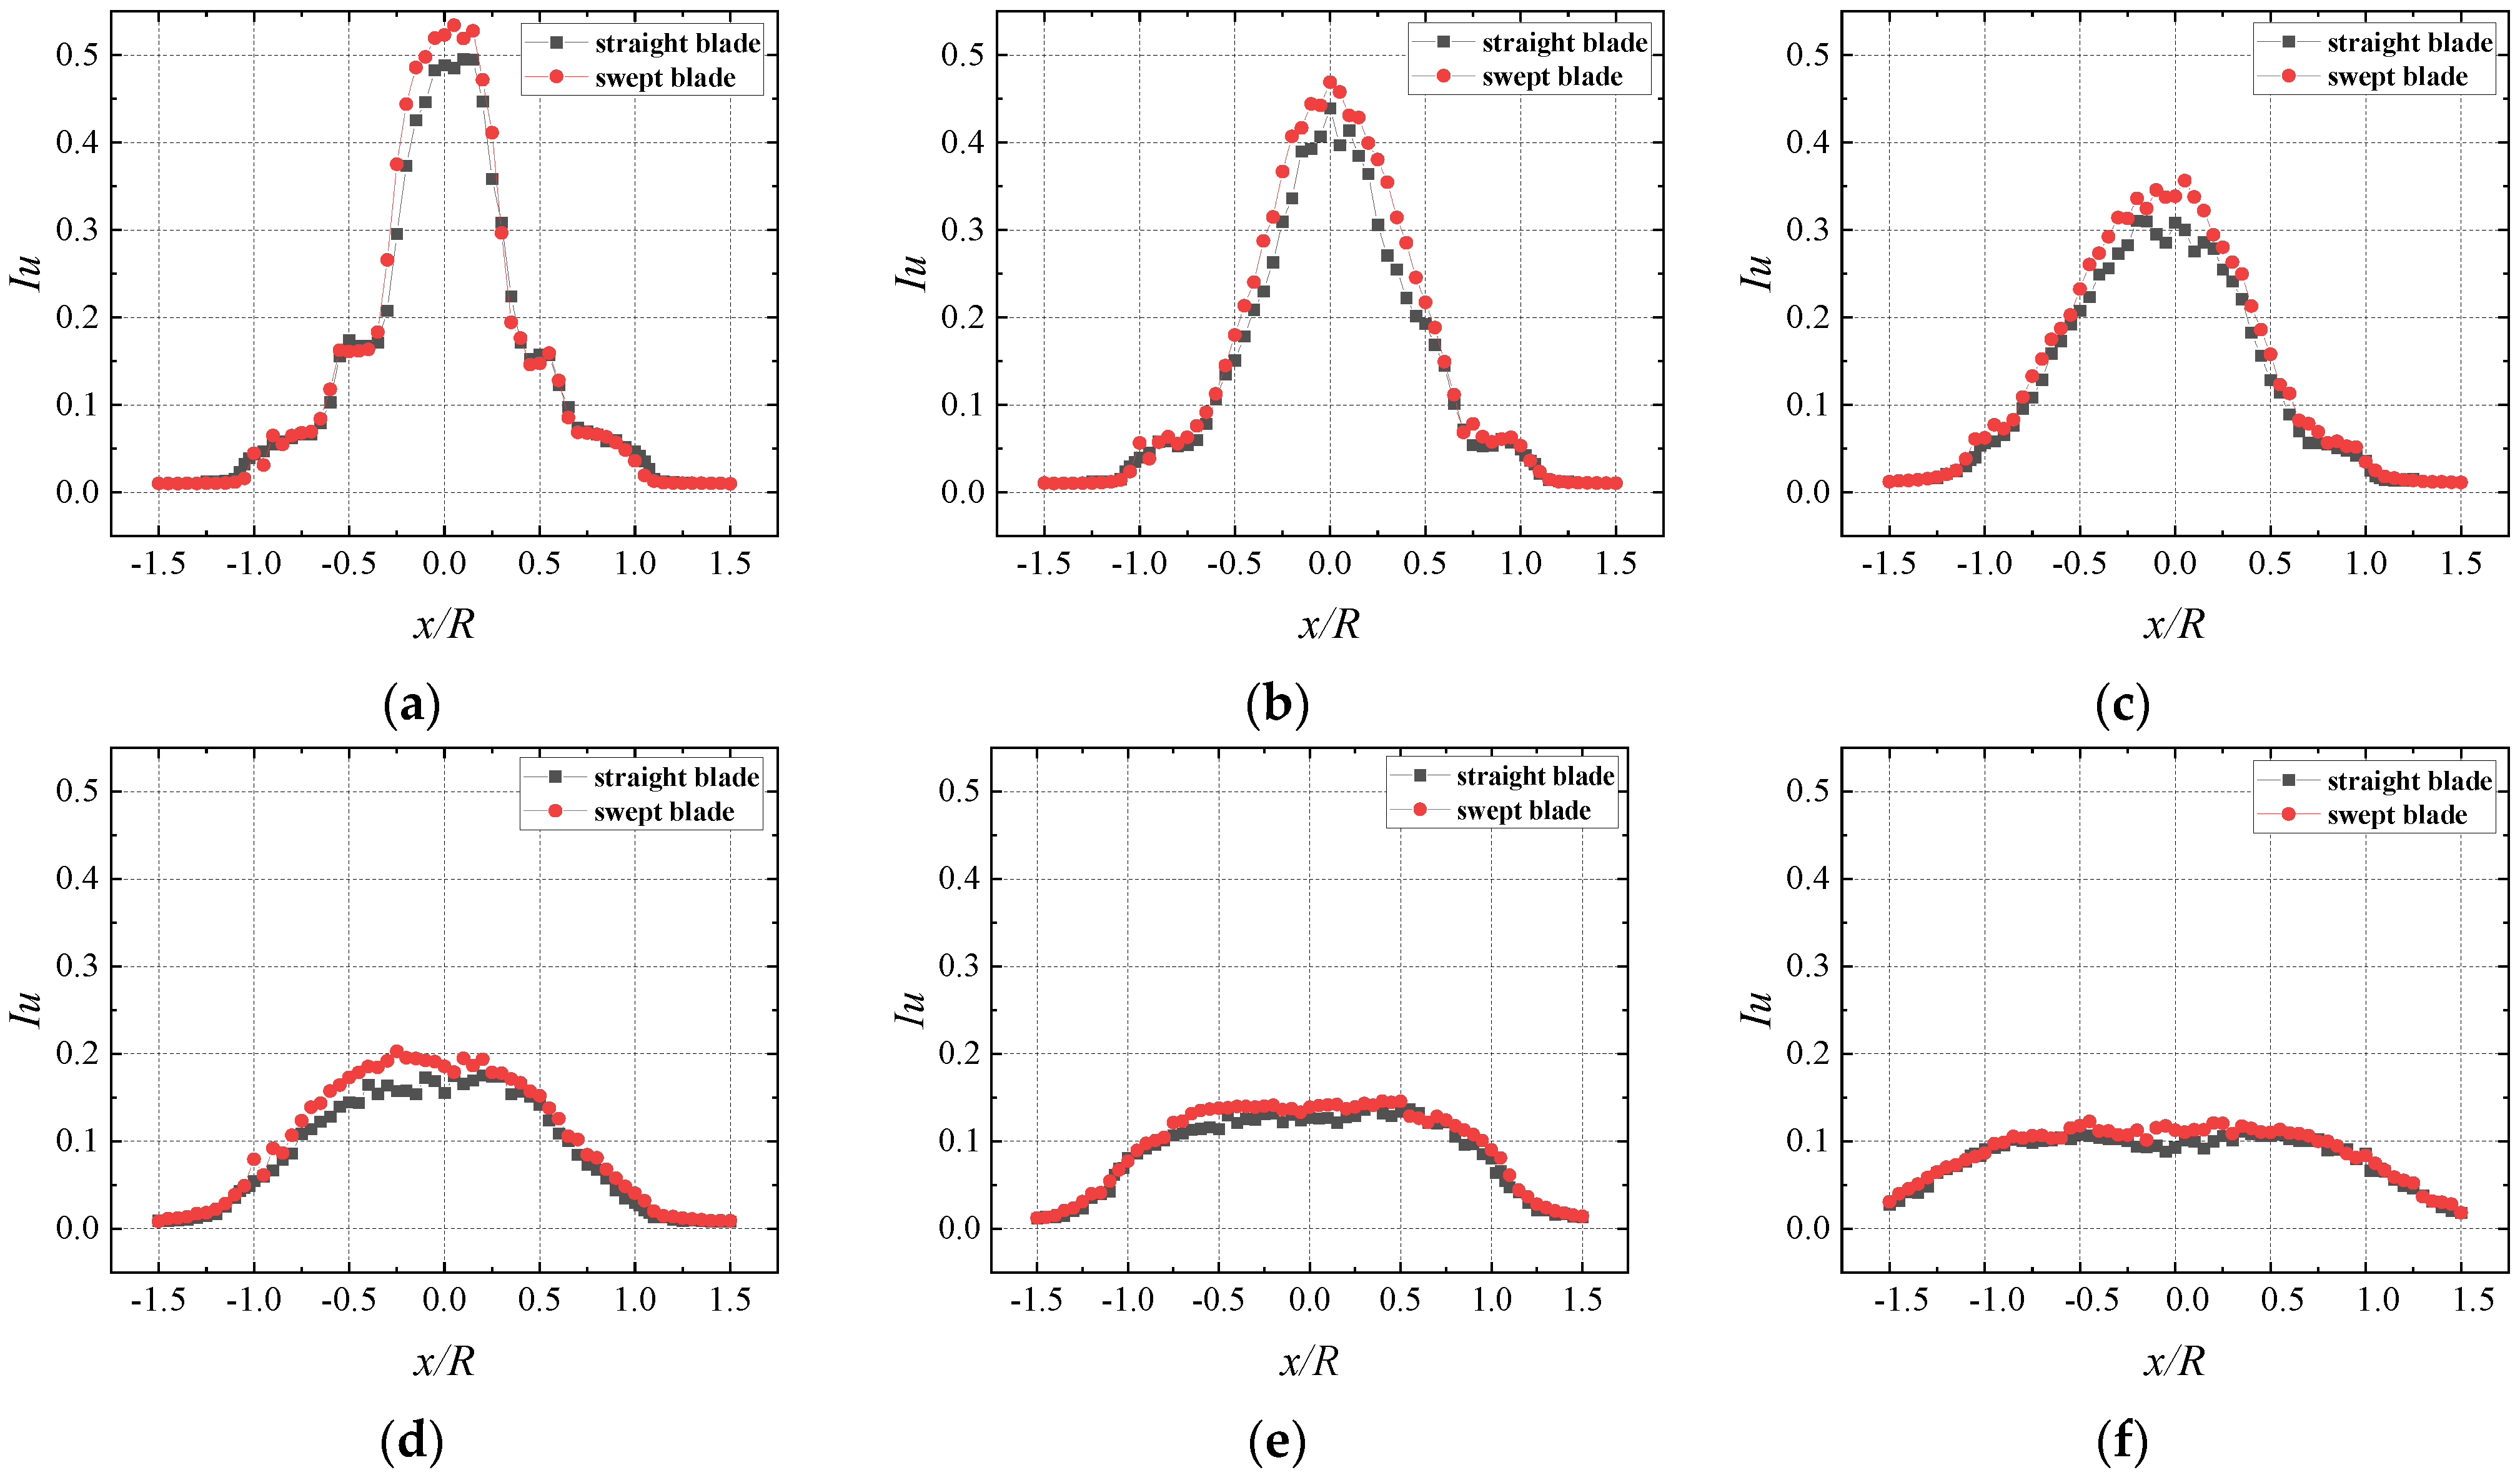
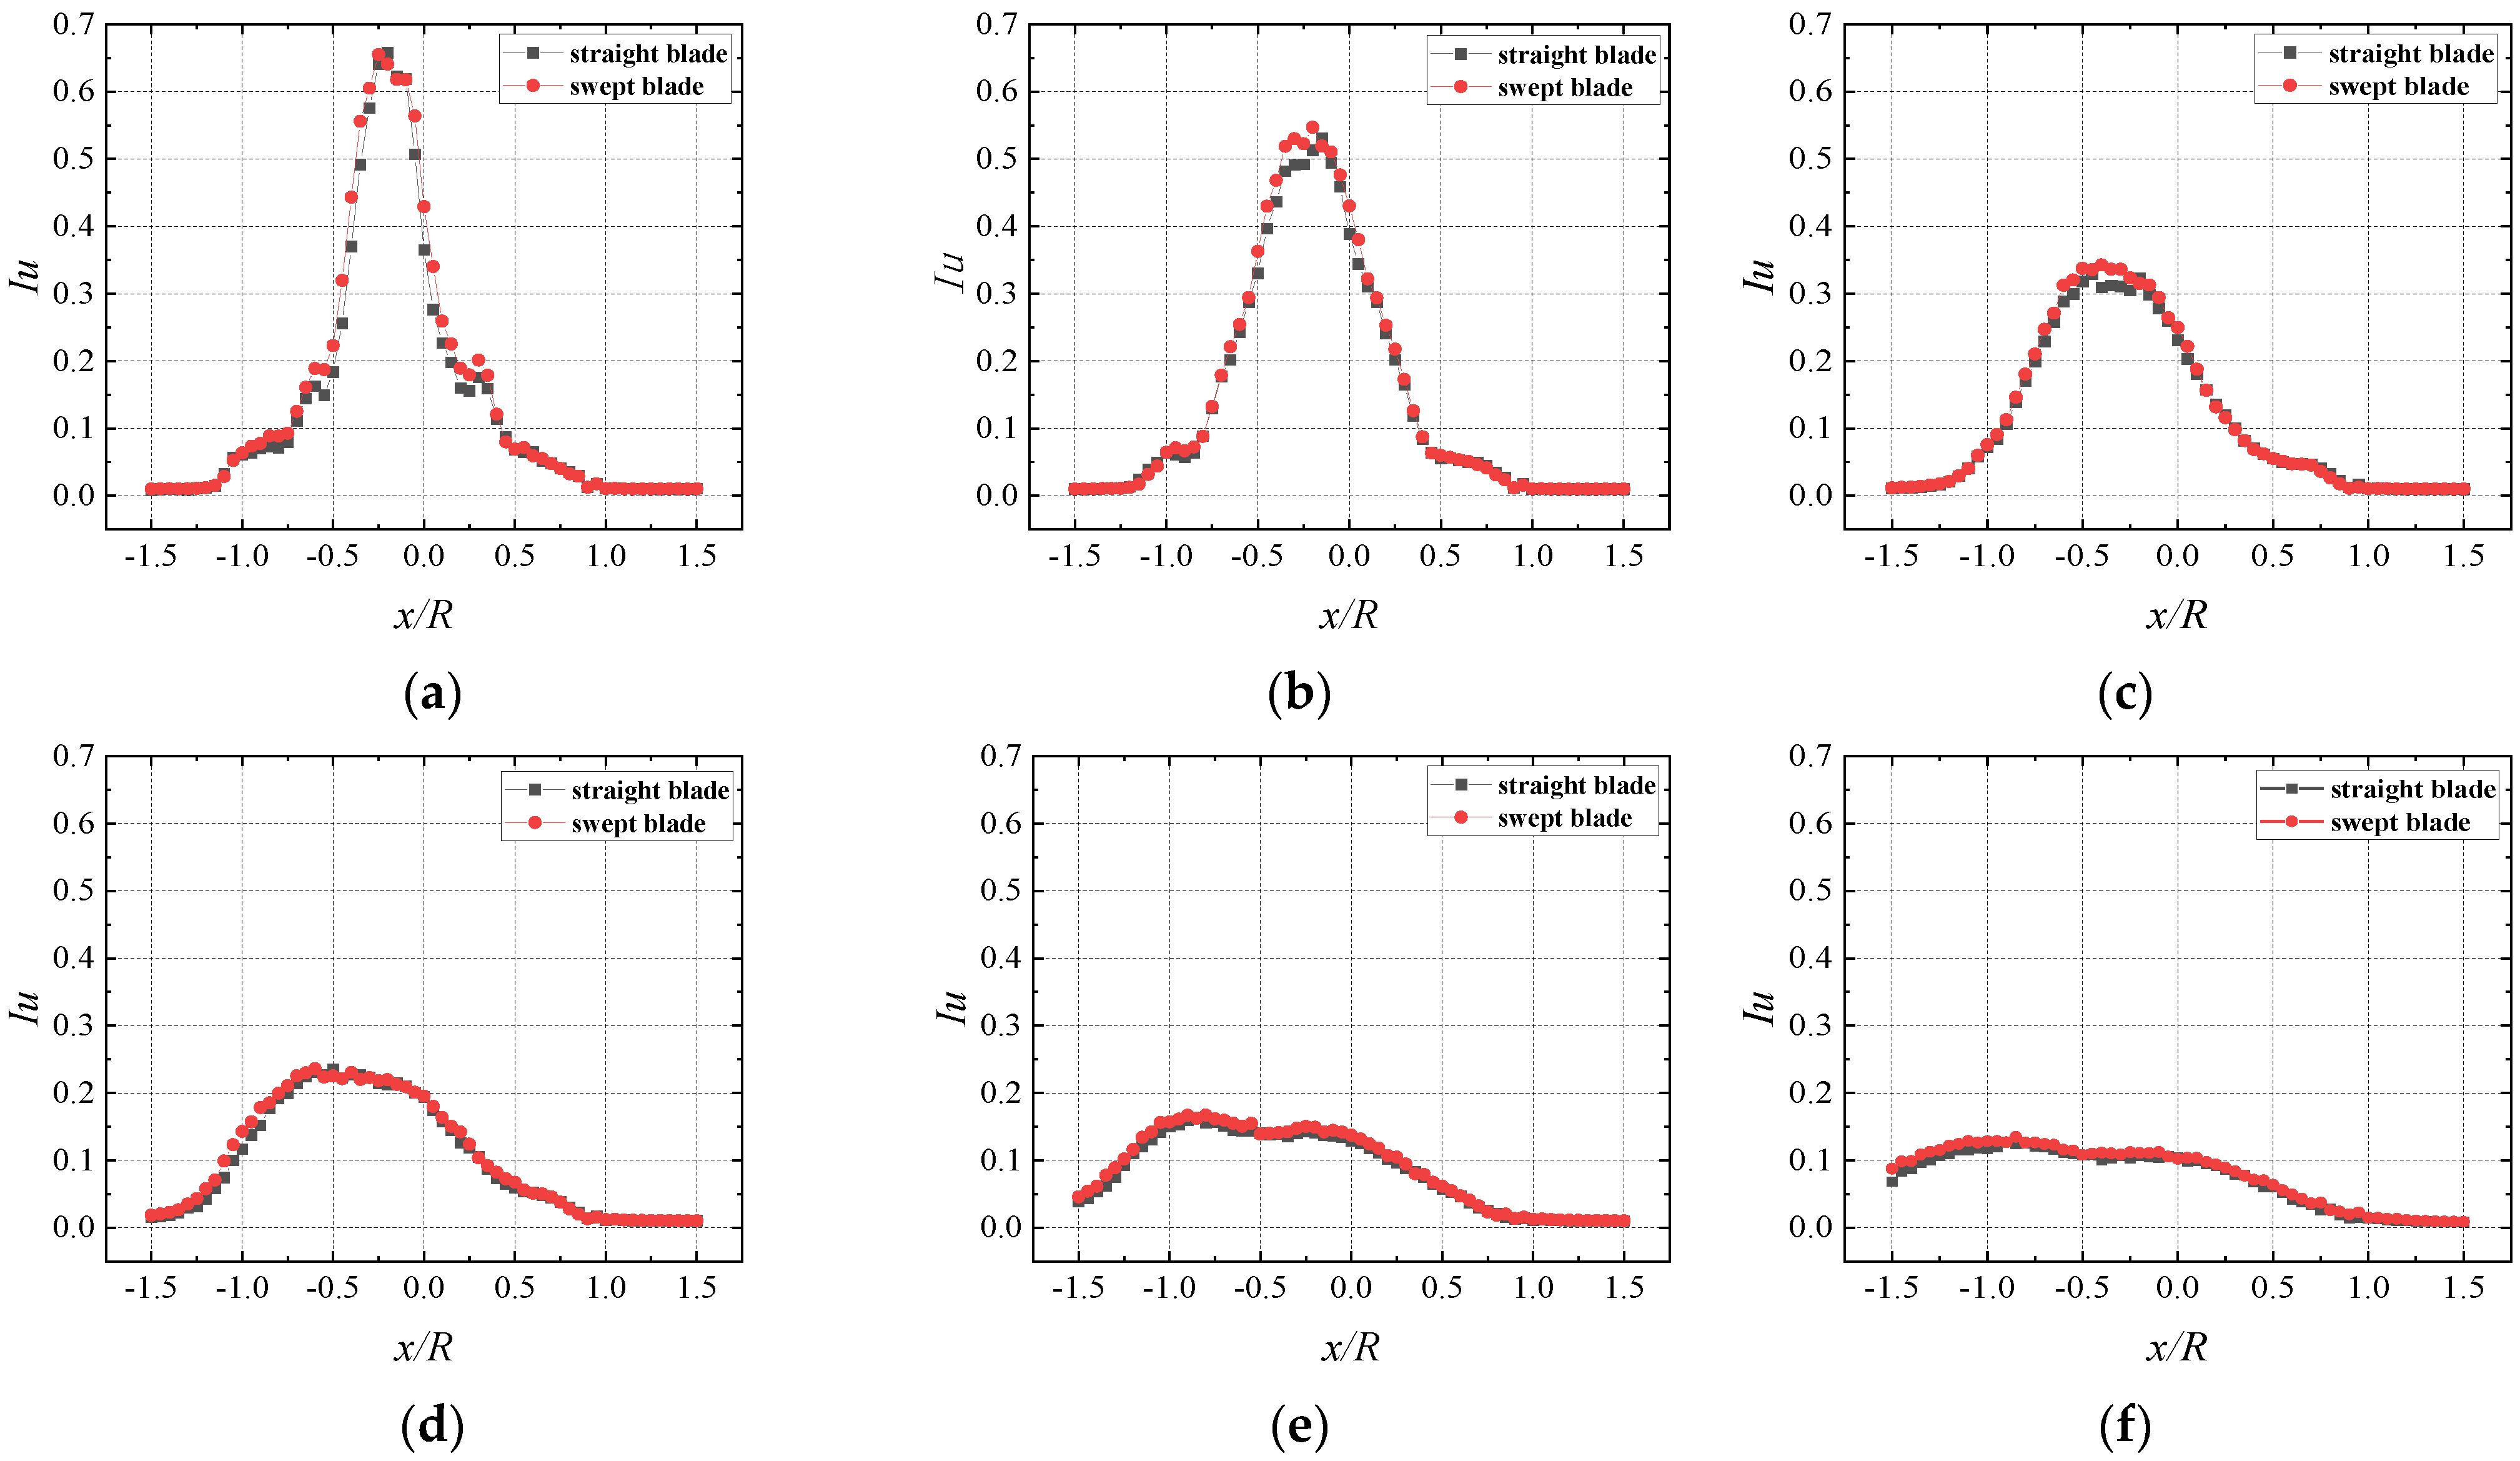
4.3. Analysis of Wake Turbulence Intensity

In contrast to the case without yaw, the wind turbine can produce higher lateral velocity in yaw conditions, which would have a certain impact on the turbulence intensity of the wind turbine wake [37]. In order to explore the influence of yaw on the turbulence intensity in the wake region of the wind turbines with swept blades and straight blades, the wind speed pulsation was measured at different cross-section positions. Then, the turbulence intensity distribution curves of the wind turbine wake could be drawn. In this study, the turbulence intensity was calculated from the ratio of the root mean square to the local mean velocity.
Figure 14 and Figure 15 show that at a yaw angle of 0°, the turbulence intensity mostly appeared as symmetrical distributions in pace with the distributions of the rotor center. In the near wake region, owing to the intense development of the tip vortices, root vortices, and center vortices, positions such as the area near the tip, the root, and the center of the rotor emerge as turbulence intensity peaks. Turbulence intensity changed and fluctuated greatly. As the distance from the wind turbine increased, the turbulence intensity in the wake region gradually decreased. Taking the wind turbine with swept blades ‘f2010’ as an example, from 0.5D to 8D, the maximum turbulence intensity values of the section were 53.4%, 46.9%, 35.6%, 20.3%, 14.6%, and 12.1%, respectively. The turbulence intensity progressively recovered in the far wake region and was the largest at the blade root. The trend of both was consistent in comparing turbulence intensity in the wake region between the wind turbines with swept blades and straight blades. The wake influence area was nearly resembling. However, the turbulence intensity values in the wake region of the wind turbine with swept blades were slightly larger than that with straight blades. When located in the rotor center, the difference between the two cases was the largest. From the rotor center to the blade tip, the difference between the wind turbines’ turbulence intensity values with two blades gradually decreased.
At a yaw angle of 20°, the distributions of the turbulence intensity along the rotor center were almost symmetrical at the 0.5D and 1D sections in the near wake region. Nevertheless, with the increasing distance away from the wind turbine’s position, the distribution was irregular by degrees. In addition, the offset from the position where peak turbulence intensity was achieved to the rotor center also increased with the further distance from the wind turbine. In the near wake region, wind turbines with swept blades and straight blades produced roughly similar distributions of the turbulent intensity. In contrast, with the development of the wake flow downstream, the turbulent intensity of the wind turbines with swept blades was more extensive than that with straight blades in the yaw direction. Although high turbulence intensity could lead to faster wake recovery, excessive turbulence also means larger unstable aerodynamic loads, significantly affecting wind turbine service life and maintenance cost. This situation needs to be paid attention to when optimizing design.

5. Conclusions

This paper conducted a swept optimization design based on the straight blade of the DTU-LN221 airfoil. Taking the tip offset (z/R) and the location of sweep start (rs/R) as variables, the swept equation was thus determined. The simulation results show that the larger the values of the tip offset and the location of the sweep start, the smaller the power coefficients and thrust coefficients of the wind turbine. In contrast to the backward swept design, the forward swept design had a more pronounced improvement in the power characteristics of the blades. The power characteristics of the wind turbine with forward swept blades whose tip offset was 10% of the radius and the sweep start location was 20% of the radius were most significantly improved.
Comparing the output power characteristic curves of the wind turbines with straight blades and swept blades at yaw angles of 0°, 10°, 20°, and 30°, respectively, it was found that the swept blade had a smaller power loss in yaw conditions than the straight blade. As the tip speed ratio increased to a larger value, the output power of the wind turbine with swept blades was higher than that of the wind turbine with straight blades. Especially in yaw conditions, the output power of the wind turbine with swept blades increases significantly.
By contrasting the wake characteristics with swept blades and straight blades at yaw angles of 0° and 20°, it was apparent that at high tip speed ratios, the streamwise time-averaged velocity deficit of the wind turbine wake with straight blades was higher than that without yaw. The turbulence intensity in the wake region of the wind turbine with swept blades was also larger than that with straight blades. The maximum difference occurred behind the center of the rotor. Based on the results in yaw conditions, the turbine could produce higher lateral velocities. The lateral time-averaged velocities of the wind turbine wake with swept blades were a bit higher than that with the straight blades in the near wake region. Furthermore, with the development of the wake downstream, the turbulence intensity with swept blades in the yaw direction was greater than that with straight blades.
Overall, this research further enriches the content of wind turbine aerodynamics and provides experimental data for verifying the numerical simulation research. It is worth noting that the discussions above might be helpful for validating the small-scale wind turbine studies and also provide a better interpretation of the swept optimization design. Nevertheless, the natural inflow of the wind turbines is usually the instantaneous variation of gusts combined with the boundary-layer wind. Therefore, to more accurately analyze the effect of the combination of this inflow condition with the small-scale wind turbine, subsequent research needs to be carried out combined with turbulent flow.

Author Contributions

Conceptualization, J.Y. and H.Y.; methodology, Z.G. and H.Y.; formal analysis, C.S., X.H. and J.Y.; funding acquisition, Z.G. and J.Y.; writing—original draft preparation, X.H.; writing—review and editing, J.Y. and H.Y. All authors have read and agreed to the published version of the manuscript.

Funding

This research was funded by Open Fund of Key Laboratory of Wind Energy and Solar Energy Technology Ministry of Education of China under grant number 2021ZD01 and the Natural Science Foundation of Jiangsu Higher Education Institutions of China under grant number 22KJD480003.

Institutional Review Board Statement

Not applicable.

Informed Consent Statement

Not applicable.

Data Availability Statement

Not applicable.

Conflicts of Interest

The authors declare no conflict of interest.

References

  1. Dai, Y.; Stine, H.; Lars, O. Catching up through green windows of opportunity in an era of technological transformation: Empirical evidence from the Chinese wind energy sector. Ind. Corp. Change 2021, 29, 1277–1295. [Google Scholar] [CrossRef]
  2. ASEAN Centre for Energy and China Renewable Energy Engineering Institute. Research on Applications of Low Wind Speed Power in ASEAN. Available online: https://aseanenergy.org/research-on-applications-of-low-wind-speed-power-in-asean/ (accessed on 17 September 2022).
  3. Hua, X.; Zhang, C.H.; Wei, J.D.; Hu, X.J.; Wei, H.L. Wind turbine bionic blade design and performance analysis. J. Vis. Commun. Image R. 2019, 60, 258–265. [Google Scholar] [CrossRef]
  4. Tian, C.Y.; Liu, X.M.; Wang, J.H.; Wu, L.M.; Wang, W. Study on Aerodynamic Performance of the Cross Flow Fan Using Bionic Blade with Bird Wing-Like Thickness Distribution. J. Xi’An. Jiaotong. Univ. 2022, 56, 84–93. [Google Scholar]
  5. Khalafallah, M.G.; Ahmed, A.M.; Emam, M.K. CFD study of some factors affecting performance of HAWT with swept blades. Int. J. Sustain. Energy 2015, 36, 489–501. [Google Scholar] [CrossRef]
  6. Khalafallah, M.G.; Ahmed, A.M.; Emam, M.K. The effect of using winglets to enhance the performance of swept blades of a horizontal axis wind turbine. Adv. Mech. Eng. 2019, 11, 1–10. [Google Scholar] [CrossRef]
  7. Amano, R.; Avdeev, I.; Malloy, R.; Shams, M.Z. Power, structural and noise performance tests on different wind turbine rotor blade designs. Int. J. Sustain. Energy 2013, 32, 78–95. [Google Scholar] [CrossRef]
  8. Shen, X.; Zhu, X.; Du, Z. The influence of the swept and leaned blade to the aerodynamic performance of horizontal axis wind turbine. J. Eng. Thermophys. 2011, 32, 1481–1484. [Google Scholar]
  9. Kaya, M.N.; Kose, F.; Ingham, D.; Ma, L.; Pourkashanian, M. Aerodynamic performance of a horizontal axis wind turbine with forward and backward swept blades. J. Wind Eng. Ind. Aero. 2018, 176, 166–173. [Google Scholar] [CrossRef]
  10. Chattot, J.J. Effects of blade tip modifications on wind turbine performance using vortex model. Comput. Fluids 2009, 38, 1405–1410. [Google Scholar] [CrossRef]
  11. Kong, F.; Wu, T.; Hu, J. Study of swept and curved blade influences on HAWT performance. In Proceedings of the 2009 World Non-Grid-Connected Wind Power and Energy Conference, Nanjing, China, 24–26 September 2009. [Google Scholar]
  12. Chen, H.; Shi, K.; Xu, J. Stall delay effect of aft-swept blade of horizontal axis wind turbine. Acta. Energy Sol. Sin. 2014, 35, 1311–1318. [Google Scholar]
  13. Ding, Y.; Zhang, X. An optimal design method of swept blades for HAWTs. J. Renew. Sustain. Energy 2016, 8, 463–471. [Google Scholar] [CrossRef]
  14. Pavese, C.; Kim, T.; Murcia, J.P. Design of a wind turbine swept blade through extensive load analysis. Renew. Energy 2017, 102, 21–34. [Google Scholar] [CrossRef]
  15. Sessarego, M.; Feng, J.; Ramos-García, N.; Horcas, S.G. Design optimization of a curved wind turbine blade using neural networks and an aero-elastic vortex method under turbulent inflow. Renew. Energy 2020, 146, 1524–1535. [Google Scholar] [CrossRef]
  16. Li, A.; Gaunaa, M.; Pirrung, G.R.; Ramos-García, N.; Horcas, S.G. The influence of the bound vortex on the aerodynamics of curved wind turbine blades. J. Phys. Conf. Ser. 2020, 1618, 052038. [Google Scholar] [CrossRef]
  17. Gözcü, O.; Kim, T.; Verelst, D.R.; McWilliam, M.K. Swept Blade Dynamic Investigations for a 100 kW Small Wind Turbine. Energies 2022, 15, 3005. [Google Scholar] [CrossRef]
  18. Ashwill, T.D.; Kanaby, G.; Jackson, K.; Zuteck, M. Development of the sweep-twist adaptive rotor (STAR) blade. In Proceedings of the 48th AIAA Aerospace Sciences Meeting Including the New Horizons Forum and Aerospace Exposition, Orlando, FL, USA, 4–7 January 2010. [Google Scholar]
  19. Zhang, S.; Tian, S.Y.; Zhang, X.M.; Li, H.X.; Xi, D.K.; He, W.Q.; Zhang, A.C. Research Progress of Skew and Sweep Aerodynamic Technology for Turbomachinery Blades. J. Propuls. Tech. 2021, 42, 2417–2431. [Google Scholar]
  20. Wadia, A.R.; Szucs, P.N.; Crall, D.W. Inner workings of aerodynamic sweep. J. Turbomach. 1998, 120, 671–682. [Google Scholar] [CrossRef]
  21. Govardhan, M.; Kumar, O.G.K.; Sitaram, N. Investigations on low speed axial compressor with forward and backward sweep. J. Therm. Sci. 2007, 16, 121–133. [Google Scholar] [CrossRef]
  22. Benini, E.; Biollo, R. Aerodynamics of swept and leaned transonic compressor rotors. Appl. Energy 2007, 84, 1012–1027. [Google Scholar] [CrossRef]
  23. Lubitz, W.D. Impact of ambient turbulence on performance of a small wind turbine. Renew. Energy 2014, 61, 69–73. [Google Scholar] [CrossRef]
  24. Talavera, M.; Shu, F. Experimental study of turbulence intensity influence on wind turbine performance and wake recovery in a low-speed wind tunnel. Renew. Energy 2017, 109, 363–371. [Google Scholar] [CrossRef]
  25. Kosasih, B.; Hudin, H.S. Influence of inflow turbulence intensity on the performance of bare and diffuser-augmented micro wind turbine model. Renew. Energy 2016, 87, 154–167. [Google Scholar] [CrossRef]
  26. Ashwill, T. Sweep-Twist Adaptive Rotor Blade: Final Project Report, SANDIA Report; Sandia National Laboratories: Albuquerque, NM, USA; San Diego, CA, USA, 2010. [Google Scholar]
  27. Hansen, M.H. Aeroelastic Properties of Backward Swept Blades. In Proceedings of the 49th AIAA Aerospace Sciences Meeting Including the New Horizons Forum and Aerospace Exposition, Oriando, FL, USA, 4–7 January 2011. [Google Scholar]
  28. Sessarego, M.; Ramos-Garcia, N.; Yang, H.; Shen, W.Z. Aerodynamic wind-turbine rotor design using surrogate modeling and three-dimensional viscous–inviscid interaction technique. Renew. Energy 2016, 93, 620–635. [Google Scholar] [CrossRef]
  29. Menter, F.R. Zonal two equation k-w turbulence models for aerodynamic flows. In Proceedings of the 24th Fluid Dynamics Conference, Orlando, FL, USA, 6–9 July 1993. [Google Scholar]
  30. Menter, F.R. Two-equation eddy-viscosity turbulence models for engineering applications. AIAA J. 2012, 32, 1598–1605. [Google Scholar] [CrossRef] [Green Version]
  31. Bastankhah, M.; Fernando, P.-A.; Blaabjerg, F. A new miniature wind turbine for wind tunnel experiments. Part I: Design and performance. Energies 2017, 10, 908. [Google Scholar] [CrossRef]
  32. Boorsma, K.; Schepers, J.; Gomez-Iradi, S.; Herraez., I.; Lutz, T.; Weihing, P.; Oggiano, L.; Pirrung, G.; Madsen, H.; Shen, W.; et al. Final Report of IEA Wind Task 29 Mexnext (Phase 3); ECN-E-18-003 ECN; International Energy Agency: Paris, France, 2018. [Google Scholar]
  33. Li, Q.; Murata, J.; Endo, M.; Maeda, T.; Kamada, Y. Experimental and numerical investigation of the effect of turbulent inflow on a Horizontal Axis Wind Turbine (part II: Wake characteristics). Energy 2016, 113, 1304–1315. [Google Scholar] [CrossRef]
  34. Li, Q.; Murata, J.; Endo, M.; Maeda, T.; Kamada, Y. Experimental and numerical investigation of the effect of turbulent inflow on a Horizontal Axis Wind Turbine (Part I: Power performance). Energy 2016, 113, 713–722. [Google Scholar] [CrossRef]
  35. Matsuda, H.; Tanaka, M.; Osako, T.; Yamazaki, K.; Oryu, Y. Plasma actuation effect on a MW class wind turbine. J. Eng. Gas Turb. Power 2017, 9, 47–52. [Google Scholar] [CrossRef]
  36. Ebrahimi, A.; Movahhedi, M. Power improvement of NREL 5-MW wind turbine using multi-DBD plasma actuators. Energ. Convers. Manag. 2017, 146, 96–106. [Google Scholar] [CrossRef]
  37. Lee, H.; Lee, D.J. Wake impact on aerodynamic characteristics of horizontal axis wind turbine under yawed flow conditions. Renew. Energy 2019, 136, 383–392. [Google Scholar] [CrossRef]
Figure 1. The schematic of the blade sweep.
Machines 10 00876 g001
Figure 2. Sketches of the straight blade and designed swept blades.
Machines 10 00876 g002
Figure 3. Grid of the computational stationary domain.
Machines 10 00876 g003
Figure 4. Grid of the computational rotation domain.
Machines 10 00876 g004
Figure 5. Pressure coefficient distribution of different sections at λ = 5. (a) 35% section; (b) 65% section; (c) 80% section; (d) 95% section.
Machines 10 00876 g005aMachines 10 00876 g005b
Figure 6. Comparison of coefficient curves for the wind turbines with straight blades and the swept blades ‘f2010’. (a) CP-λ curves; (b) CT-λ curves.
Machines 10 00876 g006
Figure 7. Photographs of the wind turbines with different blades taken inside the wind tunnel. (a) Straight blade; (b) swept blade; (c) blade parameters.
Machines 10 00876 g007aMachines 10 00876 g007b
Figure 8. Verification of the test repeatability of the wind turbine with swept blades at 7 m/s.
Machines 10 00876 g008
Figure 9. Measurement in the wind tunnel.
Machines 10 00876 g009
Figure 10. Distribution of flow field measuring points (horizontal plane at hub height).
Machines 10 00876 g010
Figure 11. Wind turbine power characteristic curves at different yaw angles. (a) 0°; (b) 10°; (c) 20°; (d) 30°.
Machines 10 00876 g011
Figure 12. Streamwise time-averaged velocity distribution at a yaw angle of 0° when λ = 4.67. (a) 0.5D; (b) 1D; (c) 2D; (d) 3D; (e) 5D; (f) 8D.
Machines 10 00876 g012aMachines 10 00876 g012b
Figure 13. Lateral time-averaged velocity distribution at a yaw angle of 20° when λ = 4.1. (a) 0.5D; (b) 1D; (c) 2D; (d) 3D; (e) 5D; (f) 8D.
Machines 10 00876 g013
Figure 14. Streamwise turbulence intensity distribution at a yaw angle of 0° when λ = 4.67. (a) 0.5D; (b) 1D; (c) 2D; (d) 3D; (e) 5D; (f) 8D.
Machines 10 00876 g014
Figure 15. Streamwise turbulence intensity distribution at a yaw angle of 20° when λ = 4.1. (a) 0.5D; (b) 1D; (c) 2D; (d) 3D; (e) 5D; (f) 8D.
Machines 10 00876 g015
Table 1. The designed swept blades.
Blade No.Sweep DirectionSweep Starts (rs/R)Tip Offset (z/R)
1Backward0.20.1
2Backward0.20.2
3Backward0.40.1
4Backward0.40.2
5Forward0.20.1
6Forward0.20.2
7Forward0.40.1
8Forward0.40.2
Table 2. Performances of grid independency study (λ = 5).
Rotation Domain (Million)Stationary Domain (Million)CP
(%)
Coarse42761418.169
Middle78261418.186
Fine78297518.198
Table 3. Changes in power coefficients and thrust coefficients of the wind turbine with swept blades.
Blade No.Swept BladeΔCP (%)ΔCT (%)
1b20100.4970.384
2b2020−1.605−3.113
3b4010−0.113−1.998
4b4020−2.433−5.384
5f20102.1672.478
6f2020−1.481−3.064
7f40100.064−1.605
8f4020−1.998−4.675
Publisher’s Note: MDPI stays neutral with regard to jurisdictional claims in published maps and institutional affiliations.

