1. Introduction
The Internet, transportation networks, and interpersonal connections [
1] are all examples of networked systems, which are pervasive in both biological and societal contexts. Due to their complex structures, it can be challenging to analyze their dynamics. To address this issue, researchers have developed sophisticated network models to effectively represent these systems. Common simulation network models are the Erdős–Rényi (ER) network [
2], small-word (SW) network [
3], scale-free (SF) network [
4], random triangle (RT) network [
5], random rectangular (RR) network [
6] and q-snapback (QS) network [
7]. Most networks are presently reconfigured by rewiring strategies to form a larger network structure [
8].
Recently, network controllability robustness has become a focal topic in complex network studies. The concept of controllability refers to the capacity of a network to move from any initial state to any target state with an admissible control input within a finite duration of time, while network controllability robustness measures the ability of a network to maintain its controllability under attack or failure [
9].
The operating environment of such networks includes uncertainty and disturbances, which adds to the complexity of network systems. Complex networks are expected to be robust in the face of uncertainty, disruptions, and attacks, i.e., networks must be able to properly function even in the presence of attacks and errors. Network robustness under random or malicious attack serves as a benchmark for judging its normal operation under interference. Random attacks aim to randomly target nodes or links, while malicious attacks seek to identify and compromise the most critical components of the network [
10]. Single-objective optimization can be used to define complex network structures, and single-objective evolutionary algorithms can be employed to enhance the network robustness against node-based or link-based attacks. Previous studies utilized network robustness as the optimization objective, and a surrogate model was adopted to assist single-objective evolutionary algorithms in optimizing network robustness [
11].
Currently, numerous approaches are being employed to create networks with enhanced robustness. For example, the
method was used to optimize the complex network structure [
12]. The simulated annealing approach is employed to address the optimization problem of enhancing the network robustness [
13]. A memetic algorithm is employed to address the network structure seeking problem, incorporating evolutionary operators such as selection, crossover, and mutation, along with a local search process based on structural information, to obtain better optimization results [
14,
15]. In the study [
10], network robustness is enhanced by rewiring the topology.
Multi-objective evolutionary algorithms have been used to solve a variety of engineering and material science problems. In multi-objective controllability robustness optimization, robustness under node attack is negatively correlated with the robustness under link attack [
16]. In practical applications, computing the network robustness can be a time-consuming process. According to the literature [
17], it takes a long time to search for network architectures with better robustness when using multi-objective evolutionary algorithms to solve network robustness optimization problems. Surrogate models have been used by some researchers in recent years to replace the evaluation of network robustness in the optimization process.
Surrogate models can be either non-interpolating or interpolating. Non-interpolating models include, for example, polynomial regression [
18] models and support vector machines [
19]. Radial basis function (RBF) networks, least squares (LS) method, the inverse distance weighting (IDW) interpolation method [
11], and Kriging interpolation method (Kriging) [
20] are interpolating surrogate models. There is no clear criterion for determining how to select a good surrogate model for a complex network in order to evaluate its controllability robustness.
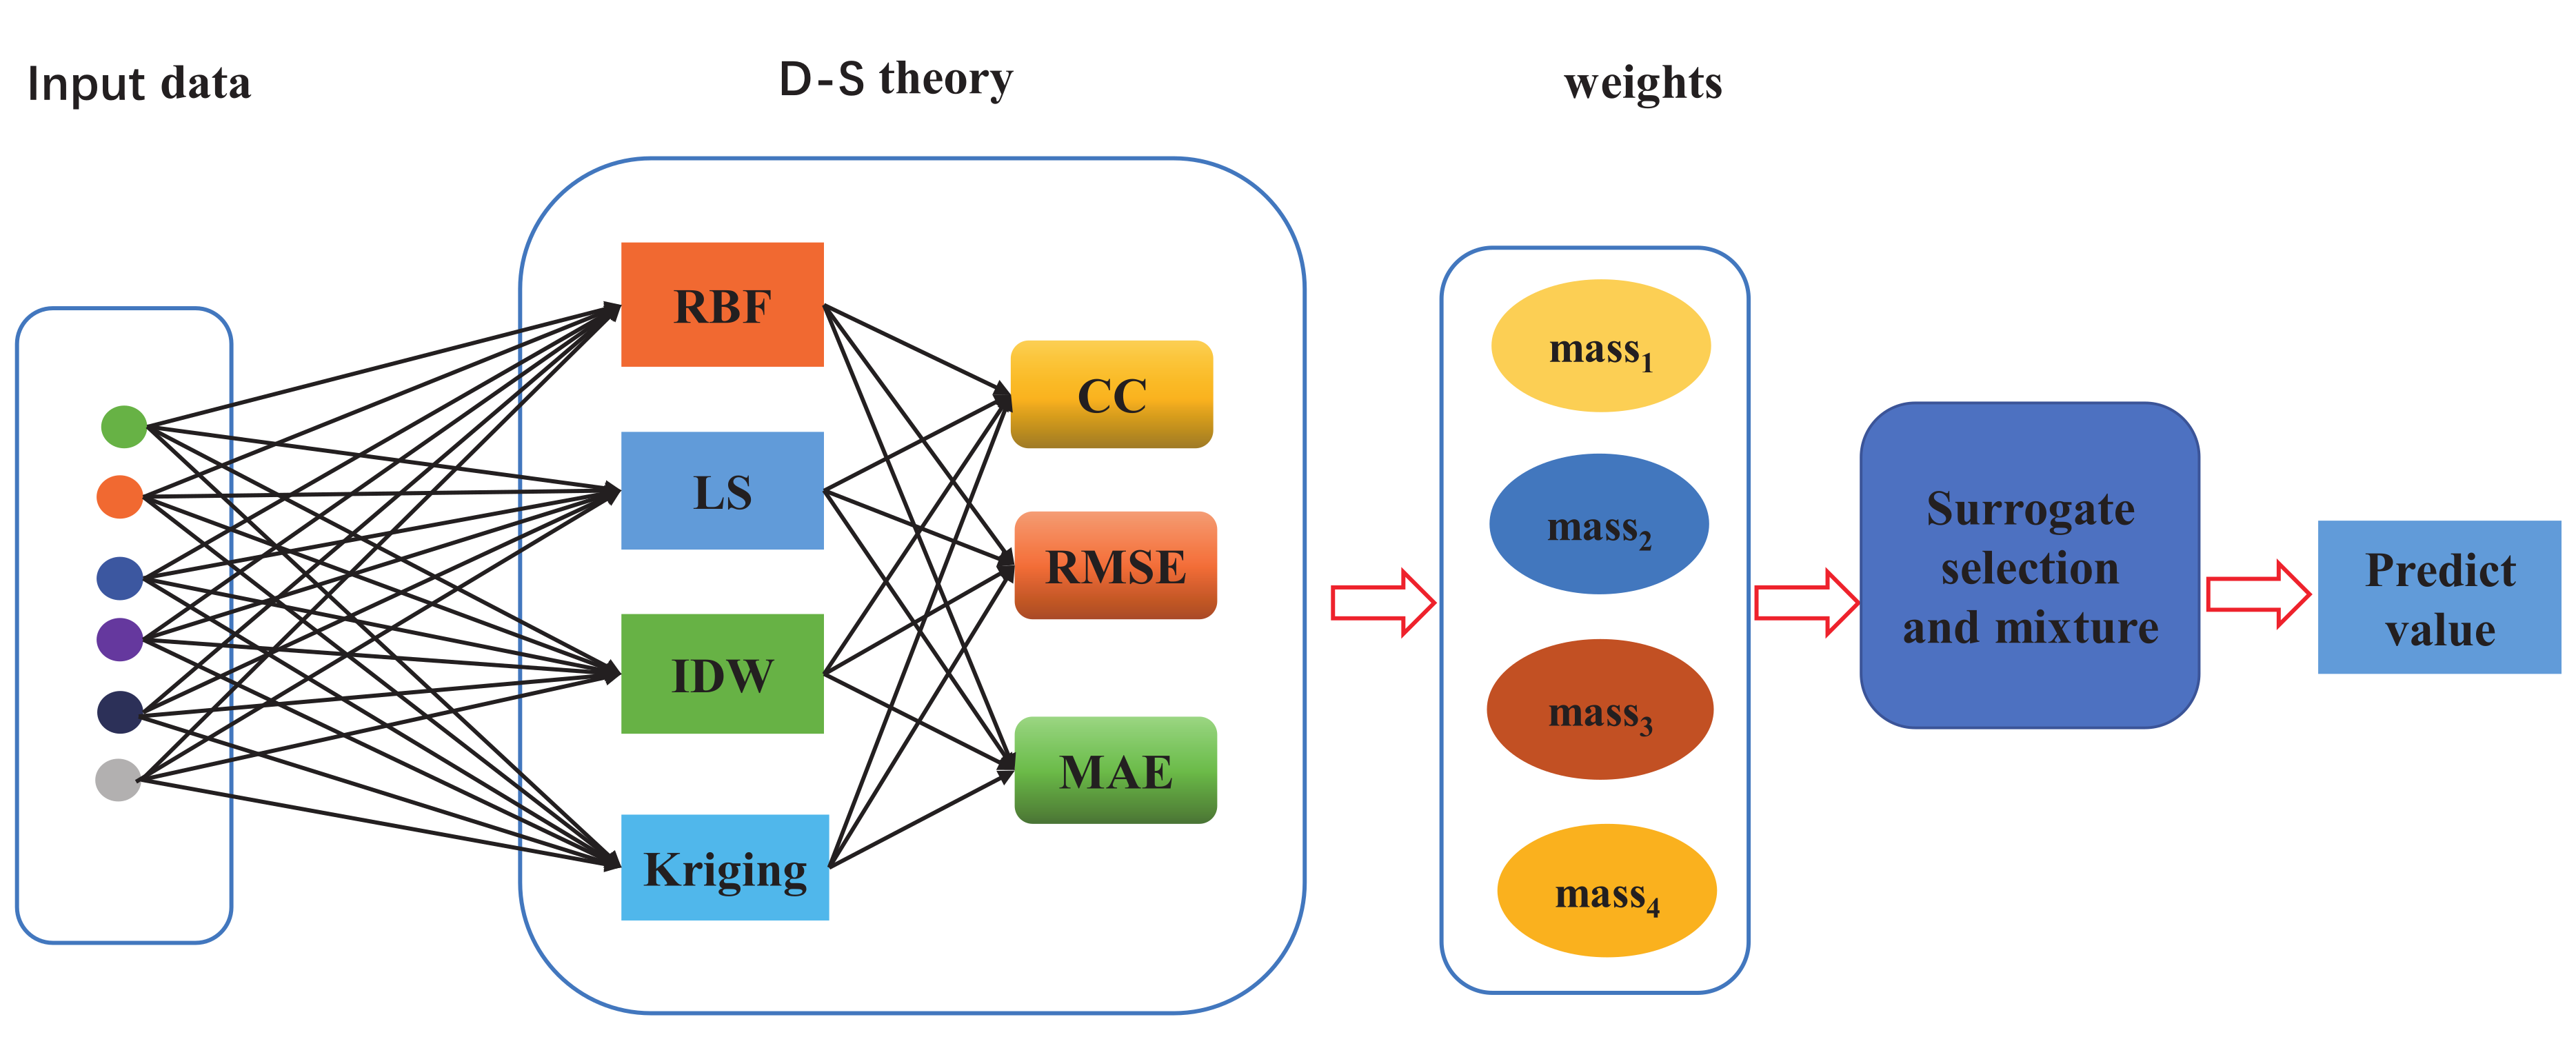
The Dempster–Shafer theory (D-S theory) [
21] is used to combine surrogate models. This theory was first introduced by Arthur P. Dempster [
22] in the context of statistical inference, and it has the ability to handle uncertain information. Subsequently, Glenn Shafer [
23] further quantitatively extended the theory to Bayesian inference methods, utilizing Bayesian conditional probabilities derived from probability theory and experimentally a priori known probabilities. The theory is a mathematical theory of evidence that allows for the mixture of information from various sources in order to construct a degree of belief. The theory permits the mixture of imprecise and uncertain information, which may even be contradictory. So-called basic probability assignments (BPAs) contain information about specific hypotheses (focal elements) and are combined to calculate the credibility of a given hypothesis. Three functions are usually associated with BPAs, namely the belief (Bel), plausibility (Pl) and pignistic probability (BetP) function.
In terms of surrogate model, the BPAs can be, for example, model characteristics such as correlation coefficients (CCs), root mean squared errors (RMSEs), and maximal absolute errors (MAEs). It is possible that one surrogate model has conflicting characteristics, i.e., good (e.g., high correlation coefficients), bad (e.g., high RMSE) characteristics, and bad (e.g., high MAE) characteristics. This conflict must be considered when calculating the belief that one has in the given model. Several conflict redistribution rules have been developed in the literature. Dempster’s combination rule redistributes the conflict among all focal elements, regardless of which elements cause the conflict.
The remainder of this paper is structured as follows:
Section 2 introduces the work relevant to this article.
Section 3 introduces the algorithm framework in detail.
Section 4 discusses the surrogate model selection and evaluation method. Experimental results are reported in
Section 5.
Section 6 discusses the advantages and limitations of this method.
Section 7 provides the conclusion and outlines future work.
2. Related Work
2.1. Network Controllability Robustness
For a network topology graph,
N nodes and
M links are recorded, and the adjacency matrix between networks is saved (with the link recorded as 1 and nodes as 0). When considering a network of many LTI systems, the node system with control input is called a driver node. The network controllability is quantitatively expressed by the density of driver nodes [
24]
in the network, which is calculated as follows:
where
is the number of driver nodes required in the network and
N is the total number of nodes in the network,
, when
means that the current network of
N nodes requires only one driver node, and the network has the best controllability;
means that all nodes in the current network are isolated, so each node requires a controller, and the network has the worst controllability.
The most common methods for calculating controllability are structural controllability [
25] and exact controllability [
26], where the network structure targeted by structural controllability is a directed graph, which is time-consuming and even impossible for large networks. The exact controllability adopted in this paper is applicable to all sparse networks, undirected graphs, and directed graphs. The required drive nodes are calculated as follows:
where
A is the network adjacency matrix, rank is used to calculate the rank of the matrix. If matrix
A is in full rank, then the
driver node is required; otherwise, the
driver nodes are required. Network controllability under node-based attack is defined as follows:
where
is the number of driver nodes required when
i nodes are attacked; and
is the number of remaining nodes in the network after
i nodes are attacked, which decreases one by one with each attack. Similarly, network controllability under link-based attack is defined as follows:
where
the number of driver nodes required when the link of
j is attacked;
N and
M denote the number of network nodes and links, respectively. Under link attack, the number of nodes remains constant while the number of links decreases one by one in a continuous link-based attack. Equations (3) and (4) define the dynamic process of controllability change under attack. The overall controllability robustness can be obtained by averaging controllability, and the equation is as follows:
a lower
R or
indicates better network controllability robustness [
27,
28,
29] under node-based or link-based attack. A similar approach used the connectivity robustness [
30,
31] metric.
2.2. Surrogate Models
If no previous experiment was conducted, determining the optimal surrogate model for various complex networks may require a large number of experiments. To simplify the process, multiple surrogate models can be used to optimize the selection. Different surrogate models can be selected to suit different complex networks, and it must be ensured that the results obtained using these models are close to the true values. With the development of surrogate modeling techniques, they have been widely applied to optimize single-objective and multi-objective problems.
When analyzing graphs, computation resources must be consumed. Methods that can efficiently parse the network have been emphasized, and a successful one is the use of representation learning, i.e., the structural deep network embedding (SDNE) [
32,
33]. SDNE focuses on obtaining the system’s latent representation while preserving its structural information. In general, the graph with the
connection matrix is transformed into
vectors (d tends to be smaller than
N here); By reducing the dimensionality while still retaining sufficient structural information, these vectors can accelerate the resolution of tasks involving networks.
In addition, heterogeneous input can foster diversity in integration, leading to the extraction of various features from the original data. The extracted features and the original data can be combined to form the training data of the surrogate model. To achieve this, principal component analysis (PCA) can be employed as it can effectively extract the major components with minimal computational cost. The second step is to cluster the embedded information using K-means clustering with the number of clusters set to twenty percent of
N. As demonstrated in [
34], the clustered embedded data, which contains essential connectivity information, is essential for interpreting information from networks. The original data obtained after applying SDNE for dimensionality reduction, as well as those obtained through PCA dimensionality reduction and those obtained after clustering are all used to train the surrogate model.
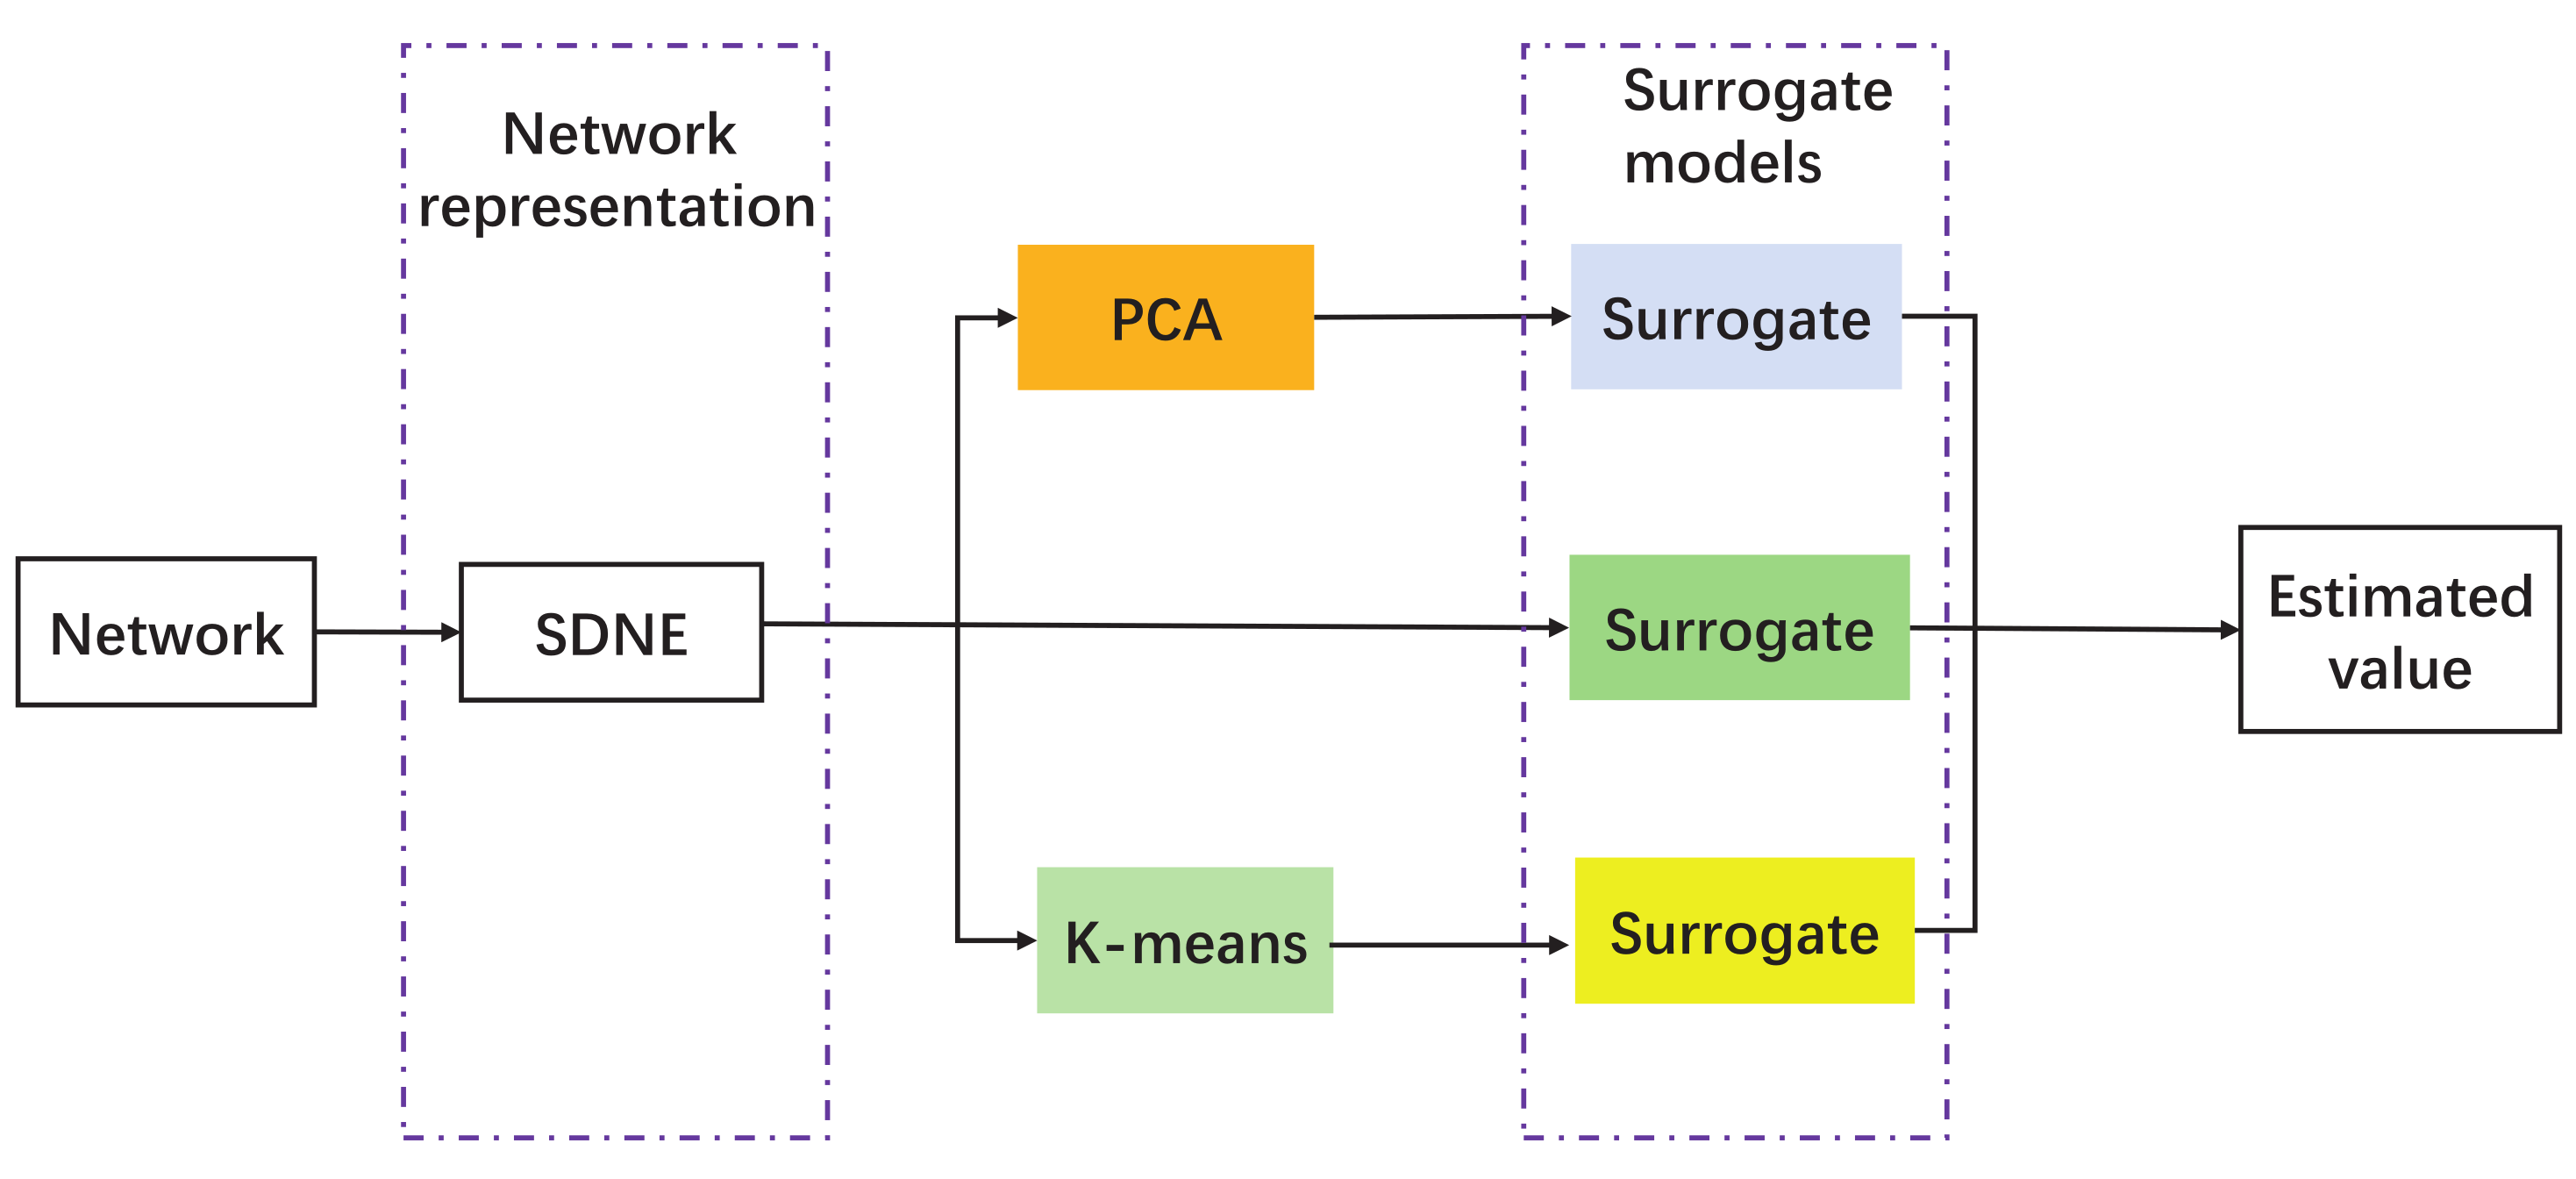
Given the network data, the robustness measures (
R and
) of the networks are evaluated first, and networks are recoded by SDNE to obtain their 2D representations. Subsequently, two feature extraction techniques, along with the original embedded graph, are used as the input for the surrogate. The surrogate is able to estimate the robustness values and the uncertainty of the estimates, as shown in
Figure 1. The surrogate can later be used to facilitate network robustness optimization.
The network robustness measure is first calculated from the given network structure, and then the network is dimensionally reduced using SDNE to obtain the two-dimensional data of the network, where i is the i-th network nodes. Following that, the original data as well as two feature extraction techniques are used as heterogeneous inputs for training the surrogate models. The following section outlines the surrogate models employed in this article.
2.2.1. Radial Basis Function (RBF) Networks
The use of radial basis functions (RBFs) is critical for this network, as it enables the creation of a symmetric radial basis function for every interpolation point in the function. These basis functions can then be combined linearly, providing an accurate approximation of the true objective value. The surrogate model can be represented as follows:
where
denotes the Euclidean norm,
is the weight coefficient,
is the radial basis function, the distance from the prediction point
to the training point c is the key in the basis function, and a coefficient will be trained before making predictions. The RBF can be taken as a global polynomial to fit the general trends in training data.
2.2.2. Least Square (LS) Method
Linear approximation can also be used to evaluate function values, We consider a linear model as follows:
where
is the vector of unknowns,
is the vector of observations,
is the noise, and
is the data matrix.
When and the columns of A are linearly independent, is the minimum multiplier loss function.
2.2.3. Inverse Distance Weighting (IDW) Interpolation Method
The inverse distance weighting interpolation method judges the similarity between each other by Euclidean distance, and the similarity is higher if the distance is closer. Therefore, the weight is judged according to the distance prediction value, and a small prediction value is instead heavily weighted, and vice versa. A surrogate model can be represented as follows:
where
are the values of the
i-th known point,
n is the number of known data points,
is the weight corresponding to the known point,
is the Euclidean distance between known and predicted points, and the weight is a function of the inverse of the distance.
is the attribute value corresponding to the
i-th known point.
2.2.4. Kriging Interpolation Method
Kriging is a method of spatially interpolating stochastic processes using a covariance function. It uses variables to create a function that provides an accurate, optimal estimate of unknown data. Kriging models consist of two components. The first part is a basic model that describes the data’s trend, while the second is stochastic and measures the discrepancy between the simple model and the actual function. This difference is modeled using the covariance function. A model
is built as a realization of a regression model and a random function
z in order to express the deterministic response
y for the input, and Kriging model can be represented as follows:
where
is the approximation function,
denotes the regression function, which is a polynomial in the independent variable
,
is the weight coefficient, and
n is the number of known points. The random process
z is assumed to have zero mean and a covariance that depends on an underlying correlation model, including parameters that must be optimized. Commonly used correlation functions are exponential, generalized exponential, Gaussian, spherical, or spline, and regression models can be selected as constant, linear, or quadratic.
2.3. New Contributions of the Proposed Algorithm
Focusing on the multi-objective network robustness optimization problem, this work addresses the issue of the high cost of evaluating controllability robustness, thereby improving the overall efficiency of the optimization process. Simulations on four types of synthetic networks, namely SF, ER, SW, and RR, were used to validate the effectiveness of the approach used in this paper. Specifically, the work and contributions of this paper are summarized as follows:
1. The D-S theory was used to calculate the weights of the four surrogate models, and then two or three of them with their corresponding weights were chosen for the optimization process. Compared to selecting three surrogate models, selecting two surrogate models resulted in improved controllability robustness in a shorter amount of time.
2. As the number of iterations increased, an adaptive updating surrogate model selection approach is necessary to attain an optimal solution. This approach offers superior results compared to previous methods, however, it necessitates enhanced optimization time. To achieve the best outcome without compromising on optimization time, an adaptive updating surrogate model selection approach is recommended.
3. Algorithm Framework
This paper focuses on the two-objective problem, and therefore the function of the two-objective problem is shown here. A multi-objective optimization problem (MOP) can be stated as follows: the formula of multi-objective optimization is shown in Equation (
11).
where
is the network space and
r is a network structure.
is a two-dimensional objective vector.
and
are the network controllability robustness under node attacks and link attacks.
Very often, since the objectives in (11) contradict each other, no point in maximizes all the objectives simultaneously. One has simply to balance them. The best trade-offs among the objectives can be defined in terms of Pareto optimality.
Let
, and
μ is said to dominate
if and only if
for every
and
for at least one index
. A point
is Pareto optimal to (11) if there is no point
such that
dominates
.
is then called a Pareto optimal (objective) vector. In other words, any improvement in a Pareto optimal point in one objective must lead to deterioration in at least one other objective. The set of all Pareto optimal points is called the Pareto set (PS) and the set of all the Pareto optimal objective vectors is the Pareto front (PF) [
35].
The optimization steps of the algorithm are as follows: (1) Initialize the network structure; (2) Individuals’ controllability robustness is computed in terms of the population; (3) The network in the population and the associated robustness value is used as training data to build the surrogate model; (4) During the subsequent crossover, mutation, and selection evolution, the trained surrogate model is used to estimate the robustness measure; (5) Update the surrogate model; and (6) Update the non-dominate solutions. The pseudocode of the multi-objective optimization Algorithm 1:
| Algorithm 1: Multi-objective evolutionary algorithm optimization. | | |
| Input: | | |
| Initialize network population P; | | |
| Iterations t = 0; | | |
| Max iterations MaxGen; | | |
| output: | |
| The non-dominated solution set and network structure; | | |
| Calculate the network controllability robustness and initialize the surrogate model; | | |
| While t < MaxGen: | | |
| Conduct the crossover operator on to generate ; | | |
| Conduct the mutation operator on ; | | |
| Select better individuals from and to ; | | |
| Conduct the local search operator on ; | | |
| Update the surrogate model; |
| Update EP with ; | | |
| t = t + 1; | | |
| end while | | |
The crossover operator selects two networks from the population, and then randomly selects an edge from each network structure, and exchanges them with each other.
In the mutation operation, the topological rewiring operator seeks to modify the network’s connections without changing its degree of distribution. That is, two edges are randomly selected, namely and in the network, and and are added first, then and are deleted (i, j, k, and l represent four nodes, and e represents the connection between nodes).
At the end of a generation, the selection operator is used to select the best candidates from the population of parent candidates and update them into the child population with the initial population of candidates. The best candidate is then saved as the first one in the child population.
The local search operator seeks to improve the quality of the obtained solutions without relying on surrogates, a time-consuming but essential process for enhancing the R or of the individuals.
5. Experimental Results
In this paper, the network structure is constructed through a multi-objective evolutionary algorithm under node attack and link attack. Selecting appropriate surrogate models under D-S theory to replace the calculation of network controllability robustness in the optimization process can not only reduce the optimization cost, but also obtain a network structure with better controllability robustness. In the experiments, the nodes of SF, ER, SW, and RR are all 200, whilst the average degree is 4; the population size is 20, the number of iterations is 100, the crossover rate is 0.6, the mutation rate is 0.5, the number of topological rewiring is 50, the update rate of the surrogate model is 0.4, local_search rate is 0.7, and the output dimension of SDNE as two. It is important to note that, if the update_rate is too large, it will be time-consuming to update the surrogate model; however, if the update_rate is too small, it will not achieve the update effect [
12].
5.1. Experimental Results of Single Selection and Mixture Weighted Surrogate Models
In this paper, we choose the same multi-objective evolutionary algorithm framework and compare different surrogate model mixtures. One surrogate model (
), two surrogate models (
), and three surrogate models (
) are compared with two existing algorithms
and
in [
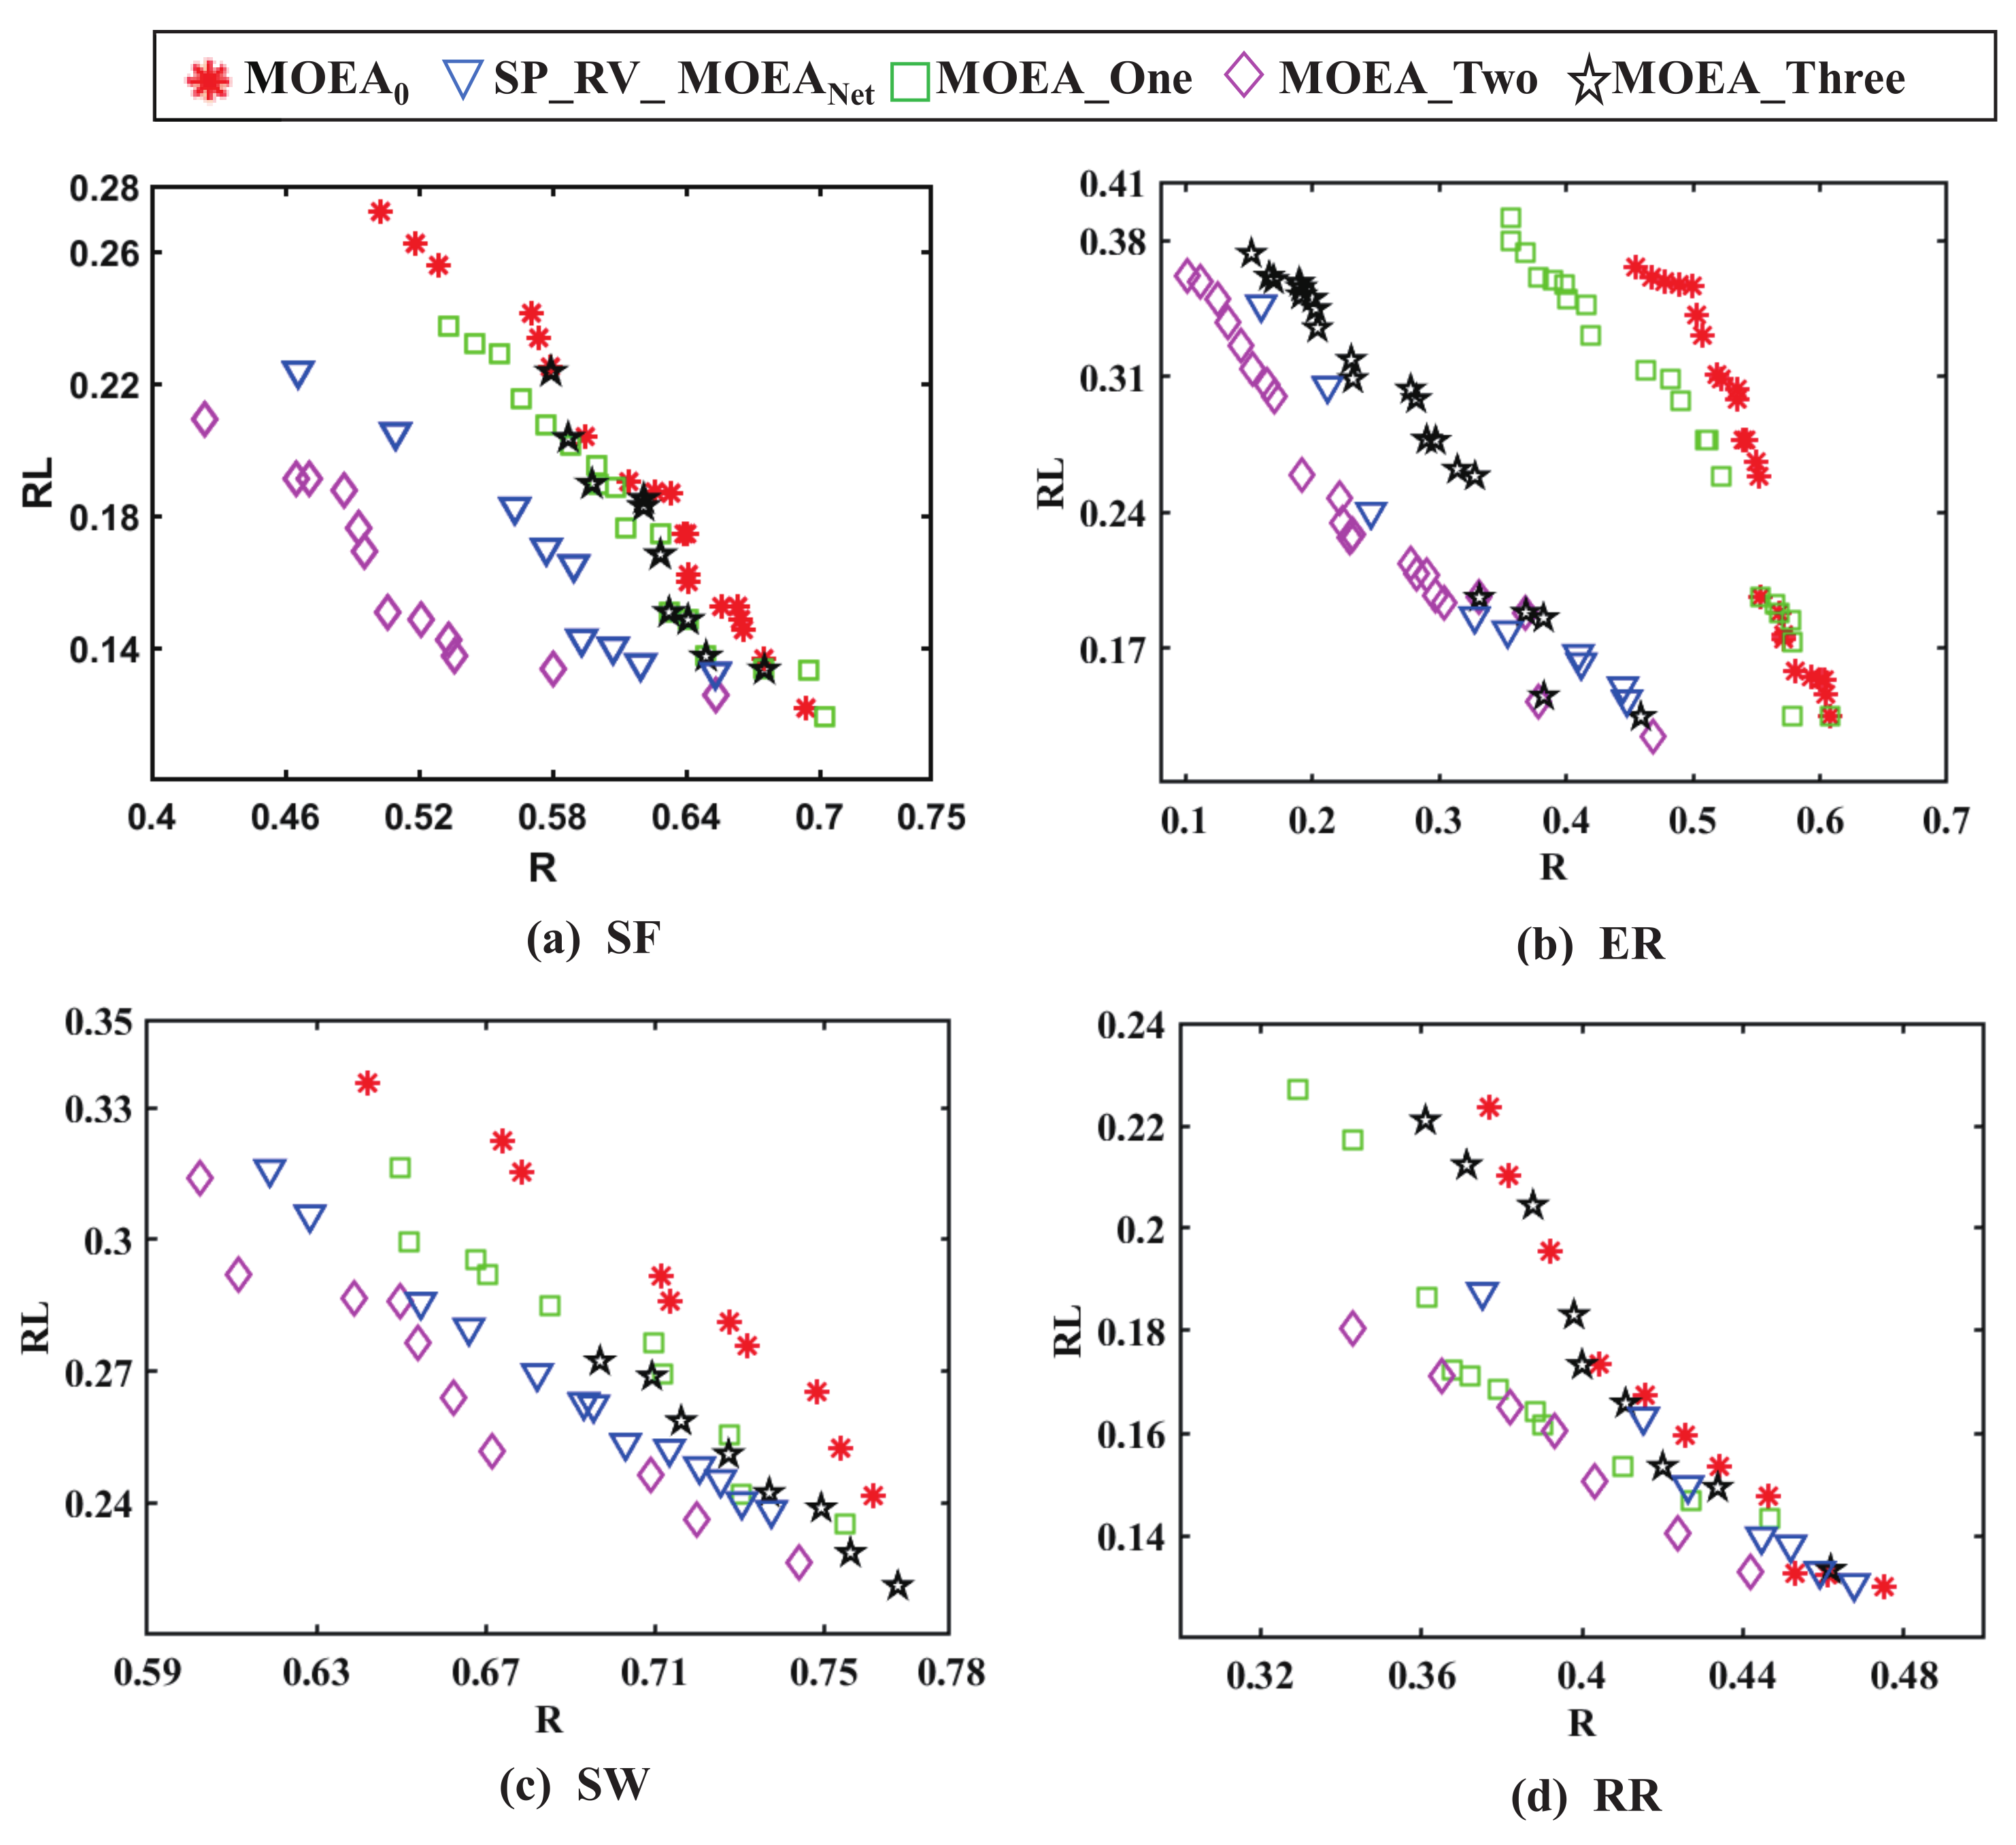
12] on four synthetic networks. For the different methods, the non-dominated solutions obtained by multi-objective optimization are shown in
Figure 3, and the running time is shown in
Table 5.
Figure 3 shows that the results obtained by
are less satisfactory on four types of networks. The performance of the existing algorithm
is clearly much better than
. Under the methods designed in this paper,
,
, and
also have a better performance than
. Preliminarily, this shows that the non-dominated solutions obtained after adding the surrogate model in the optimization process under the same algorithmic framework are better than those of
. The performance of
is second only to
in SF, ER, and SW networks, but in RR, the performance of
is only better than
. However, in terms of computational cost,
is too time-consuming, and several other methods consume much less computational time than
, as shown in
Table 5. The
method under D-S theory outperforms several other tested methods and achieves a good balance between search and diversity. It can be seen from
Table 5 that the more surrogate models there are, the more time-consuming the method is.
Among the five methods used in this paper, the
method is better than the other four methods. On the one hand, the surrogate model can be used as a low-cost fitness function evaluator to guide the optimization process, and more candidate solutions can be generated. On the other hand, the uncertainty information obtained by the surrogate model provides additional criteria for selecting individuals. The results in both
Figure 3 and
Table 5 validate the significant performance of
in designing robustness networks against multiple attacks, and the method can handle different types of synthetic networks. The bold data in
Table 5 are the optimal values obtained under the method.
The non-dominated solutions obtained by several methods in
Figure 3 are better when evaluating the controllability robustness, which means that the smaller the non-dominated solutions, the better it is.
Hypervolume (HV) values are used to evaluate the performances of various approaches [
12,
37]. This estimates the volume of the region in the target space contained by the set of produced non-dominated solutions and the reference points. The higher the HV values are, the better the comprehensive performance of the algorithm is. The HV values are calculated as shown in Equation (
17) as follows:
among
, it is a Lebesgue measure that is used to calculate the volume.
represents the hypervolume formed by the reference point and the
ith non-dominated solution in the solution set, and
S represents the number of non-dominated solutions.
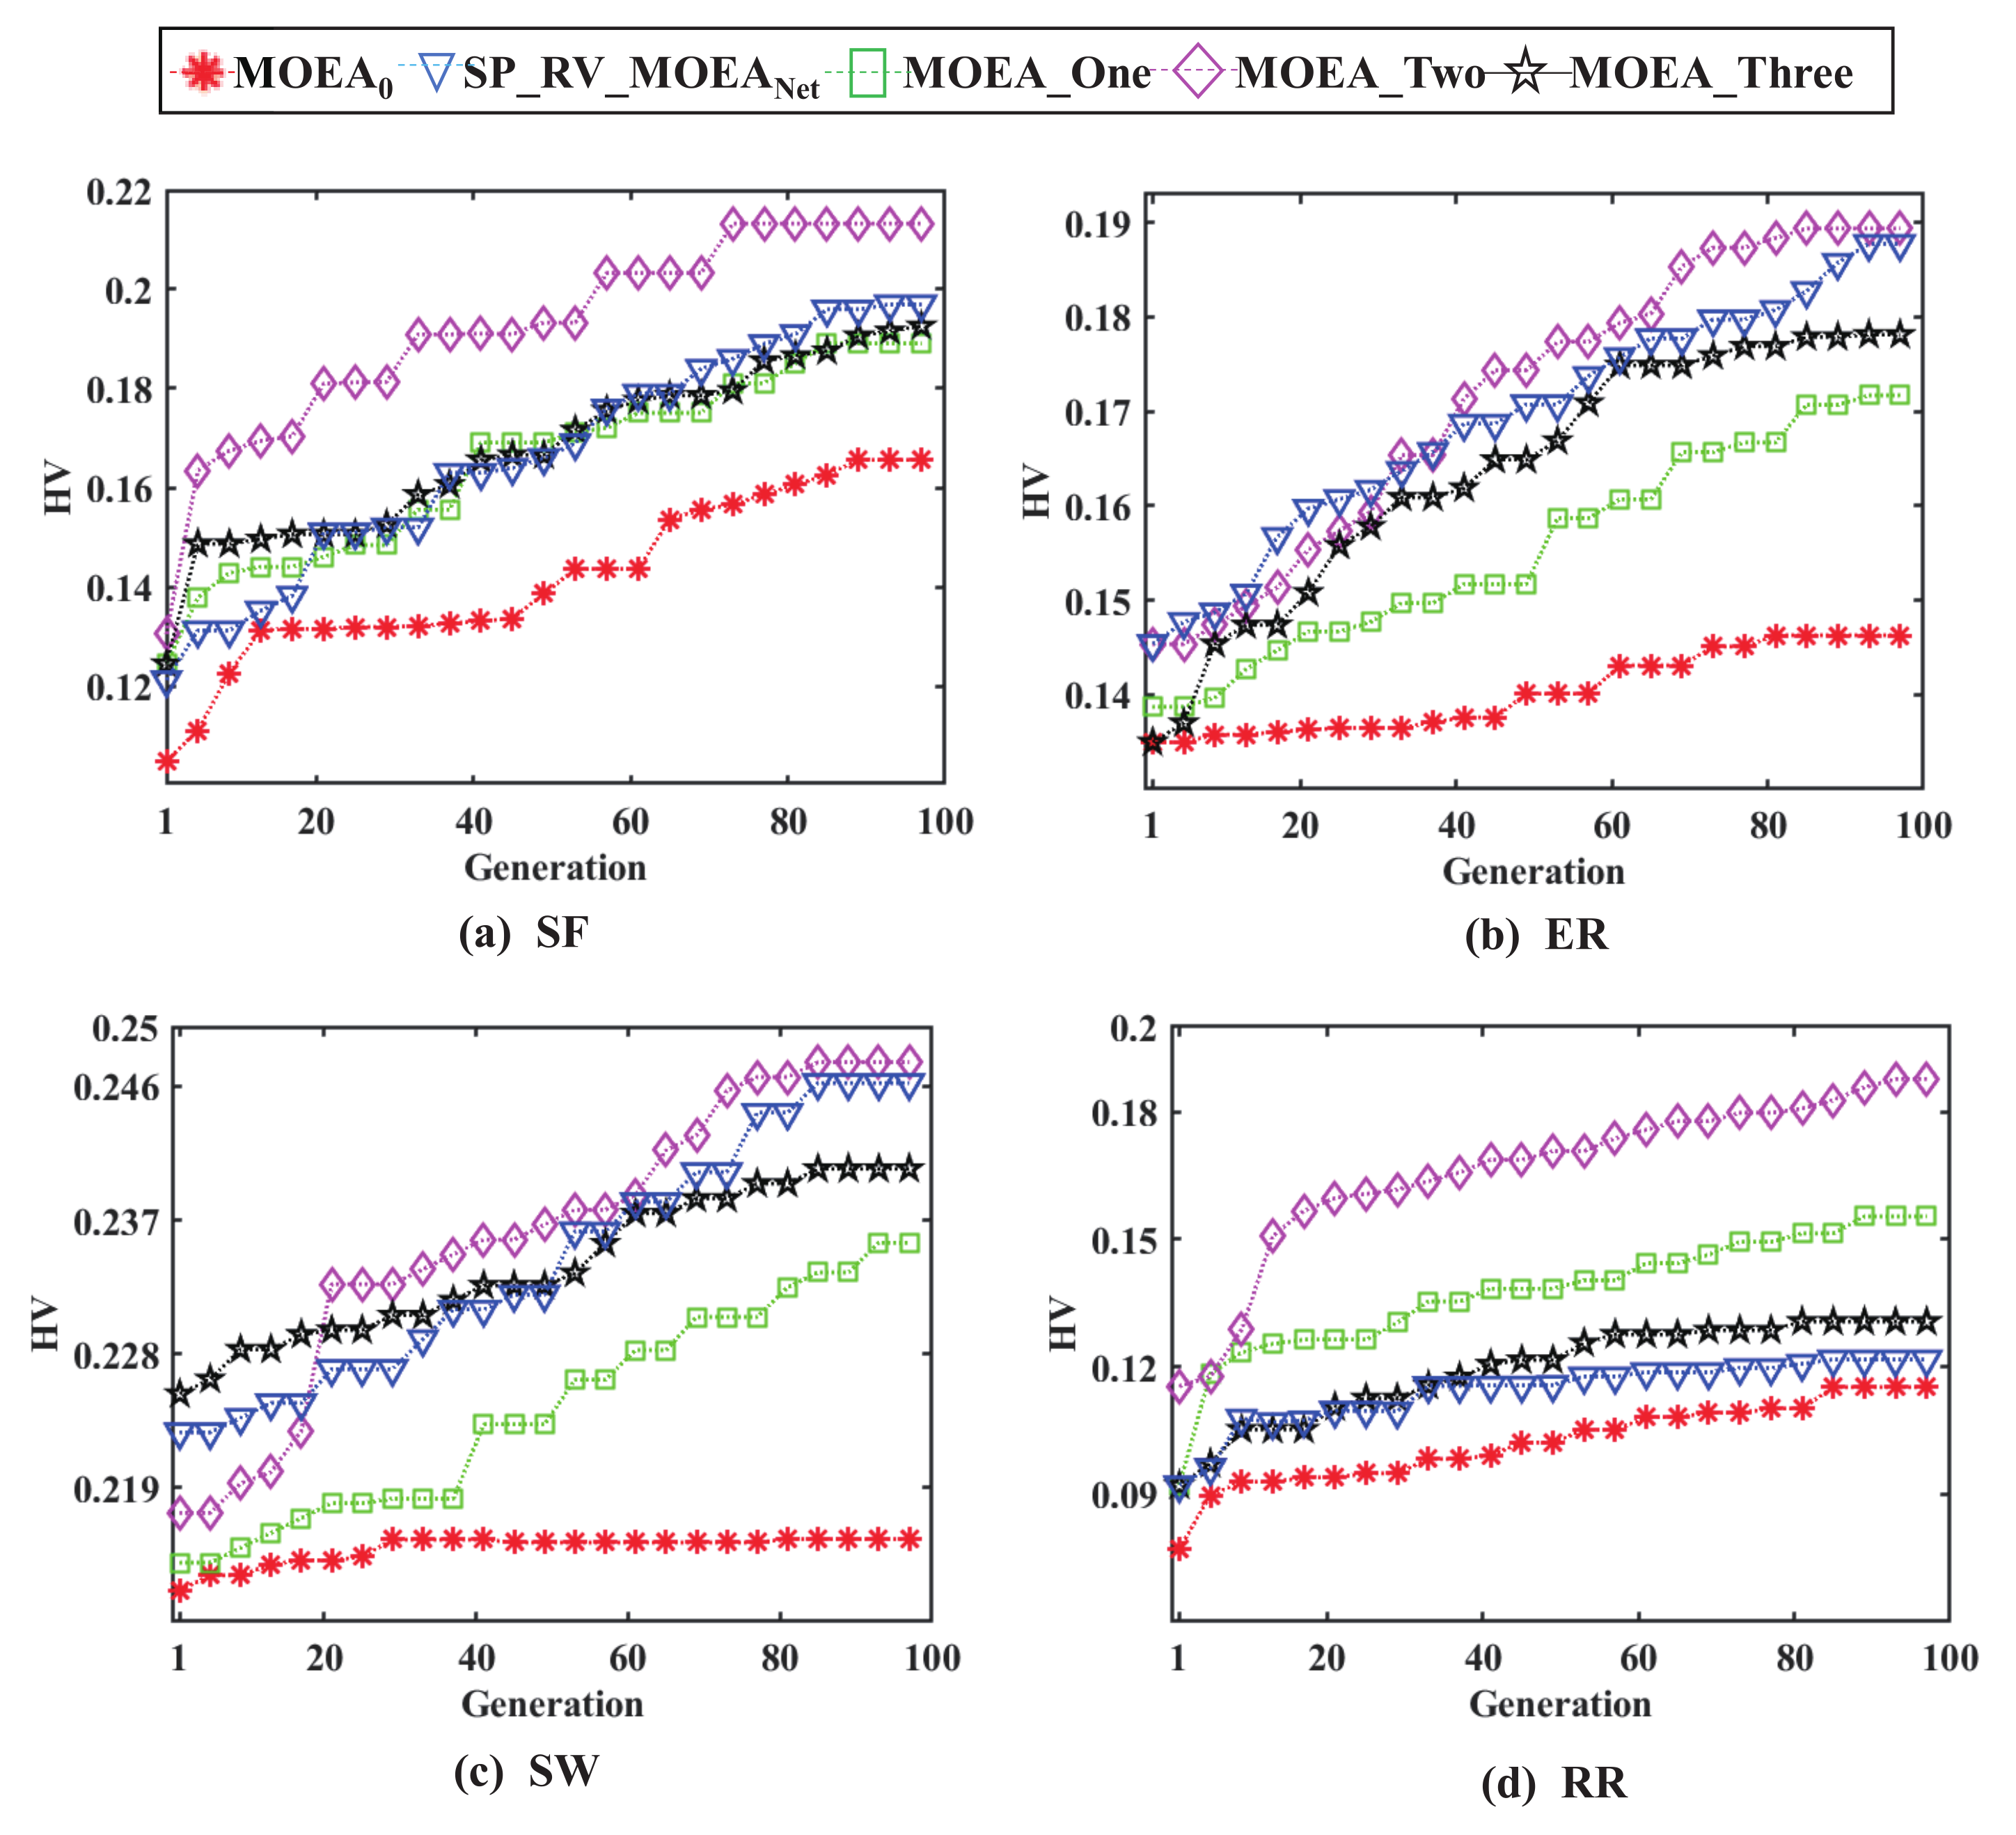
The variation in HV values with the number of iterations for the five compared methods is given in
Figure 4. For
, the HV values of the obtained results are significantly smaller than those of the other methods. The HV values curve of
is above the other curves, and its result is the best.
Table 6 depicts the average HV values for different methods for each complex network.
According to the experimental results, with the increase in surrogate models, the training time of surrogate models also increases. The shortest running time and highest average HV values were observed when IDW and RBF were used as a mixture of surrogate models for three complex networks. This is likely due to the different network architectures and the different weights allocated to each network.
In summary, for SF, ER, SW, and RR networks with an average degree of four at 200 nodes, IDW and RBF are selected as mixture surrogate models to obtain the best optimization results. For the RR network specifically, IDW and Kriging are selected as the mixture surrogate models, yielding better optimization results than the other networks.
The HV values is used to determine the performance of multi-objective optimization, and the larger the HV values, the better the performance of the method. From
Figure 4, it can be seen that the performance of
is better, as the HV curve of
ultimately remains above other methods.
5.2. Experimental Results of Adaptively Updating Surrogate Models
The experimental results in the preceding section show that the network controllability robustness obtained by
assisted by the multi-objective evolutionary algorithm on SF, SW, ER, and RR are relatively better. Therefore, during the adaptive updating process, the number of surrogate models is set to two. The experiments in this section compare the controllability robustness of
with that of
.
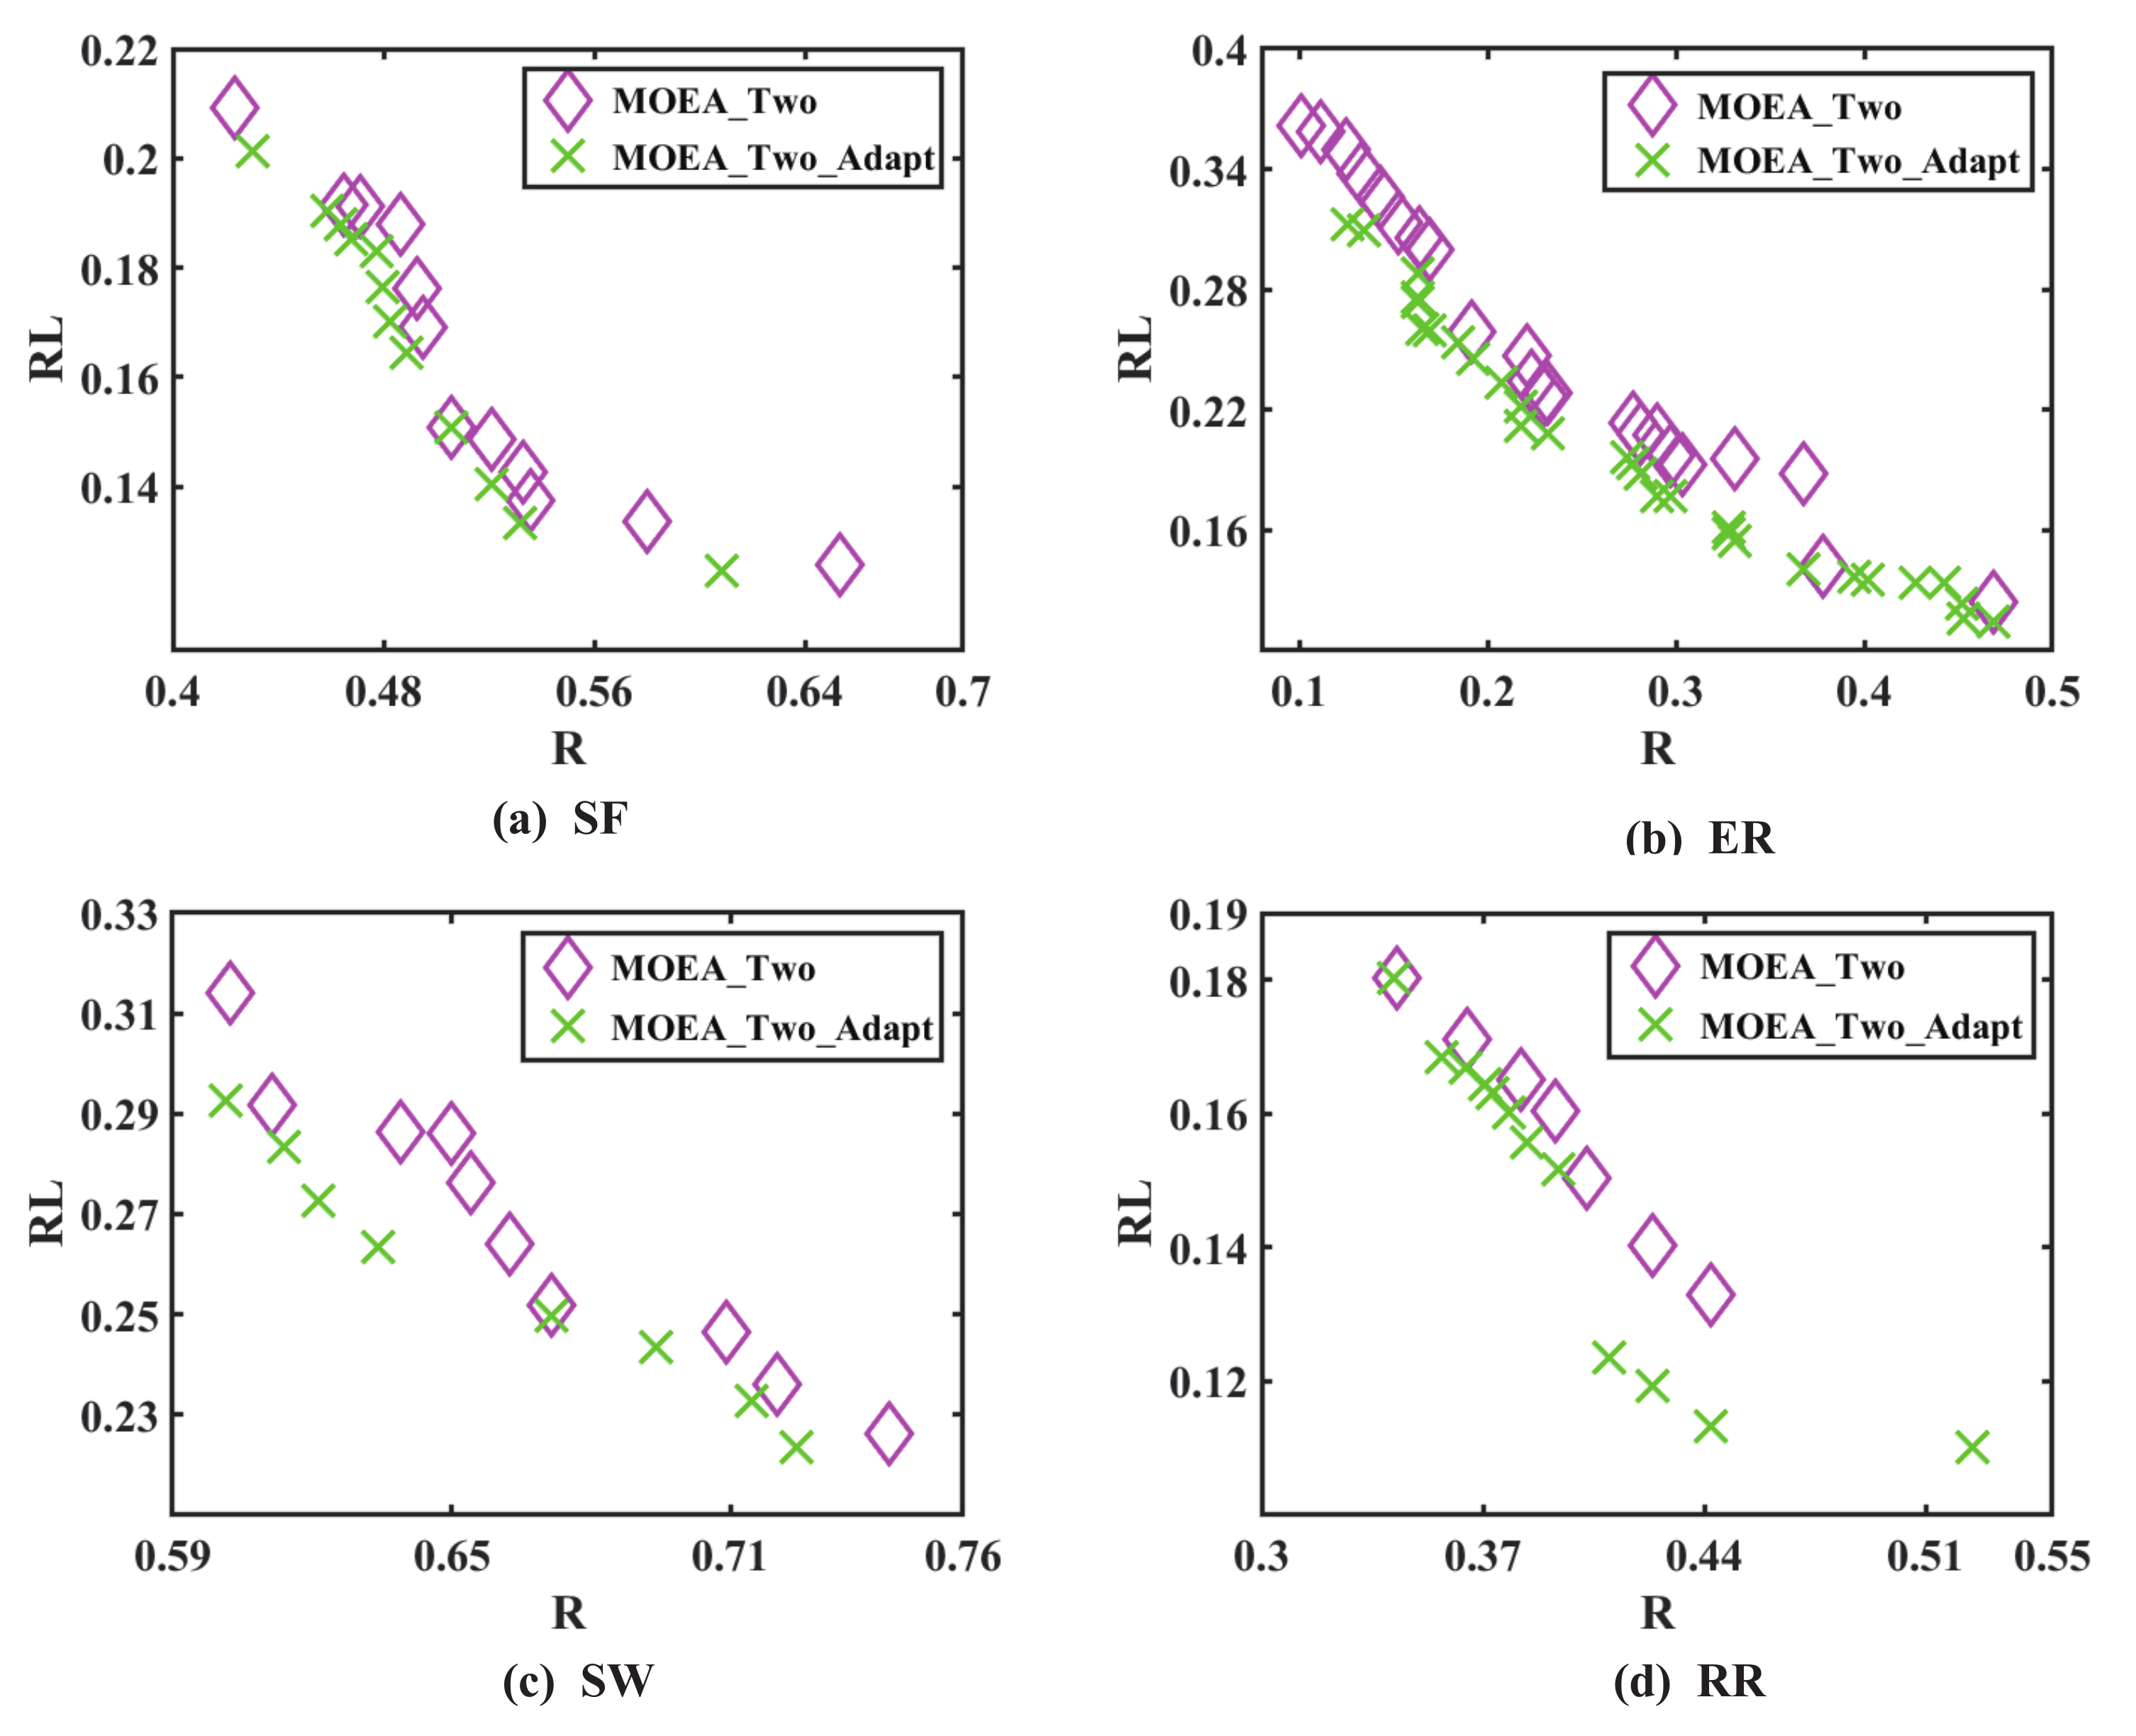
Figure 5 depicts the non-dominated solutions obtained on four types of complex networks, and
Table 4 shows the time consumption and average HV values of the two methods.
in
Figure 5 represents the network controllability robustness sought by two surrogate models assisted by the multi-objective evolutionary algorithm, whereas
represents the network controllability robustness sought by the adaptively updating surrogate model assisted by the multi-objective evolutionary algorithm. As shown in
Figure 5, the
can assist the evolutionary algorithm in finding the network structure with the best controllability robustness.
The minimum time consumption and maximum HV values in
Table 6 are shown in bolded to compare the time under the two approaches in the four types of networks, and reveals that the
takes three times longer than the
, whilst the former has a better average HV values. If time-consuming situation is ignored, the
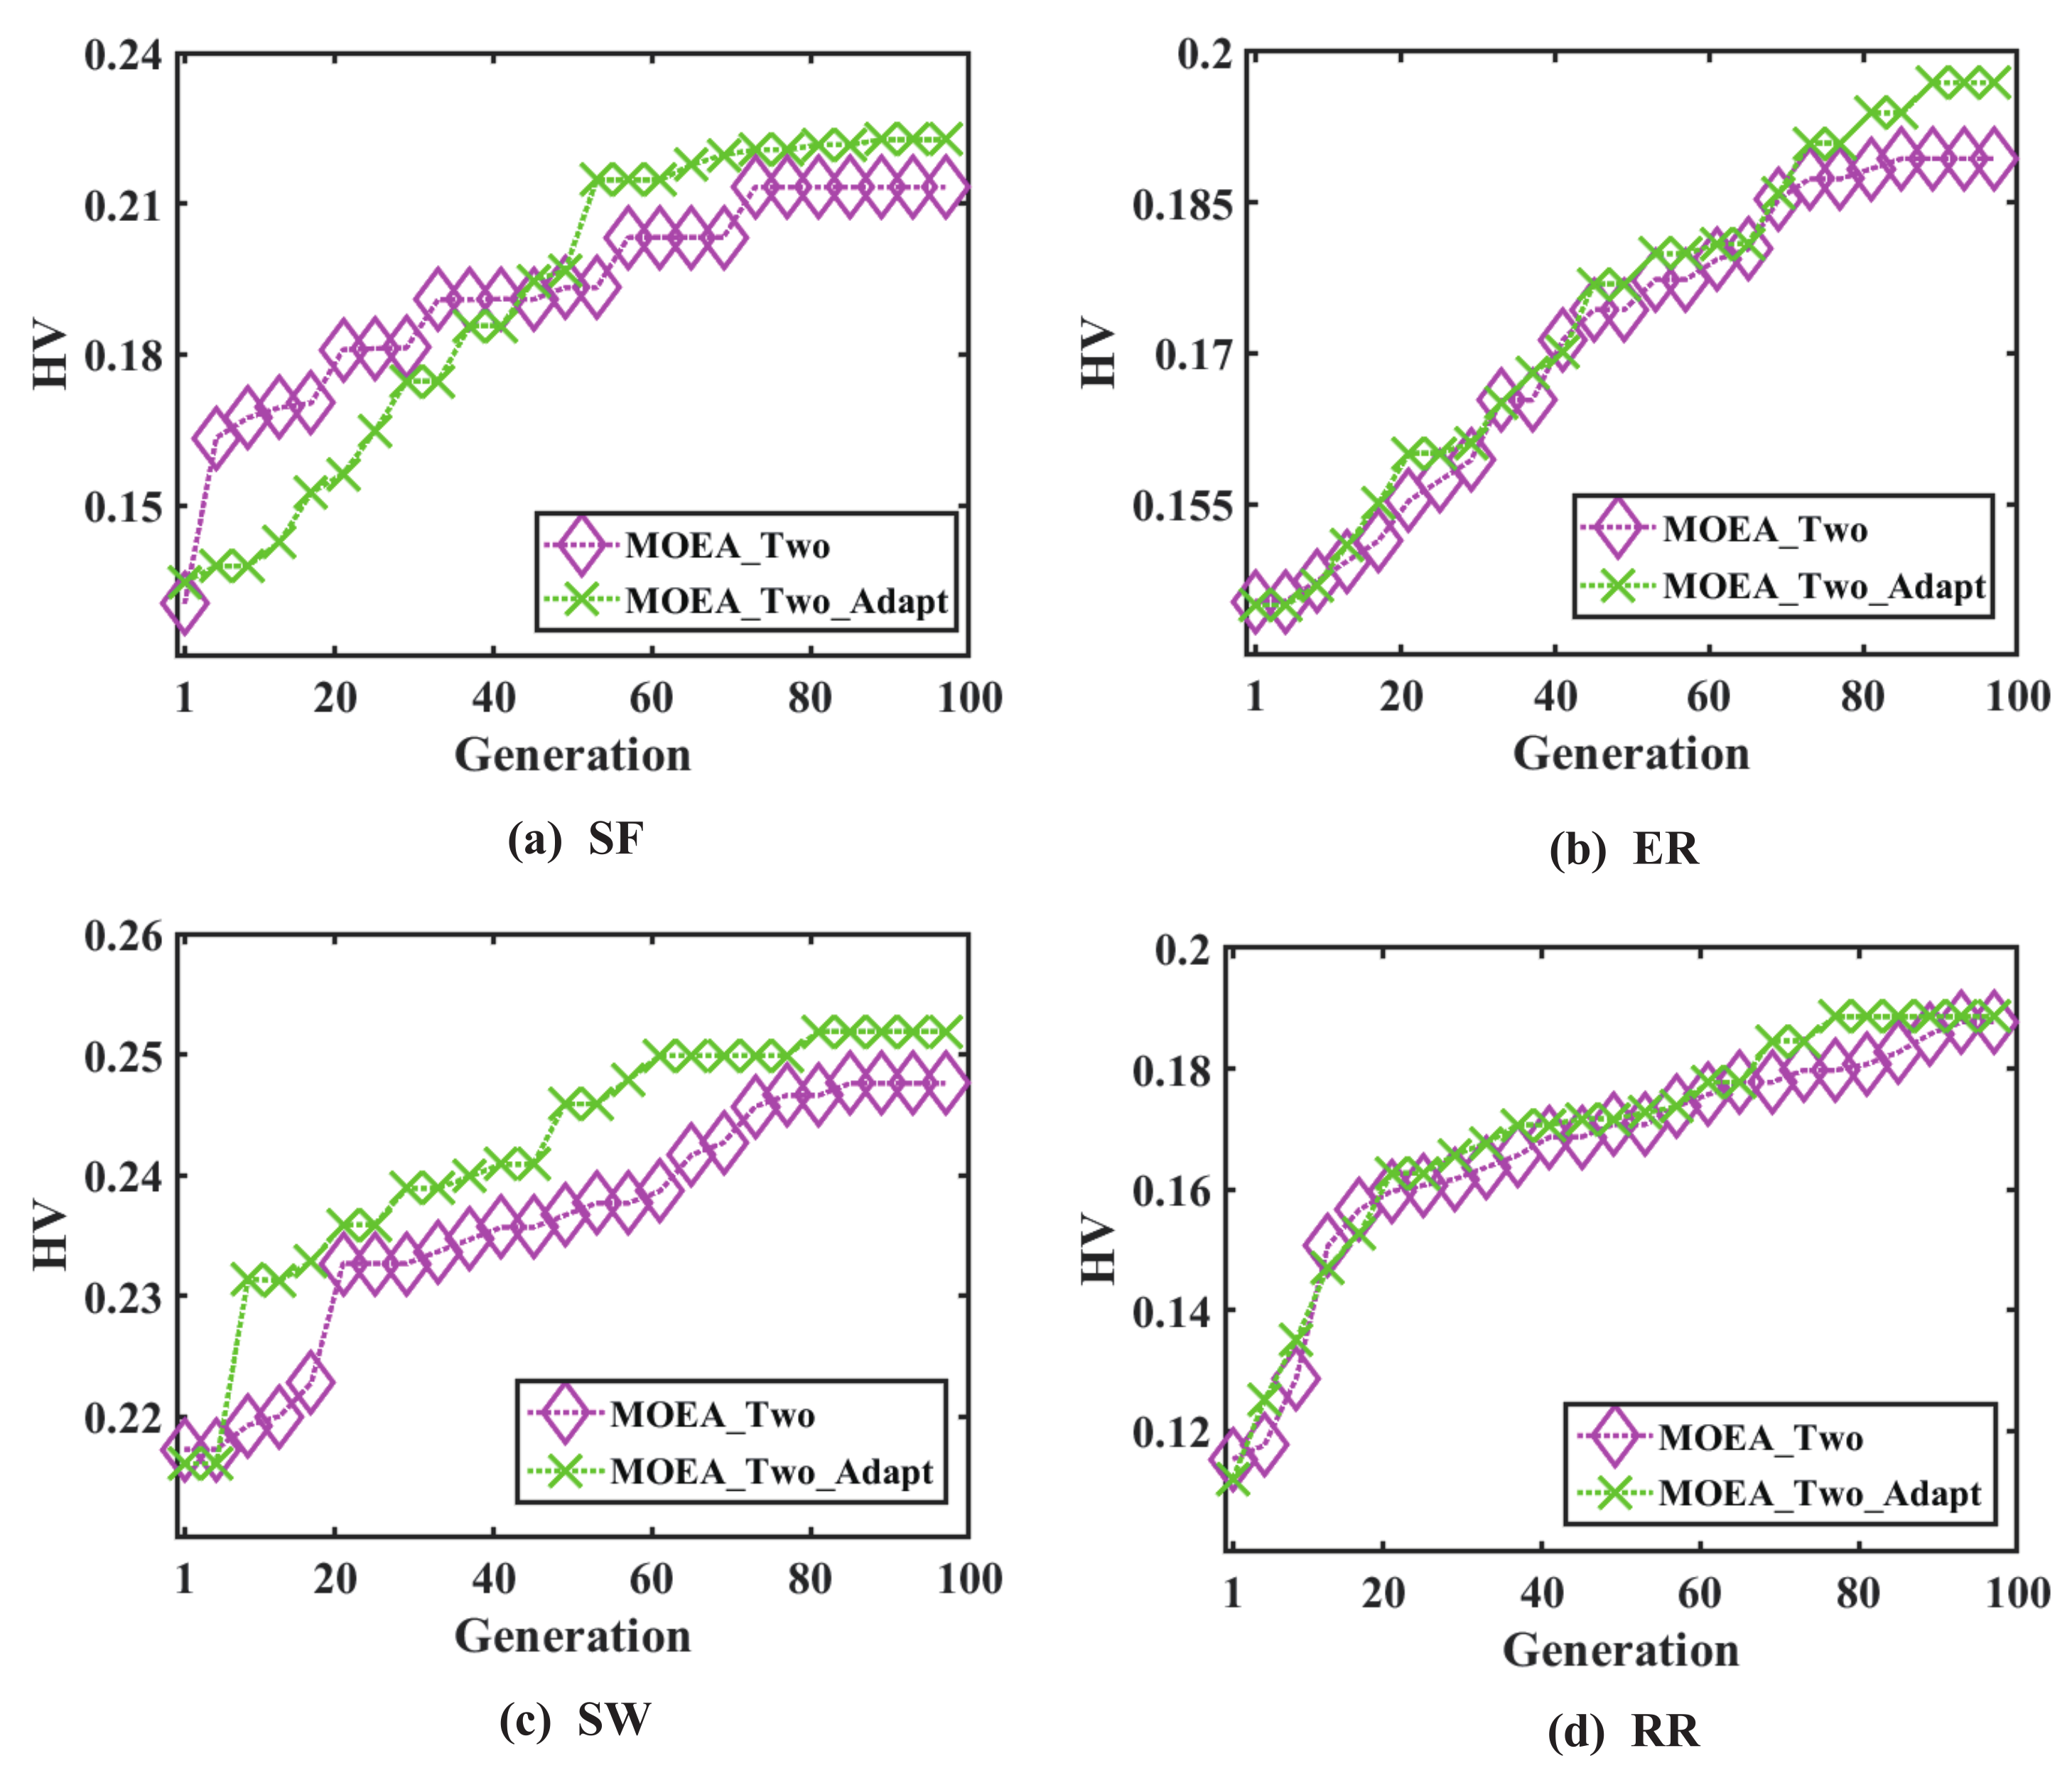
can help the evolutionary algorithm find a network structure with improved controllability robustness. HV values curves for
and
are shown in
Figure 6. HV values curves are better at the top of the curve, and
Figure 6 clearly shows that the
assists the evolutionary algorithm in its drive to achieve greater network controllability robustness.
Here, the optimal non-dominated solutions obtained from the previous is compared with adaptively updating. Similarly, when evaluating the controllability robustness, the smaller the non-dominated solutions, the better it is.
In comparison with the two surrogate models, the adaptive update surrogate model can achieve superior non-dominated solutions while consuming only about three times the computing power.
Here, we compare the previously obtained
method’s HV curve with the adaptively updating method. Similarly, when evaluating the performance of the method, the higher the HV value, the better it is. From the
Figure 6, it can be seen that the adaptively updating method ultimately remains above the other HV curve.
6. Discussions
The method used in this paper is verified on SF, ER, SW, and RR networks. The results of the
under D-S theory, such as non-dominated solutions, HV values, and optimization time, are better than those obtained by the existing method [
12]. The
is better than the
, but the optimization time is three-fold better. Under degree-based node and betweenness-based link attacks, the method in this paper can optimize the network structure with stronger controllability robustness.
In order to further reduce the computational cost and enable the application of multi-objective controllability robustness to large-scale networks, this paper introduces a surrogate model to approximate the controllability robustness in complex networks. Through extensive experiments on large-scale networks with up to 200 nodes and an average degree of four, the accuracy and efficiency of the proposed surrogate model were demonstrated. Next, the can expand to optimize the network structure of the controllability robustness of large-scale complex networks.
The obtained network structure can be applied to the producer community. At present, blockchain technology is widely utilized to manage the energy exchange between consumers. The continuous practices of blockchain and distributed ledger technology (DLT) are studied in order to optimize a blockchain network for the purpose of system and construction design in the field of continuous energy delivery. By doing so, it can improve the efficiency of energy transaction and reduce the cost of energy delivery [
38]. A framework was developed to facilitate both practitioners and researchers creating blockchain networks that are efficiently designed, reproducible, and dependable [
39]. If the multi-objective optimization method used in this paper is applied to the design of the blockchain network, this network can enhance the controllability robustness of the network and normally complete its own work when externally damaged. In addition to the above environment, the method of network structure constructed in this paper can also be applied to the aviation network. When a base station is damaged in the aviation network [
12], the whole line will stop. If a network structure that can simultaneously resist multiple attacks is designed, the probability of the network structure being damaged causing paralysis is small. In addition, an important evolution was discovered in the article, as, besides the human network, the network of things is becoming increasingly common. Therefore, there is increasing research on the Internet of Things and various IoT scenarios. This article is the first attempt to investigate abnormal situations in multiple Internet of Things (MIoT) scenarios. In the IoT context, especially in areas such as anomaly detection and attack recognition, network robustness is also taken into account [
40].
Convolutional neural network (CNN), a powerful deep learning model for tasks such as image and speech processing, has also been applied to complex network analysis in recent years, particularly for predicting the robustness of complex networks [
30,
31]. In general, predicting the robustness of complex networks requires the consideration of the following factors: (1) the network topology structure is an important factor that affects the robustness of complex networks. CNNs can predict the robustness of networks by learning the topological structure characteristics of the network. (2) Another important factor that affects the robustness of complex networks is node attributes. CNN can predict the robustness of networks by learning the node attribute characteristics.
7. Conclusions and Future Work
This paper proposes a network design approach focusing on better robustness, allowing the network to remain operational even after nodes and links are attacked simultaneously. As the computational cost of multi-objective robustness optimization is excessively high, surrogate models are used to replace the robustness calculation in the optimization process. This paper further explores the selection of surrogate models, including the mixture between a surrogate model based on the D-S theory and adaptive surrogate models.
In the experiment, five methods were compared in the network. From the experimental results, on the one hand, the HV value of SF was 0.1929, taking 58.65 h; the HV value of ER was 0.1721, taking 72.34 h; the HV value of SW was 0.1721, taking 36.54 h; and the HV value of RR was 0.1671, taking 45.57 h. methods from HV value, non-dominated solutions, and time consuming situation can help the evolutionary algorithm obtain a network structure with better controllability robustness. In SF, ER, and SW networks, the selected surrogate models are RBF and IDW. In RR networks, the selected surrogate models are IDW and Kriging.
On the other hand, the non-dominated solutions obtained under the are compared with the solution set obtained under the during the optimization process. Under the , the HV value of SF was 0.1939, the HV value of ER was 0.1766, the HV value of SW was 0.2439, and the HV value of RR was 0.1765. These HV values and non-dominated solutions are better than those of . As such, a network structure with better controllability robustness can be obtained under . However, from the perspective of time consumption, the optimization time is approximately three-fold that of .
This paper optimizes the network structure under the multi-objective controllability robustness of small-scale complex networks. In future work, this method can be used to optimize large-scale networks and connectivity robustness. This paper used different methods under the same algorithm framework for comparison. Next, we will study the comparison between different metaheuristics algorithm frameworks.


