1. Introduction
Analytical purposes about demographics, financial, industry and labor market statistics indicators, among others, are commonly accumulated over time and represent a significant part of the decision-making process. Furthermore, the analysis of historical information [
1,
2,
3] makes it possible to use the collected information to issue early warnings on the current and future measurement of indicators (variables).
For governments, a key aspect that must end poverty is sustainable development, through which better health conditions are created and prosperity is fostered, in addition to considering improvements in education and social conditions. Sustainable development is found in the main goals and policies of societies all over the world [
4]. On the other hand, many organizations have been recording the fulfillment of their goals, objectives and performance indicators for decades.
A common aspect of the historical analysis of variables (indicators) is that it is necessary to classify these indicators into categories, geographical regions or topics in order to achieve an optimal composition of each group. Because of the individual characteristics and based on the membership of the determined group, it could place each indicator in more than one category, which means that there is uncertainty in class membership.
Due to a lack of comprehensive measures in some time series, making comparisons in terms of multiple variables (indicators) is a complex task, as is the case with most country statistics. This, in some cases, causes summaries of the information to be made and composite measures to be constructed, for which reason a frequent problem for the analyst is the selection of an adequate weighting for each of the considered indicators [
5,
6]. The ideal objective is for individuals to assign weights according to their preferences and based on experience, though in most cases it is not possible because there is not enough information available [
7].
Thus, our motivation comes from the need for a computational intelligence model for handling uncertainty in decision making, through comparisons in terms of nested fuzzy classification of multiple variables (indicators) instead a typical model of Multi-Criteria Decision Making (MCDM), with the common understanding that it evaluates the criteria using an aggregation method function which returns a binary output; no preference is represented by a 0 and the strongest preference is represented by a 1. So, we can rely our proposal on the theory of fuzzy reasoning that is an inference procedure that derives conclusions from a set of fuzzy if-then rules and known facts [
8,
9] by modeling vagueness and unreliability of information, where an interval also represents the degree of membership (consists of two limits between 0 and 1) of the function.
Therefore, the main contribution of this paper consists of the combination of multiple fuzzy systems [
10,
11] to perform integration of time series’ analysis results, which slightly simulate the cognitive functioning of the human brain when the person makes a decision and is focusing on achieving a management of uncertainty in this type of decisive process. It consists of a type-2 fuzzy integration of multivariate time series such as OECD country risk classification, inflation, population and gross national income (GNI) by using time series classification tasks multiple type-1 fuzzy systems.
This approach differs from most existing methods and computational models in the literature by combining multiple nested type-1 fuzzy systems using a type-2 fuzzy integration for comparisons in terms of multiple variables (indicators), which represents a great advantage of our method when managing uncertainty in decision making using linguistic variables.
This paper consists of the following sections. In
Section 2 and
Section 3, we show the literature review and theoretical aspects, respectively. In
Section 4, the problem is described. The methodology used is clarified in
Section 5. The experimental and discussion of results are presented in
Section 6 and
Section 7, respectively. Ultimately, in
Section 8, the final conclusions are outlined.
2. Literature Review
In recent decades, attention has been paid to the design of decision-making systems, mainly those that consider multiple criteria weighted by a group of experts; that is, they establish the importance or select certain criteria based on their knowledge, experience or intuition. There is a challenge in establishing an appropriate hierarchy among the multiple criteria [
12,
13].
There are numerous mathematical techniques for Multi-Criteria Decision Making (MCDM) [
14]: Simple Additive Weightage (SAW), Technique for Order Preference by Similarity to Ideal Solution (TOPSIS), Weighted Aggregated Sum Product Assessment (WASPAS), Preference Ranking Organization Method for Enrichment Evaluation (PROMETHEE) Elimination Et Choice Translating Reality (ELECTRE), Linear programming, Goal programming, LINMAP, Measurement of alternative and ranking according to the compromise solution (MARCOS) and Lexicographic, among others. Some of these models have been contemplated in different areas such as the humanities, administration, politics or engineering.
In the last decade, researchers have proposed hybrid models that combine mathematical models such as those mentioned above with general aspects of the fuzzy set theory proposed by Zadeh in the 1960s. In [
15,
16], the authors investigate an outranking approach with ELECTRE II and MARCOS methods, respectively, for group decision making in 2-tuple linguistic fuzzy context. Furthermore, other authors applied TOPSIS approach to modeling problems based on interval-valued probabilistic linguistic q-rung orthopair fuzzy sets in [
17]. The Intuitionistic fuzzy set theory is used by the authors in [
18] to choose the most appropriate energy alternative among a set of renewable energy alternatives; to map (fuzzy ranking) the linguistic judgements of the MCDM problems [
19,
20]; and to introduce a new aggregation and ranking method based on the WASPAS and TOPSIS methods [
21]. In [
22], authors proposed a new interval type-2 fuzzy (IT2F) MCDM method based on the analytic hierarchy process (AHP) and TOPSIS to the selection of a maintenance strategy for an industrial asset. In [
23,
24], the authors investigate the multiple attribute group decision-making problems in which the attribute values and the weights take the form of trapezoidal interval type-2 fuzzy sets.
Limitation of the current models validates the results, since they use different methodologies to establish the importance or hierarchy of the criteria or indicators [
25], as they are dynamic or uncertain since they depend on the global environment. As far as intelligent techniques are concerned [
26,
27,
28], the review of the literature indicates that there is no MCDM model that contemplates multiple type-1 and type-2 fuzzy systems to carry out the evaluation of the impact of using or ignoring criteria through a fuzzy integration that can model the results obtained.
3. Basic Concepts
In this section, we show a summary about the theory considered during the development of our model, covering mainly the use of bio-inspired methods, as is the case with fuzzy systems.
3.1. Type-2 Fuzzy Systems
When we refer to fuzzy logic we can take into account two relevant aspects; if it is type 1 we seek to model the vagueness in linguistic concepts, while in type 2 we intend to model uncertainty, mainly that which affects the decision-making process [
29] and is inherent to the information attribute, appearing in several different ways.
We can start from the composition of a fuzzy inference system: a fuzzy rule base; a database containing the type and parameters of the considered the membership functions, which will be very useful when generating fuzzy rules; and finally a reasoning mechanism, that is a procedure to infer which rules apply to the given values to reach a result, which are mostly fuzzy sets. Therefore, it is necessary to use a defuzzification method to extract a crisp value that represents a fuzzy set [
30].
There are no changes in the basic concepts of the different fuzzy sets; both type-1 and type-2 fuzzy use the fuzzy if-then rules in the antecedent or consequent. The difference is that the uncertainty in type-2 membership functions is modeled, since they contain type-2 fuzzy sets (which contain type 1 fuzzy sets). In other words, it consists of a representation of the uncertainty by means of a crisp output due to the perturbation, once the reduced type set is deblurred to produce a crisp type 2 output, by finding the centroid of the type-reduced set. This means the equivalent of finding the weighted average of the outputs of all the type-1 fuzzy logic systems that are embedded in the type-2 fuzzy logic system, where the weights correspond to the memberships in the type-reduced set.
So, the amount of uncertainty in a system can be reduced by using type-2 fuzzy logic as it offers better capabilities to handle linguistic uncertainties by modeling vagueness and unreliability of information, and also an interval represents the degree of membership (consists of two limits between 0 and 1) of the function [
31].
It is possible to mathematically express an Interval Type-2 Fuzzy Set as Equation (1)
where
and
correspond to the limits of the fuzzy set, frequently known as lower and upper membership functions, correspondingly.
The mathematical expression of the Footprint of Uncertainty (FOU) is presented as Equation (2)
where the
and
are the lower and upper membership functions, respectively [
32].
We can highlight that a similar process is carried out in an Interval Type-2 Mamdani FIS as in a Type-1, with the difference that lies in the activation forces of upper and lower rules. We rely on the fuzzy logic version of modus ponens to compute the inference calculation, as can be seen in the equation in Equation (3)
where
l = 1, …, M.
3.2. Multi-Criteria Decision Making
Multiple-criteria decision making or multiple-criteria decisions belong to the area of operations research (OR), where its purpose is to allow a quantitative analysis to be carried out first for the solution of complex problems in a public, private or social organization.
Generally, regardless of the person or work environment, it is considered that for decision making many criteria should be evaluated systematically and formally, through an analysis that includes multiple criteria, such as cost, price or measurement of the quality. A simple example is portfolio management, where obtaining high returns is a priority, but reducing risks is also required. In the service industry, customer satisfaction and the cost of providing the service are two of the significant criteria that must be weighed [
33].
In artificial intelligence, the generalization of logical connectives is mainly used when a system must decide. It is possible that the system has a multiple-criteria decision problem, which means that the system has numerous criteria. To simulate the environment in an information system, it is required to have a general understanding of the environment and that the sources of information are reliable. Unfortunately, when the information is provided by a single source (by a sensor or an expert) it is often not reliable enough. Thus, when the information is provided by several sensors (or experts), it must be combined to improve the reliability and precision of the data [
34,
35,
36].
An indicator (criterion) is presumed to be useful if its predictions result in a smaller loss when compared to a prediction where that indicator was ignored. In the case of vulnerability indicators, these are used as useful early warning indicators for policymakers when faced with severe recessions. Hence the importance of considering international events when assessing a country’s vulnerabilities. In a global economy, the vulnerabilities of countries accumulate, and are potentially transmitted between them [
37].
There are multiple factors for the development of a country. By carrying out a ranking process, it is possible to compare the strengths and weaknesses of each nation. Therefore, it is necessary to identify a correct classification mechanism by which it is possible to perform a comparative analysis [
38].
4. Problem Description
The Organization for Economic Co-operation and Development (OECD) is an international organization that works to build better policies for better lives. Together with governments, policy makers and citizens, OECD works on establishing evidence-based international standards and finding solutions to a range of social, economic and environmental challenges.
As part of the civil and governmental actions, global comparable data are available to uncover the strengths of the OECD and other leading economies, which makes it possible to analyze multiple historical trends such as inflation, population and gross national income (GNI), among others, though this is an arduous task that will probably take a long time, so in the meantime it is necessary to have tools that allow these variables to be associated, provide new insights into areas of policy interest and inform the global panorama to decision-makers. Furthermore, indicators are pointers; they do not address causal relationships. Moreover, the validity of a set of indicators depends on its use [
39].
For this case, four datasets were selected for each of the 38 OECD member countries, and no data preprocessing was performed (
Table 1):
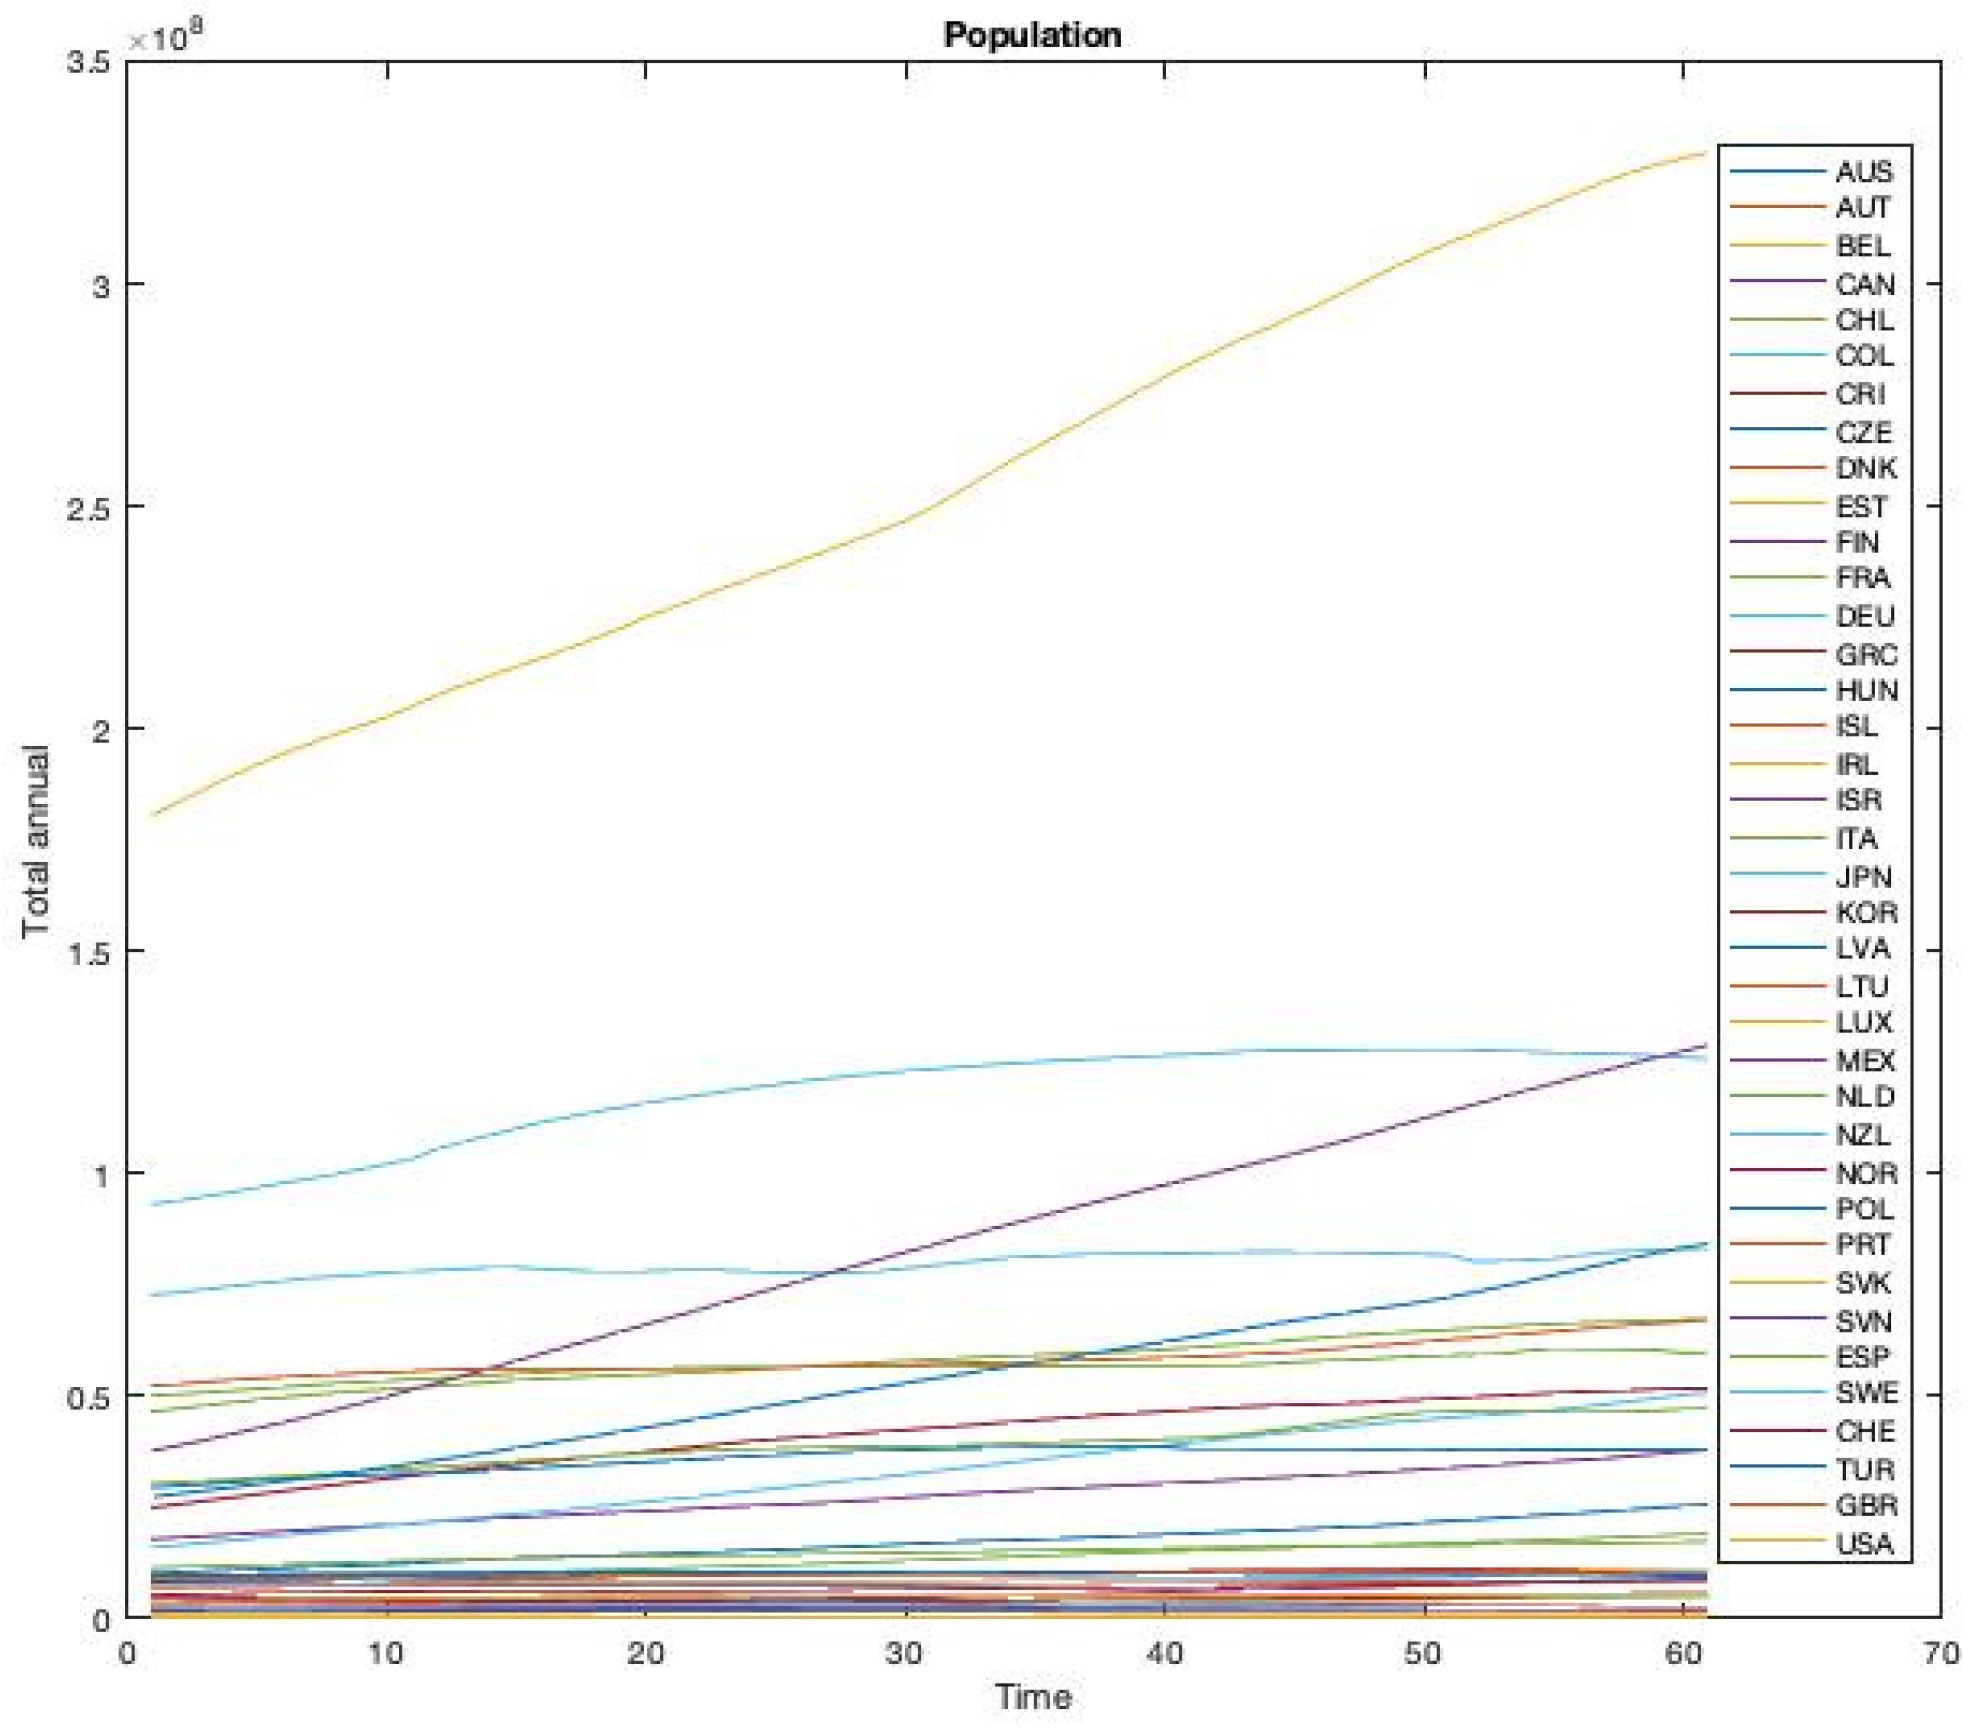
The first dataset consists of six attributes (
Table 2) for 61 instances corresponding to the total annual population, from 1960 to 2020 (
Figure 1) [
40].
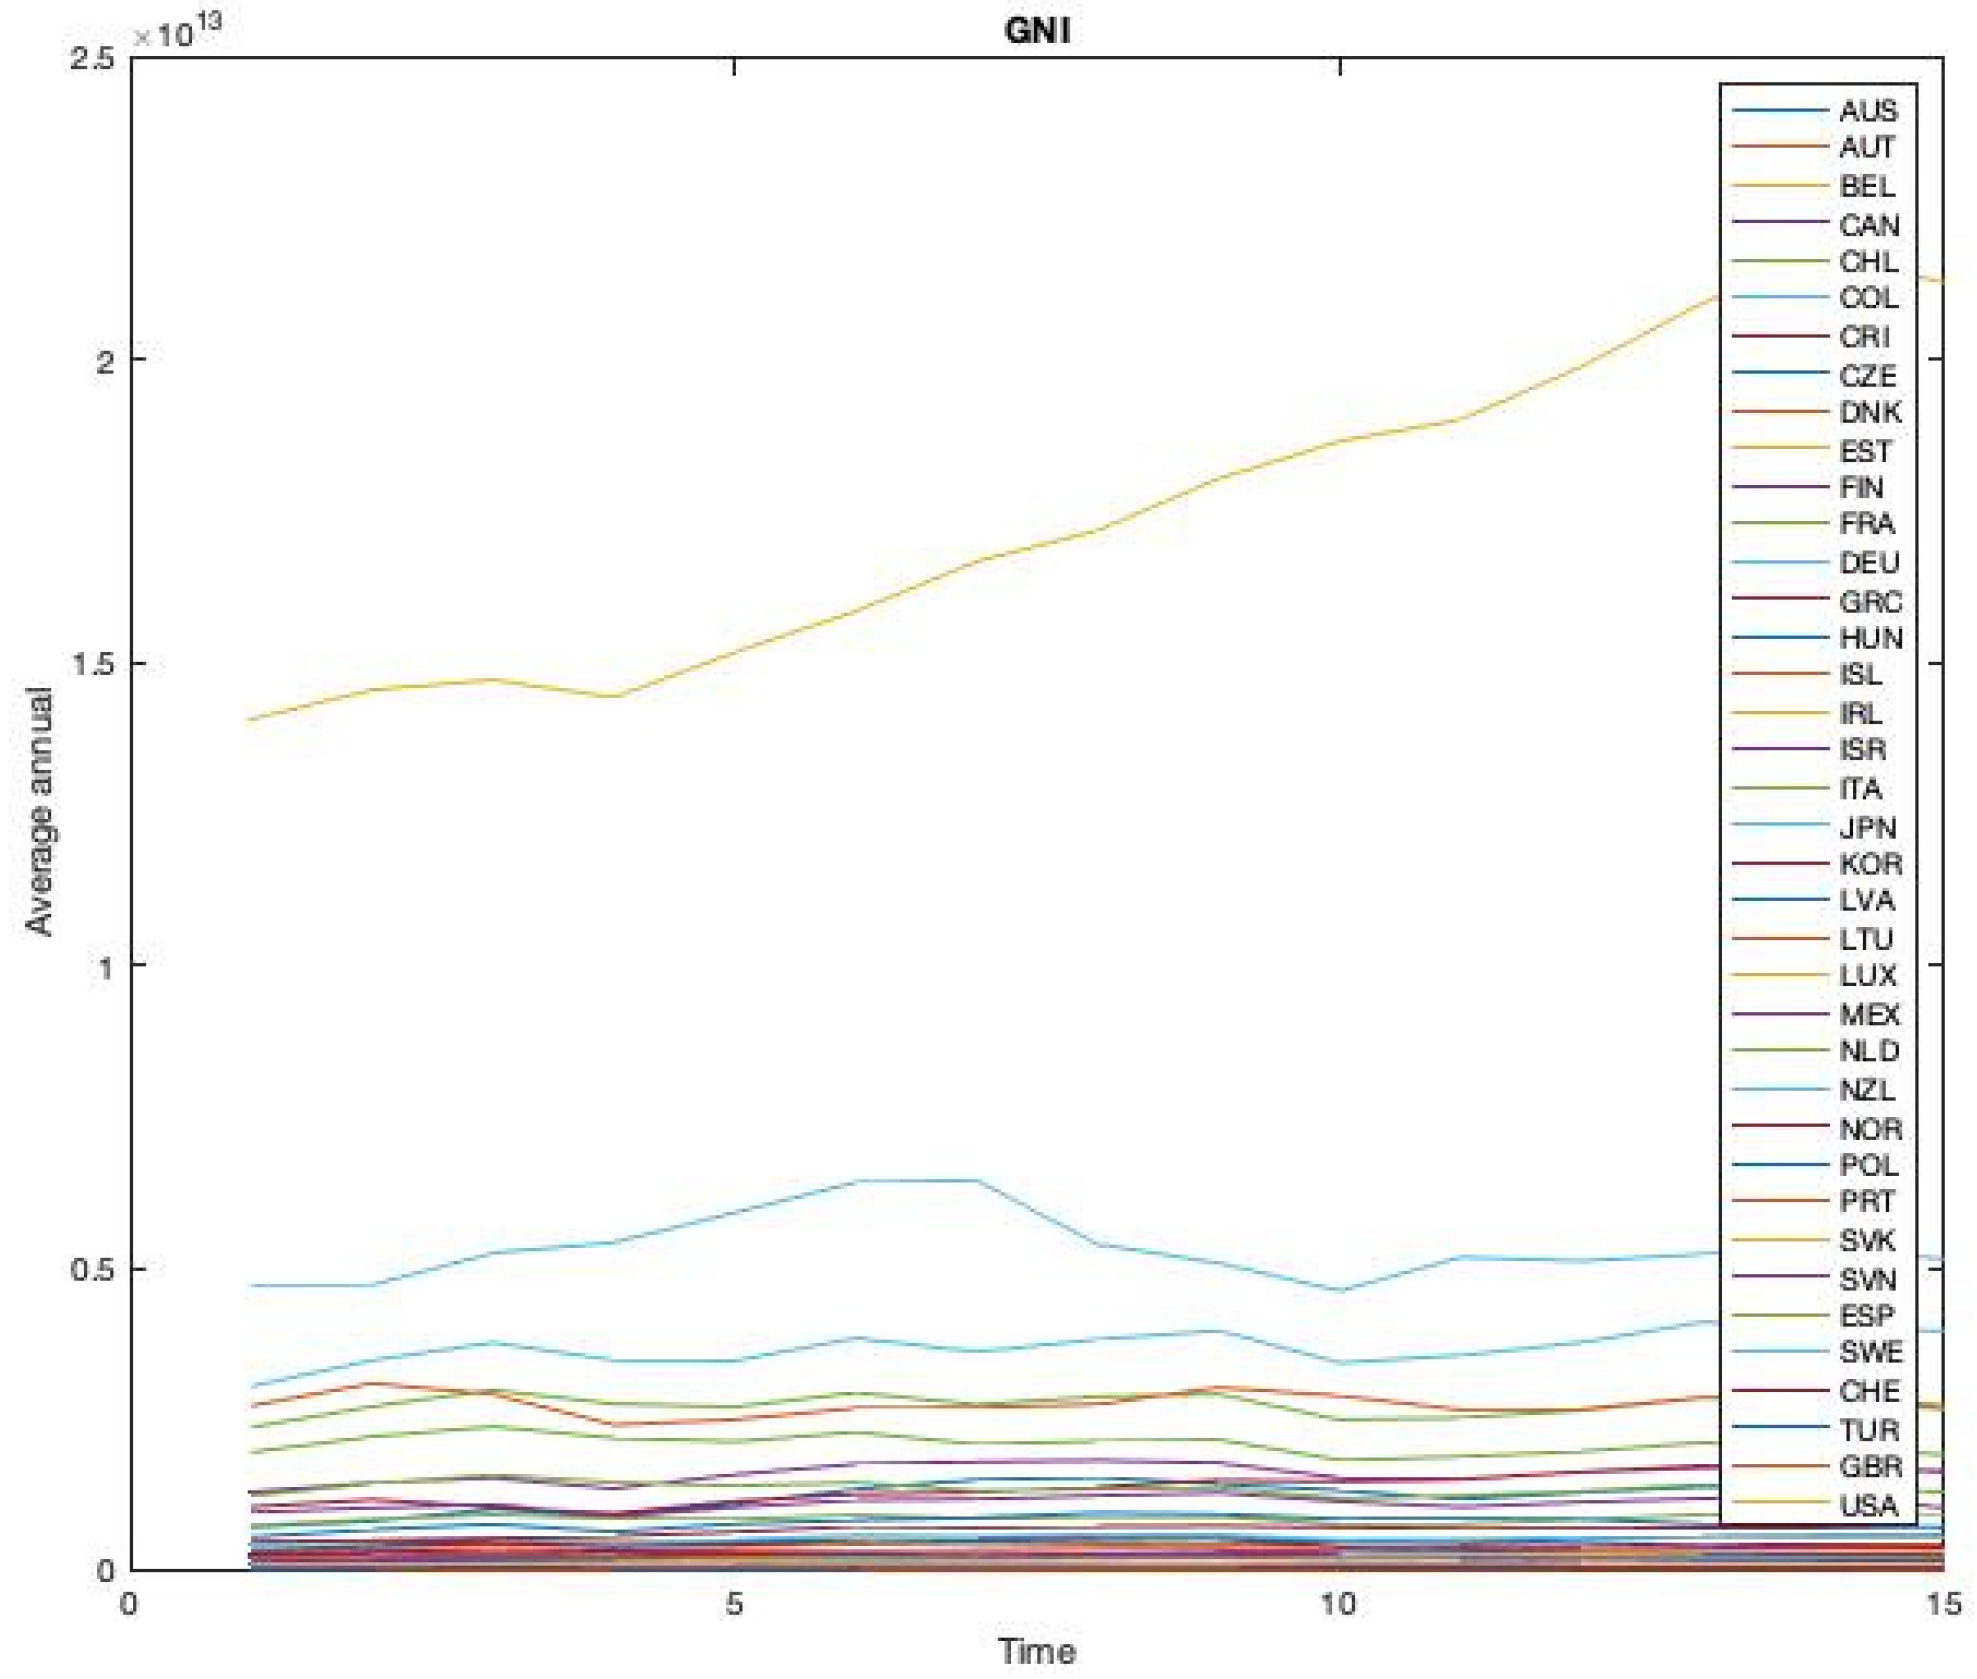
In the second dataset, it consists of six attributes (
Table 3) for 15 instances corresponding to GNI, from 2006 to 2020 (
Figure 2) [
41].
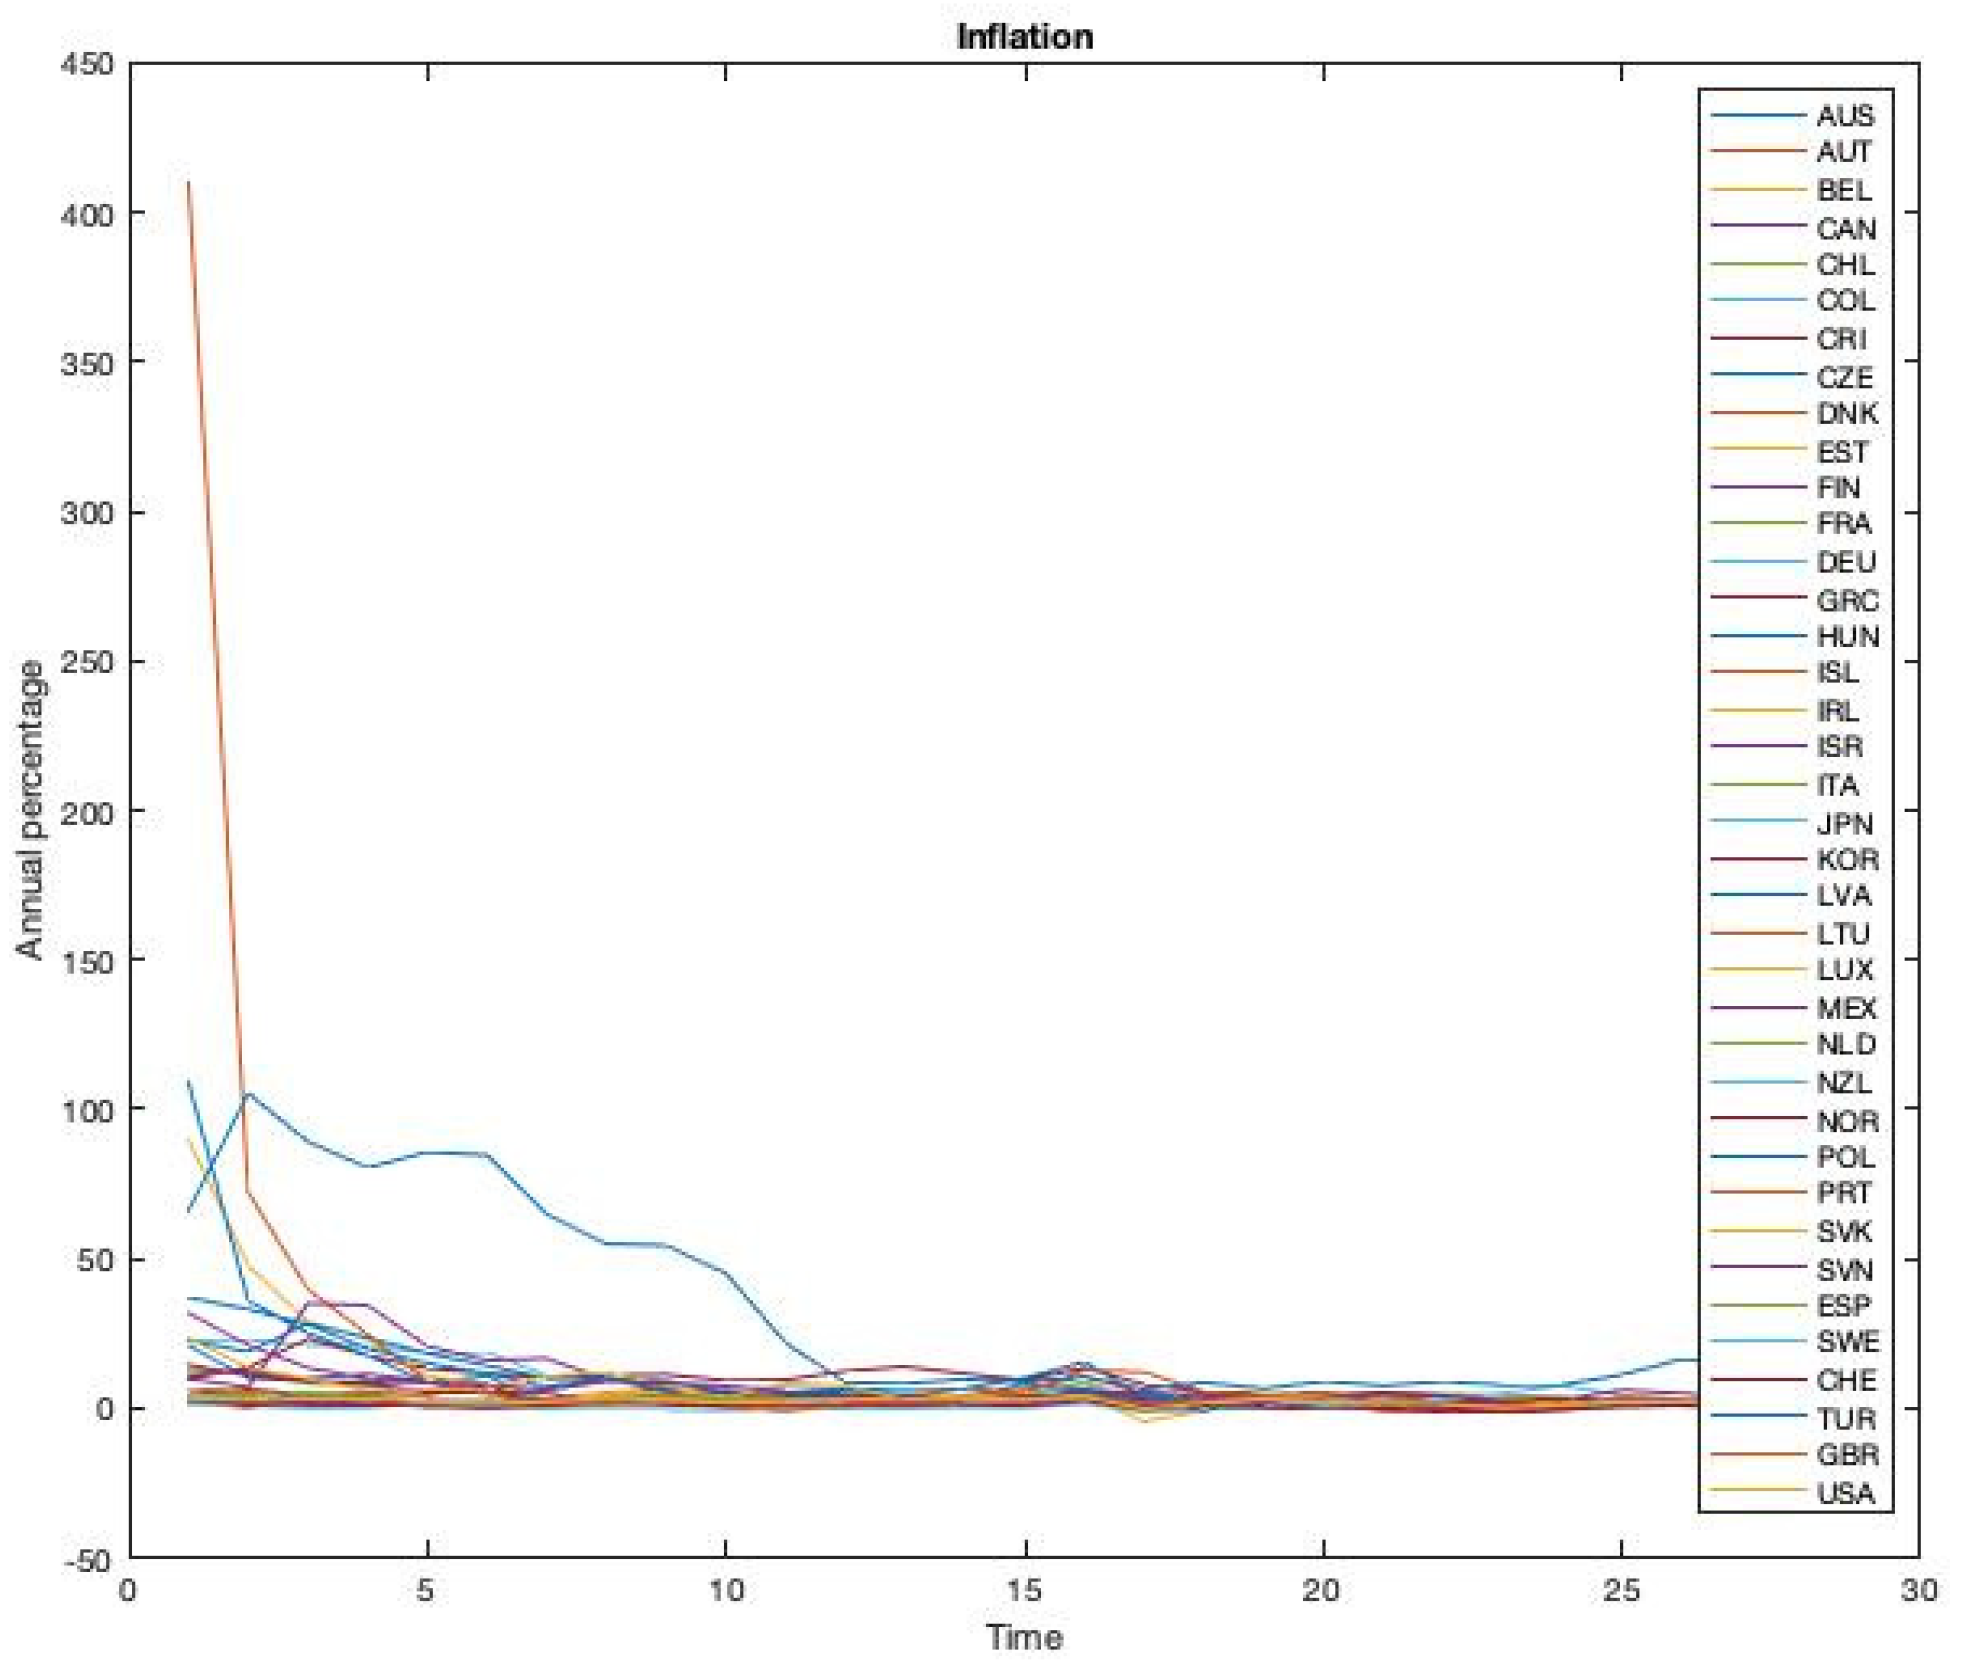
The third dataset consists of six attributes (
Table 4) for 28 instances corresponding to the inflation, from 1993 to 2020 (
Figure 3) [
42].
The fourth dataset consists of four attributes (
Table 5) for 34 instances corresponding to OECD country risk, from 1987 to 2020 [
43].
High-income OECD member countries have been not classified; these belong to category 0.
5. Proposed Method
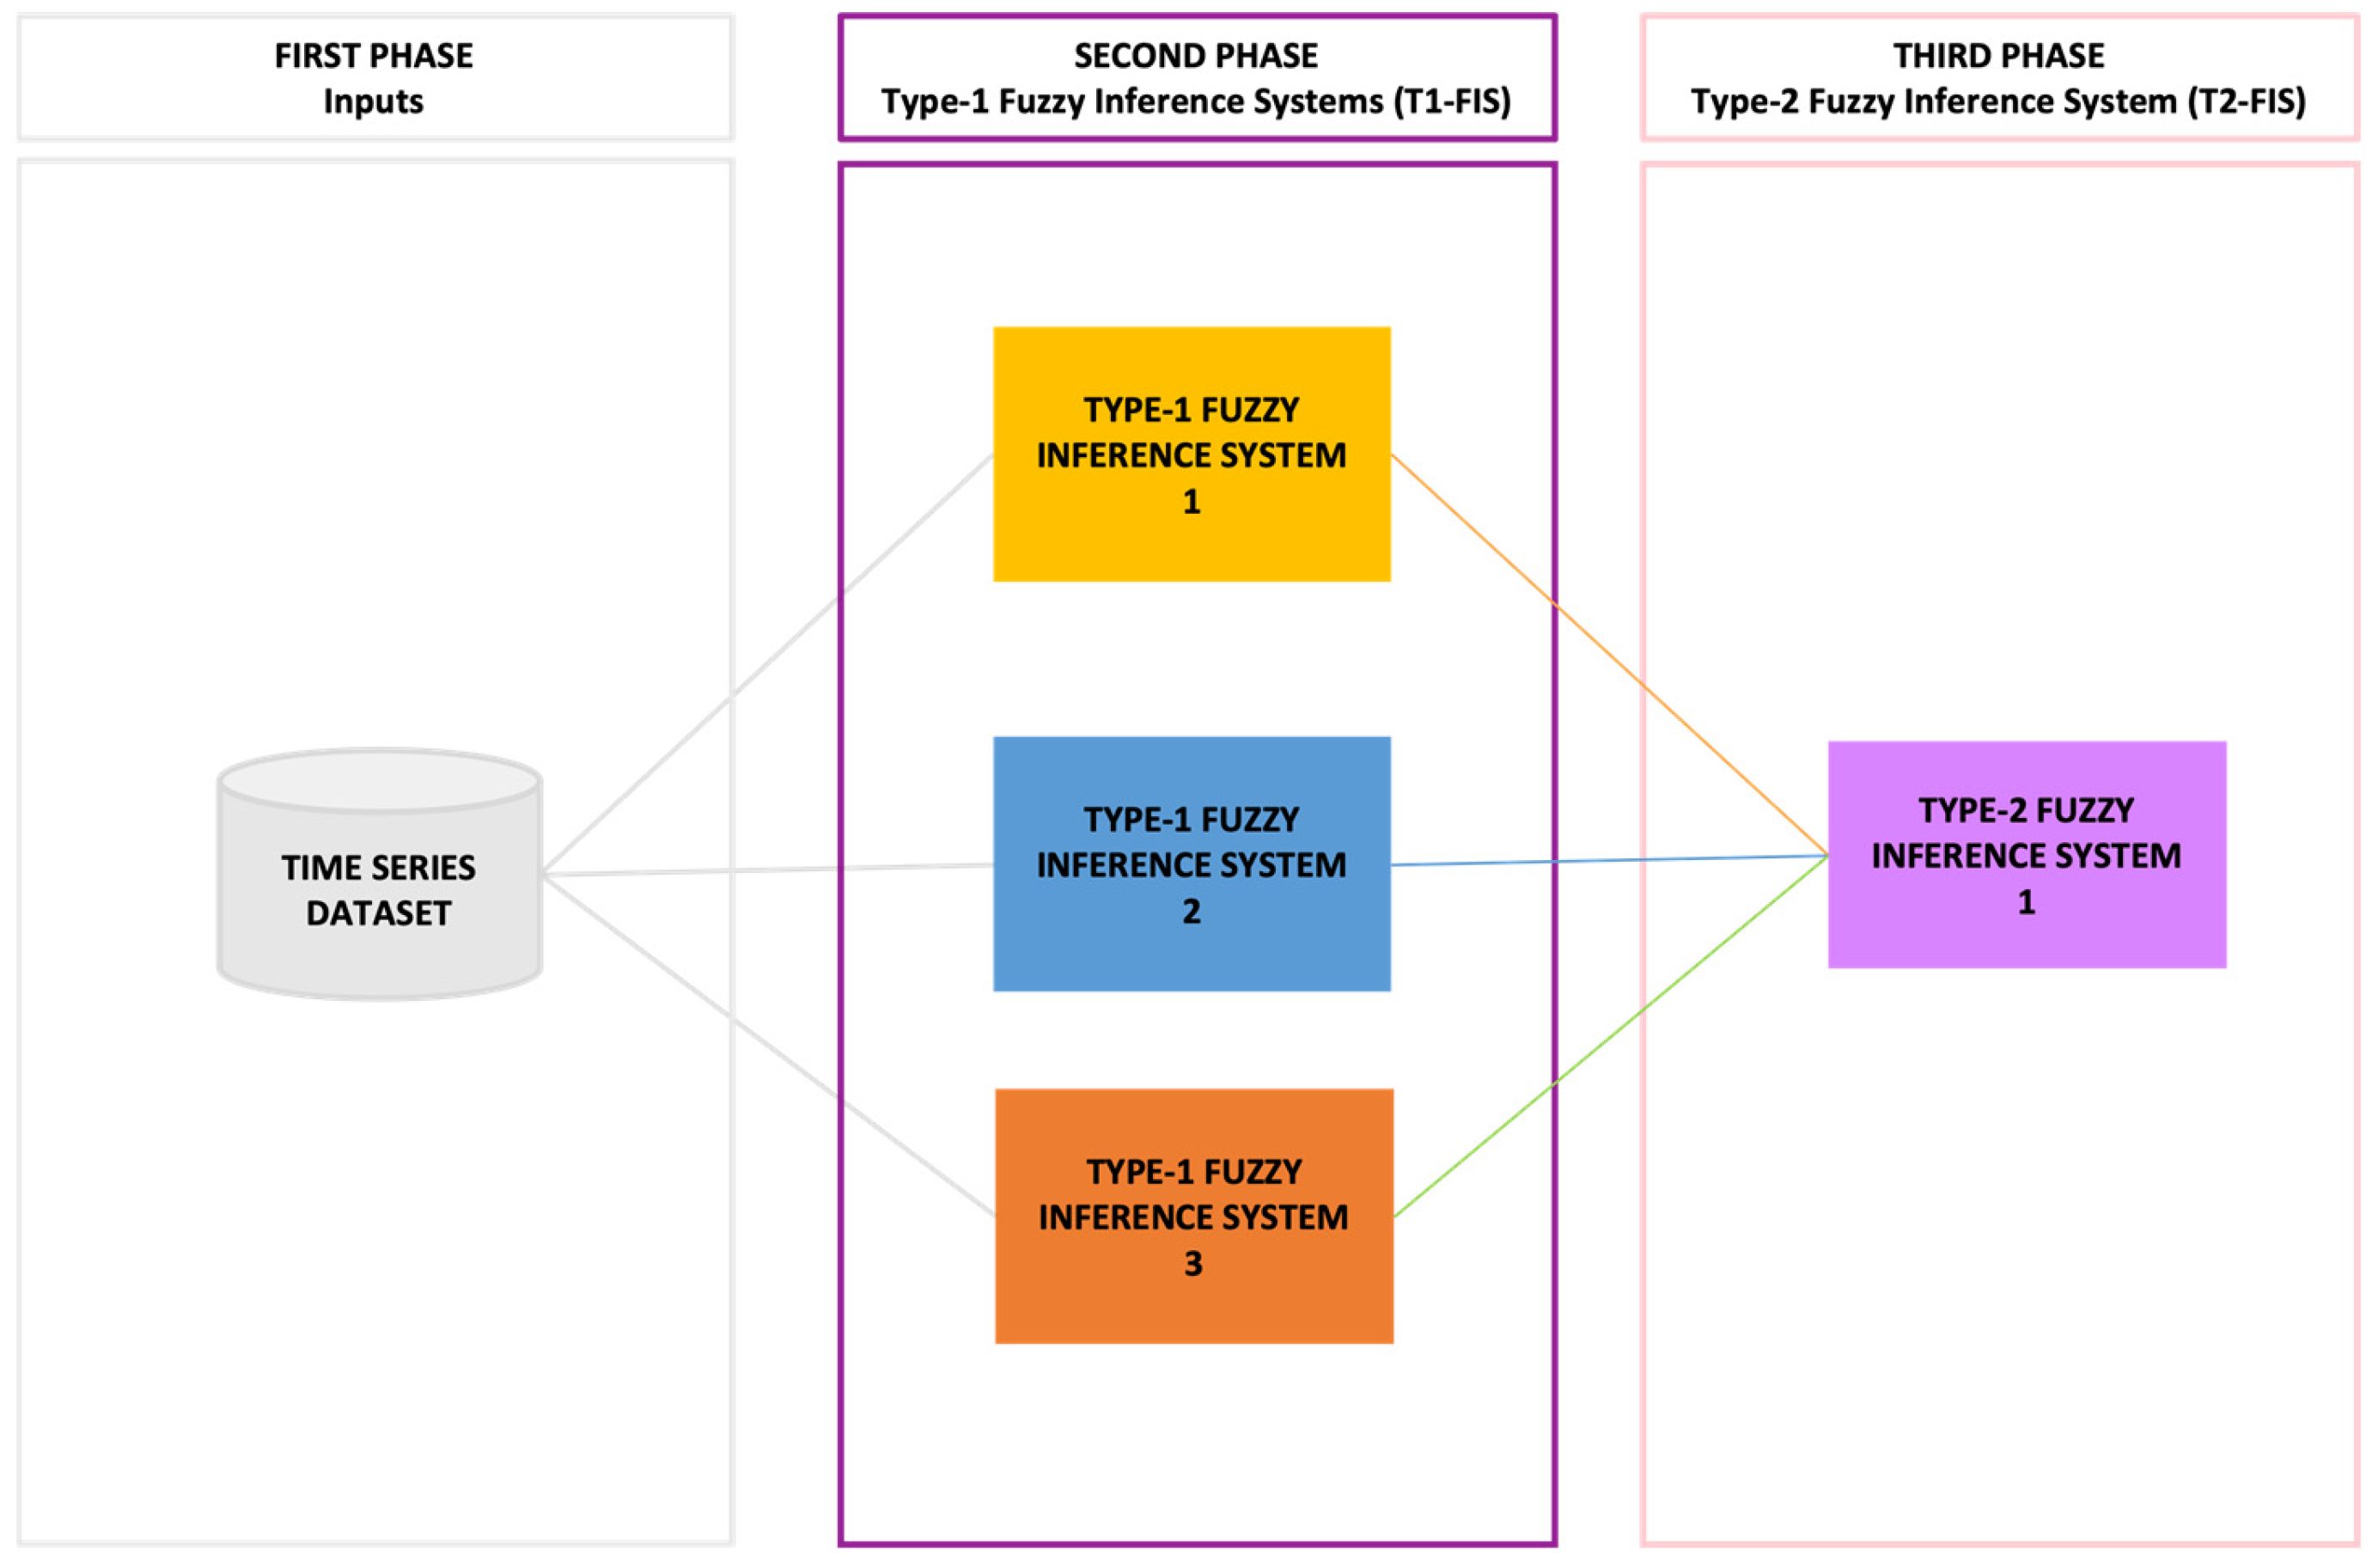
We presented a computational model that comprises three levels. In the first, a time series dataset is selected; and for the second, type-1 fuzzy inference systems are used to classify a set of countries by weighting: population, GNI, inflation and OECD country risk time series values (based on the time series values a class is assigned to each country). Finally, in the third, the results obtained in the previous levels are used as inputs of a type-2 fuzzy inference system to integrate the results and obtain an indicator or global result (
Figure 4).
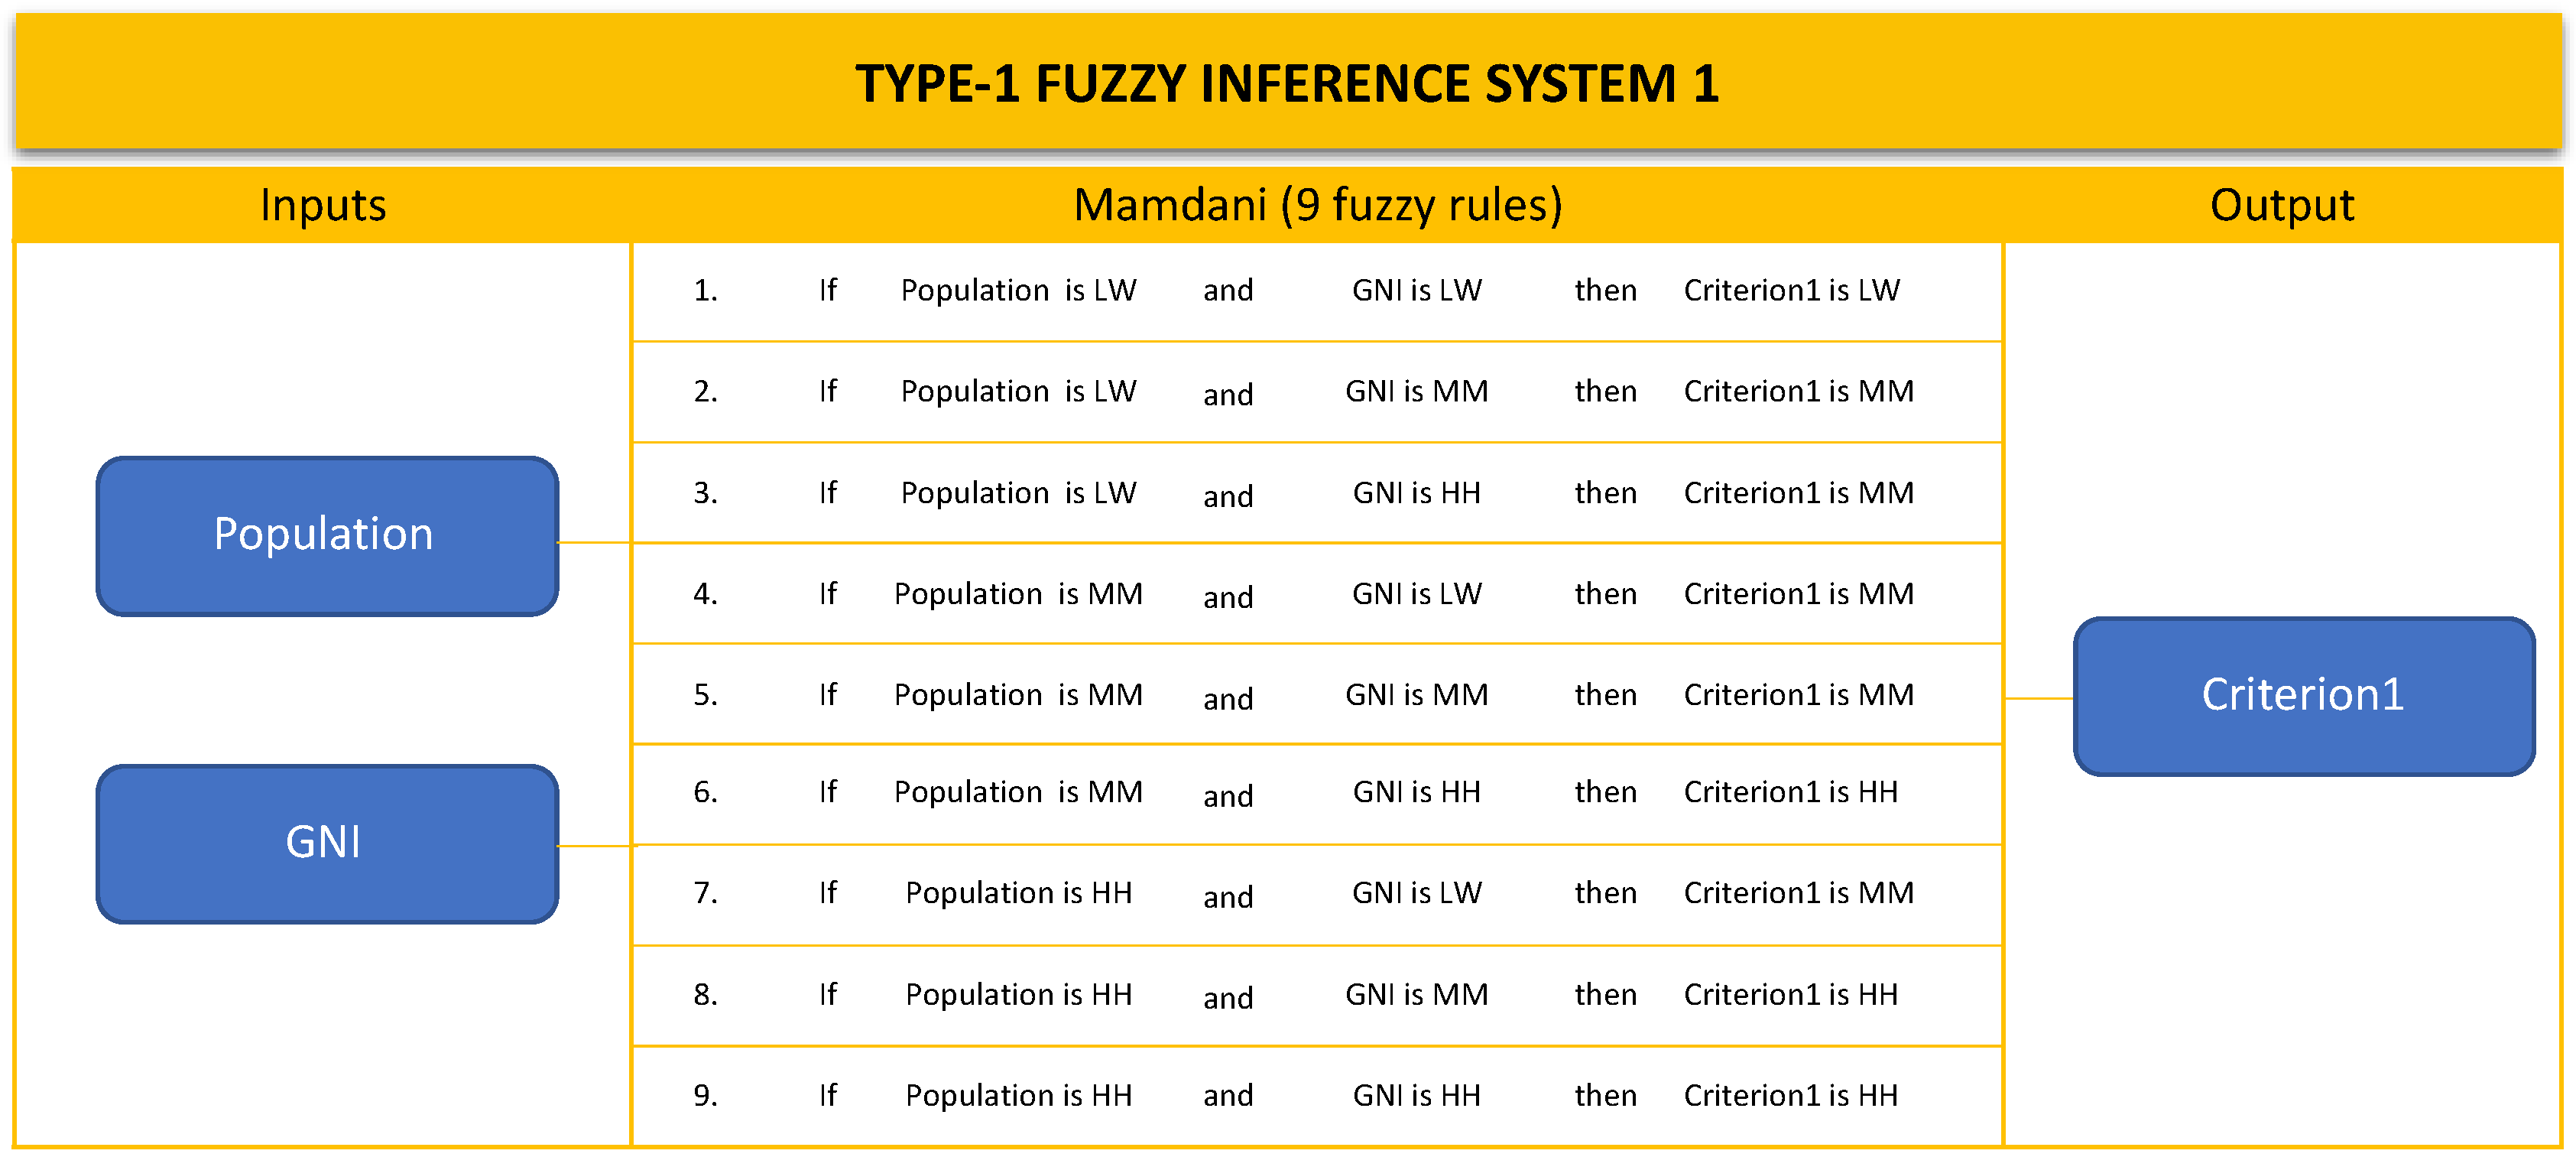
Type-1 fuzzy systems used to integrate the population and GNI time series are the Mamdani type, consisting of two inputs and one output (
Table 6), triangular membership functions type: Low (LW), Medium (MM), High (HH), 9 rules and the centroid defuzzification method. To select these values, the parameters of the membership function and fuzzy rules were thoroughly tested (
Figure 5).
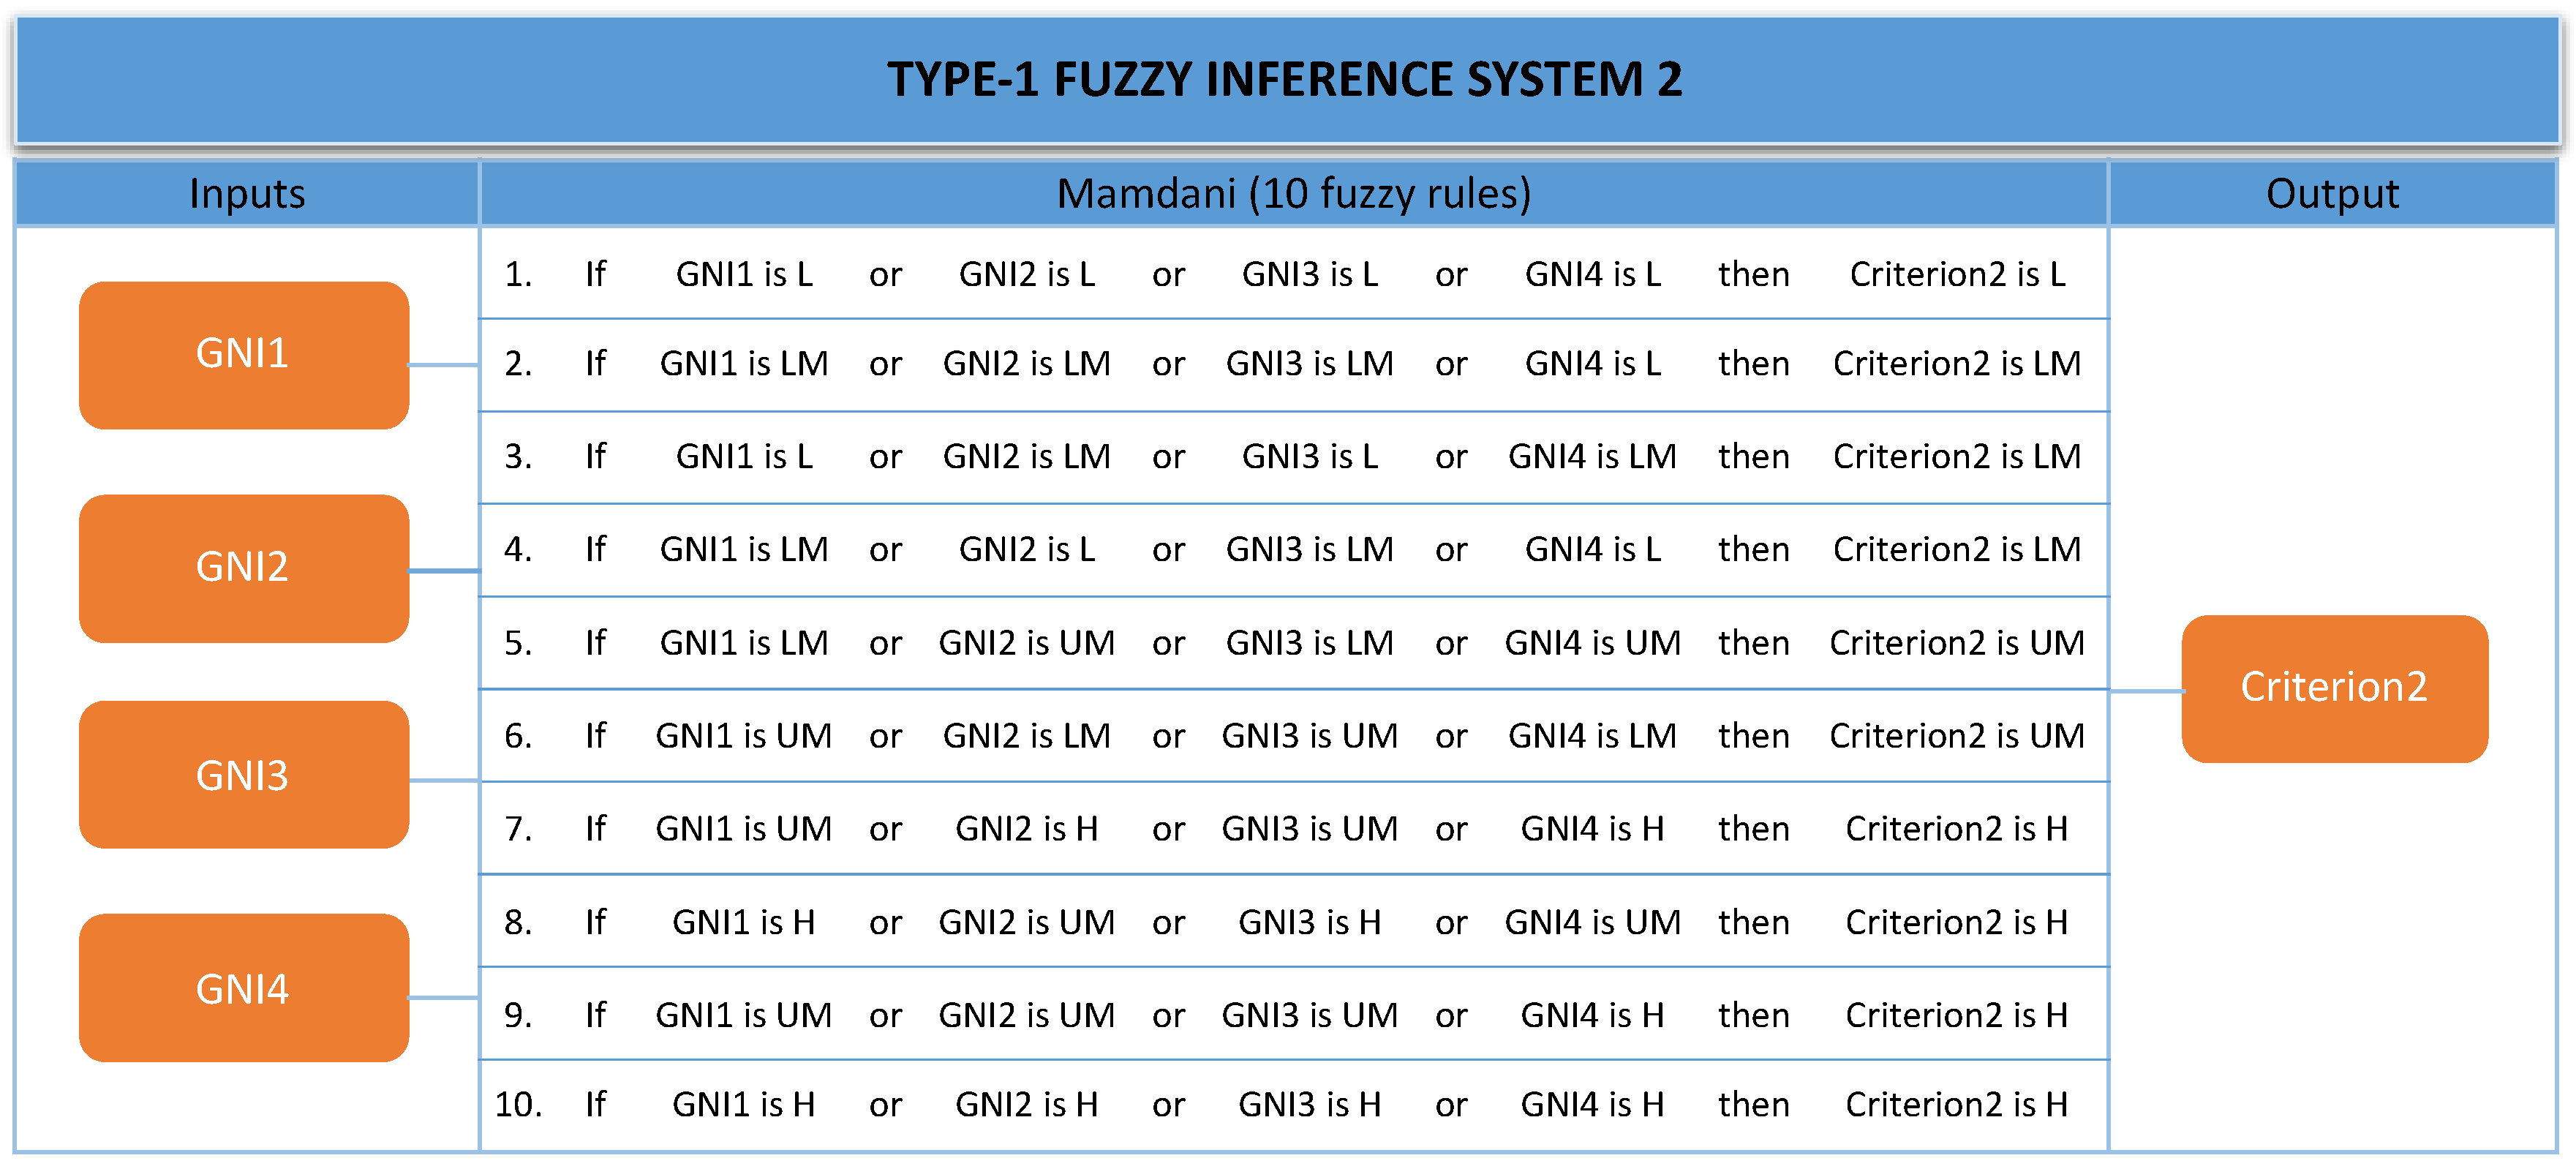
The second type-1 fuzzy system is the Mamdani type, and is used to integrate GNI time series values; it consists of three inputs and one output (
Table 7), triangular membership functions type (Lower income (L), Lower Middle income (LM), Upper Middle income (UM), High income (H), 10 rules and the centroid defuzzification method. To select these values, the parameters of the membership function and fuzzy rules were thoroughly tested (
Figure 6).
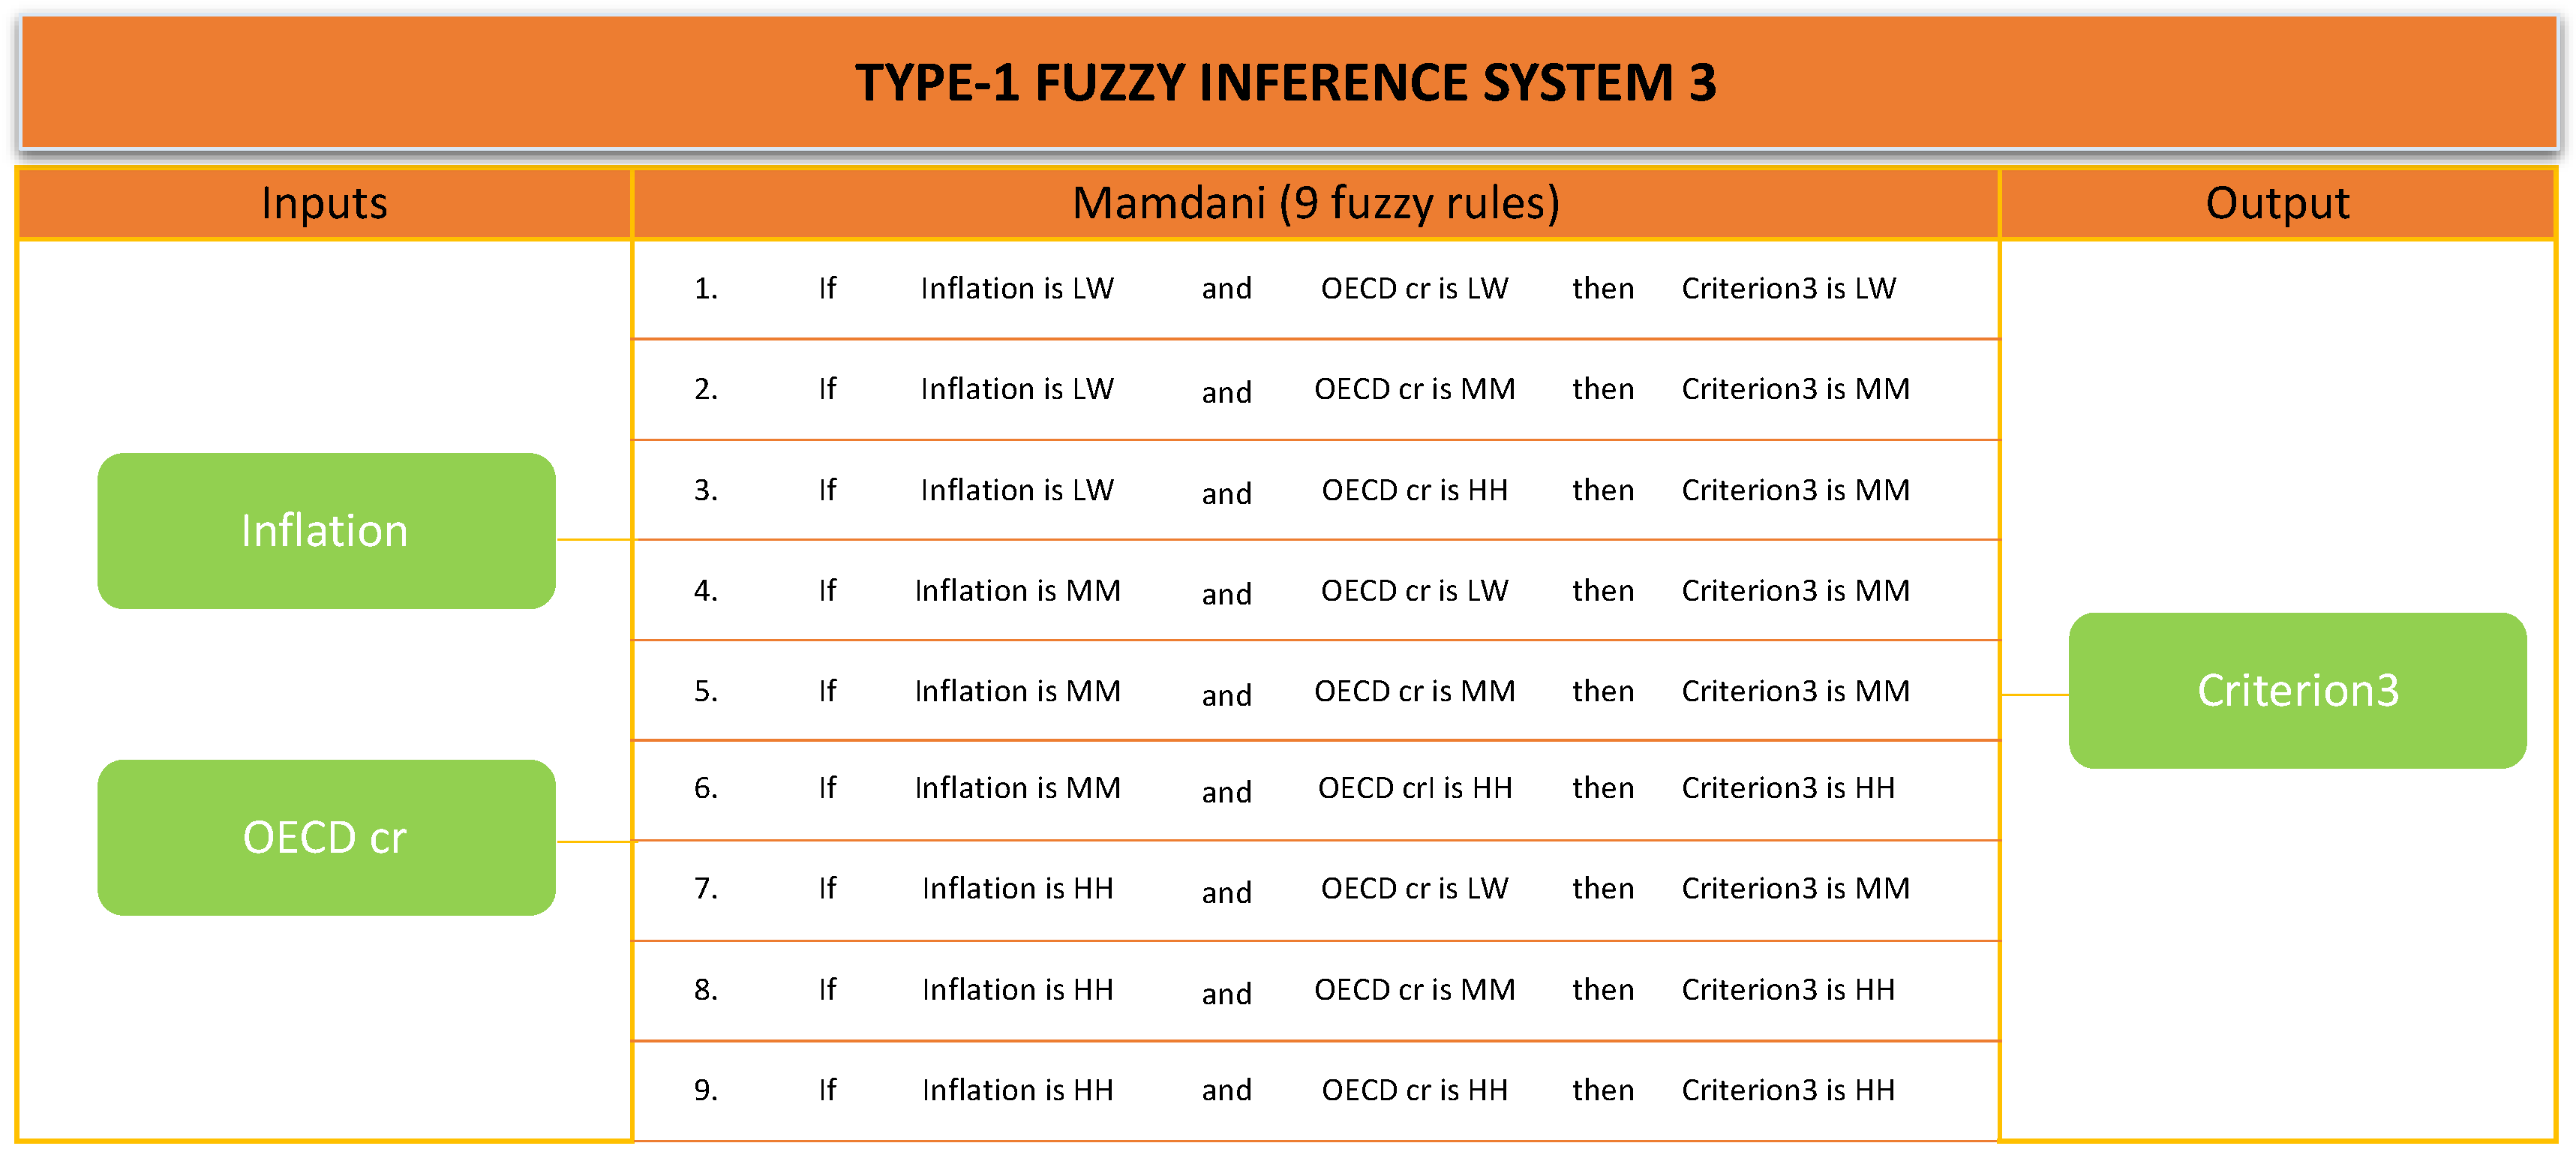
Type-1 fuzzy systems used to integrate the inflation and OECD country risk time series consist of two inputs and one output, triangular membership functions type: Low (LW), Medium (MM) and High (HH) (
Table 8). It is Mamdani type, with 9 rules and the centroid defuzzification method. To select these values, the parameters of the membership function and fuzzy rules were tested thoroughly (
Figure 7).
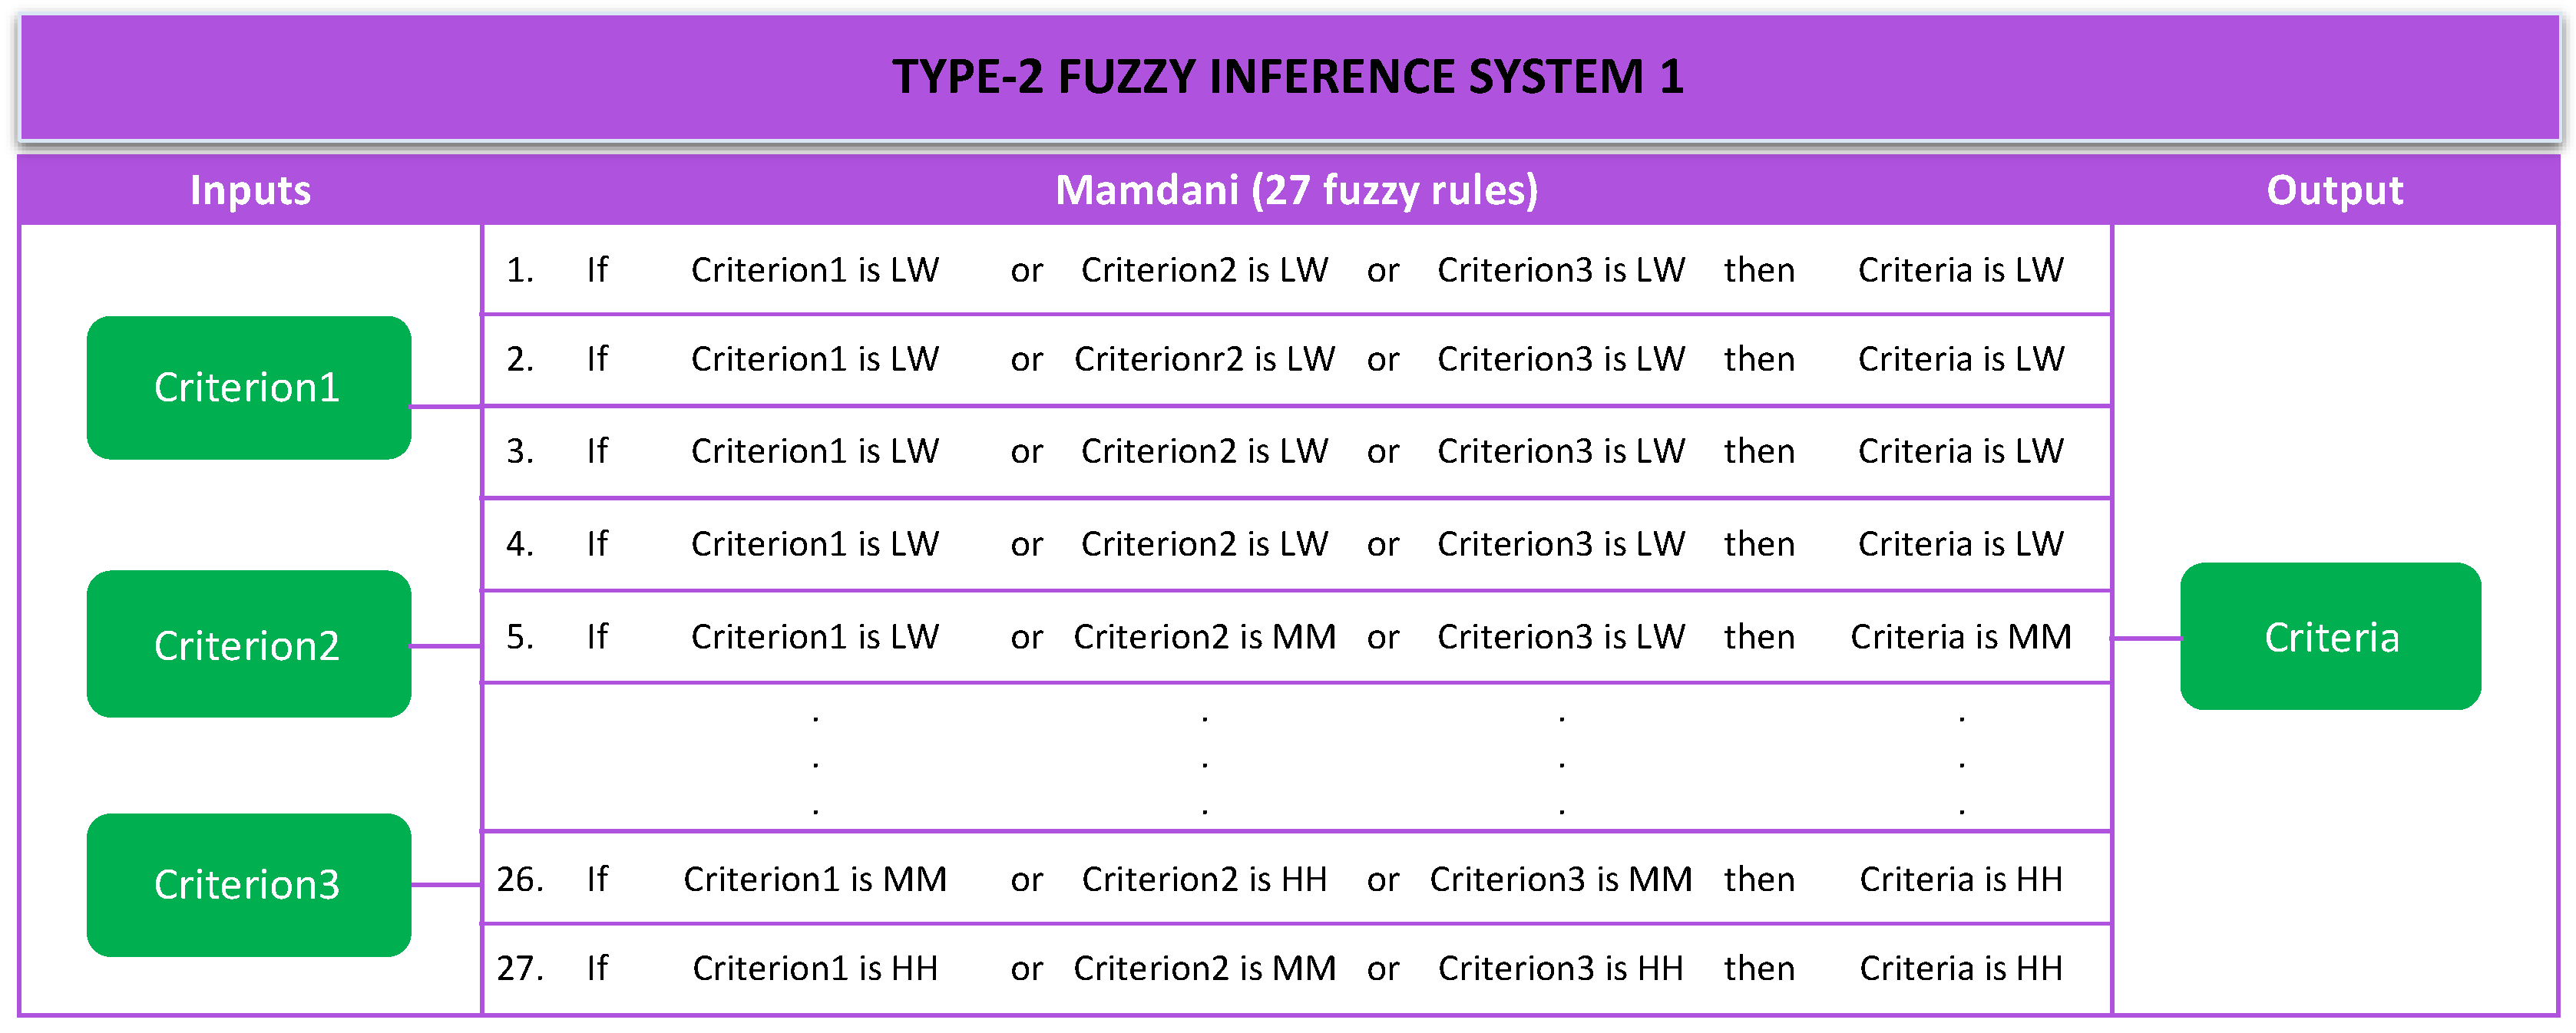
Type-2 fuzzy system used to integrate the results of the type-1 fuzzy systems consists of three inputs and one output, triangular membership functions type Low (LW), Medium (MM) and High (HH) (
Table 9). It is the Mamdani type, with 27 rules and the centroid defuzzification method. To select these values, the parameters of the membership function and fuzzy rules were tested thoroughly (
Figure 8).
It is necessary to establish that after the type reduction, to calculate the final output of the type-2 fuzzy system, the weights of the outputs of the fuzzy rules are averaged, where the membership functions of the rules are the weights as Equation (4)
where y
i(t) are the outputs of the rules, i = 1, …27,
are the membership function values at the outputs of the rules, i = 1, …27 and y(t) is the total output.
6. Experimental Results
For the case of calculating the level of increase for each variable (time series), we first subtract the immediate previous value of the time series from the initial value. After obtaining the result, it is divided by the initial value. Subsequently, with the result of calculating the level of increase in the population and the GNI for each of the calendar years, we classify the variables of the level of increase in the population and the GNI by using a Mamdani type-1 fuzzy inference system with two inputs and one output, triangular membership functions: Low (LW), Medium (MM) and High (HH) (
Table 10 and
Table 11).
By using a Mamdani fuzzy type-1 Inference System with four inputs and one output, as well as triangular membership functions based on the GNI variable, the indicator level was reached for each of the countries according to the corresponding classification for every calendar year, Lower income (L), Lower Middle income (LM), Upper Middle income (UM) and High income (H), seeking to integrate the results with respect to the class assigned to each country, into a new classification label (
Table 12 and
Table 13).
Then, a third Mamdani type-1 fuzzy inference system was used to classify the level of increase of inflation and OECD country risk. It consists of two inputs and one output, as well as triangular membership functions: Low (LW), Medium (MM) and High (HG) (
Table 14 and
Table 15).
Finally, once the classification results of the level of increase of the variables population, GNI, inflation and OECD country risk from one period to another are obtained by using three type-1 fuzzy systems, these results are integrated by using a type-2 fuzzy system with triangular membership functions, where the three inputs correspond to the classification of each of the type-1 fuzzy systems, for the purpose of obtaining an output that represents the final classification of the level of increase of the variables Low (LW), Medium (MM) or High (HH), as appropriate (
Table 16 and
Table 17).
Finally, we are presenting a comparison of the classification results obtained for each country using type-1 fuzzy systems and the final classification obtained using the type-2 fuzzy system as an integrator of all the criteria evaluated (
Table 18).
7. Discussion of Results
The main goal of this work lies in achieving the separation of the results obtained using each type-1 fuzzy system, with the idea of making decisions based on the integrated results through the type-2 fuzzy system. In this understanding, these results show that it is possible to integrate utilizing type-2 fuzzy systems with the outputs of type-1 fuzzy systems, with which it is possible to identify countries with similar trends and provide an overview of the performance of multiple variables in different countries concurrently.
Since most member countries of the OECD have been classified by international organizations, in the case of the type-1 fuzzy system classification by GNI and classification of the OECD risk variables, the vast majority of the countries obtained similar a classification.
Similarly, the final classification obtained using type-2 fuzzy concentrates most of the results in the middle range, with 36 countries classified as MM, with the exception of two countries that obtained low (LW) classification. This is because both criterion 1 and criterion 2, which represent the increase in population and gross national income, respectively, obtained different weights compared to the rest of the countries with similar classifications in the results of type-1 fuzzy systems. This means that by integrating the results using the type-2 fuzzy system, it is possible to separate into new classes elements that belong to the same group, since in this case the difference is mainly marked in criterion 2, which models the increase in gross national income of the last four years for each country. Consequently, the results of type-2 fuzzy are slightly similar.
8. Conclusions
We have presented in this work a model for the classification of time series of population, GNI, inflation and OECD country risk using multiple type-1 fuzzy systems and a type-2 fuzzy system as integrator.
The simulation results have shown the countries with similar indicators. The results have shown that it is possible to use type-2 fuzzy systems to find the final country key indicator (criteria) based on the trend and similarity of their primary indicators. Therefore, the combination of nested fuzzy models to perform integration of time series’ analysis results slightly simulate the cognitive functioning of the human brain when the person makes a decision, and focuses on achieving a management of uncertainty in this type of decisive process, with this representing the main contribution of this work.
By carrying out the experiments, we identified some of the advantages of using type-2 fuzzy integration for classification problems, particularly applied as a decision-support tool, as it is possible to achieve results for a specific place or area by having the data grouped based on their similarity or groups of elements. Furthermore, by incorporating the type-2 fuzzy system, it was possible to observe the improvement in the integration of the outputs of type-1 fuzzy systems, since by offering threshold values between 0 and 1, elements that apparently belong to the same group (in other words, that obtained the same classification) can be separated into a new cluster due to differences that only an expert in the function could detect through exhaustive analysis. This will depend on the problem to be solved to decide whether to use three phases of the proposed method simultaneously, or to work with each one of them separately.
As future work, we could design a model consisting of multiple type-2 fuzzy inference systems, with the aim of performing tests with other types of membership functions, seeking to extend the membership threshold of each function. On the other hand, we also intend to combine our proposal with the use of supervised neural networks to perform multi-variable prediction tasks, seeking to reach a greater number of global indicators. In addition, we are evaluating working with new datasets, with the idea of considering the relevant attributes within the time series by using several types of demographics and financial, industry and labor market statistics indicators, among others. On the other hand, it is also intended to combine our proposal with the use of supervised neural networks to perform variable prediction tasks, seeking to reach a greater number of global indicators.


