
An Integrated BWM-TOPSIS-I Approach to Determine the Ranking of Alternatives and Application of Sustainability Analysis of Renewable Energy


Abstract
:1. Introduction
2. Literature Review
2.1. Research Gap
2.2. Objectives of the Study
- To determine which sectors of the energy sector are most sustainable. This paper proposes an MCDM model for analyzing energy sector sustainability. According to the proposed model, the most environmentally friendly energy sector or sectors are selected. Literature reviews, surveys of experts, and reports have all been used to develop this list.
- In order to identify the most significant alternatives, BWM-TOPSIS-I, a hybrid MCDM technique, is suggested.
- In order to determine the weights or priority values (PVs) of a set of criteria, BWM is used.
- To determine the ranking of alternatives, TOPSIS-I is used in conjunction with BWM’s PV determination.
2.3. Novelty of the Study
- To determine the ranking of alternatives, this study proposes hybrid decision making.
- A three-step complex decision-making problem based on the sustainability of RESs is solved by a hybrid approach suggested here.
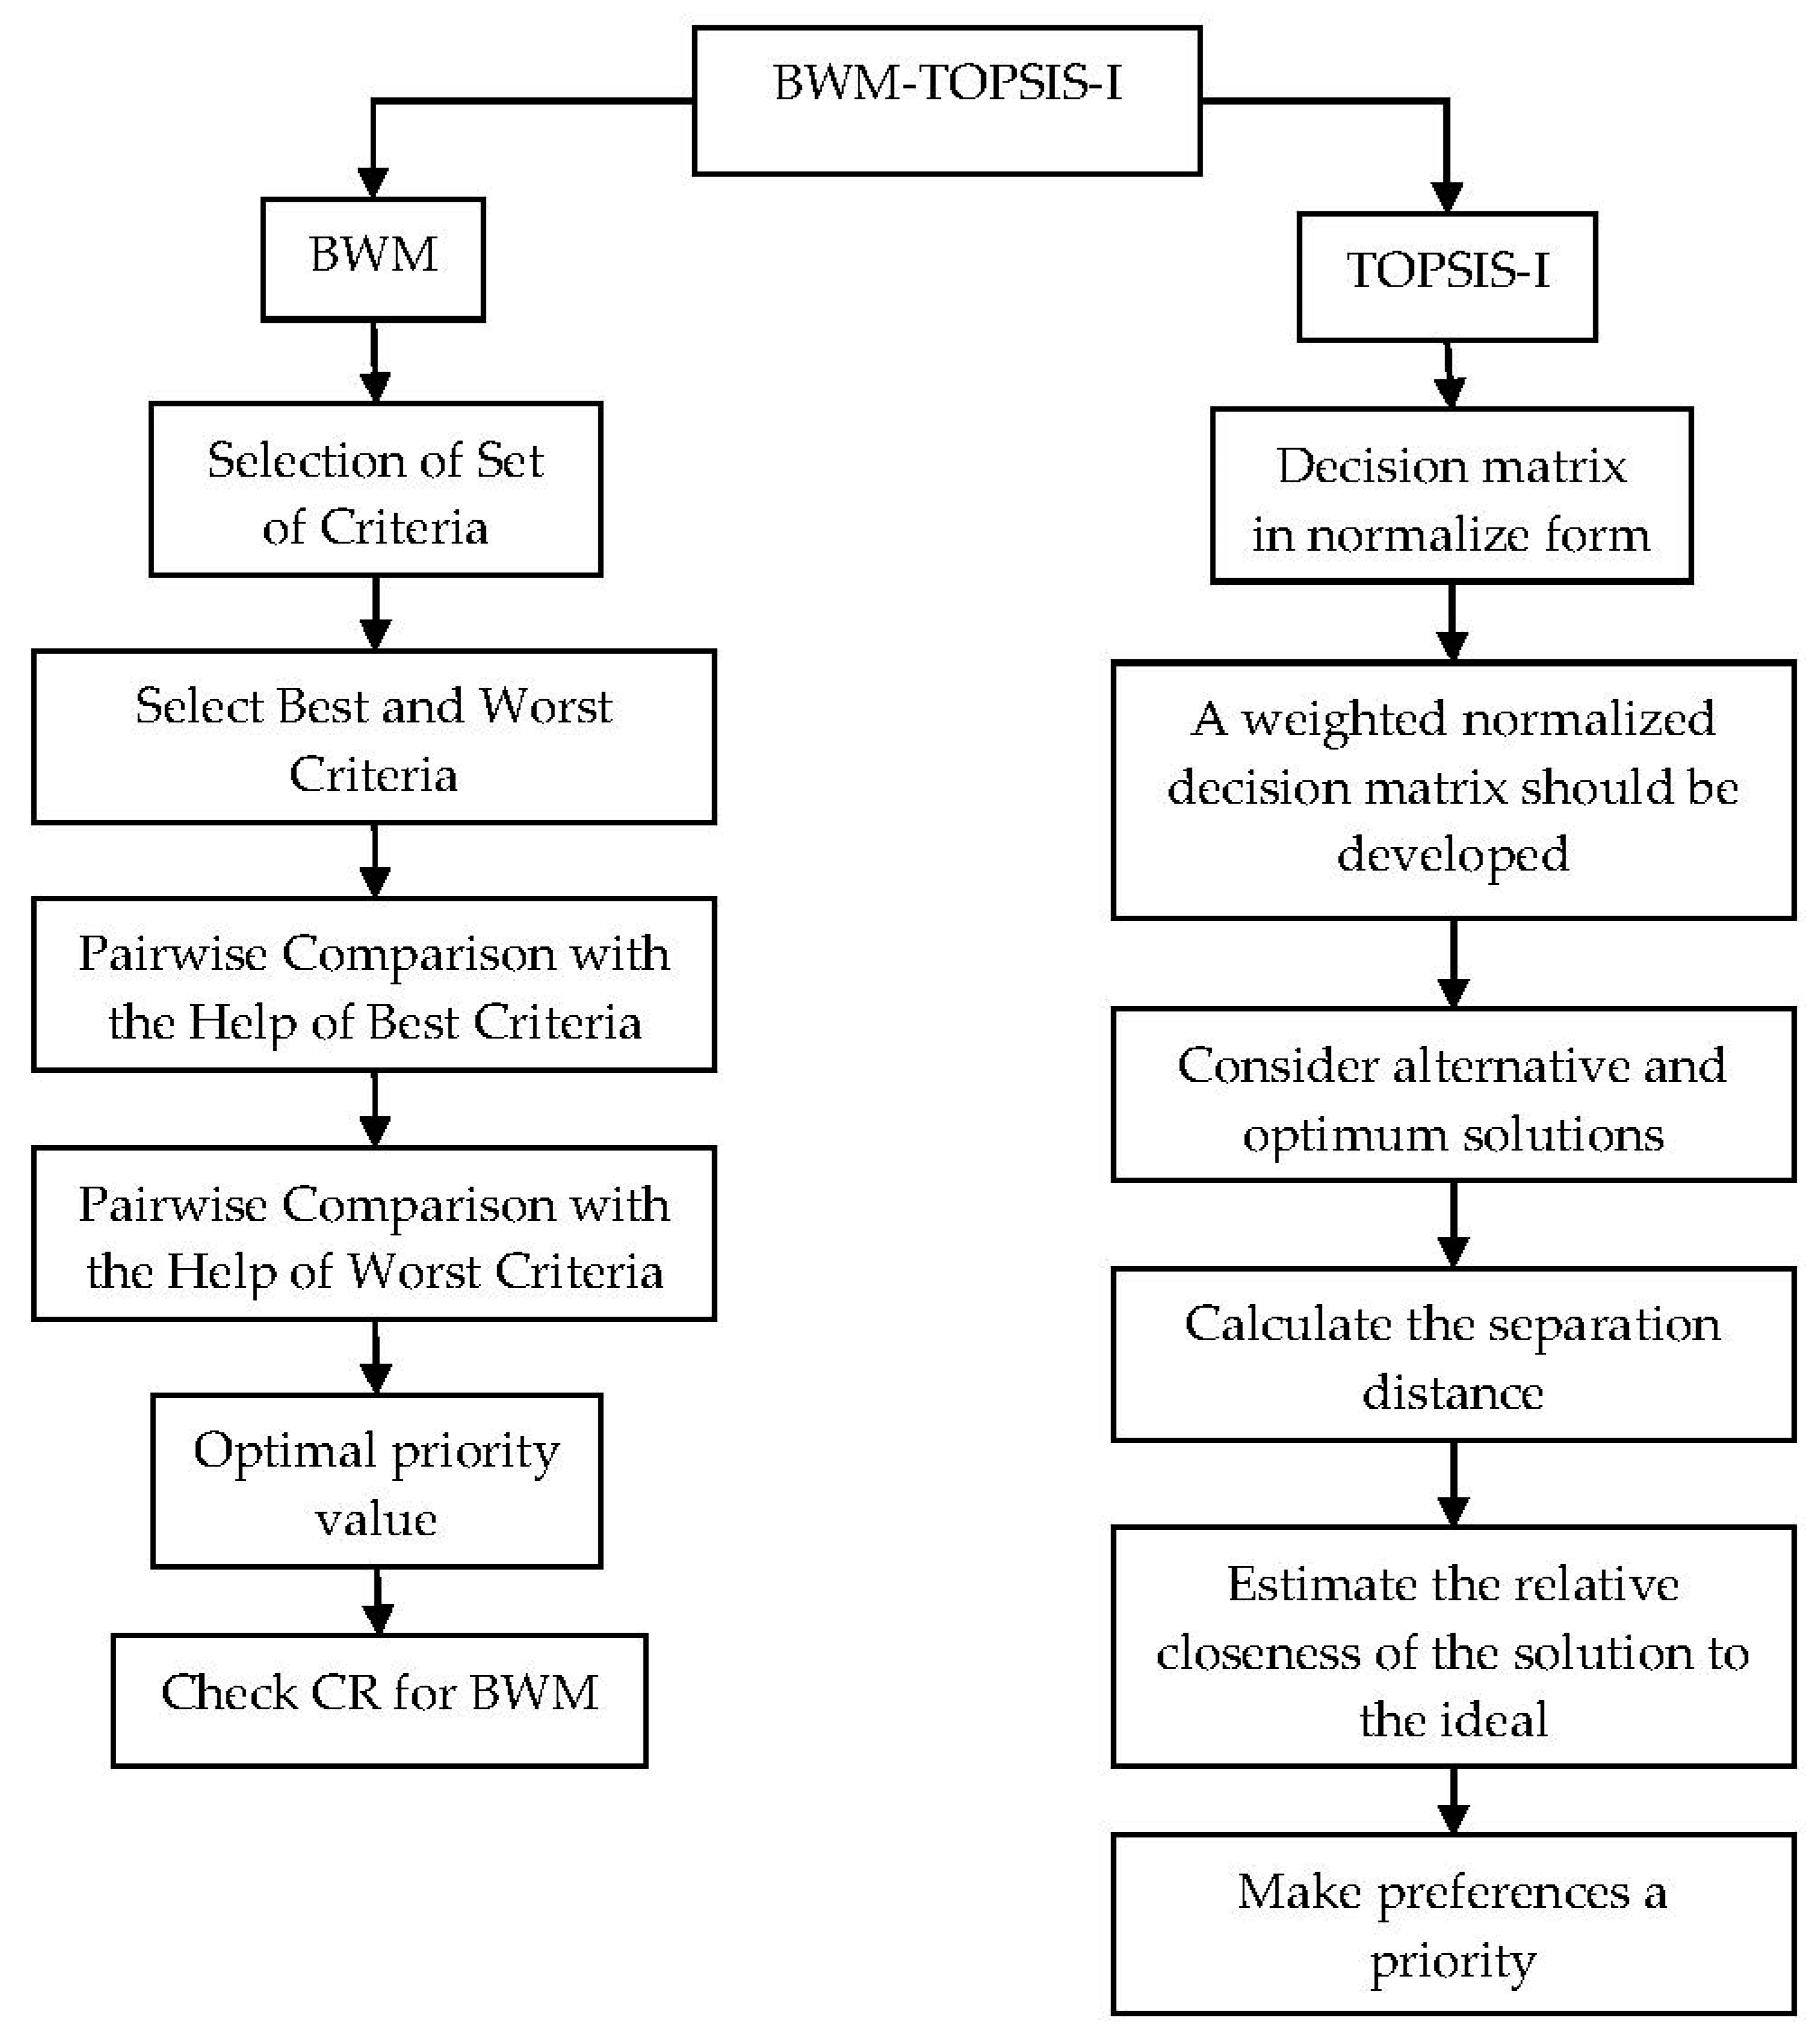
3. Methodology
3.1. BWM
3.2. TOPSIS-I
4. Application of the Model
4.1. Application of BWM
4.1.1. Application of BWM to Criteria
4.1.2. Application of BWM to Sub-Criteria
4.2. Deployment of TOPSIS-I
4.3. ModelValidation
4.3.1. Comparative Study
4.3.2. Scenario Analysis
5. Results and Discussion
5.1. Results and Discussion from BWM
5.2. Results and Discussion from TOPSIS-I
5.3. Comparative Study
5.4. Result from Sensitivity Testing
6. Discussion
6.1. Advantages of the Presented Model
- As a result of the more reliable comparisons provided by BWM-TOPSIS-I, the results obtained through this method are quite trustworthy. BWM-TOPSIS-I also uses a consistency ratio to determine whether comparisons are credible (unlike MCDM approaches such as TOPSIS-I).
- In contrast to matrix-based MCDM methods such as AHP, BWM uses vectors, so fewer comparisons are required. BWM-TOPSIS-I, for example, requires only 2n − 3 comparisons compared to TOPSIS-I’s n(n − 1)/2 comparisons.
6.2. Limitations of the Presented Model
- It is not always the interval’s center that represents the optimal weight coefficient. The interval’s right or left end may have a more important value. Interval PVs are much lower than optimal priority coefficient values when results are more inconsistent.
- The method does not ensure that if the number of participants increases or decreases, the ranking will remain the same.
7. Conclusions
Author Contributions
Funding
Institutional Review Board Statement
Informed Consent Statement
Data Availability Statement
Conflicts of Interest
References
- Rahman, A.; Aziz, T.; Deeba, S.R. A time of use tariff scheme for demand side management of residential energy consumers in Bangladesh. Energy Rep. 2021, 7, 3189–3198. [Google Scholar] [CrossRef]
- Rodrigues, E.; Gomes, Á.; Gaspar, A.R.; Antunes, C.H. Estimation of renewable energy and built environment-related variables using neural networks—A review. Renew. Sustain. Energy Rev. 2018, 94, 959–988. [Google Scholar] [CrossRef]
- Ma, S.; Chen, G.; Guo, M.; Zhao, L.; Han, T.; Zhu, S. Path analysis on CO2 resource utilization based on carbon capture using ammonia method in coal-fired power plants. Renew. Sustain. Energy Rev. 2014, 37, 687–697. [Google Scholar] [CrossRef]
- Maamoun, N.; Kennedy, R.; Jin, X.; Urpelainen, J. Identifying coal-fired power plants for early retirement. Renew. Sustain. Energy Rev. 2020, 126, 109833. [Google Scholar] [CrossRef]
- Yang, Y.; Campana, P.E.; Yan, J. Potential of unsubsidized distributed solar PV to replace coal-fired power plants, and profits classification in Chinese cities. Renew. Sustain. Energy Rev. 2020, 131, 109967. [Google Scholar] [CrossRef]
- Clark, R.; Zucker, N.; Urpelainen, J. The future of coal-fired power generation in Southeast Asia. Renew. Sustain. Energy Rev. 2020, 121, 109650. [Google Scholar] [CrossRef]
- Curtin, J.; McInerney, C.; Gallachóir, B.Ó.; Hickey, C.; Deane, P.; Deeney, P. Quantifying stranding risk for fossil fuel assets and implications for renewable energy investment: A review of the literature. Renew. Sustain. Energy Rev. 2019, 116, 109402. [Google Scholar] [CrossRef]
- Gürsan, C.; de Gooyert, V. The systemic impact of a transition fuel: Does natural gas help or hinder the energy transition? Renew. Sustain. Energy Rev. 2021, 138, 110552. [Google Scholar] [CrossRef]
- Renewables 2020. Global Status Report. REN21. Available online: https://www.ren21.net/wp-content/uploads/2019/05/gsr_2020_full_report_en.pdf (accessed on 20 August 2020).
- Ritchie, H.; Roser, M. Renewable Energy, Our World in Data. Available online: https://ourworldindata.org/renewable-energy (accessed on 20 October 2021).
- Balaban, G.; Lazaroiu, G.C.; Dumbrava, V.; Sima, C.A. Analysing renewable energy source impacts on power system national network code. Inventions 2017, 2, 23. [Google Scholar] [CrossRef]
- Todeschini, G. Review of tidal lagoon technology and opportunities for integration within the UK energy system. Inventions 2017, 2, 14. [Google Scholar] [CrossRef] [Green Version]
- Maroufmashat, A.; Taqvi, S.T.; Miragha, A.; Fowler, M.; Elkamel, A. Modeling and optimization of energy hubs: A comprehensive review. Inventions 2019, 4, 50. [Google Scholar] [CrossRef]
- Hu, J.; Liu, X.; Shahidehpour, M.; Xia, S. Optimal operation of energy hubs with large-scale distributed energy resources for distribution network congestion management. IEEE Trans. Sustain. Energy 2021, 12, 1755–1765. [Google Scholar] [CrossRef]
- Son, Y.G.; Oh, B.C.; Acquah, M.A.; Fan, R.; Kim, D.M.; Kim, S.Y. Multi energy system with an associated energy hub: A review. IEEE Access 2021, 9, 127753–127766. [Google Scholar] [CrossRef]
- Wang, G.; Sadiq, M.; Bashir, T.; Jain, V.; Ali, S.A.; Shabbir, M.S. The dynamic association between different strategies of renewable energy sources and sustainable economic growth under SDGs. Energy Strategy Rev. 2021, 42, 100886. [Google Scholar] [CrossRef]
- Zhao, J.; Patwary, A.K.; Qayyum, A.; Alharthi, M.; Bashir, F.; Mohsin, M.; Abbas, Q. The determinants of renewable energy sources for the fueling of green and sustainable economy. Energy 2022, 238, 122029. [Google Scholar] [CrossRef]
- Steve, Y.S.; Murad, A.B.; Gyamfi, B.A.; Bekun, F.V.; Uzuner, G. Renewable energy consumption a panacea for sustainable economic growth: Panel causality analysis for African blocs. Int. J. Green Energy 2022, 19, 847–856. [Google Scholar] [CrossRef]
- Sadiq, M.; Shinwari, R.; Wen, F.; Usman, M.; Hassan, S.T.; Taghizadeh-Hesary, F. Do globalization and nuclear energy intensify the environmental costs in top nuclear energy-consuming countries? Prog. Nucl. Energy 2023, 156, 104533. [Google Scholar] [CrossRef]
- Dashtaki, A.A.; Hakimi, S.M.; Hasankhani, A.; Derakhshani, G.; Abdi, B. Optimal management algorithm of microgrid connected to the distribution network considering renewable energy system uncertainties. Int. J. Electr. Power Energy Syst. 2023, 145, 108633. [Google Scholar] [CrossRef]
- Fakher, H.A.; Ahmed, Z.; Acheampong, A.O.; Nathaniel, S.P. Renewable energy, nonrenewable energy, and environmental quality nexus: An investigation of the N-shaped Environmental Kuznets Curve based on six environmental indicators. Energy 2023, 263, 125660. [Google Scholar] [CrossRef]
- Arrafi, M.; Awolusi, I.; Dessouky, S.; Sulbaran, T. Comparative Analysis of Energy Harvesting Methods in Transportation. In Canadian Society of Civil Engineering Annual Conference; Springer: Singapore, 2023; pp. 553–563. [Google Scholar]
- Kamali Saraji, M.; Streimikiene, D.; Ciegis, R. A novel Pythagorean fuzzy-SWARA-TOPSIS framework for evaluating the EU progress towards sustainable energy development. Environ. Monit. Assess. 2022, 194, 1–19. [Google Scholar] [CrossRef]
- Bilgili, F.; Zarali, F.; Ilgün, M.F.; Dumrul, C.; Dumrul, Y. The evaluation of renewable energy alternatives for sustainable development in Turkey using intuitionistic fuzzy-TOPSIS method. Renew. Energy 2022, 189, 1443–1458. [Google Scholar] [CrossRef]
- Huang, H.; Shi, C. Analysis of the Path Optimization of the Sustainable Development of Coal-Energy Cities Based on TOPSIS Evaluation Model. Energies 2023, 16, 857. [Google Scholar] [CrossRef]
- Chen, C.C.; Sukarsono, F.M.; Wu, K.J. Evaluating a sustainable circular economy model for the Indonesian fashion industry under uncertainties: A hybrid decision-making approach. J. Ind. Prod. Eng. 2023, 40, 1–17. [Google Scholar] [CrossRef]
- Omidi, L.; Salehi, V.; Zakerian, S.A.; Nasl Saraji, J. Assessing the influence of safety climate-related factors on safety performance using an Integrated Entropy-TOPSIS Approach. J. Ind. Prod. Eng. 2022, 39, 73–82. [Google Scholar] [CrossRef]
- Hwang, C.L.; Yoon, K. Methods for multiple attribute decision making. In Multiple Attribute Decision Making; Springer: Berlin/Heidelberg, Germany, 1981; pp. 58–191. [Google Scholar]
- Opricovic, S.; Tzeng, G.H. Compromise solution by MCDM methods: A comparative analysis of VIKOR and TOPSIS. Eur. J. Oper. Res. 2004, 156, 445–455. [Google Scholar] [CrossRef]
- Majumder, P.; Saha, A.K. A new TOPSIS-based approach to evaluate the economic indicators in the healthcare system and the impact of biotechnology. In Translational Biotechnology; Academic Press: Cambridge, MA, USA, 2021; pp. 407–419. [Google Scholar]
- Majumder, P.; Biswas, P.; Majumder, S. Application of New TOPSIS Approach to Identify the Most Significant Risk Factor and Continuous Monitoring of Death of COVID-19. Electron. J. Gen. Med. 2020, 17, em234. [Google Scholar] [CrossRef]
- Rezaei, J. Best-worst multi-criteria decision-making method. Omega 2015, 53, 49–57. [Google Scholar] [CrossRef]
- Pohekar, S.D.; Ramachandran, M. Application of multi-criteria decision making to sustainable energy planning—A review. Renew. Sustain. Energy Rev. 2004, 8, 365–381. [Google Scholar] [CrossRef]
- Assadi, M.R.; Ataebi, M.; sadatAtaebi, E.; Hasani, A. Prioritization of renewable energy resources based on sustainable management approach using simultaneous evaluation of criteria and alternatives: A case study on Iran’s electricity industry. Renew. Energy 2022, 181, 820–832. [Google Scholar] [CrossRef]
- Samour, A.; Baskaya, M.M.; Tursoy, T. The impact of financial development and FDI on renewable energy in the UAE: A path towards sustainable development. Sustainability 2022, 14, 1208. [Google Scholar] [CrossRef]
- Suki, N.M.; Suki, N.M.; Sharif, A.; Afshan, S.; Jermsittiparsert, K. The role of technology innovation and renewable energy in reducing environmental degradation in Malaysia: A step towards sustainable environment. Renew. Energy 2022, 182, 245–253. [Google Scholar] [CrossRef]
- Zakari, A.; Khan, I.; Tan, D.; Alvarado, R.; Dagar, V. Energy efficiency and sustainable development goals (SDGs). Energy 2022, 239, 122365. [Google Scholar] [CrossRef]
- Amjith, L.R.; Bavanish, B. A review on biomass and wind as renewable energy for sustainable environment. Chemosphere 2022, 293, 133579. [Google Scholar] [CrossRef] [PubMed]
- Rahman, A.; Farrok, O.; Haque, M.M. Environmental impact of renewable energy source based electrical power plants: Solar, wind, hydroelectric, biomass, geothermal, tidal, ocean, and osmotic. Renew. Sustain. Energy Rev. 2022, 161, 112279. [Google Scholar] [CrossRef]
- Anser, M.K.; Usman, M.; Sharif, M.; Bashir, S.; Shabbir, M.S.; Yahya Khan, G.; Lopez, L.B. The dynamic impact of renewable energy sources on environmental economic growth: Evidence from selected Asian economies. Environ. Sci. Pollut. Res. 2022, 29, 3323–3335. [Google Scholar] [CrossRef] [PubMed]
- Ahmed, Z.; Ahmad, M.; Rjoub, H.; Kalugina, O.A.; Hussain, N. Economic growth, renewable energy consumption, and ecological footprint: Exploring the role of environmental regulations and democracy in sustainable development. Sustain. Dev. 2022, 30, 595–605. [Google Scholar] [CrossRef]
- Serag, S.; Echchelh, A. Technical and economic study for electricity production by concentrated solar energy and hydrogen storage. Technol. Econ. Smart Grids Sustain. Energy 2022, 7, 30. [Google Scholar] [CrossRef]
- Chopra, R.; Magazzino, C.; Shah, M.I.; Sharma, G.D.; Rao, A.; Shahzad, U. The role of renewable energy and natural resources for sustainable agriculture in ASEAN countries: Do carbon emissions and deforestation affect agriculture productivity? Resour. Policy 2022, 76, 102578. [Google Scholar] [CrossRef]
- Al-Thani, H.; Koç, M.; Isaifan, R.J.; Bicer, Y. A Review of the Integrated Renewable Energy Systems for Sustainable Urban Mobility. Sustainability 2022, 14, 10517. [Google Scholar] [CrossRef]
- Hailemariam, A.; Ivanovski, K.; Dzhumashev, R. Does R&D investment in renewable energy technologies reduce greenhouse gas emissions? Appl. Energy 2022, 327, 120056. [Google Scholar]
- Wang, Q.; Guo, J.; Li, R.; Jiang, X.T. Is nuclear power a cost-effective energy transition option? Comparative study on the impact of coal, oil, gas, renewable and nuclear power on economic growth and carbon emissions. Environ. Res. 2023, 221, 115290. [Google Scholar] [CrossRef] [PubMed]
- Chia, S.R.; Nomanbhay, S.; Ong, M.Y.; Chew, K.W.; Show, P.L. Renewable diesel as fossil fuel substitution in Malaysia: A review. Fuel 2022, 314, 123137. [Google Scholar] [CrossRef]
- Saaty, T.L. Analytic Hierarchy Process; McGraw-Hill: New York, NY, USA, 1980. [Google Scholar]
- You, P.; Guo, S.; Zhao, H.; Zhao, H. Operation performance evaluation of power grid enterprise using a hybrid BWM-TOPSIS method. Sustainability 2017, 9, 2329. [Google Scholar] [CrossRef]
- Hamby, D.M. A review of techniques for parameter sensitivity analysis of environmental models. Environ. Monit. Assess. 1994, 32, 135–154. [Google Scholar] [CrossRef] [PubMed]
- Liu, M.; Li, Y.; Xu, Y.; Chen, L.; Wang, Q.; Ma, Q.; Yuan, X. A multi-criteria group decision making framework for sustainability evaluation of sintering flue gas treatment technologies in the iron and steel industry. J. Clean. Prod. 2023, 389, 136048. [Google Scholar] [CrossRef]
- Fetanat, A.; Tayebi, M. Industrial filtration technologies selection for contamination control in natural gas processing plants: A sustainability and maintainability-based decision support system under q-rung orthopair fuzzy set. Process Saf. Environ. Prot. 2023, 170, 310–327. [Google Scholar] [CrossRef]


| Full Form | Short Form/Acronym/Abbreviation |
|---|---|
| Analytic Hierarchy Process | AHP |
| Analytic Hierarchy Process Technique for Order Preference by Similarities to Ideal Solution-I | AHP-TOPSIS-I |
| Augmented Mean Group | AMG |
| BestWorst Method | BWM |
| BestWorst Method Technique for Order Preference by Similarities to Ideal Solution-I | BWM-TOPSIS-I |
| Carbon Dioxide | CO2 |
| Common Correlated Effects Mean Group | CCEMG |
| Consistency Ratio | CR |
| Consistency Index | CI |
| Data Envelopment Analysis | DEA |
| Decision Making Trial And Evaluation Laboratory | DEMATEL |
| Decision Making Trial And Evaluation Laboratory Technique For Order Preference By Similarities To Ideal Solution-I | DEMATEL-TOPSIS-i |
| Distributed Generation | DG |
| Full Consistency Method | FUCOM |
| Full Consistency Method Technique for Order Preference by Similarities to Ideal Solution-I | FUCOM-TOPSIS-I |
| Maintenance and Operations Cost | M&O Cost |
| Microgrid | MG |
| Multiple-Criteria Decision Analysis | MCDA |
| Multi-Criteria Decision Making | MCDM |
| Priority Value | PV |
| Priority Values | PVs |
| Preference Ranking for Organization Method for Enrichment Evaluation | PROMETHEE |
| Renewable Energy Source | RES |
| Simple Additive Weighting | SAW |
| Simple Multi-Attribute Rating technique | SMART |
| Strength, Weakness, Opportunity, and Threat | SWOT |
| Sustainable Development Goal Seven | SDG-7 |
| Technique for Order Preference by Similarities to Ideal Solution | TOPSIS |
| Technique for Order Preference by Similarities to Ideal Solution-I | TOPSIS-I |
| Vlse Kriterijumska Optimizacija Kompromisno Resenje | VIKOR |
| Weighted Sum Model | WSM |
| Weighted Sum Model Technique For Order Preference by Similarities to Ideal Solution-I | WSM-TOPSIS-I |
| 1 | 0.00 |
| 2 | 0.44 |
| 3 | 1.00 |
| 4 | 1.63 |
| 5 | 2.30 |
| 6 | 3.00 |
| 7 | 3.73 |
| 8 | 4.47 |
| 9 | 5.23 |
| Criteria | |
| Technical [34] | As a result of this advancement, several technological innovations that can enhance renewable energy sources have been developed. For example, artificial-intelligence-controlled robots are used to monitor and improve the efficiency of hydropower plants and reduce maintenance costs. A hybrid hydropower and battery system is being developed to enhance grid services, and a “hyperloop for fish” is being developed to safely transport fish over dams. |
| Economic [35] | Electricity production costs are reduced when fuel costs are reduced. Additionally, electricity does not change in price as a result of changes in fuel prices, unlike natural gas or coal. There might be a decrease in energy prices over time as a result of this. |
| Environmental [36] | RESs, such as wind and hydropower, as well as solar, are considered sustainable because they have little negative impact on the environment and are widely available. |
| Sub-Criteria | |
| Efficiency [37] | The energy efficiency of an economy is influenced by a variety of factors. This reduces carbon emissions, which in turn reduces climate change. Additionally, it creates jobs that lower poverty and improve sustainable livelihoods. |
| Life Time [38] | There are many environmental issues directly related to the production and consumption of energy, including air pollution, water pollution, climate change, waste disposal, and thermal pollution. Fossil fuel combustion is the primary cause of urban air pollution. |
| Plant Factor [39] | Water and oxygen are created by plants, while CO2 is converted into chemical energy in the form of glucose. As our climate changes, plants provide energy, trap CO2, and maintain breathable air quality in a world threatened by climate change. |
| Per Unit Cost [40] | The most adverse effect on energy sustainability was caused by an increase in coal prices, whereas the least adverse effect was caused by an increase in solar energy prices. Gas prices are unaffected by an increase, but gasoline prices are positively affected by an increase. |
| Fuel Cost [41] | When fossil fuels are burned, massive amounts of carbon dioxide are released into the atmosphere. In our atmosphere, greenhouse gases trap heat, causing global warming. |
| O&M Cost [42] | According to the Paris Agreement, significant investments are needed in solar photovoltaics and wind turbines. In order to describe workable transition pathways and identify necessary support measures, it is crucial to understand their cost reduction dynamics. In previous studies, the majority of the focus was on developing and installing equipment. |
| CO2 Emissions [43] | There is a bidirectional causal link between energy use and CO2 emissions. Energy use results in CO2 emissions in the short term, suggesting that higher energy use could result in higher CO2 emissions in the long run. |
| Land Requirement [38] | A sustainable energy system requires a balance between economic growth, environmental protection, and energy security. A key component of this is energy systems, which are based on the three key principles of energy security, social equality, and environmental protection. |
| NOx Emissions [44] | A person’s respiratory system can be adversely affected by increased nitrogen dioxide levels, making them more vulnerable to respiratory infections and asthma. When nitrogen dioxide concentrations are high, chronic lung disease can develop. |
| Alternatives | |
| Hydro [39] | As part of the Sustainable Development Goals, renewables are supposed to make up more of the world’s energy mix by 2030. There are major implications associated with the growth of hydropower on an international scale. |
| Gas [45] | Despite not being as clean as wind or solar electricity, natural gas is the cleanest fossil fuel. The transition to a greener future is widely believed to be aided by natural gas. Natural gas is primarily generated domestically in the United States, according to the Energy Information Administration. |
| Coal [46] | It is not possible to use fossil fuels such ascoal, natural gas, and others in a safe or sustainable manner. It is not recommended that they be applied. Natural gas, coal, and oil are fossil fuels that were formed by the decay of living organisms over time. Over twothirds of our electricity is generated by them in the US, so they provide most of our energy needs. |
| Solar [39] | Solar and wind power are examples of renewable energy sources that continuously and organically replenish themselves. Renewable energy is also known as sustainable energy. |
| Diesel [47] | Contributes to climate action and environmental stewardship by reducing greenhouse gas emissions, shrinking our water footprint, and increasing reuse and recycling rates. |
| Best Compared to Others | Technical | Economic | Environmental |
|---|---|---|---|
| Technical | 1 | 6 | 3 |
| Others Compared to the Worst | Economic |
|---|---|
| Technical | 6 |
| Economic | 1 |
| Environmental | 4 |
| BestComparedto Others | Efficiency | Life Time | Plant Factor | Per Unit Cost | Fuel Cost | O&M Cost | CO2 Emissions | Land Requirement | NOx Emissions |
|---|---|---|---|---|---|---|---|---|---|
| Efficiency | 1 | 3 | 2 | 4 | 5 | 9 | 8 | 7 | 6 |
| Others Compared to the Worst | O&M Cost |
|---|---|
| Efficiency | 9 |
| Life Time | 3 |
| Plant Factor | 2 |
| Per Unit Cost | 4 |
| Fuel Cost | 5 |
| O&M Cost | 9 |
| CO2 Emissions | 8 |
| Land Requirement | 7 |
| NOx Emissions | 6 |
| Alternative | Efficiency | Life Time | Plant Factor | Per Unit Cost | Fuel Cost | O&M Cost | CO2 Emissions | Land Requirement | NOx Emissions |
|---|---|---|---|---|---|---|---|---|---|
| Gas | 5 | 3 | 5 | 4 | 3 | 5 | 4 | 3 | 5 |
| Solar | 4 | 4 | 4 | 3 | 4 | 5 | 4 | 4 | 5 |
| Diesel | 2 | 4 | 5 | 2 | 3 | 4 | 3 | 3 | 4 |
| Hydro | 3 | 2 | 3 | 3 | 2 | 3 | 5 | 2 | 3 |
| Coal | 1 | 3 | 2 | 4 | 3 | 3 | 1 | 3 | 4 |
| Criteria | PV | Sub-Criteria | PV |
|---|---|---|---|
| Technical | 0.655 | Efficiency | 0.215 |
| Economic | 0.091 | Life Time | 0.143 |
| Environmental | 0.255 | Plant Factor | 0.215 |
CI = 3.00 CR = 0.109/3 = 0.0263 | Per Unit Cost | 0.107 | |
| Fuel Cost | 0.086 | ||
| O&M Cost | 0.048 | ||
| CO2 Emissions | 0.054 | ||
| Land Requirement | 0.061 | ||
| NOx Emissions | 0.072 | ||
CI = 5.23 CR = 0.215/5.23 = 0.0411 | |||
| Alternatives | Rank | |||
|---|---|---|---|---|
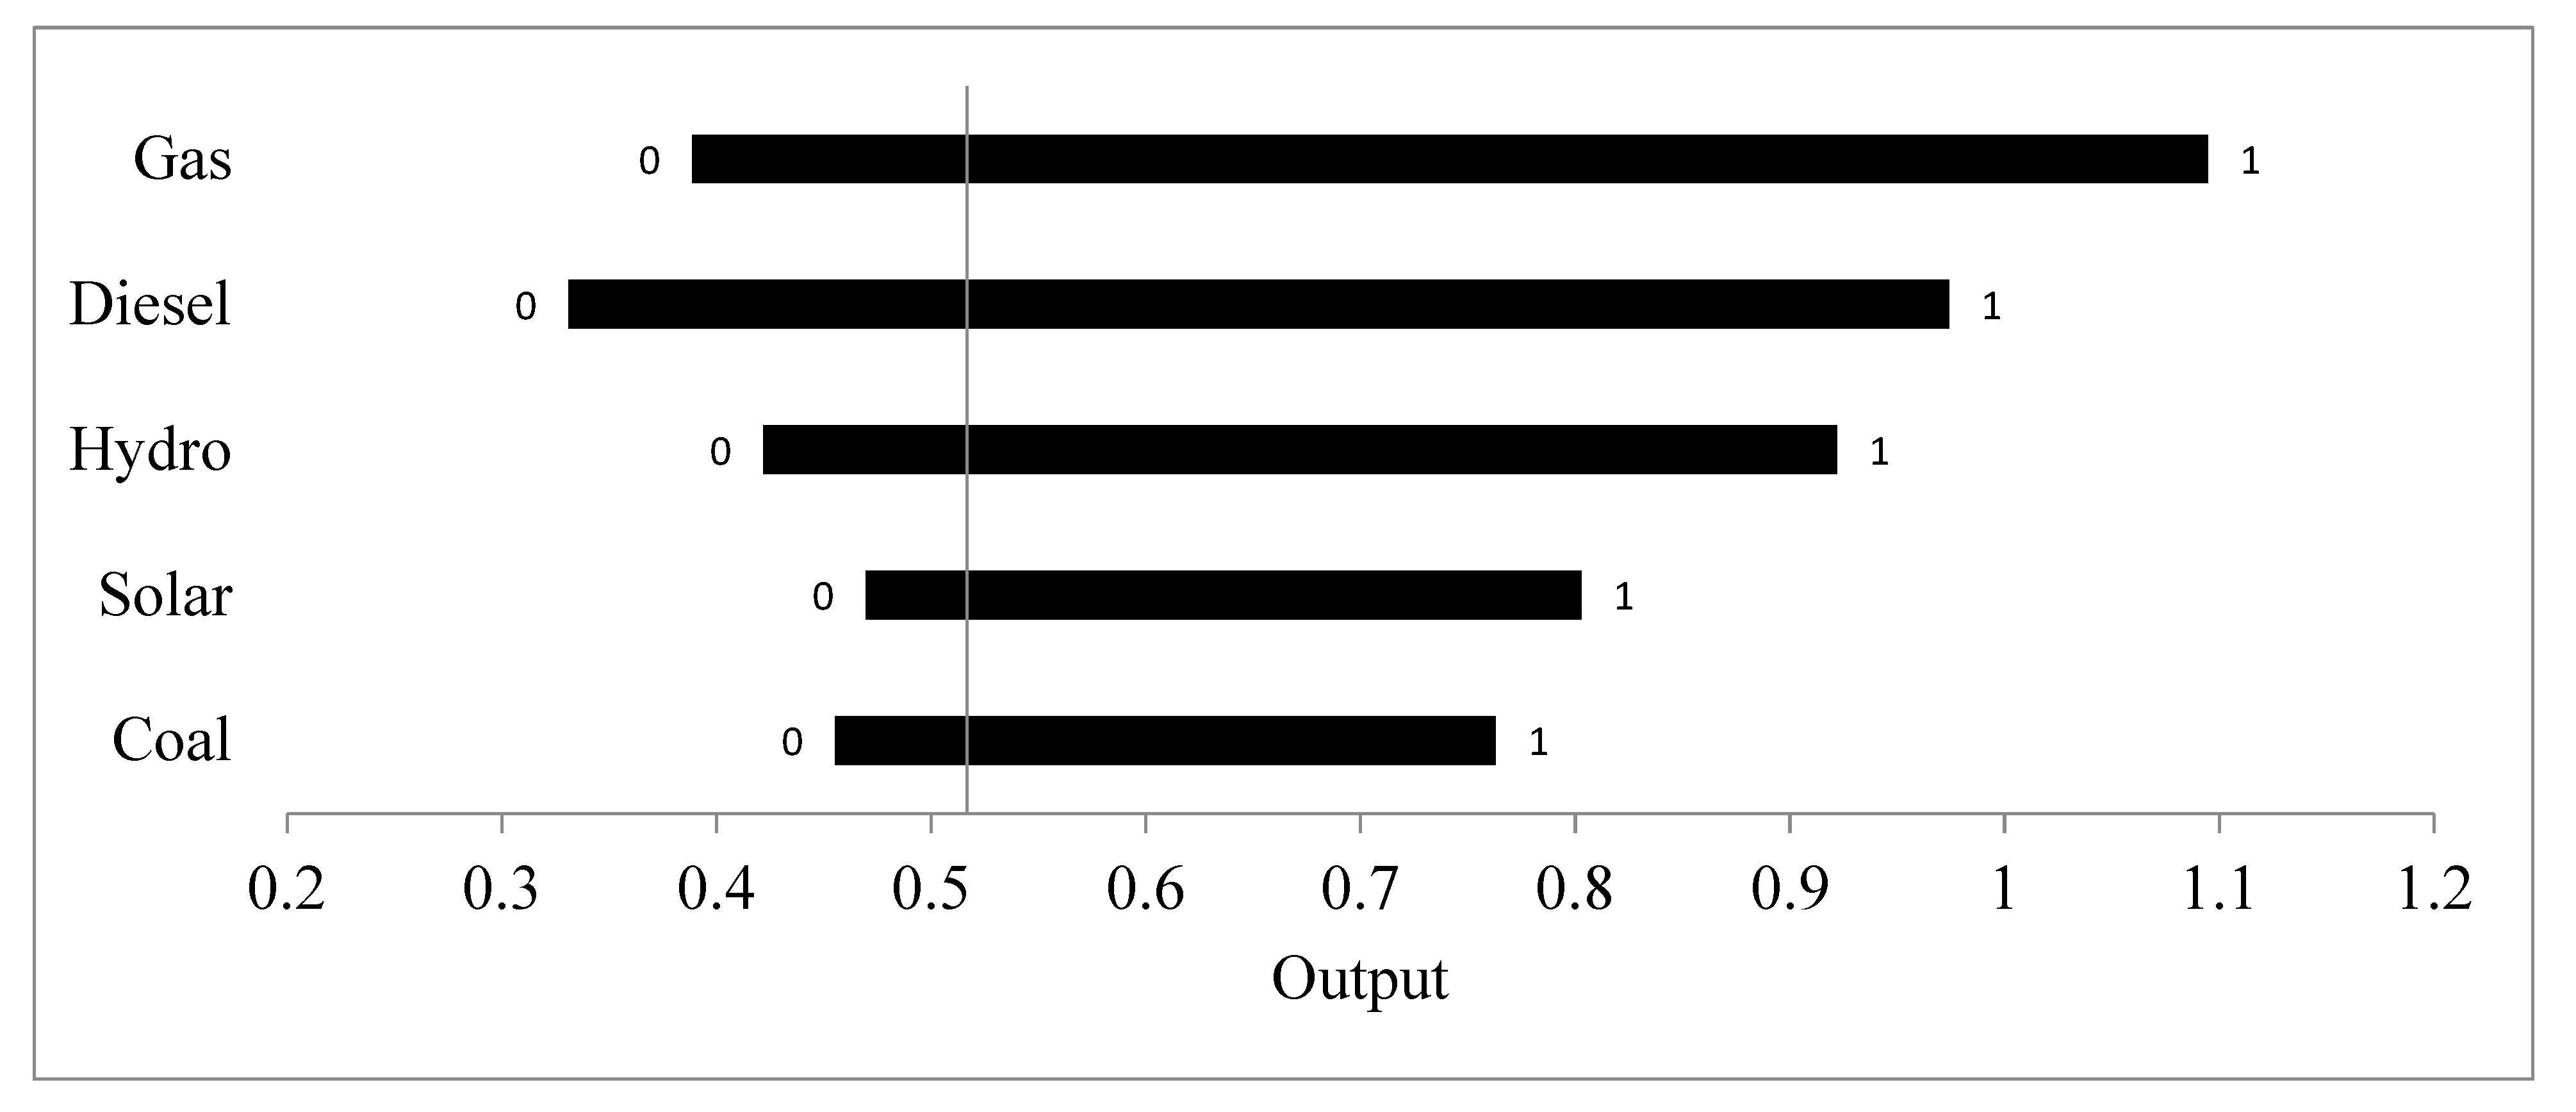
| Gas | 0.358 | 0.859 | 0.706 | 1 |
| Solar | 0.358 | 0.644 | 0.643 | 2 |
| Diesel | 0.644 | 0.286 | 0.308 | 5 |
| Hydro | 0.429 | 0.429 | 0.5 | 3 |
| Coal | 0.859 | 0.429 | 0.333 | 4 |
| Alternative | Proposed Method | AHP-TOPSIS | AHP-TOPSIS-I | BWM-TOPSIS | ||||
|---|---|---|---|---|---|---|---|---|
| Rank | Rank | Rank | Rank | |||||
| Gas | 0.706 | 1 | 0.692 | 1 | 0.701 | 1 | 0.728 | 1 |
| Solar | 0.643 | 2 | 0.631 | 2 | 0.652 | 2 | 0.643 | 2 |
| Diesel | 0.308 | 5 | 0.301 | 4 | 0.297 | 5 | 0.359 | 5 |
| Hydro | 0.5 | 3 | 0.433 | 3 | 0.511 | 3 | 0.47 | 3 |
| Coal | 0.333 | 4 | 0.292 | 5 | 0.312 | 4 | 0.381 | 4 |
Disclaimer/Publisher’s Note: The statements, opinions and data contained in all publications are solely those of the individual author(s) and contributor(s) and not of MDPI and/or the editor(s). MDPI and/or the editor(s) disclaim responsibility for any injury to people or property resulting from any ideas, methods, instructions or products referred to in the content. |
© 2023 by the authors. Licensee MDPI, Basel, Switzerland. This article is an open access article distributed under the terms and conditions of the Creative Commons Attribution (CC BY) license (https://creativecommons.org/licenses/by/4.0/).
Share and Cite
Alshamrani, A.; Majumder, P.; Das, A.; Hezam, I.M.; Božanić, D. An Integrated BWM-TOPSIS-I Approach to Determine the Ranking of Alternatives and Application of Sustainability Analysis of Renewable Energy. Axioms 2023, 12, 159. https://doi.org/10.3390/axioms12020159
Alshamrani A, Majumder P, Das A, Hezam IM, Božanić D. An Integrated BWM-TOPSIS-I Approach to Determine the Ranking of Alternatives and Application of Sustainability Analysis of Renewable Energy. Axioms. 2023; 12(2):159. https://doi.org/10.3390/axioms12020159
Chicago/Turabian StyleAlshamrani, Ahmad, Priyanka Majumder, Amrit Das, Ibrahim M. Hezam, and Darko Božanić. 2023. "An Integrated BWM-TOPSIS-I Approach to Determine the Ranking of Alternatives and Application of Sustainability Analysis of Renewable Energy" Axioms 12, no. 2: 159. https://doi.org/10.3390/axioms12020159