

A Study on the Beech Wood Machining Parameters Optimization Using Response Surface Methodology


Abstract
:1. Introduction
2. Materials and Methods
2.1. Test Materials and Conditions
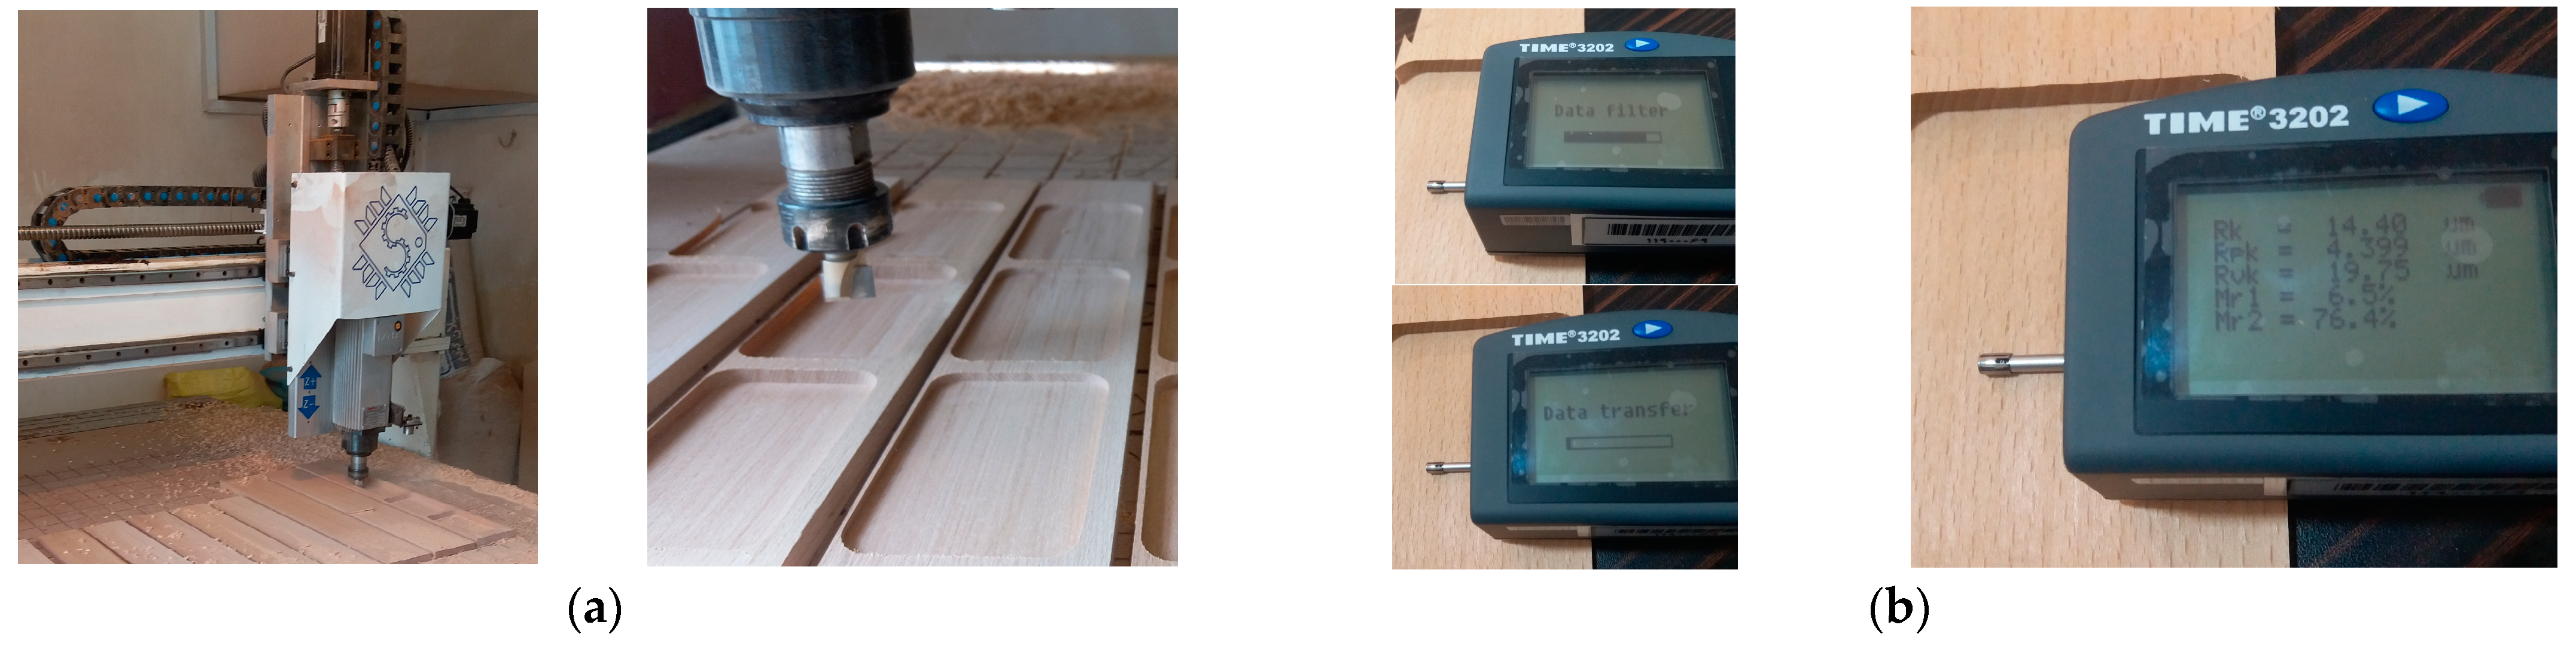
2.2. Experimentation
2.3. Response Surface Analysis
2.4. Variance Analysis
3. Results and Discussions
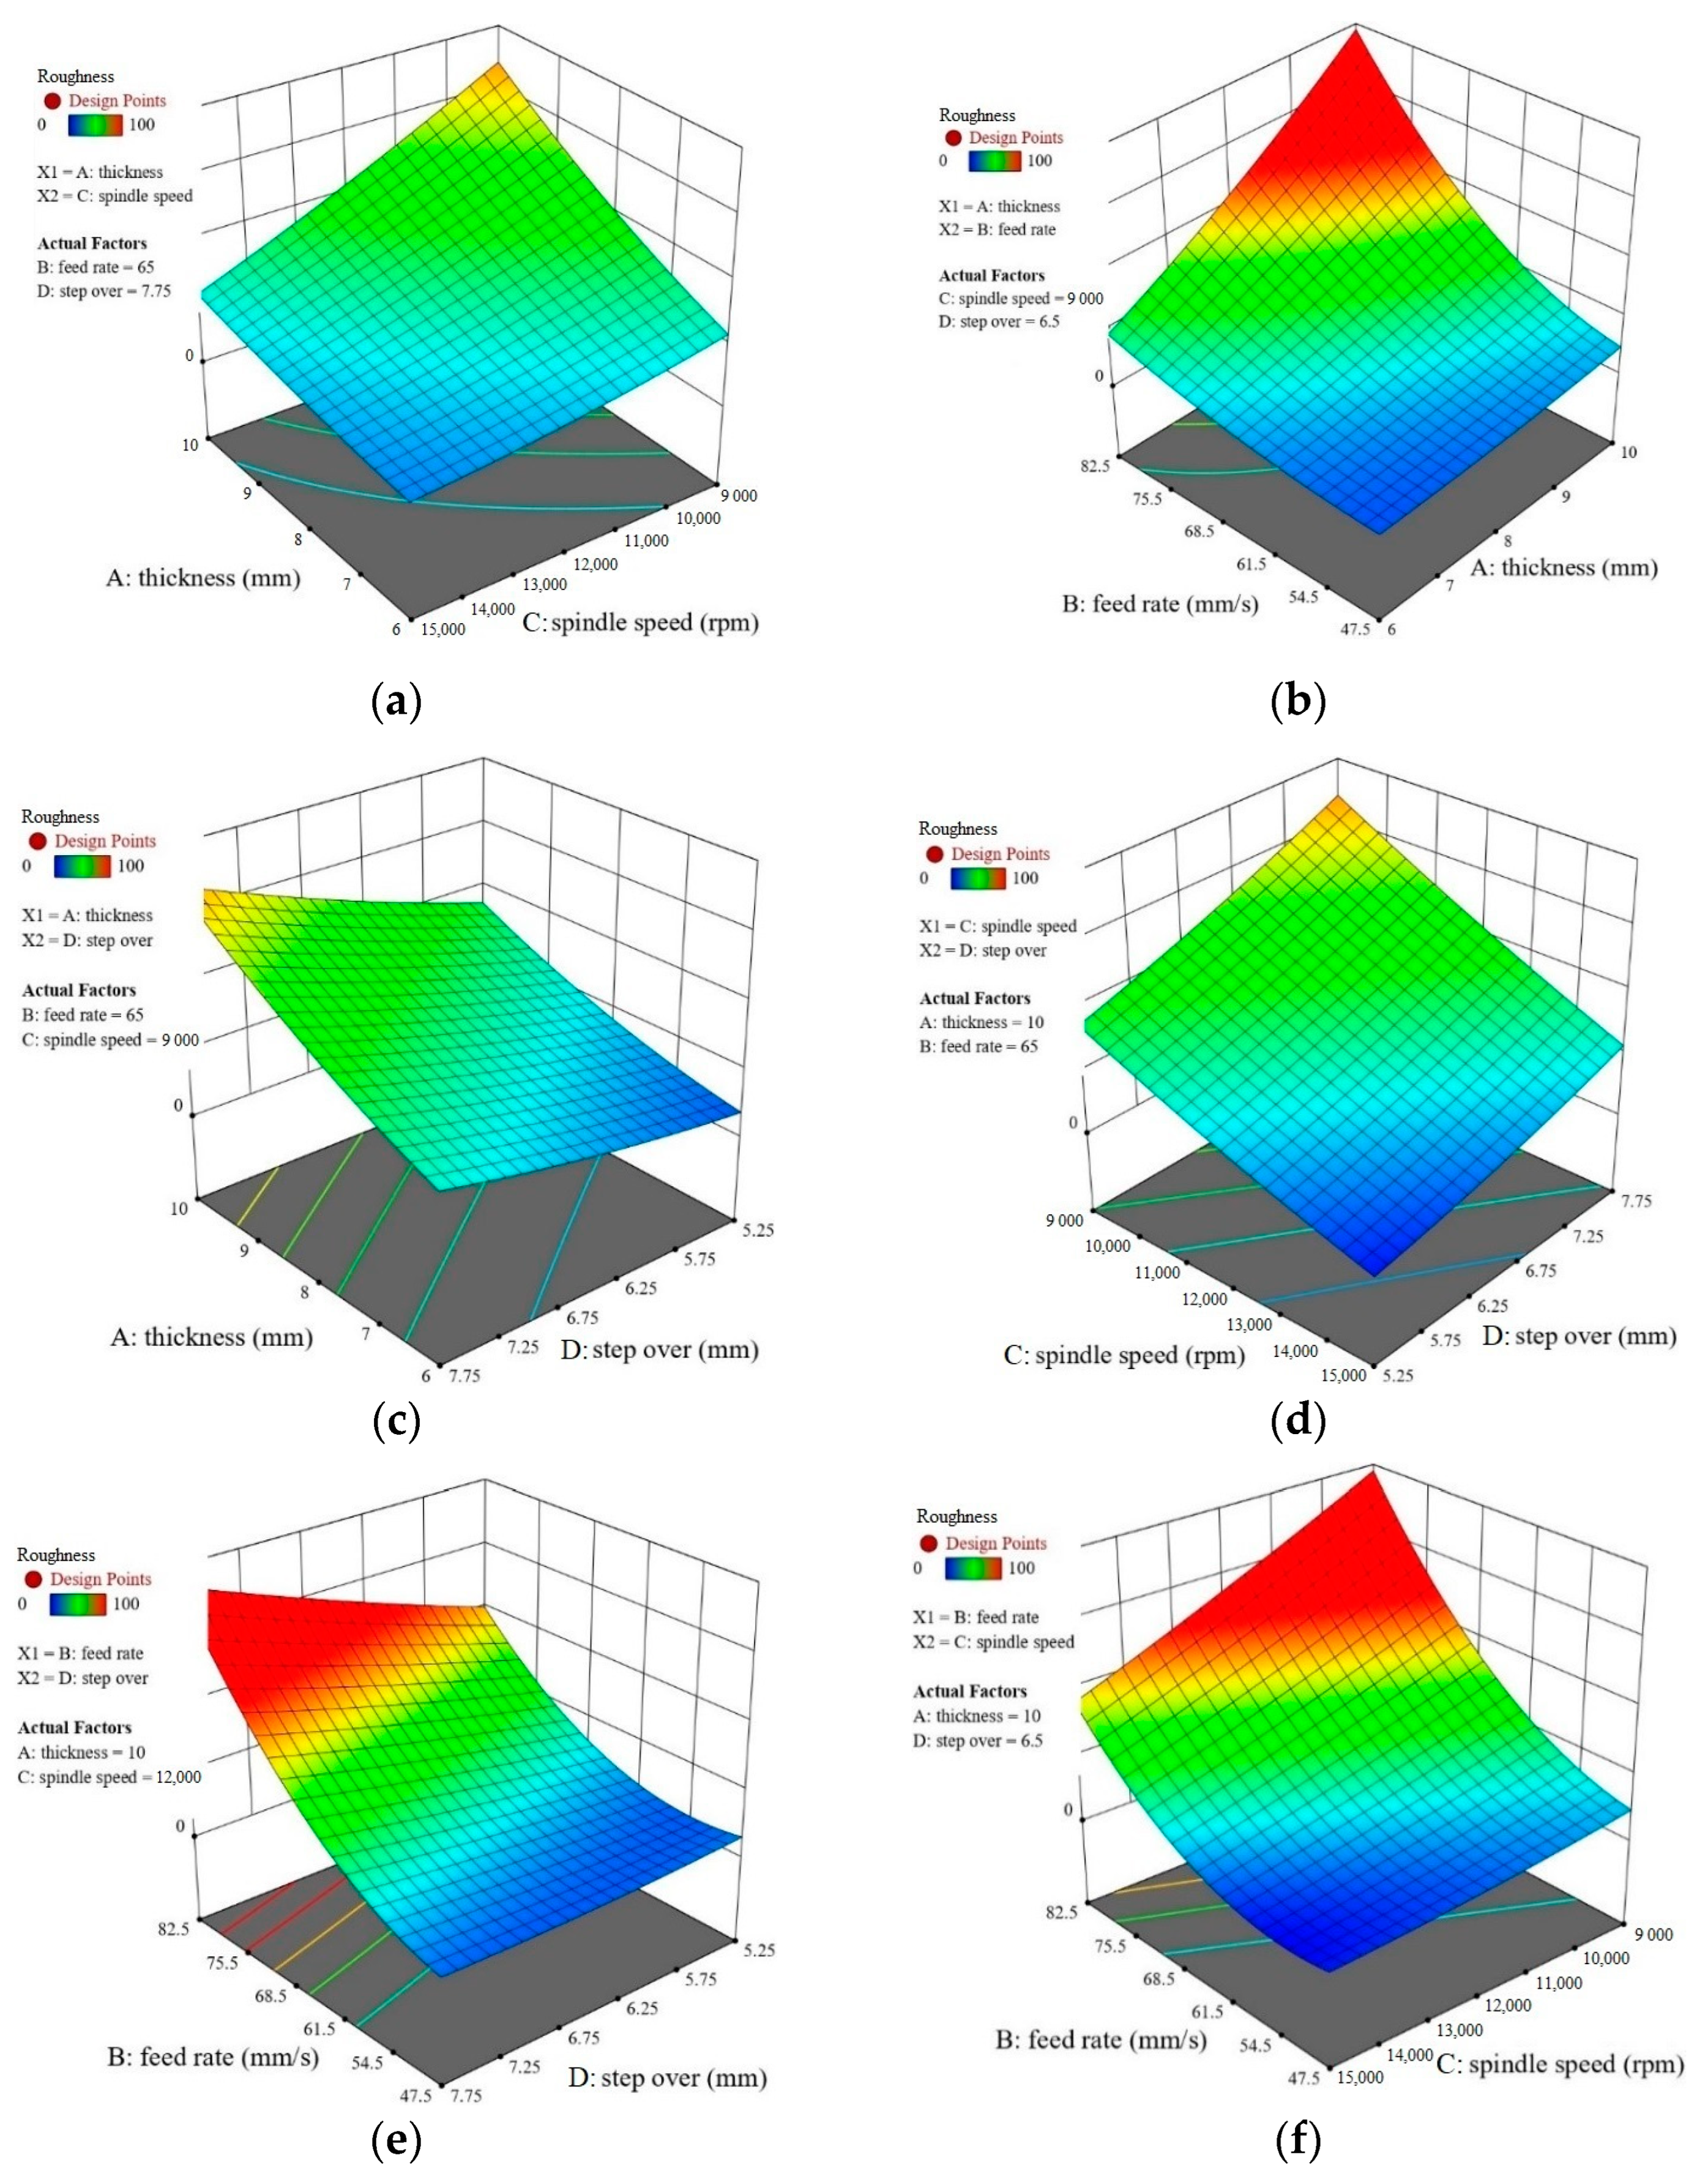
3.1. The Effect of Different Machining Parameters on Surface Roughness of Beech Wood
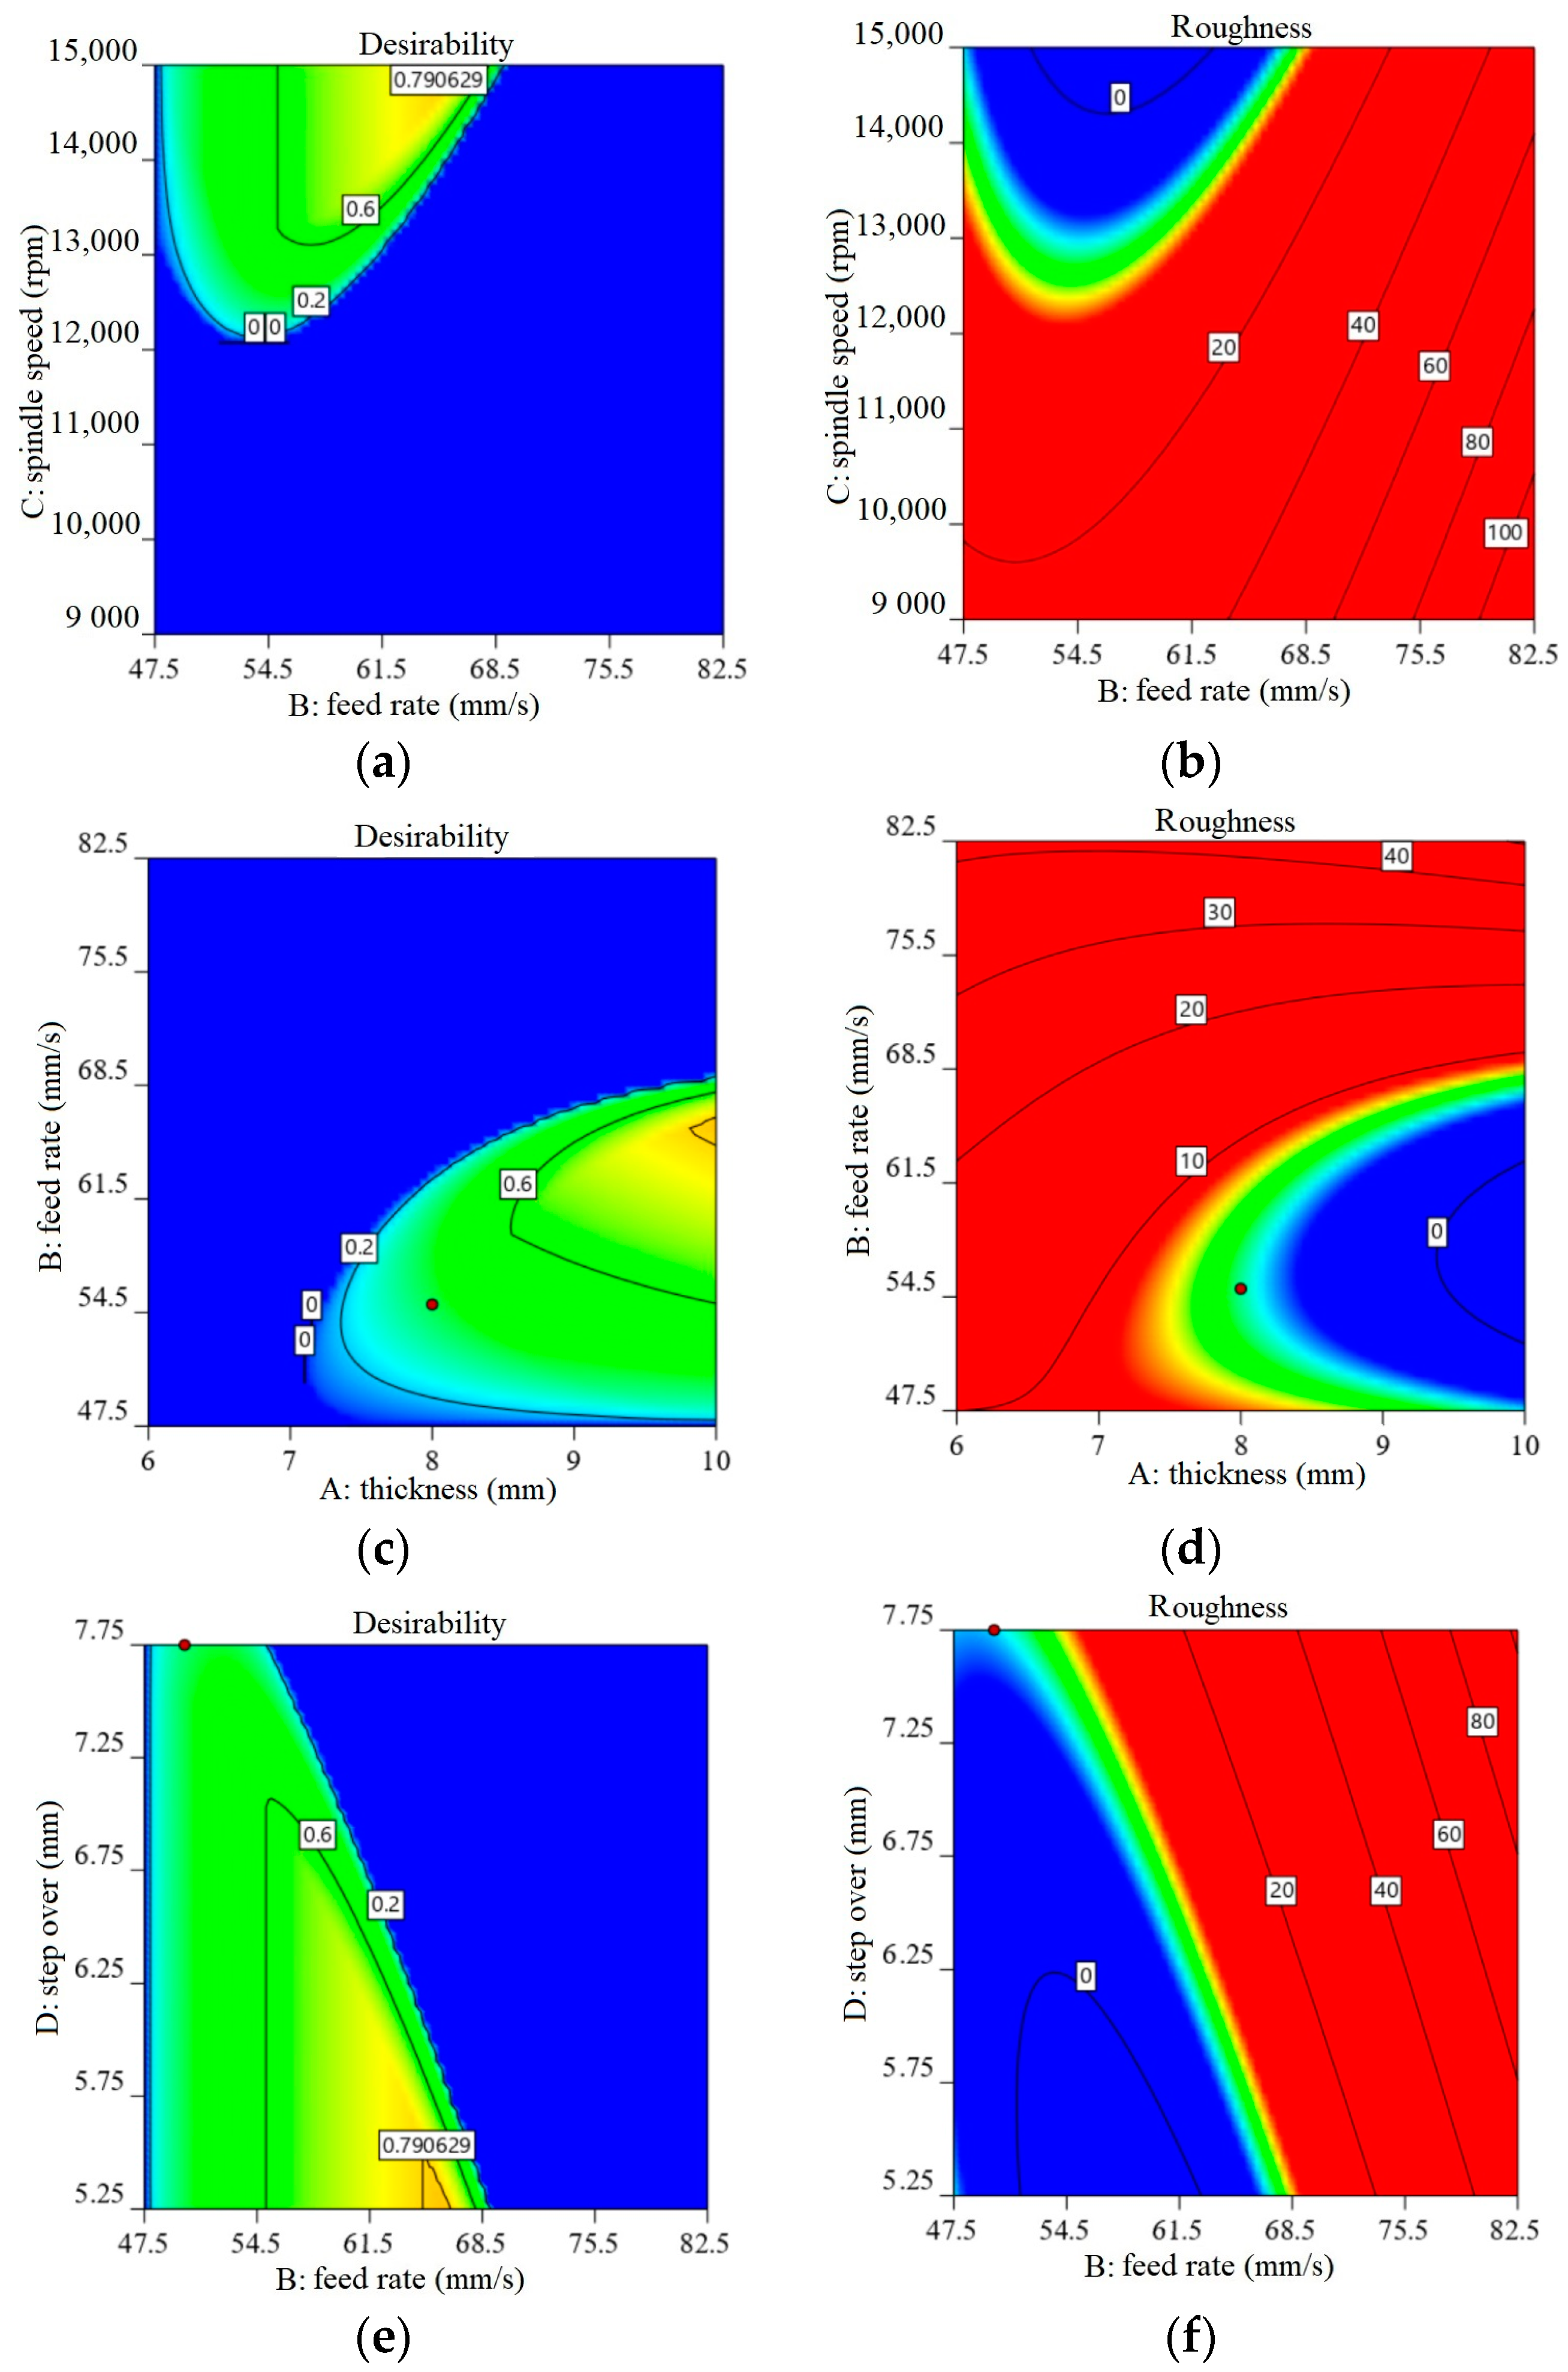
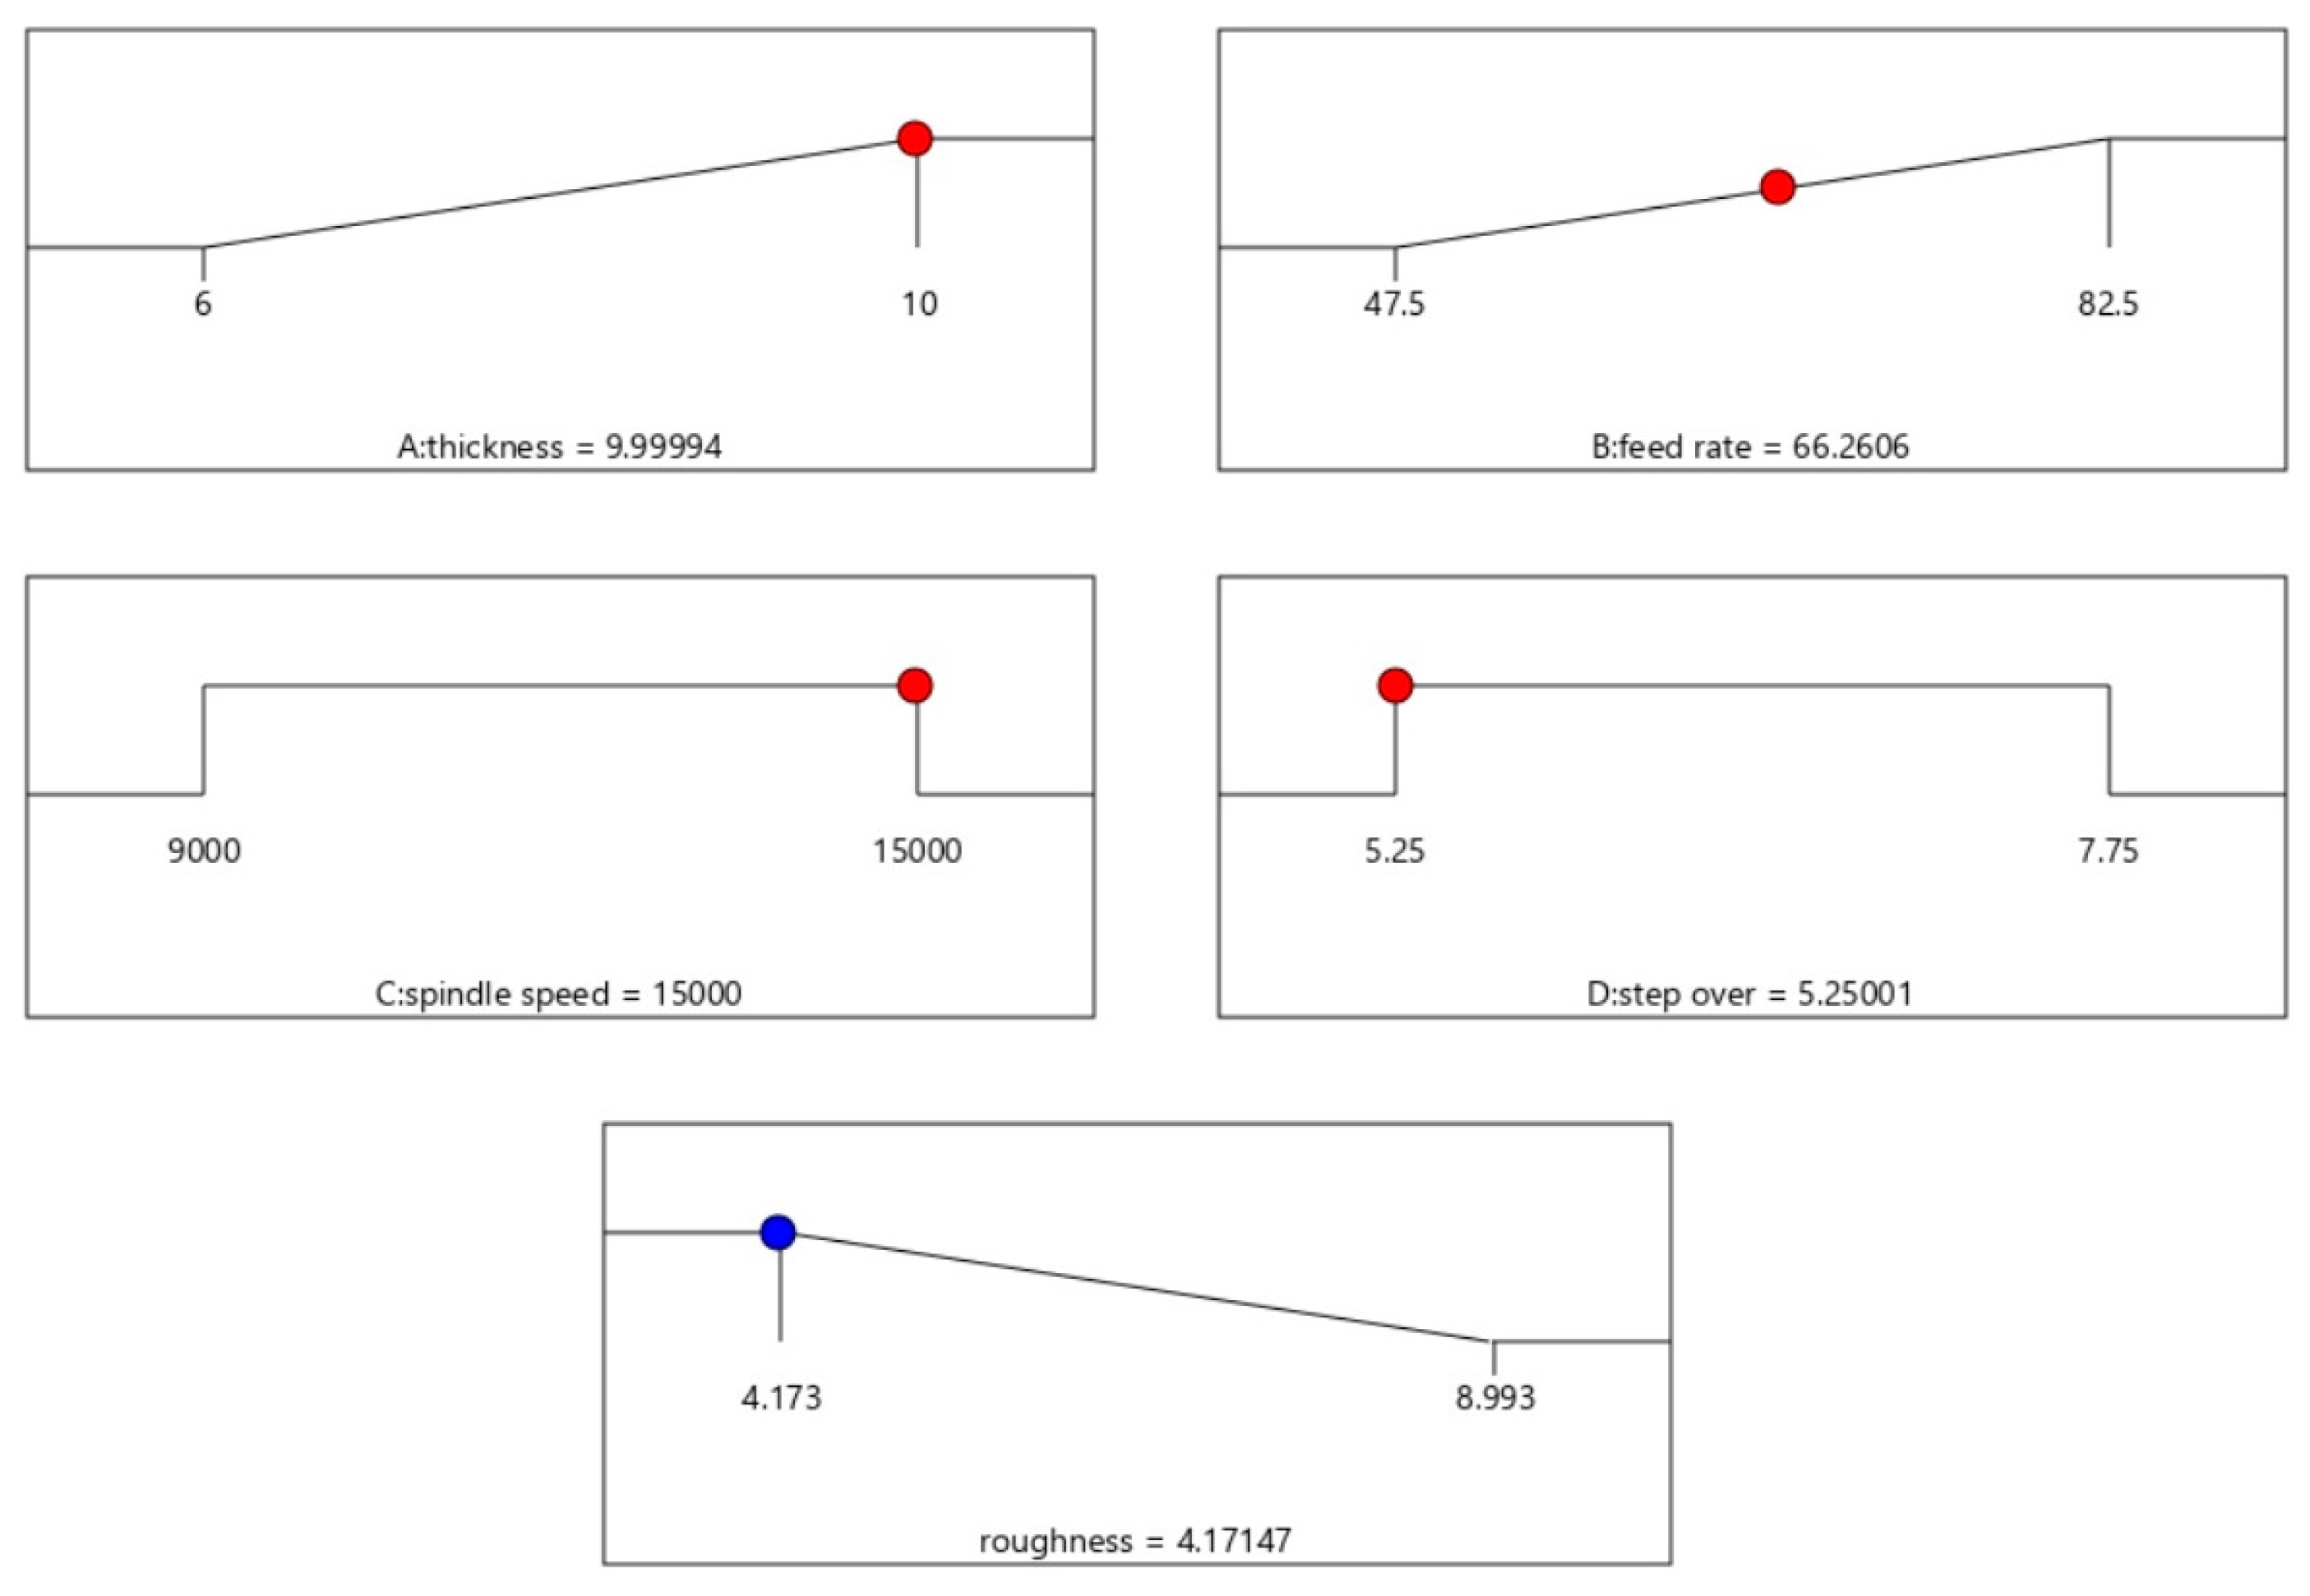
3.2. Parameter Optimization
3.3. Model Validation
4. Conclusions
- The roughness of surface decreased with decreasing feed rate. Changes in surface roughness due to the feed rate changes at high load depth, low spindle speed, and high step were very significant. Moreover, the surface roughness increased with an increasing pitch;
- The surface roughness increased with increasing the depth of cut. At this step, changes in surface roughness were very noticeable due to the changes in cutting depth, low spindle speed and high feed rate. In addition, as the spindle speed decreased, the surface roughness increased accordingly. Changes in surface roughness due to changes in spindle speed at high depth of cut, step over, and feed rate were very noticeable;
- The third-order mathematical model was modeled by the response surface method to estimate surface roughness based on machining parameters (feed rate, spindle speed, depth of cut and step by step). ANOVA showed that the greatest effect on surface roughness was related to the feed rate.
Author Contributions
Funding
Institutional Review Board Statement
Informed Consent Statement
Data Availability Statement
Conflicts of Interest
References
- Fujiwara, Y.; Fujii, Y.; Sawada, Y.; Okumura, S. Assessment of wood surface roughness: Comparison of tactile roughness and three-dimensional parameters derived using a robust Gaussian regression filter. J. Wood Sci. 2004, 50, 35–40. [Google Scholar] [CrossRef]
- Usta, I.; Demirci, S.; Kiliç, Y. Comparison of surface roughness of Locust acacia (Robinia pseudoacacia L.) and European oak (Quercus petraea (Mattu.) Lieble.) in terms of the preparative process by planing. Build. Environ. 2007, 42, 2988–2992. [Google Scholar] [CrossRef]
- Hernández, R.E.; Kuljich, S.; Koubaa, A. Effect of cutting width and cutting height on the surface quality of black spruce cants produced by a chipper-canter. Wood Fiber Sci. 2010, 42, 273–284. [Google Scholar]
- Kılıç, M.; Hiziroglu, S.; Burdurlu, E. Effect of machining on surface roughness of wood. Build. Environ. 2006, 41, 1074–1078. [Google Scholar] [CrossRef]
- Pinkowski, G.; Szymański, W.; Krauss, A.; Stefanowski, S. Effect of sharpness angle and feeding speed on the surface roughness during milling of various wood species. BioResources 2018, 13, 6952–6962. [Google Scholar] [CrossRef]
- Hiziroglu, S.; Kosonkorn, P. Evaluation of surface roughness of Thai medium density fiberboard (MDF). Build. Environ. 2006, 41, 527–533. [Google Scholar] [CrossRef]
- Keturakis, G.; Juodeikiene, I. Investigation of milled wood surface roughness. Mater. Sci. 2007, 13, 47–51. [Google Scholar]
- Malkoçoǧlu, A. Machining properties and surface roughness of various wood species planed in different conditions. Build. Environ. 2007, 42, 2562–2567. [Google Scholar] [CrossRef]
- Davim, J.P.; Clemente, V.C.; Silva, S. Surface roughness aspects in milling MDF (medium density fibreboard). Int. J. Adv. Manuf. Technol. 2008, 40, 49–55. [Google Scholar] [CrossRef]
- Barcík, Š.; Pivolusková, E.; Kminiak, R.; Wieloch, G. The influence of cutting speed and feed speed on surface quality at plane milling of poplar wood. Wood Res. 2009, 54, 109–116. [Google Scholar]
- Koc, K.H.; Erdinler, E.S.; Hazir, E.; Öztürk, E. Effect of CNC application parameters on wooden surface quality. Measurement 2017, 107, 12–18. [Google Scholar] [CrossRef]
- Bal, B.C.; Akçakaya, E. The effects of step over, feed rate and finish depth on the surface roughness of fiberboard processed with CNC machine. Furnit. Wooden Mater. Res. J. 2018, 1, 86–93. [Google Scholar] [CrossRef]
- Box, G.E.P.; Wilson, K.B. On the Experimental Attainment of Optimum Conditions. J. R. Stat. Soc. Ser. B 1951, 13, 1–38. [Google Scholar] [CrossRef]
- Venkata Rao, K.; Murthy, P.B.G.S.N. Modeling and optimization of tool vibration and surface roughness in boring of steel using RSM, ANN and SVM. J. Intell. Manuf. 2018, 29, 1533–1543. [Google Scholar] [CrossRef]
- Hazir, E.; Koc, K.H. Optimization of wood machining parameters in CNC routers: Taguchi orthogonal array based simulated angling algorithm. Maderas Cienc. Tecnol. 2019, 21, 493–510. [Google Scholar] [CrossRef] [Green Version]
- Selaimia, A.-A.; Yallese, M.A.; Bensouilah, H.; Meddour, I.; Khattabi, R.; Mabrouki, T. Modeling and optimization in dry face milling of X2CrNi18-9 austenitic stainless steel using RMS and desirability approach. Measurement 2017, 107, 53–67. [Google Scholar] [CrossRef]
- Asiltürk, I.; Neşeli, S.; Ince, M.A. Optimisation of parameters affecting surface roughness of Co28Cr6Mo medical material during CNC lathe machining by using the Taguchi and RSM methods. Measurement 2016, 78, 120–128. [Google Scholar] [CrossRef]
- Sarıkaya, M.; Güllü, A. Taguchi design and response surface methodology based analysis of machining parameters in CNC turning under MQL. J. Clean. Prod. 2014, 65, 604–616. [Google Scholar] [CrossRef]
- Prakash, S.; Palanikumar, K. Modeling for prediction of surface roughness in drilling MDF panels using response surface methodology. J. Compos. Mater. 2010, 45, 1639–1646. [Google Scholar] [CrossRef]
- Skarvelis, M.; Mantanis, G.I. Physical and mechanical properties of beech wood harvested in the Greek public forests. Wood Res. 2013, 58, 123–130. [Google Scholar]
- Najafian Ashrafi, M.; Shaabani Asrami, H.; Vosoughi Rudgar, Z.; Ghorbanian Far, M.; Heidari, A.; Rastbod, E.; Jafarzadeh, H.; Salehi, M.; Bari, E.; Ribera, J. Comparison of Physical and Mechanical Properties of Beech and Walnut Wood from Iran and Georgian Beech. Forests 2021, 12, 801. [Google Scholar] [CrossRef]
- Purba, C.Y.C.; Dlouha, J.; Ruelle, J.; Fournier, M. Mechanical properties of secondary quality beech (Fagus sylvatica L.) and oak (Quercus petraea (Matt.) Liebl.) obtained from thinning, and their relationship to structural parameters. Ann. For. Sci. 2021, 78, 81. [Google Scholar] [CrossRef]
- Montgomery, D.C. Design and Analysis of Experiments, 7th ed.; John and Wiley and Sons: Hoboken, NJ, USA, 2009. [Google Scholar]
- Groover, M.P. Fundamentals of Modern Manufacturing: Materials, Processes, and Systems, 4th ed.; John and Wiley and Sons: Hoboken, NJ, USA, 2010. [Google Scholar]
- Sharma, A.; Dwivedi, V.K. Effect of milling parameters on surface roughness: An experimental investigation. Mater. Today Proc. 2019, 25, 868–871. [Google Scholar] [CrossRef]
- Arun Premnath, A.; Alwarsamy, T.; Abhinav, T.; Krishnakant, C.A. Surface roughness prediction by response surface methodology in milling of hybrid aluminium composites. Procedia Eng. 2012, 38, 745–752. [Google Scholar] [CrossRef]
- Sanjeevi, R.; Nagaraja, R.; Radha Krishnan, B. Vision-based surface roughness accuracy prediction in the CNC milling process (Al6061) using ANN. Mater. Today Proc. 2021, 37, 245–247. [Google Scholar] [CrossRef]
- ISO 4287:1997; Geometrical Product Specifications (GPS)—Surface Texture: Profile Method—Terms, Definitions and Surface Texture Parameters. International Organization for Standardization: Geneva, Switzerland, 1997.
- Bakhaidar, R.B.; Naveen, N.R.; Basim, P.; Murshid, S.S.; Kurakula, M.; Alamoudi, A.J.; Bukhary, D.M.; Jali, A.M.; Majrashi, M.A.; Alshehri, S.; et al. Response Surface Methodology (RSM) Powered Formulation Development, Optimization and Evaluation of Thiolated Based Mucoadhesive Nanocrystals for Local Delivery of Simvastatin. Polymers 2022, 14, 5184. [Google Scholar] [CrossRef]
- Gutema, E.M.; Gopal, M.; Lemu, H.G. Minimization of Surface Roughness and Temperature during Turning of Aluminum 6061 Using Response Surface Methodology and Desirability Function Analysis. Materials 2022, 15, 7638. [Google Scholar] [CrossRef]
- Chen, C.-P.; Su, H.-Z.; Shih, J.-K.; Huang, C.-F.; Ku, H.-Y.; Chan, C.-W.; Li, T.-T.; Fuh, Y.-K. A Comparison and Analysis of Three Methods of Aluminum Crown Forgings in Processing Optimization. Materials 2022, 15, 8400. [Google Scholar] [CrossRef]
- Oniszczuk-Świercz, D.; Świercz, R.; Michna, Š. Evaluation of Prediction Models of the Microwire EDM Process of Inconel 718 Using ANN and RSM Methods. Materials 2022, 15, 8317. [Google Scholar] [CrossRef]
- Kang, H.; Liu, Y.; Li, D.; Xu, L. Study on the Removal of Iron and Manganese from Groundwater Using Modified Manganese Sand Based on Response Surface Methodology. Appl. Sci. 2022, 12, 11798. [Google Scholar] [CrossRef]
- Khashi’Ie, N.S.; Waini, I.; Mukhtar, M.F.; Zainal, N.A.; Bin Hamzah, K.; Arifin, N.M.; Pop, I. Response Surface Methodology (RSM) on the Hybrid Nanofluid Flow Subject to a Vertical and Permeable Wedge. Nanomaterials 2022, 12, 4016. [Google Scholar] [CrossRef] [PubMed]
- Equbal, A.; Equbal, M.A.; Equbal, M.I.; Ravindrannair, P.; Khan, Z.A.; Badruddin, I.A.; Kamangar, S.; Tirth, V.; Javed, S.; Kittur, M.I. Evaluating CNC Milling Performance for Machining AISI 316 Stainless Steel with Carbide Cutting Tool Insert. Materials 2022, 15, 8051. [Google Scholar] [CrossRef] [PubMed]
- Alawad, M.O.; Alateyah, A.I.; El-Garaihy, W.H.; BaQais, A.; Elkatatny, S.; Kouta, H.; Kamel, M.; El-Sanabary, S. Optimizing the ECAP Parameters of Biodegradable Mg-Zn-Zr Alloy Based on Experimental, Mathematical Empirical, and Response Surface Methodology. Materials 2022, 15, 7719. [Google Scholar] [CrossRef] [PubMed]
- Yanis, M.; Mohruni, A.S.; Sharif, S.; Yani, I.; Arifin, A.; Khona’Ah, B. Application of RSM and ANN in Predicting Surface Roughness for Side Milling Process under Environmentally Friendly Cutting Fluid. J. Phys. Conf. Ser. 2019, 1198, 042016. [Google Scholar] [CrossRef]
- Zerti, A.; Yallese, M.A.; Zerti, O.; Nouioua, M.; Khettabi, R. Prediction of machining performance using RSM and ANN models in hard turning of martensitic stainless steel AISI 420. Proc. Inst. Mech. Eng. Part C J. Mech. Eng. Sci. 2019, 233, 4439–4462. [Google Scholar] [CrossRef]
- Ghazali, M.H.M.; Mazlan, A.Z.A.; Wei, L.M.; Tying, C.T.; Sze, T.S.; Jamil, N.I.M. Effect of Machining Parameters on the Surface Roughness for Different Type of Materials. IOP Conf. Ser. Mater. Sci. Eng. 2019, 530, 012008. [Google Scholar] [CrossRef]
- Zaidi, S.R.; Khan, M.; Jaffery, S.H.I.; Warsi, S. Effect of Machining Parameters on Surface Roughness During Milling Operation. Adv. Manuf. Technol. 2021, 15, 175–180. [Google Scholar] [CrossRef]
- Zhenchao, Y.; Yang, X.; Yan, L.; Jin, X.; Quandai, W. The effect of milling parameters on surface integrity in high-speed milling of ultrahigh strength steel. Procedia CIRP 2018, 71, 83–88. [Google Scholar] [CrossRef]


| Bending Strength | Elasticity Modulus | Grain Parallel Compression | Grain Parallel Shear Strength | Grain Parallel Tensile Strength | Grain Normal Tensile Strength | Impact Bending |
|---|---|---|---|---|---|---|
| 99.01 (MPa) | 11,224 (MPa) | 57.05 (MPa) | 10.47 (MPa) | 131.15 (MPa) | 3.71 (MPa) | 11.081 (KJ/m2) |
| Parameter | Maximum | Minimum |
|---|---|---|
| Depth of cut (mm) | 10 | 4 |
| Feed rate (mm/s) | 55 | 30 |
| Spindle speed (rpm) | 15,000 | 9000 |
| Step over (mm) | 7.75 | 5.25 |
| No. | Step Over (mm) | Spindle Speed (rpm) | Feed Rate (mm/s) | Depth of Cut (mm) |
|---|---|---|---|---|
| 1 | 7.75 | 9000 | 30 | 10 |
| 2 | 7.75 | 12,000 | 40 | 10 |
| 3 | 7.75 | 15,000 | 50 | 10 |
| 4 | 7.75 | 9000 | 35 | 8 |
| 5 | 7.75 | 12,000 | 45 | 8 |
| 6 | 5.25 | 12,000 | 55 | 8 |
| 7 | 5.25 | 15,000 | 55 | 8 |
| 8 | 7.75 | 15,000 | 45 | 8 |
| 9 | 6.5 | 15,000 | 45 | 8 |
| 10 | 5.25 | 9000 | 50 | 6 |
| 11 | 6.5 | 12,000 | 55 | 6 |
| 12 | 7.75 | 15,000 | 55 | 6 |
| 13 | 7.75 | 12,000 | 30 | 6 |
| 14 | 5.25 | 12,000 | 40 | 6 |
| 15 | 6.5 | 15,000 | 50 | 6 |
| 16 | 7.75 | 9000 | 40 | 6 |
| 17 | 7.75 | 9000 | 30 | 6 |
| 18 | 7.75 | 15,000 | 40 | 6 |
| 19 | 7.75 | 15,000 | 55 | 4 |
| 20 | 6.5 | 12,000 | 45 | 8 |
| 21 | 7.75 | 15,000 | 55 | 4 |
| 22 | 6.5 | 15,000 | 30 | 6 |
| 23 | 5.25 | 12,000 | 50 | 6 |
| 24 | 7.75 | 12,000 | 45 | 6 |
| Regression Model | Valid | |
|---|---|---|
| Linear | 0.4480 | |
| Linear + 2 factor interaction | 0.5732 | |
| Quadratic | ||
| 0.4278 | ||
| Cubic | 1 | × |
| Parameter | p-Value | Predicted Coefficient |
|---|---|---|
| Constant | 22.26 | |
| Linear | ||
| 0.0031 | 10.75 | |
| 0.0016 | 31.47 | |
| 0.0013 | −11.24 | |
| 0.0012 | 9.88 | |
| Quadratic | ||
| 0.0072 | 2.80 | |
| 0.0015 | 15.89 | |
| 0.0012 | 1.93 | |
| 0.0016 | 2.04 | |
| 2 Factor interaction | ||
| 0.0026 | 19.51 | |
| 0.0012 | −11.87 | |
| 0.0015 | 7.04 | |
| 0.0017 | −9.14 | |
| 0.0012 | 10.44 | |
| 0.0015 | −5.62 | |
| 0.0015 | −8.44 | |
| 0.0014 | 7.62 | |
| 0.0022 | 1.58 | |
| 0.0014 | −5.08 | |
| 0.0061 | 2.31 | |
| 0.0075 | −1.41 | |
| 0.0021 | 10.83 | |
| 0.0048 | −1.10 | |
| Total | 0.0014 (Significant) |
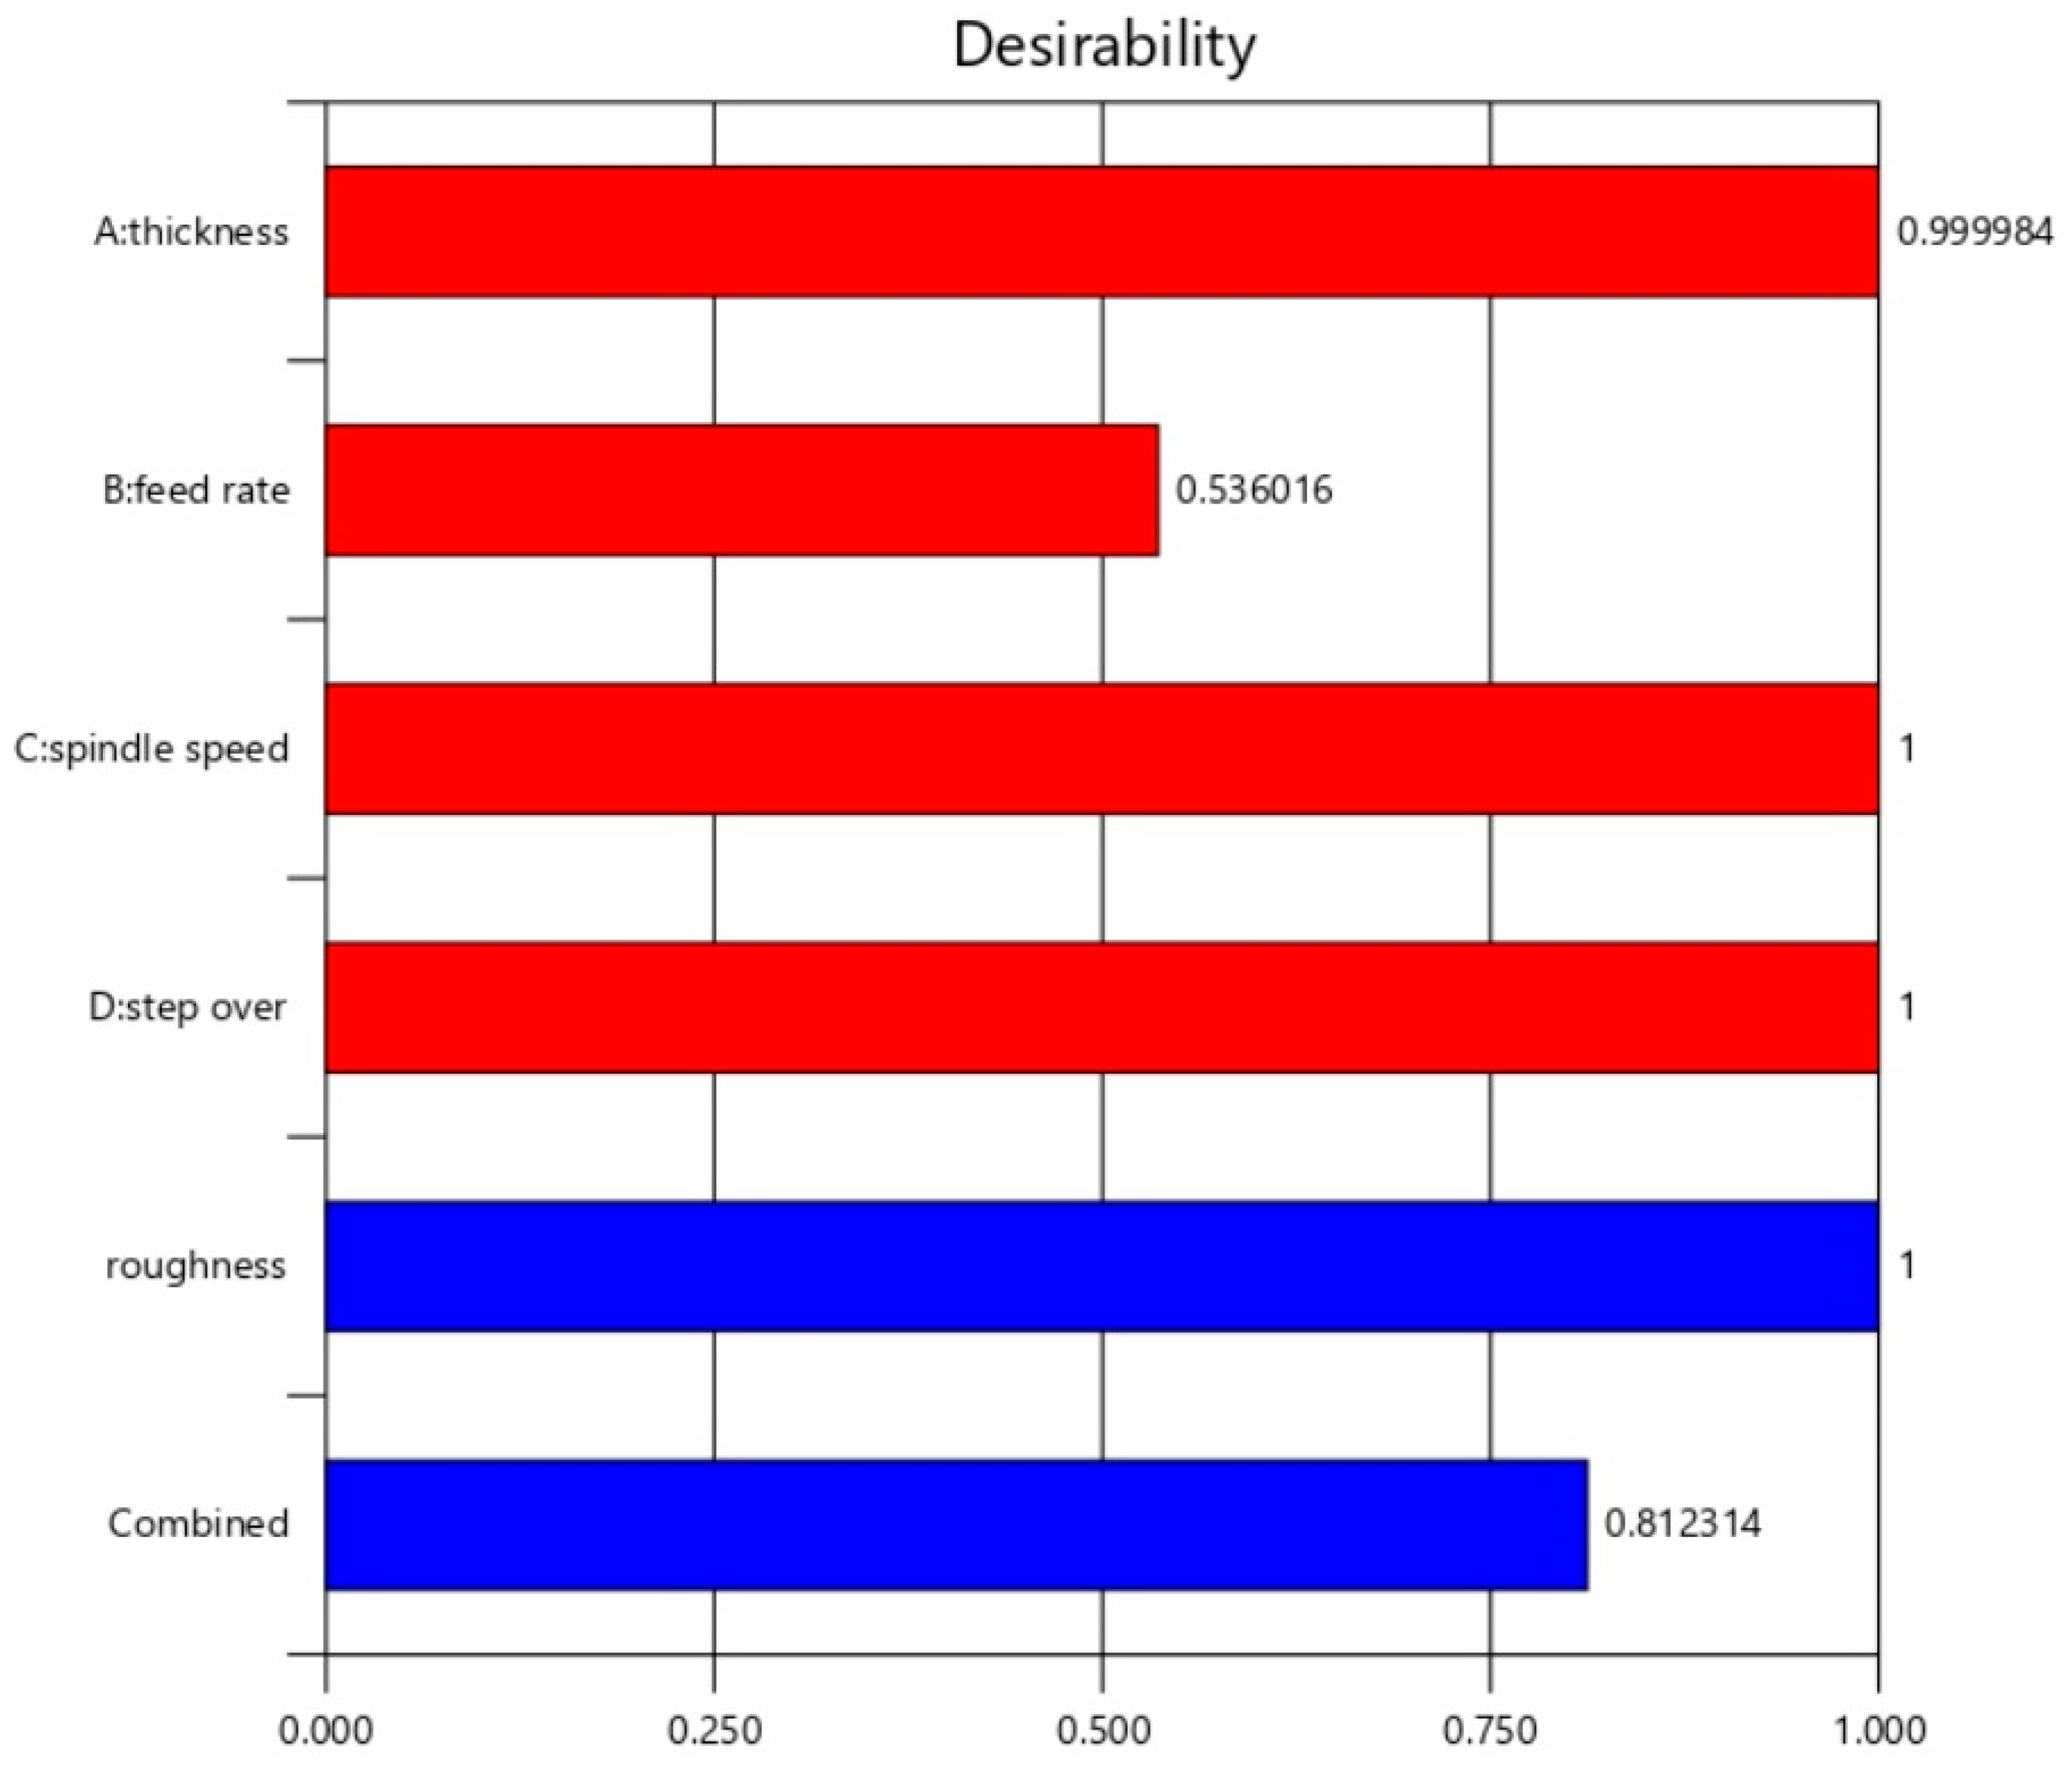
| Parameter | Goal | Description | Optimized Value |
|---|---|---|---|
| Depth of cut | Maximum | Increase in production rate | 10 |
| Feed rate | Maximum | Increase in production rate | 66.262 |
| Spindle speed | In range | 15,000 | |
| Step over | In range | 5.25 | |
| Surface roughness | Minimum | Increase in product quality | 4.2 |
| Desirability | 0.812 |
| Condition | 95 % PI High | 95 % PI Low | Std Dev | Roughness Measured Value | Roughness Predicted Value by Model |
|---|---|---|---|---|---|
| 1 | 8.52612 | 8.44988 | 0.003 | 8.488 | 8.488 |
| 2 | 7.38712 | 7.31088 | 0.003 | 7.349 | 7.349 |
| 3 | 5.25612 | 5.17988 | 0.003 | 5.218 | 5.218 |
| 4 | 6.70112 | 6.62488 | 0.003 | 6.663 | 6.663 |
| 5 | 7.06512 | 6.98888 | 0.003 | 7.027 | 7.027 |
| 6 | 7.63512 | 7.55888 | 0.003 | 7.597 | 7.597 |
| 7 | 5.92112 | 5.84488 | 0.003 | 5.883 | 5.883 |
| 8 | 6.95712 | 6.88088 | 0.003 | 6.919 | 6.919 |
| 9 | 6.79412 | 6.71788 | 0.003 | 6.756 | 6.756 |
| 10 | 7.53112 | 7.45488 | 0.003 | 7.493 | 7.493 |
| 11 | 7.84812 | 7.77188 | 0.003 | 7.81 | 7.81 |
| 12 | 8.01412 | 7.93788 | 0.003 | 7.976 | 7.976 |
| 13 | 5.27812 | 5.20188 | 0.003 | 5.24 | 5.24 |
| 14 | 7.52612 | 7.44988 | 0.003 | 7.488 | 7.488 |
| 15 | 6.78812 | 6.71188 | 0.003 | 6.75 | 6.75 |
| 16 | 9.03112 | 8.95488 | 0.003 | 8.993 | 8.993 |
| 17 | 8.02412 | 7.94788 | 0.003 | 7.986 | 7.986 |
| 18 | 5.10712 | 5.03088 | 0.003 | 5.069 | 5.069 |
| 19 | 7.87251 | 7.80649 | 0.002598 | 7.838 | 7.8395 |
| 20 | 7.08212 | 7.00588 | 0.003 | 7.044 | 7.044 |
| 21 | 7.87251 | 7.80649 | 0.002598 | 7.841 | 7.8395 |
| 22 | 4.21112 | 4.13488 | 0.003 | 4.173 | 4.173 |
| 23 | 7.46212 | 7.38588 | 0.003 | 7.424 | 7.424 |
| 24 | 6.30112 | 6.22488 | 0.003 | 6.263 | 6.263 |
Disclaimer/Publisher’s Note: The statements, opinions and data contained in all publications are solely those of the individual author(s) and contributor(s) and not of MDPI and/or the editor(s). MDPI and/or the editor(s) disclaim responsibility for any injury to people or property resulting from any ideas, methods, instructions or products referred to in the content. |
© 2022 by the authors. Licensee MDPI, Basel, Switzerland. This article is an open access article distributed under the terms and conditions of the Creative Commons Attribution (CC BY) license (https://creativecommons.org/licenses/by/4.0/).
Share and Cite
Pakzad, S.; Pedrammehr, S.; Hejazian, M. A Study on the Beech Wood Machining Parameters Optimization Using Response Surface Methodology. Axioms 2023, 12, 39. https://doi.org/10.3390/axioms12010039
Pakzad S, Pedrammehr S, Hejazian M. A Study on the Beech Wood Machining Parameters Optimization Using Response Surface Methodology. Axioms. 2023; 12(1):39. https://doi.org/10.3390/axioms12010039
Chicago/Turabian StylePakzad, Sajjad, Siamak Pedrammehr, and Mahsa Hejazian. 2023. "A Study on the Beech Wood Machining Parameters Optimization Using Response Surface Methodology" Axioms 12, no. 1: 39. https://doi.org/10.3390/axioms12010039