1. Introduction
In 2008, Nakamoto developed the bitcoin system based on cryptography principles, and in 2009, he dug up the first batch of 50 bitcoins, and bitcoin was released. In 2010, a programmer bought a pizza with 10,000 bitcoins. This was also the first purchase of bitcoin, and then many businesses began to accept bitcoin for trading.
As the representative of blockchain currency, bitcoin shows completely different characteristics from traditional currency when it appears. Its original intention was to replace the centralized currency-issuing mechanism with decentralization. The issue of bitcoin depends on the hash encryption algorithm, the total amount is limited, and its issue is objective and does not depend on the subjective thought of a certain subject. Bitcoin transactions depend on bitcoin accounts. A bitcoin account is anonymous and is composed of a public key and private key. The private key is in the hands of the account owner. The process of bitcoin flowing from one account to another is public and can be queried at all nodes. This is also one of the characteristics of decentralization.
Bitcoin has been repeatedly compared with gold since its emergence. The issuing process of bitcoin, also known as mining, has a limited total amount in the future, decreasing production over time and increasing mining difficulty. Therefore, bitcoin is also known as “digital gold”. The most considerable similarity between bitcoin and gold is that its total amount is limited, with its characteristics of scarcity. At the same time, bitcoin is always worried that the algorithm will be cracked. In fact, with the complete arrival of controllable nuclear fusion, gold can be synthesized cheaply, and both sides have similar characteristics in bankruptcy. As the traditional currency of human beings, the important reason for gold obtaining its monetary attribute is its scarcity and practicability in decoration. Although bitcoin is scarce, it does not have the actual value of decoration similar to gold.
However, the value of gold does not entirely come from its decorative value. The reason is that if its value mainly came from decorative value, the price would be very stable, instead of being affected by the drastic fluctuation of international politics as it is now. Considering that gold and silver have been legal tender for a long time in human history, the current price of gold, except for its decorative value, can be considered to come from the belief of people in the value of gold.
Bitcoin, relative to gold, also has its unique advantages. Bitcoin can be subdivided into 100 million pieces, and online trading is more convenient. Although gold also includes bookkeeping gold, it is no longer traded as a currency. Thus, bitcoin is now, to a certain extent, an improved alternative to gold. Up to the present, bitcoin still has no ability to challenge credit currency, but it has become an important financial asset and plays a vital role in asset allocation.
Marimon et al. [
1] proved that after committing to the inflation rate, private money also has a positive value equilibrium, and the nature of the total amount of bitcoin is consistent with this study, that is, there may be a positive value equilibrium. In this paper, a more interesting result is obtained after simplifying and deforming the model. The cryptocurrency side of bitcoin is more important when investor risk aversion is low. The safe-haven asset side of bitcoin is more important when risk aversion is high among risky investors. Many studies support the possibility that bitcoin has a positive price. (Dwyer [
2] believed that bitcoin may reduce the revenue of the government from great inflation. Meanwhile, Maurer et al. [
3] believed that bitcoin would become an important currency. Dyhrberg [
4] demonstrated that bitcoin has a nature close to gold and the U.S. dollar through an empirical method, that is, it can act as a hedging asset and trading medium at the same time. Luther [
5] explained how consumers’ views on transactions affect the circulation of bitcoin as a trading medium. Outside the main trading markets, Dierksmeier and Seele [
6] cited many works of literature to show that bitcoin is likely to continue to have a positive price due to the demand for trading on the black market. Cong et al. [
7] established a dynamic asset pricing model of cryptocurrency and found that the equilibrium price of cryptocurrency comes from the transaction demand of the agent. Pagnotta [
8] suggested that the existing value of bitcoin comes from inflation protection and agent acceptance.) However, not all researchers believe that bitcoin has real value. (For example, Baur et al. [
9] empirically concluded that bitcoin was more like a speculative asset than currency before 2018. Coincidentally, Baek and Elbeck [
10] also demonstrated that bitcoin is highly speculative. Cheung et al. [
11] illustrated that bitcoin has experienced several bursting bubbles through foam measurement technology.)
Today, gold has been proven to be less suitable for international currency. When gold is used as a global currency, due to its limited amount and the rapid growth of the world economy, it will always bring about the influence of deflation. Compared with gold for consumption, people are more willing to store gold, which can obtain a higher income. Therefore, the gold standard has now withdrawn from the stage of history, and gold has changed from currency to a kind of financial asset. Although gold plays a vital role in industry and decoration, its most influential attribute is the financial attribute as a hedge asset. For bitcoin research, many papers also focus on whether bitcoin has the same hedging asset attributes as gold.
To a certain extent, the hedging property of bitcoin comes from its similarity with gold, which leads investors to form the belief that bitcoin will maintain its value when the crisis comes and then choose to buy bitcoin when the crisis comes. This, in turn, led to the rise in bitcoin price, and bitcoin has the characteristics of hedging assets. The greatest significance of hedging assets is enriching financial products and making the financial market more complete. Investors can obtain stable returns in different market environments and bear controllable risks. In 2020, a sudden public health event, COVID-19, had a significant impact on the economy and finance, and the financial market also appeared as before.
From the perspective of monetary theory, this paper uses a classical monetary model to describe the dynamic process of legal currency and bitcoin. It discusses how changes in different situations and economic situations affect the price of bitcoin. We find that when the risk aversion level is high, bitcoin has the property of a hedging asset, while when the risk aversion level is low, bitcoin has the characteristics of procyclicality. This makes bitcoin and other financial assets have very different characteristics and can improve the financial market to a greater extent.
In the empirical aspect, this paper focuses on comparing the role of bitcoin and gold in asset allocation. The China A-share market, Standard and Poor’s index, and exchange rate of the U.S. dollar to RMB (Chinese currency) are selected as three basic asset allocations, and then the U.S. dollar and bitcoin are added to compare the roles of these two assets in asset allocation. In addition, we consider the complementary role between bitcoin and gold. In particular, bitcoin has a stronger hedging asset attribute than the full sample during the epidemic. This is consistent with the fact that bitcoin becomes a safe haven asset when the risk aversion coefficient is high in the theoretical results.
This paper is arranged as follows. In
Section 2, we explore some literature that is closely related to our study. In
Section 3, we use a simplified variant of a classical currency model to solve the price time series of bitcoin in a dynamic economy and discuss how the issue of traditional French currency and the change of economic situation affect the price of bitcoin in a relatively static sense. In
Section 4, we linearize the model logarithm and simulate the model. In
Section 5, in order to verify the theoretical results, we introduce three classical portfolio models and substitute the data of bitcoin and gold into the conclusion of the model to observe the role of bitcoin in asset allocation.
Section 6 presents the limitations of the study and future perspectives. In the last section, the influence mechanism will be analyzed, and the conclusion of the paper will be drawn.
We summarize the contributions of this paper as follows.
We find Bitcoin has two sources of value: as a medium of exchange and as a safe-haven currency.
Numerical simulations and econometric analysis support the theoretical results.
Bitcoin showed more pronounced characteristics of a safe-haven asset during COVID-19.
2. Related Work
Our work explores both the properties of bitcoin as a medium of exchange and as a safe-haven asset, and the relationship between bitcoin and economic cycles is reflected in our results. Therefore, this paper is linked to the three strands of literature on the medium-of-trade property, the safe-haven asset property, and the predictability of bitcoin.
Many researchers have also discussed the nature of bitcoin in circulation. Easley et al. [
12] investigated the role that transaction fees play in the bitcoin blockchain evolution. Makarov and Schoar [
13] studied the arbitrage opportunities of bitcoin in different exchanges. Foley et al. [
14] found that the emergence of cryptocurrency has changed the black market to a certain extent. Marmora [
15] found that bitcoin is becoming increasingly important in shadow trading, which supports our hypothesis about bitcoin becoming a medium of exchange. Härdle et al. [
16] believed that the relationship between bitcoin and fiat currencies and the role of bitcoin in asset allocation will be important areas of research. The central objective of this paper is to answer these two questions.
The price movement of bitcoin has also attracted the attention of many researchers. Gkillas and Katsiampa [
17] found that bitcoin and lightcoin are two cryptocurrencies with lower tail risk. Bouri et al. [
18] confirmed the hedging effect of bitcoin on uncertainty through wavelet decomposition and quantile regression. Bouri et al. [
19] found a difference between bitcoin and other assets in the bull and bear market, especially bitcoin always being the receiver of the impact. Bouri et al. [
20] empirically found that bitcoin is an effective diversified asset. Guesmi et al. [
21] proved that bitcoin has a good role in risk diversification in asset allocation through empirical methods. Griffin and Shams [
22] provided support for the view that price manipulation can have substantial distortive effects in cryptocurrencies. Kalyvas et al. [
23] found that the risk of a bitcoin crash increases at times of increased economic uncertainty. This is relevant to our research. One of the core results of our study is that Bitcoin has the property of a safe-haven asset at a time when investors are more risk averse.
Similar to our paper, many recent studies have looked at the relationship between Bitcoin and other assets. Caferra et al. [
24] found that bitcoin exhibits a low correlation to almost all other assets. This point side-by-side confirms our analysis regarding the relationship between bitcoin and good or bad economic conditions. Bourghelle et al. [
25] found that the property of the bitcoin price movement process changed when market sentiment changed. This is consistent with the findings of our model. Damianov and Elsayed [
26] has likewise found bitcoin to be a good diversifier of risk in a portfolio. Blau et al. [
27] found bitcoin to be highly anti-inflationary. This is supported by the close relationship between bitcoin and gold. Arzova and Özdurak [
28] found that a portfolio of bitcoin and a stock index has higher returns than a stock index alone. This is consistent with the results in our numerical section. Chen and Chang [
29] examined the volatility relationship between bitcoin and stablecoins. Kalyvas et al. [
23] found bitcoin to be a good hedge against inflation.
Whether the price of bitcoin is predictable is also one of the focuses of the debate (e.g., Balcilar et al. [
30], Nadarajah and Chu [
31]), and both articles believe that bitcoin returns are largely unpredictable. However, some papers (e.g., Bariviera [
32]) believe that bitcoin has a certain predictability and long memory. Therefore, whether the return of bitcoin has predictability is related to its market view. Pele and Mazurencu-Marinescu-Pele [
33] investigated the ability of several econometrical models to forecast value at risk for a sample of daily time series of cryptocurrency returns and concluded that the VaR forecast building upon the entropy of intraday returns is the best, compared to the forecasts provided by the classical GARCH models.
3. Theoretical Model
The currency model used in this section mainly comes from modifying the model in [
1]. To better highlight the similarities and differences between bitcoin and legal currency, we simplify the infinite currencies in the original text into two.
Firstly, we consider the representative consumer utility function:
where
is a monotonically increasing concave function and satisfies
.
is the consumption. The production function is
, where
is output, and
is labor. Considering that there are two kinds of currency, the real value is
and
, the quantity is
M and
, and the real prices of currency are
and
, assuming that the first currency is bitcoin, and the issuance of the second currency is controlled by the government. The government can control the
of each period, not enter the utility function, and only use it as a trading medium, which has a fixed substitution coefficient with the credit currency issued by the government. Therefore, we can add the total amount of real money to
, and set
.
is the rate of substitution between currencies.
is the ratio of new currency issued in each period to the previous period.
The constraints of each period are as follows:
where
is the number of bonds, and
is the income of dividends from technology or other shocks.
The CIA (Cash in Advance) condition is introduced: .
Then, the derivative of the implicit function shows that
What follows is that
and
are discussed:
with
; when we assume
,
It is easy to know . The positive and negative of depend on the relative magnitude of the absolute values of and . generally reflects consumers’ attitude towards risk. Therefore, when the degree of risk aversion is relatively high, the absolute value of will be greater than . At this time, means that the price of bitcoin will be in a downturn when the economic situation is good, and the price of bitcoin will rise when the economic situation is poor.
Using a similar method, we can obtain the following results:
Therefore, it can be found that and have opposite signs, and when the risk aversion degree is high, the absolute value of will be greater than ; at this time, . This can be explained by the fact that after the economic situation was better in the last period, people would naturally reserve more money for long-term assets in order to smooth consumption, which also brings about the rise of money relative to consumer goods prices.
4. Bitcoin Price Change Process under Numerical Simulation
We use a slightly different model from the one in
Section 3, which includes technology shock:
satisfies
, where
is white noise, and the production function is
.
is the rate of convergence. We discuss the details of the model in the
Appendix A.
In fact, the model in
Section 3 is a simplified version of this model. In order to be able to obtain the theoretical properties explicitly, we have not considered technological shocks in
Section 3.
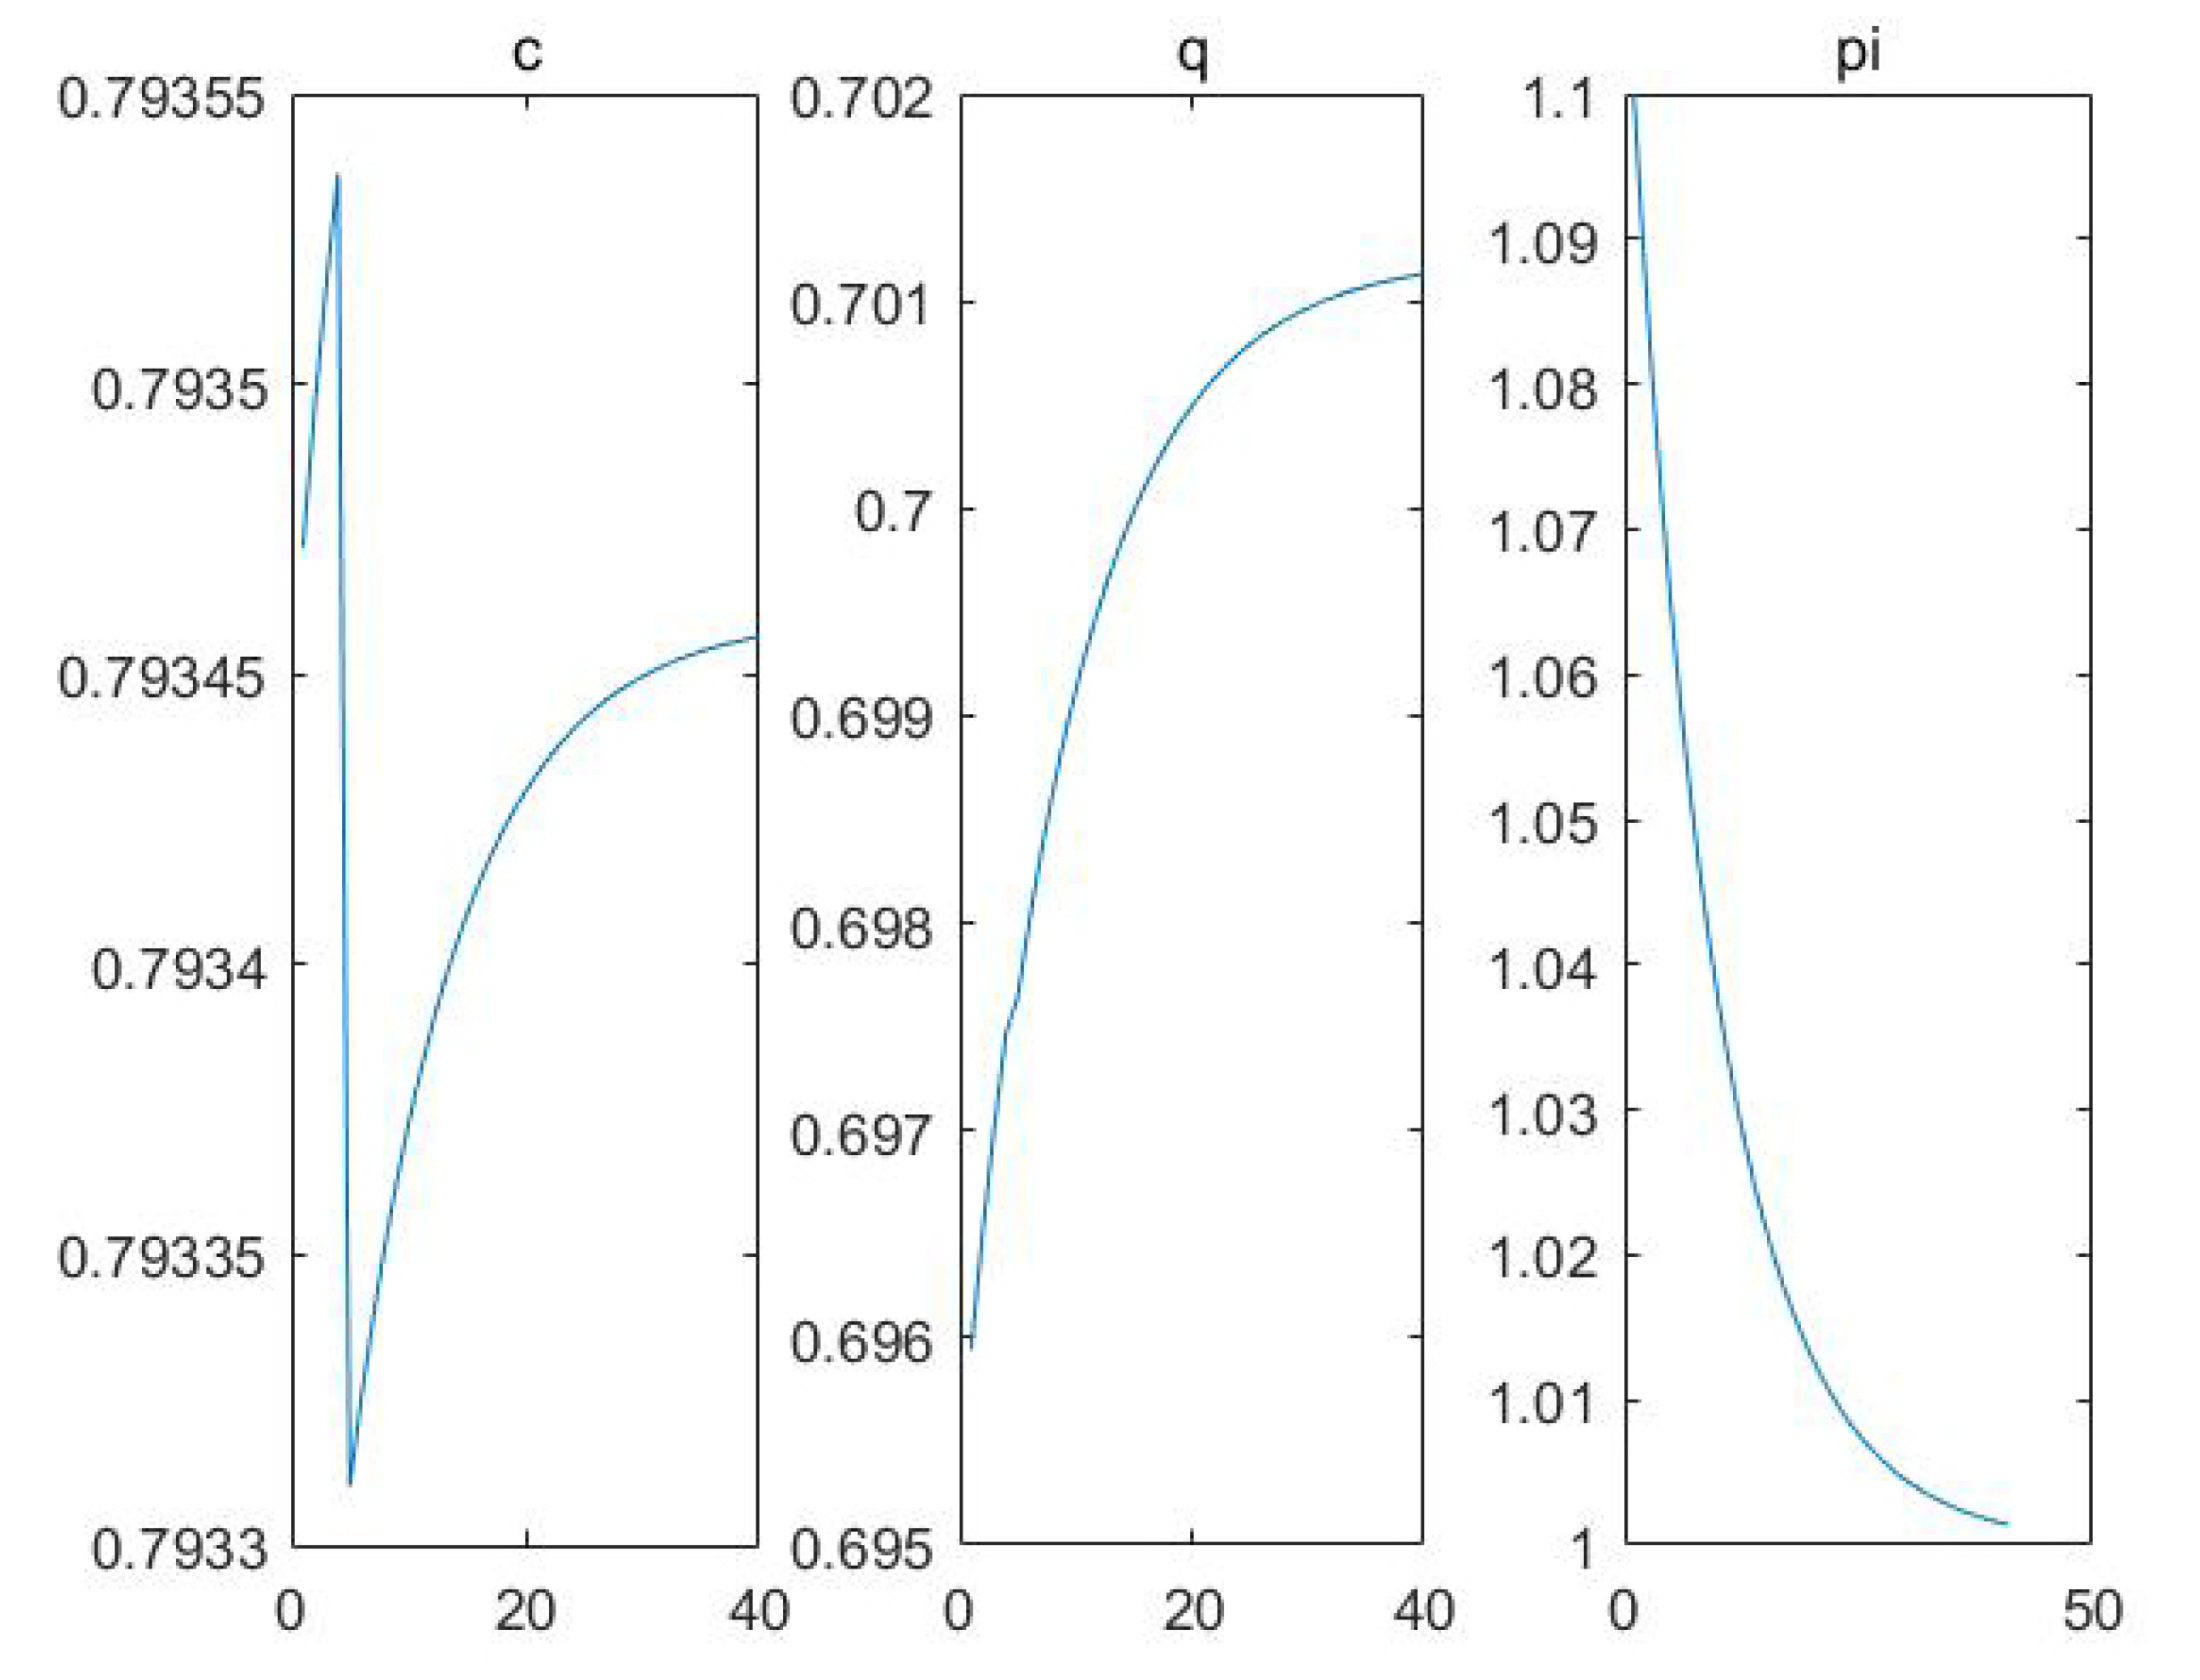
In the logarithmic linearization numerical simulation, the parameters are set as
, and the standard deviation of the two random variables is 1.5. When
, we obtain the following results (we refer to the classic textbook [
34] for some of the parameter settings):
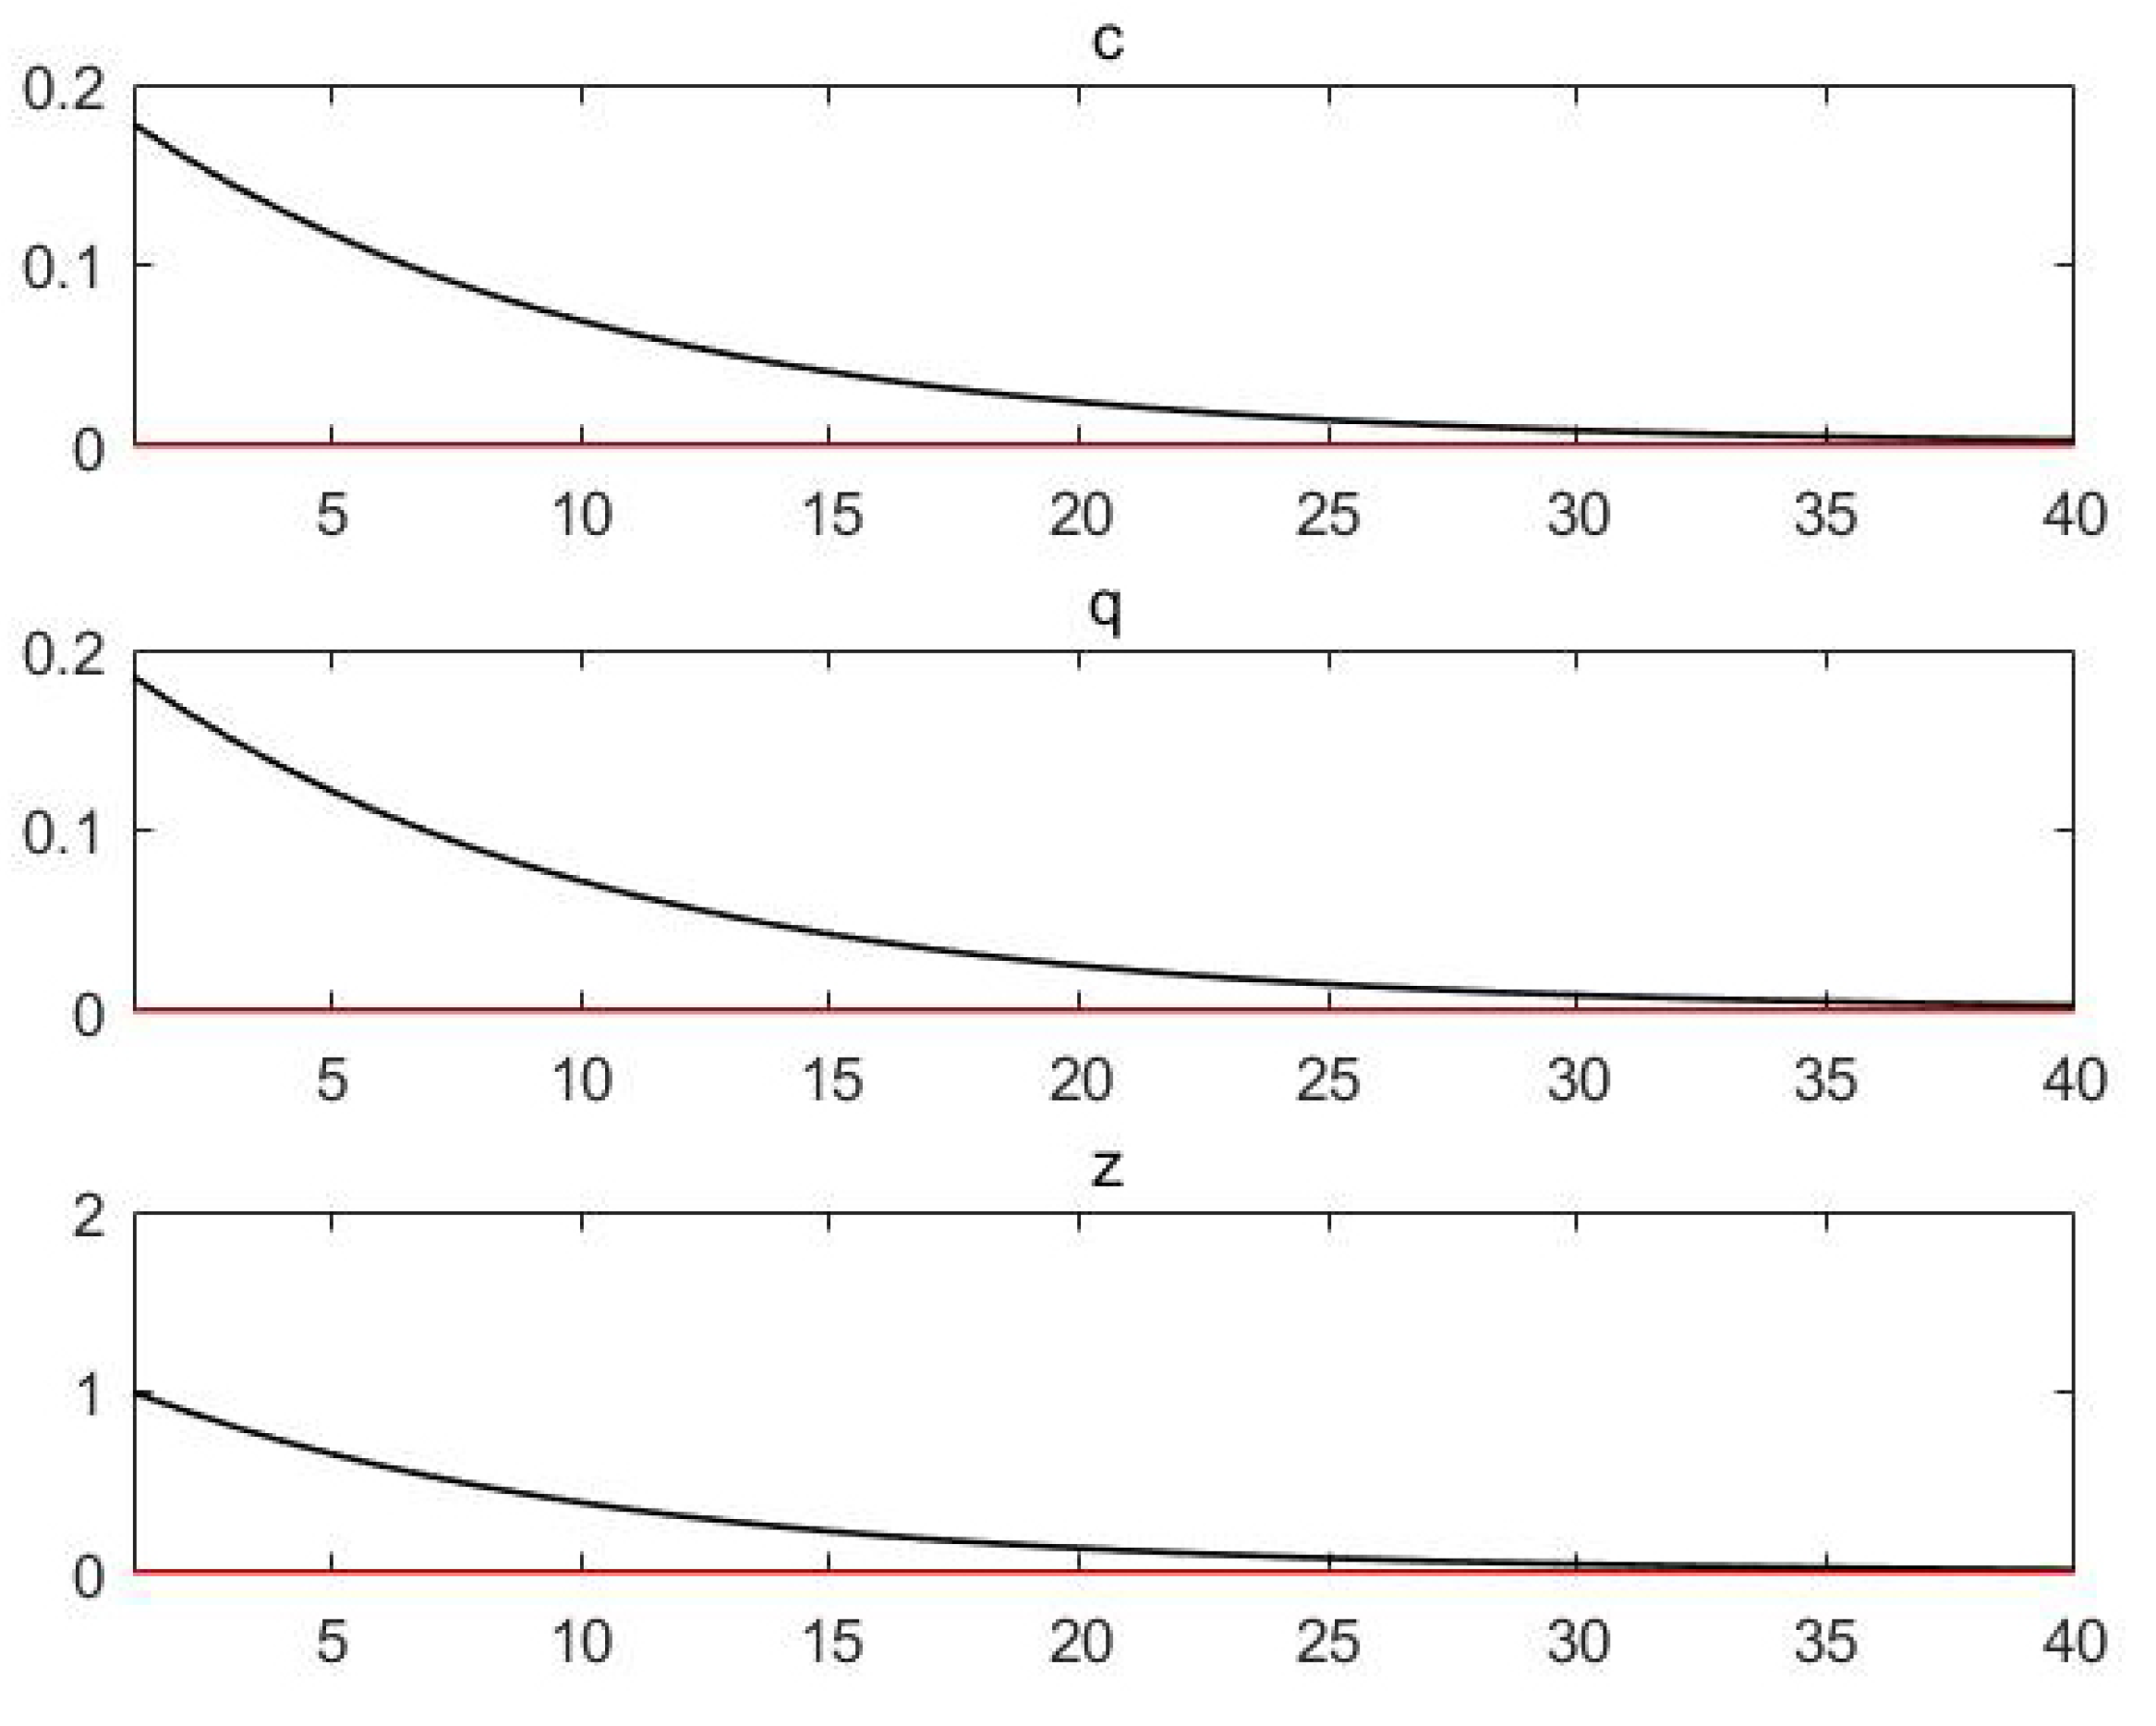
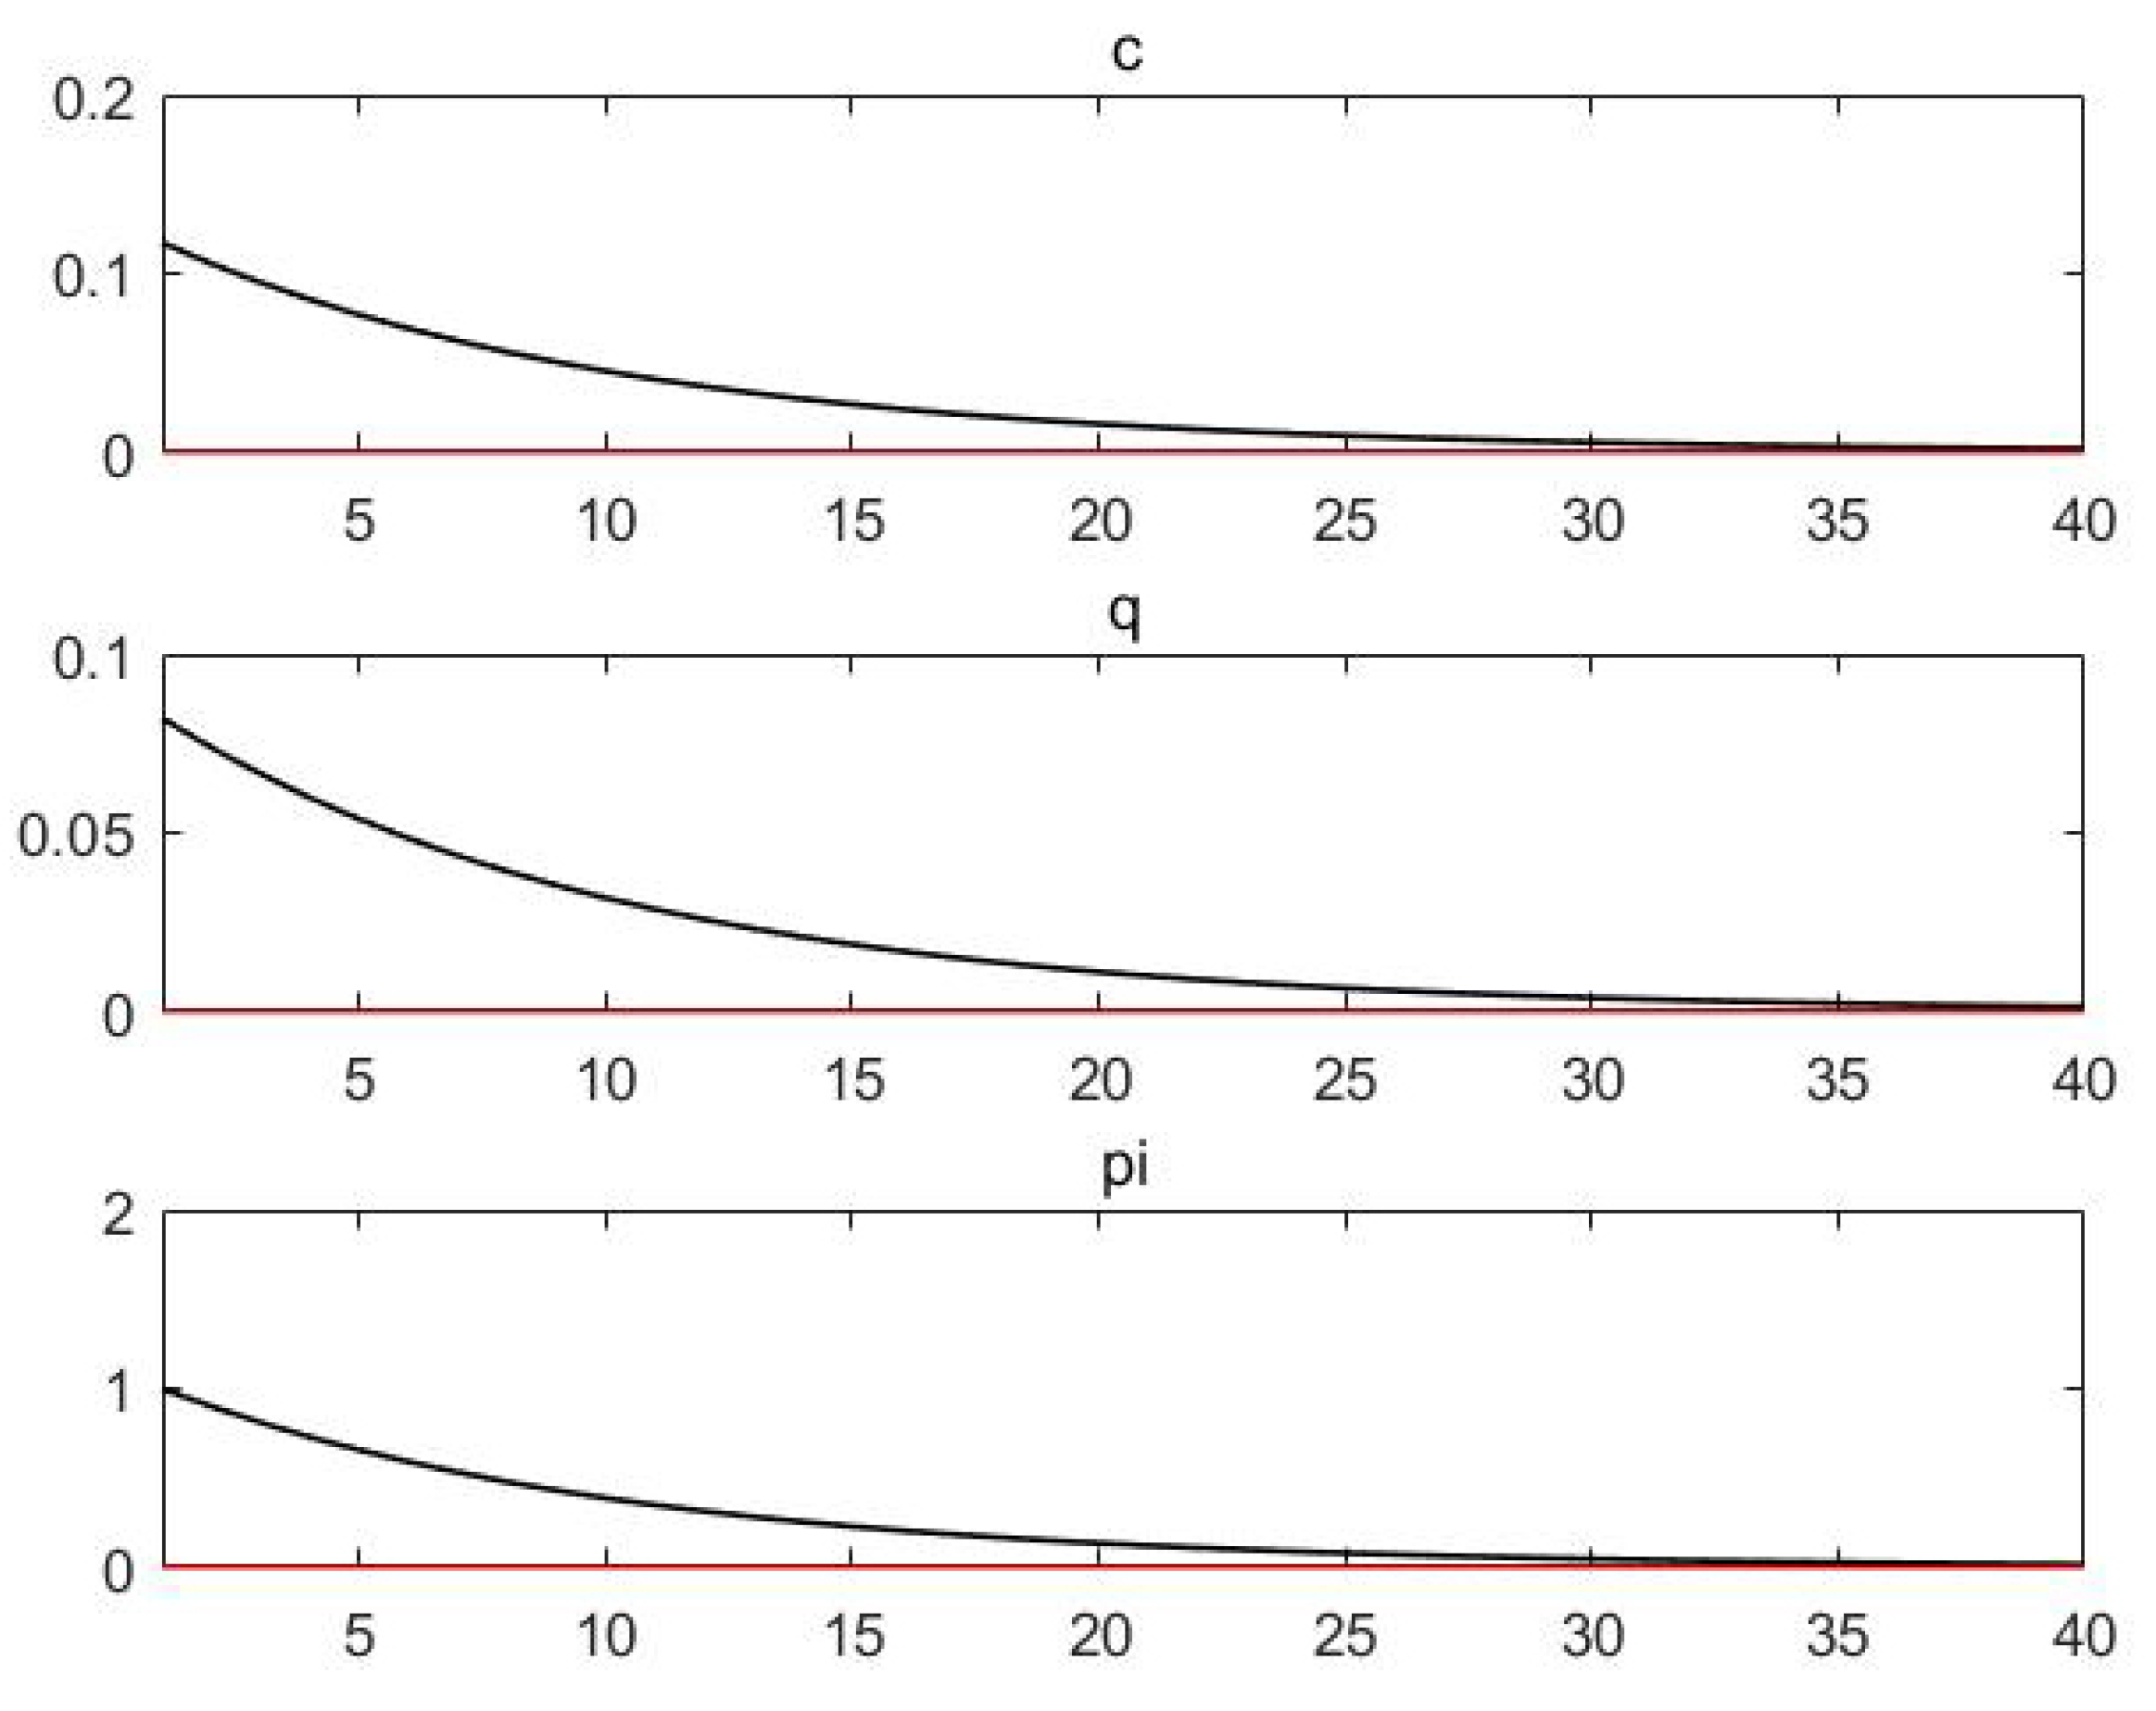
From
Figure 1 and
Figure 2, it can be seen that after the positive impact of technology, the price of consumption and bitcoin increased suddenly and then gradually returned to a steady state.
In our model, the value of bitcoin has two sources, a medium of exchange and a safe-haven asset. When the risk aversion coefficient is low, the demand of the investor for safe-haven assets is low. At this point, the medium of exchange value of bitcoin has a greater impact on its price. When an exogenous shock arrives, the price of bitcoin has the same direction of movement as the shock.
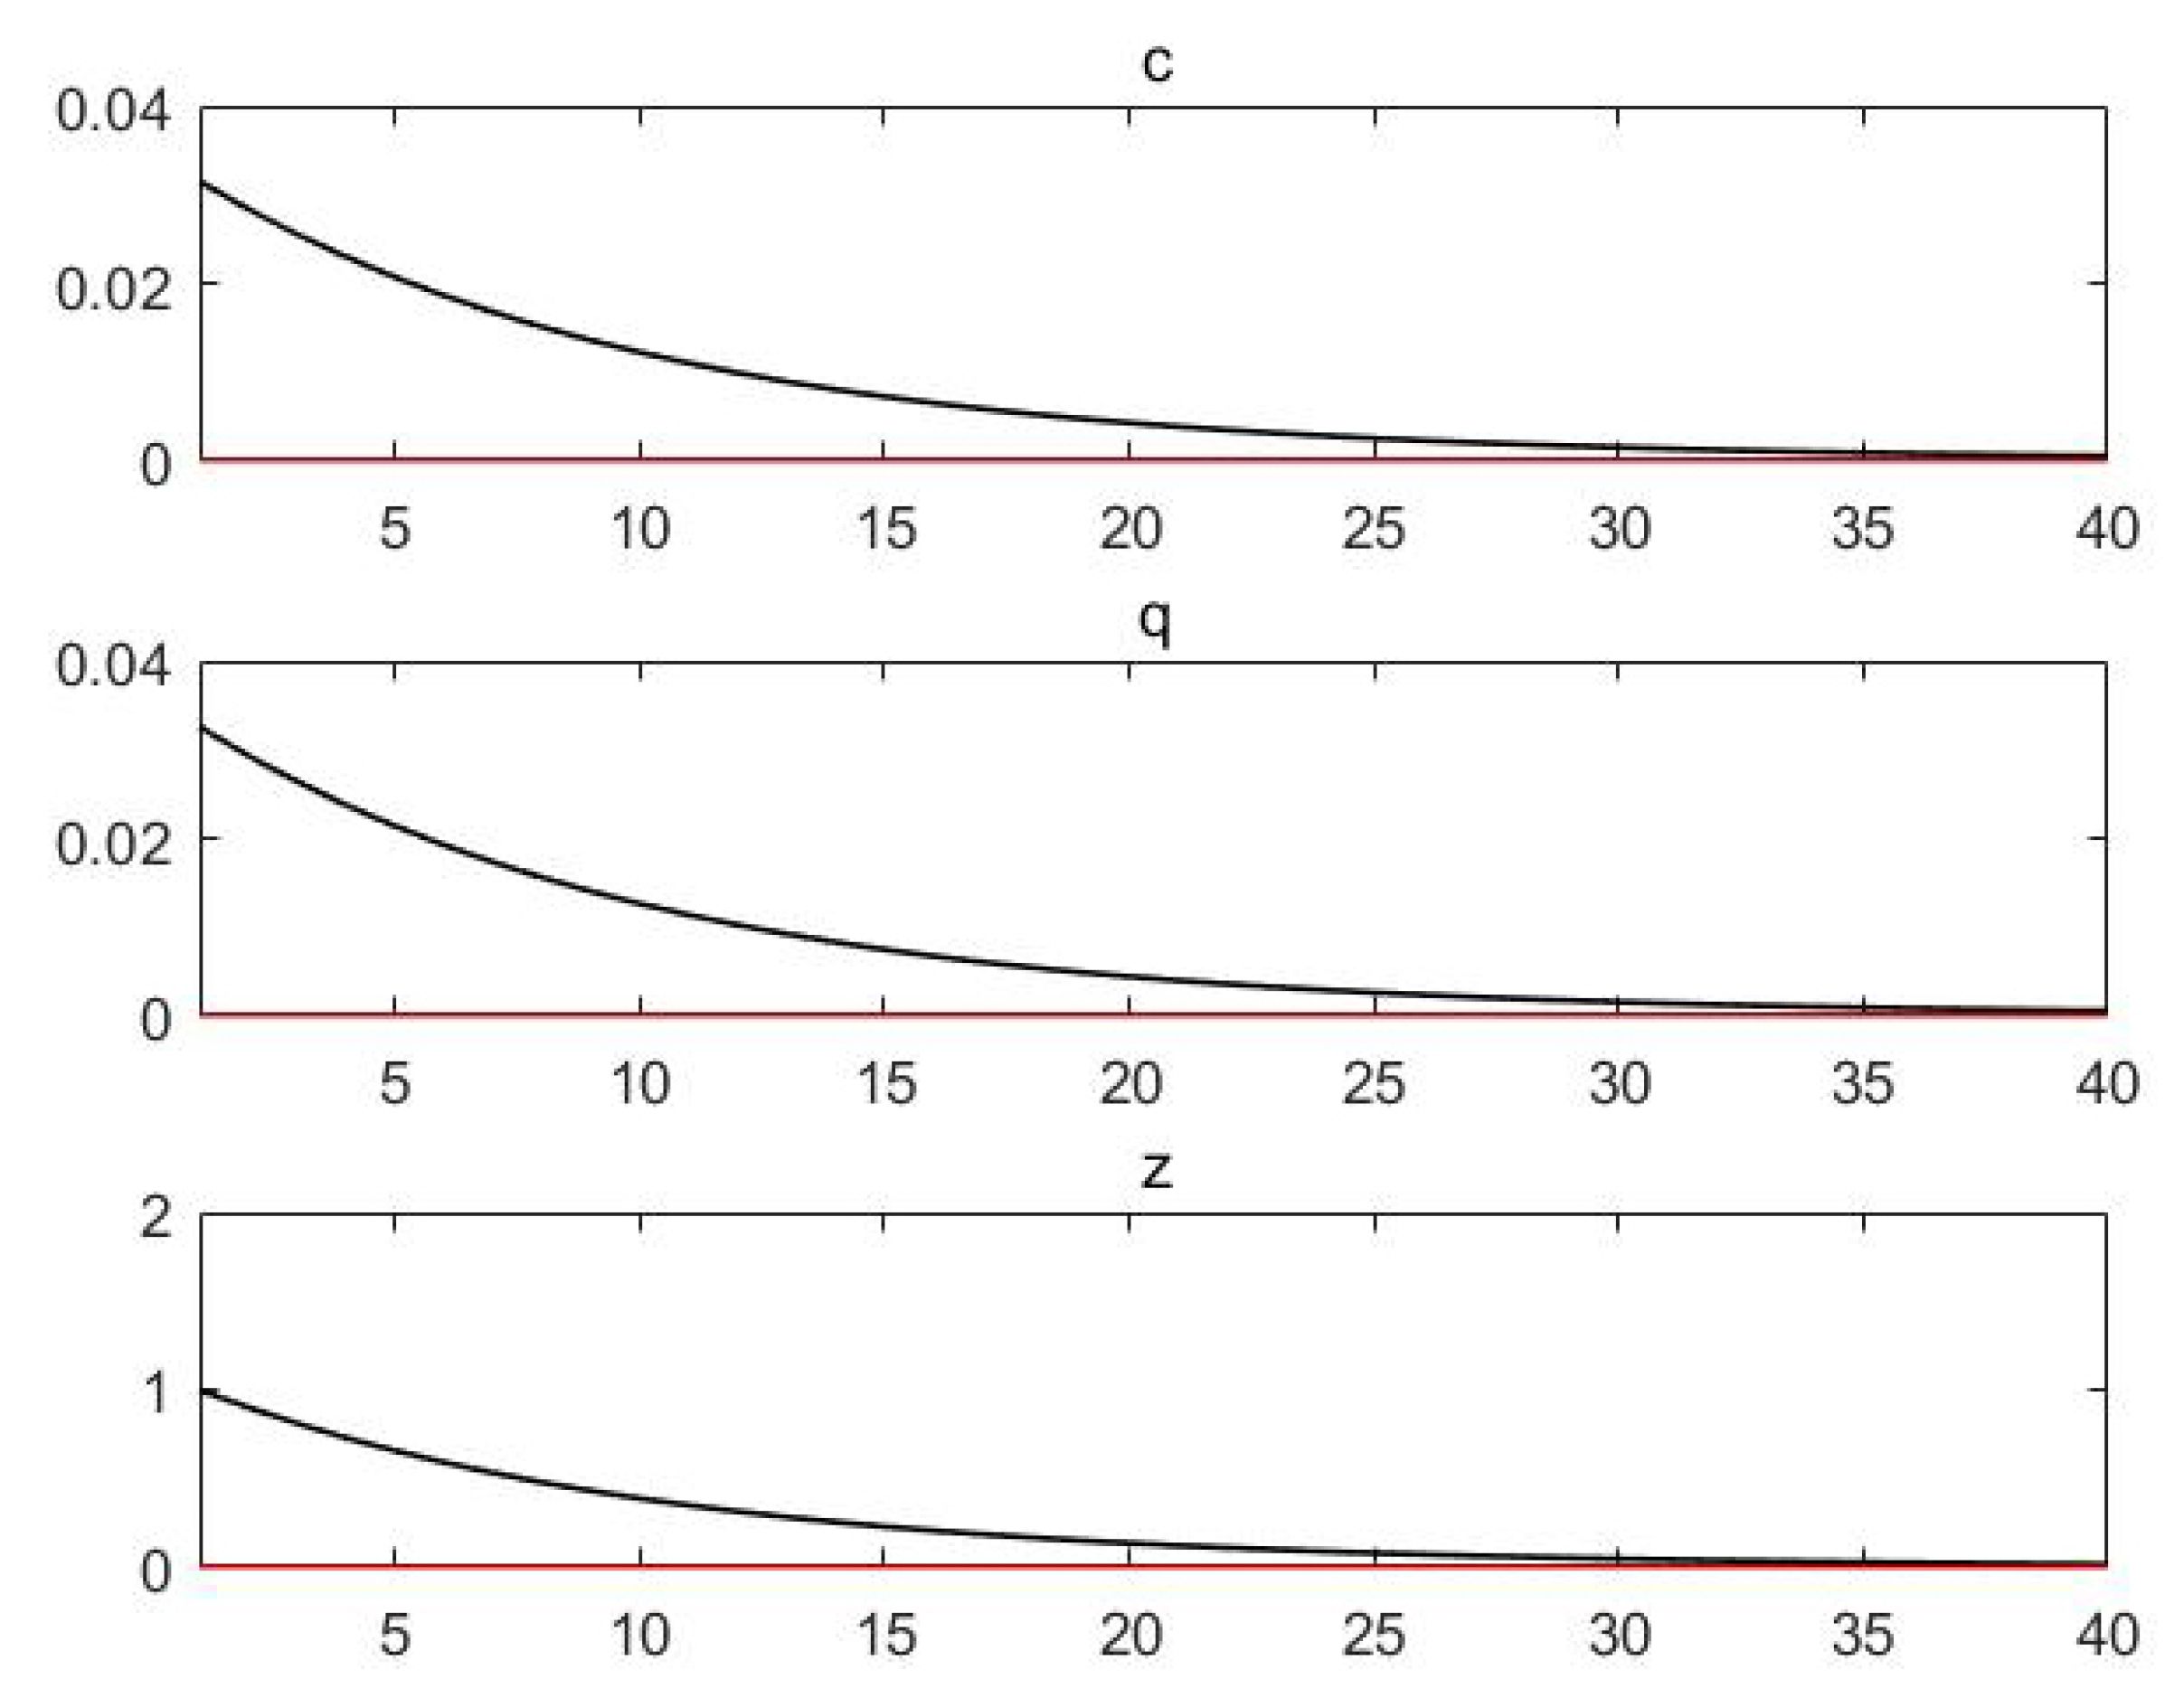
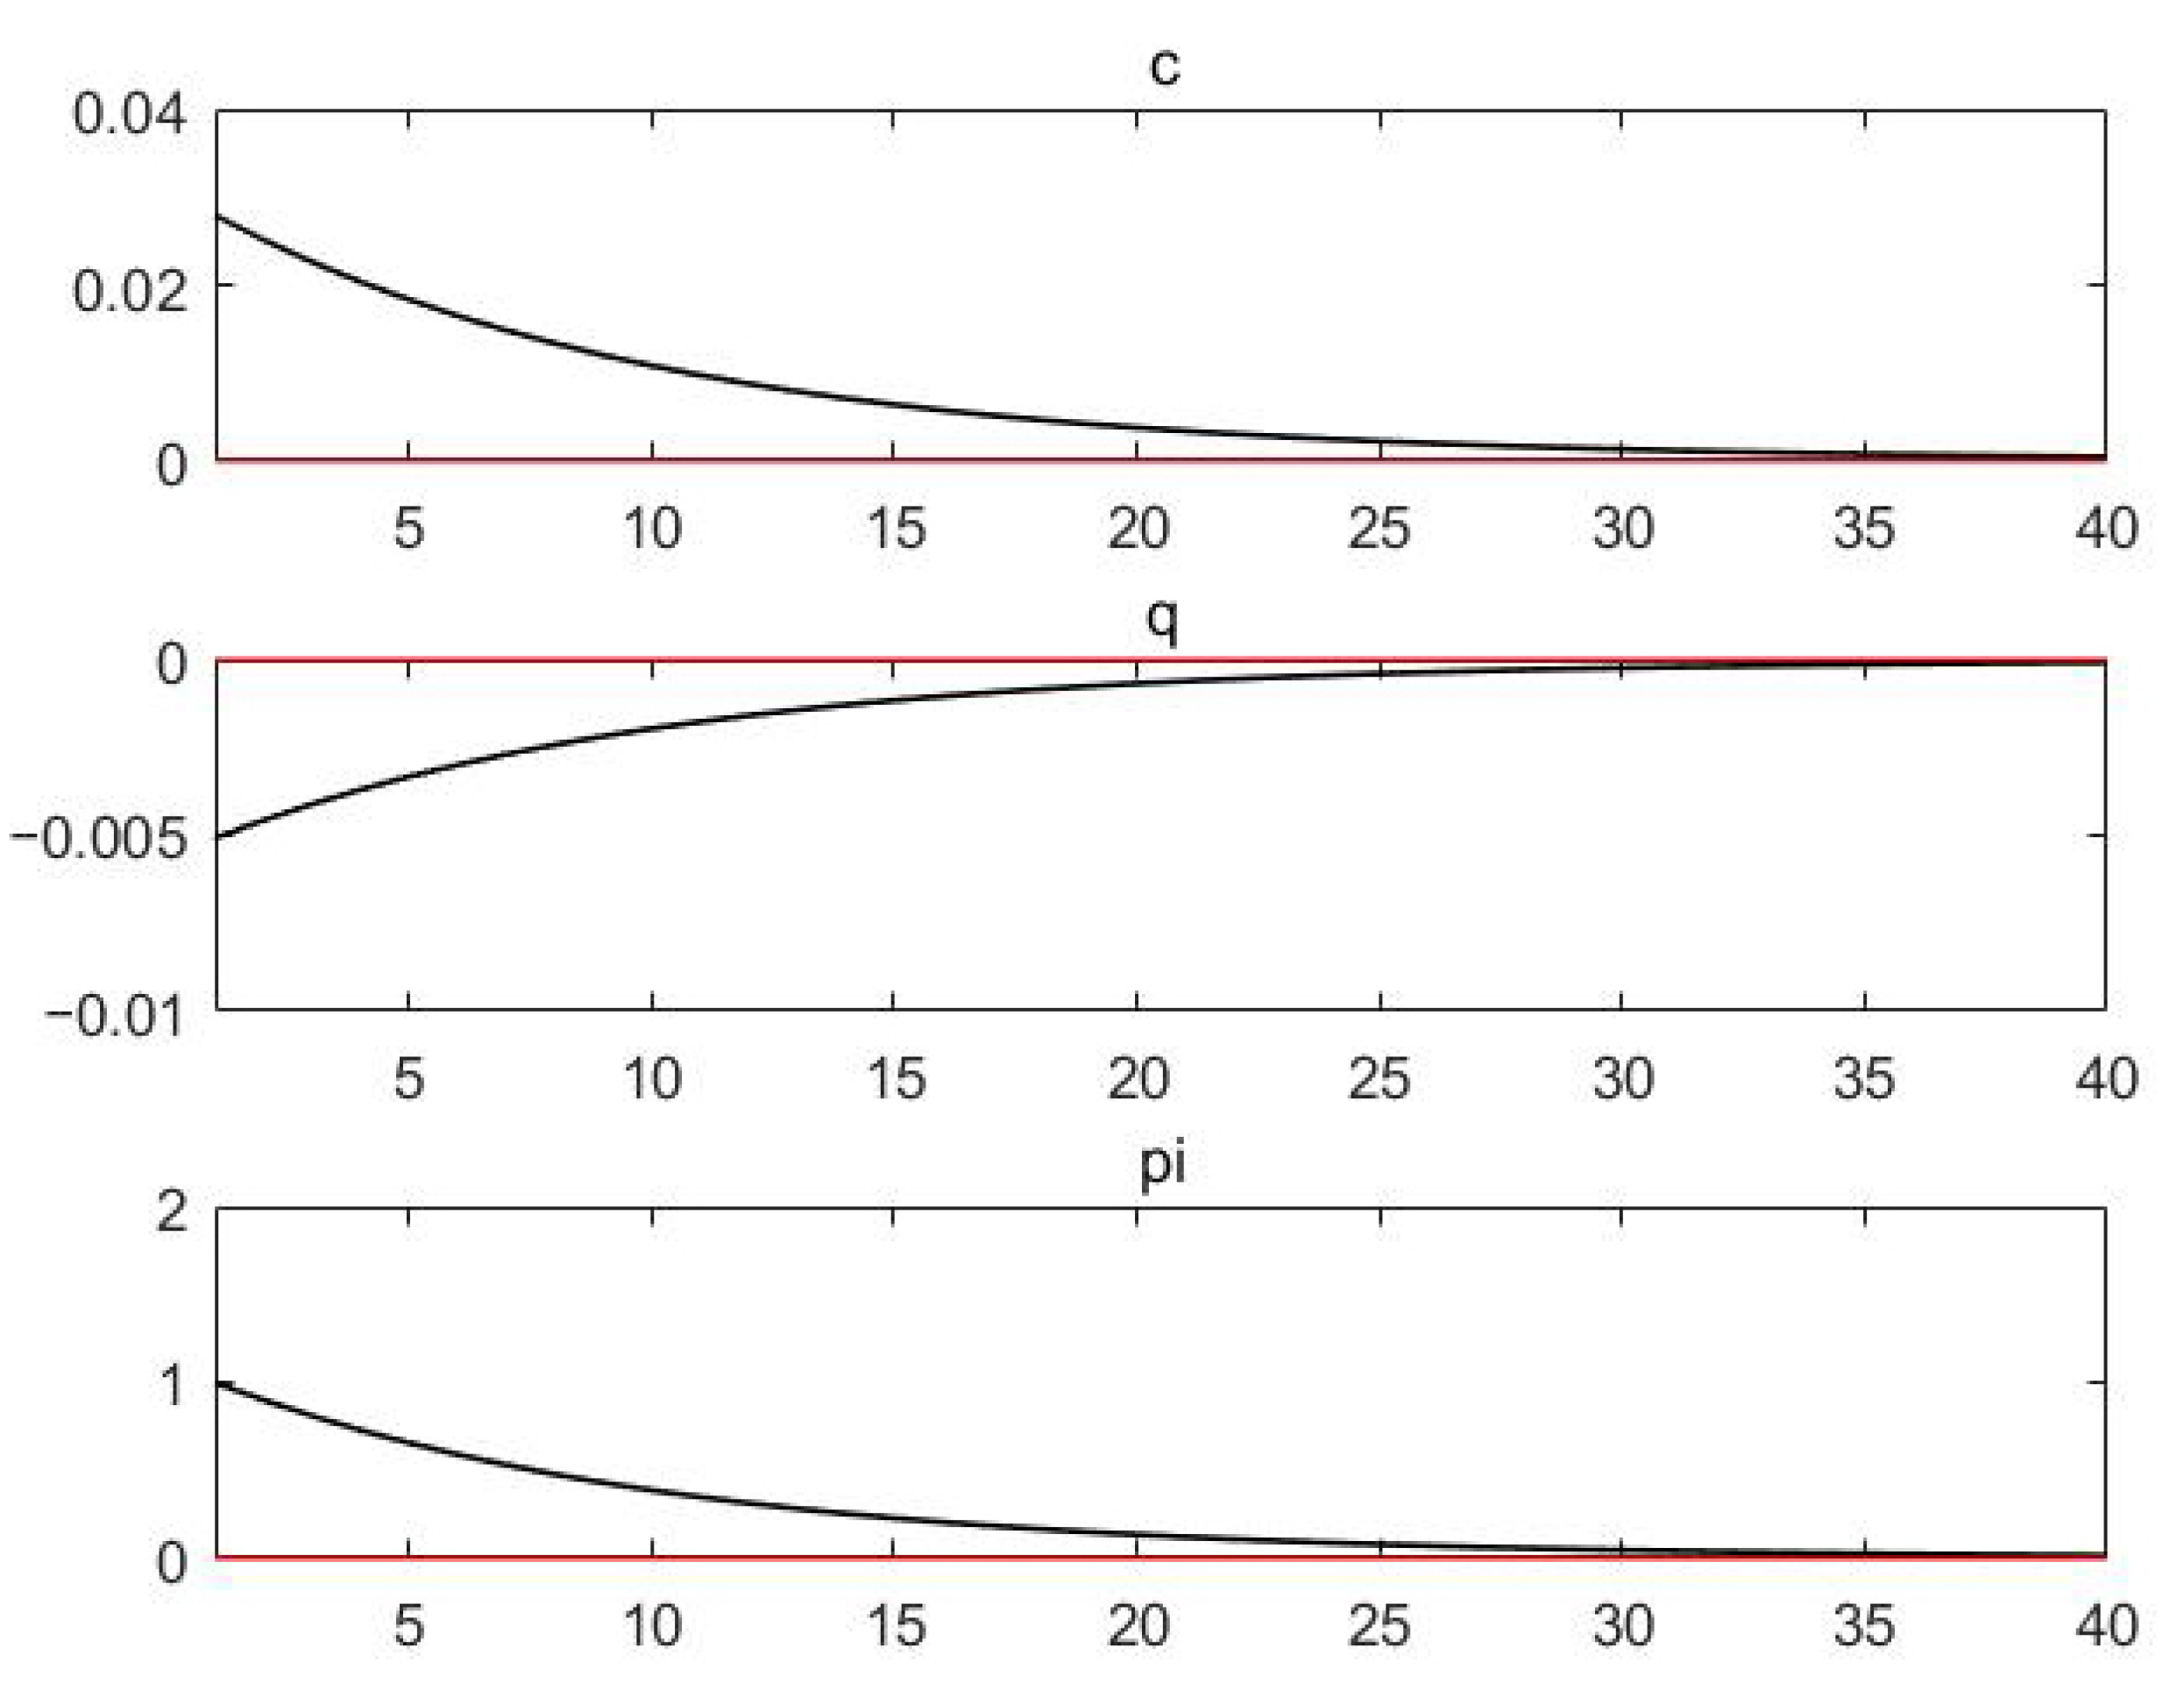
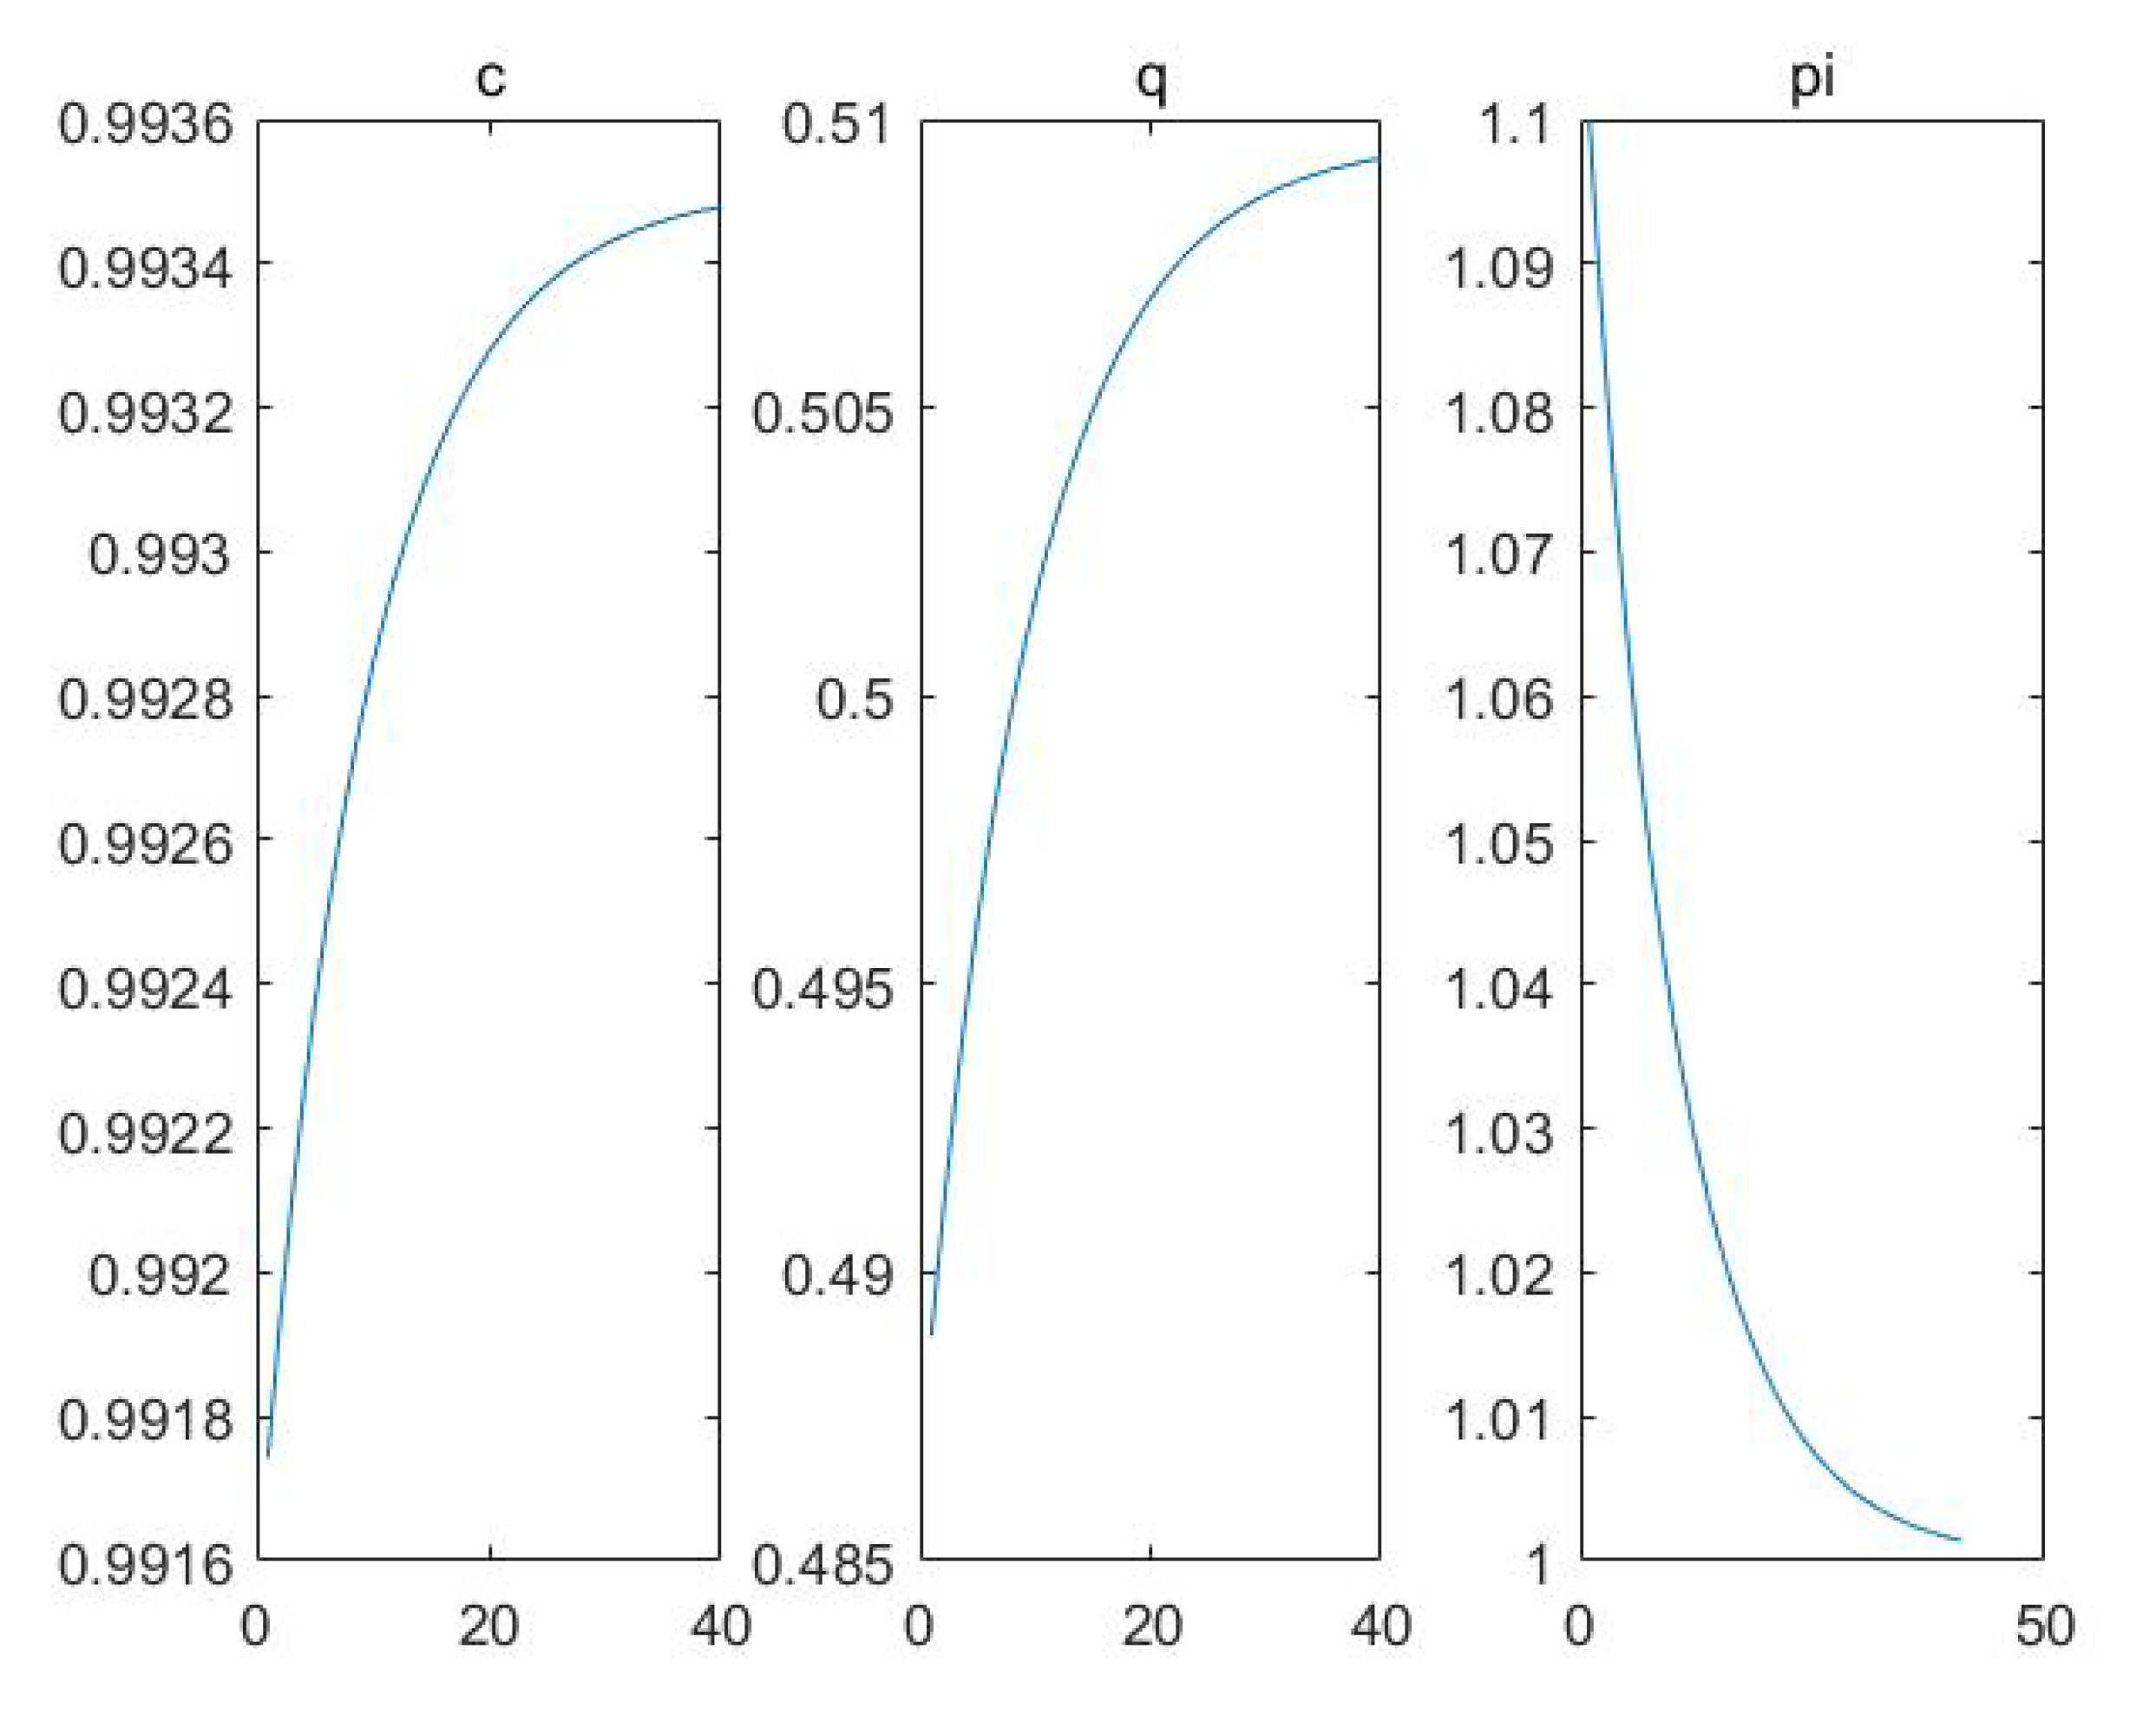
Interestingly, according to the theoretical analysis in
Section 3 (bitcoin’s safe-haven asset properties are more important when risk aversion is high) on dividend shock and bitcoin price, we increase the risk aversion coefficient
to 15, and the dividend shock has different results:
From
Figure 3 and
Figure 4, when a positive dividend shock comes, the price of bitcoin has a sudden drop, and then it returns to a steady state, playing a role as a safe haven asset.
The only difference between the numerical simulations in
Figure 2 and
Figure 4 is that the risk aversion coefficients of investors are different. In the analysis of
Section 3, we find that the core source of value of bitcoin shifts from a medium of exchange to a risk-averse asset when the risk aversion of investors is high. The comparison between the results of
Figure 2 and
Figure 4 confirms this.
In fact, instead of using logarithmic linearization, we can obtain more accurate results by iterating directly from the steady state. We also made such an attempt, but unfortunately, we did not obtain a more robust result due to the complexity of nonlinear equations.
For example, in the case of dividend impact, if we set the parameters as
,
,
, the result is shown in
Figure 5.
From
Figure 5, bitcoin has a certain asset of hedging assets, but it has no apparent relationship with consumption.
If we have the parameters
,
,
,
,
,
,
,
, the result is shown in
Figure 6.
From
Figure 6, consumption and bitcoin prices show the same trend, but the curve is not smooth.
If we set the parameters as
,
,
,
,
,
,
,
, the result is shown in
Figure 7.
From
Figure 7, we finally obtain a smooth result, which is also the shape of most parameter combinations, but different results still reflect the instability of the nonlinear system, so it is difficult to obtain a unified result.
5. The Role of Bitcoin in Classical Asset Allocation Model
To show the role of bitcoin and gold in asset allocation, we will introduce three classic portfolio models and build the first personal investment choice model: the agent minimizes
and is bounded by the constraint of
with
V being the variance-covariance matrix of the return rate,
w being the investment proportion, and I being the unit vector. The solution is
The second model is as follows (
R is the expected return vector of different assets): the agent minimizes
and is bounded by the constraint of
. The solution is
The third model of individual investment choice is as follows: the agent minimizes
and is bounded by the constraint of
. The solution is
The data in this paper come from the CEIC data set (CEIC Data, an ISI Emerging Markets Group company) and Wind database, and the logarithmic rate of return is used. The descriptive statistics of the data are shown in
Table 1.
This table shows the descriptive statistics of the data used in this paper.
Next, the data are used in three portfolio models.
First, the results of the portfolio model (
9) are compared, the exchange rate return is used, and S & P 500 return and Shanghai composite index return are combined with gold and bitcoin to calculate the minimum variance of the return.
Table 2 shows the minimum variance of the logarithmic return of the three underlying portfolios with bitcoin or gold.
From
Table 2, the results show that both gold and bitcoin can play the role of risk diversification and cannot completely replace each other, but gold has a more vital ability of risk diversification.
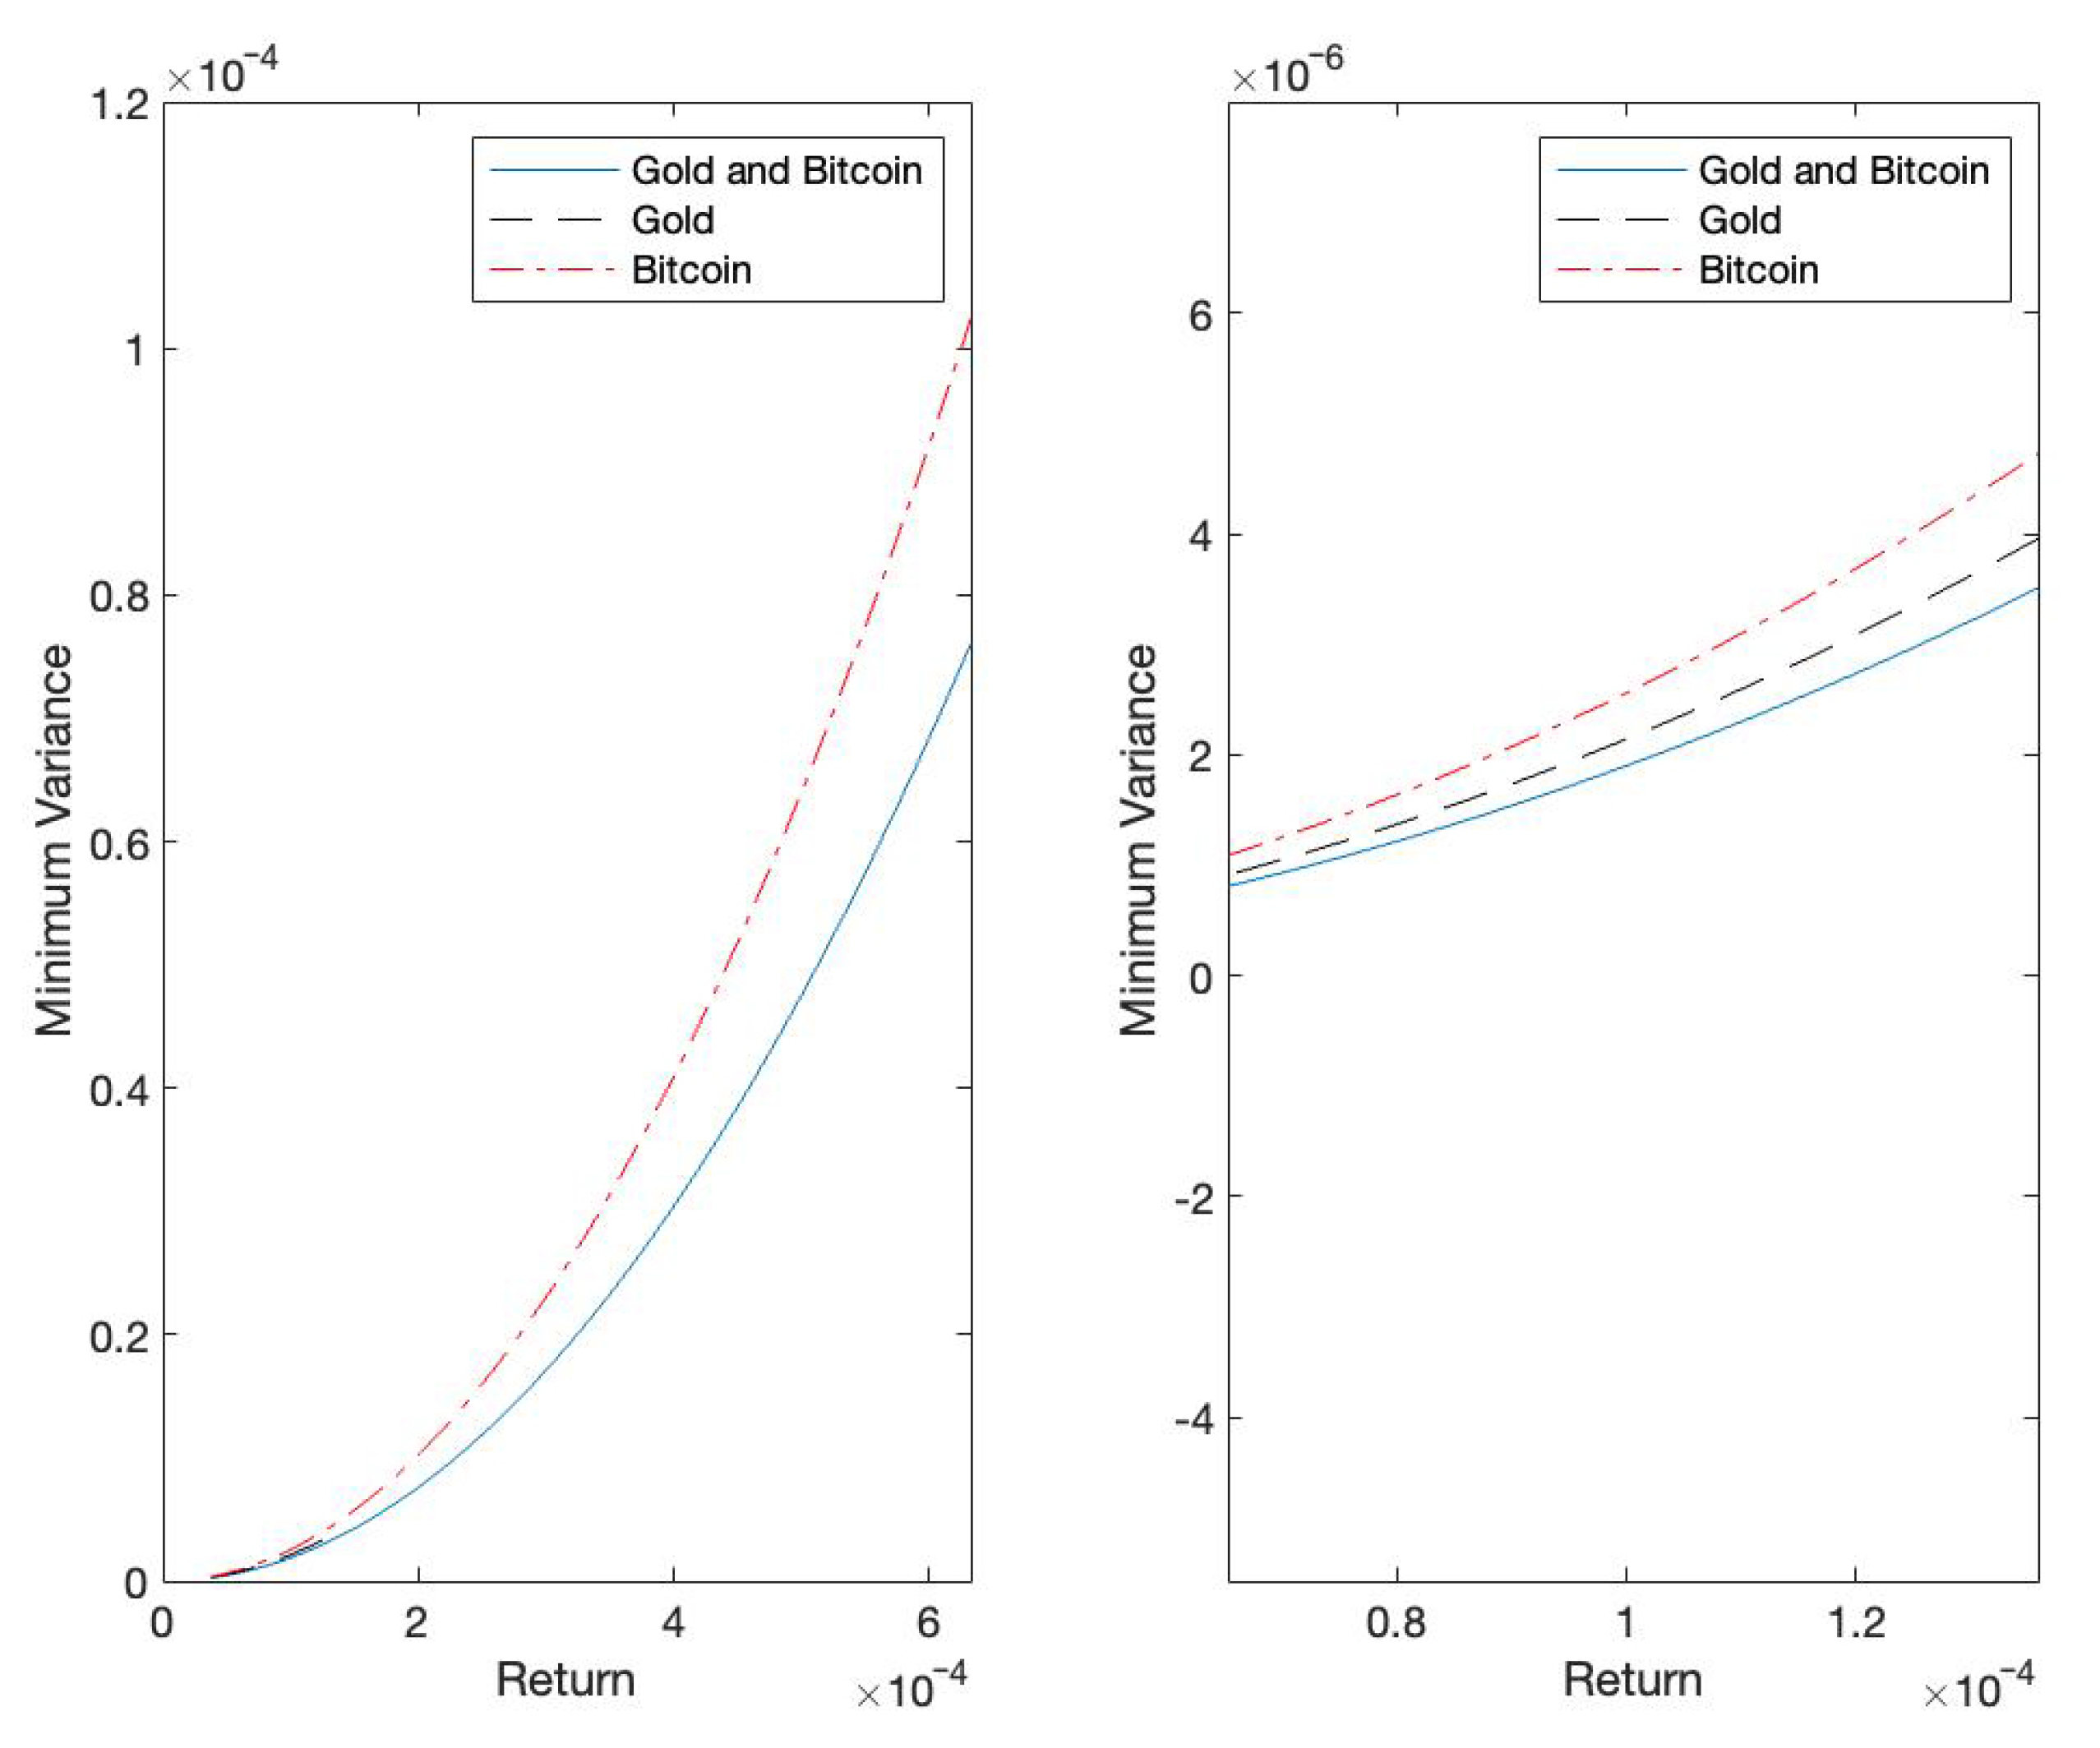
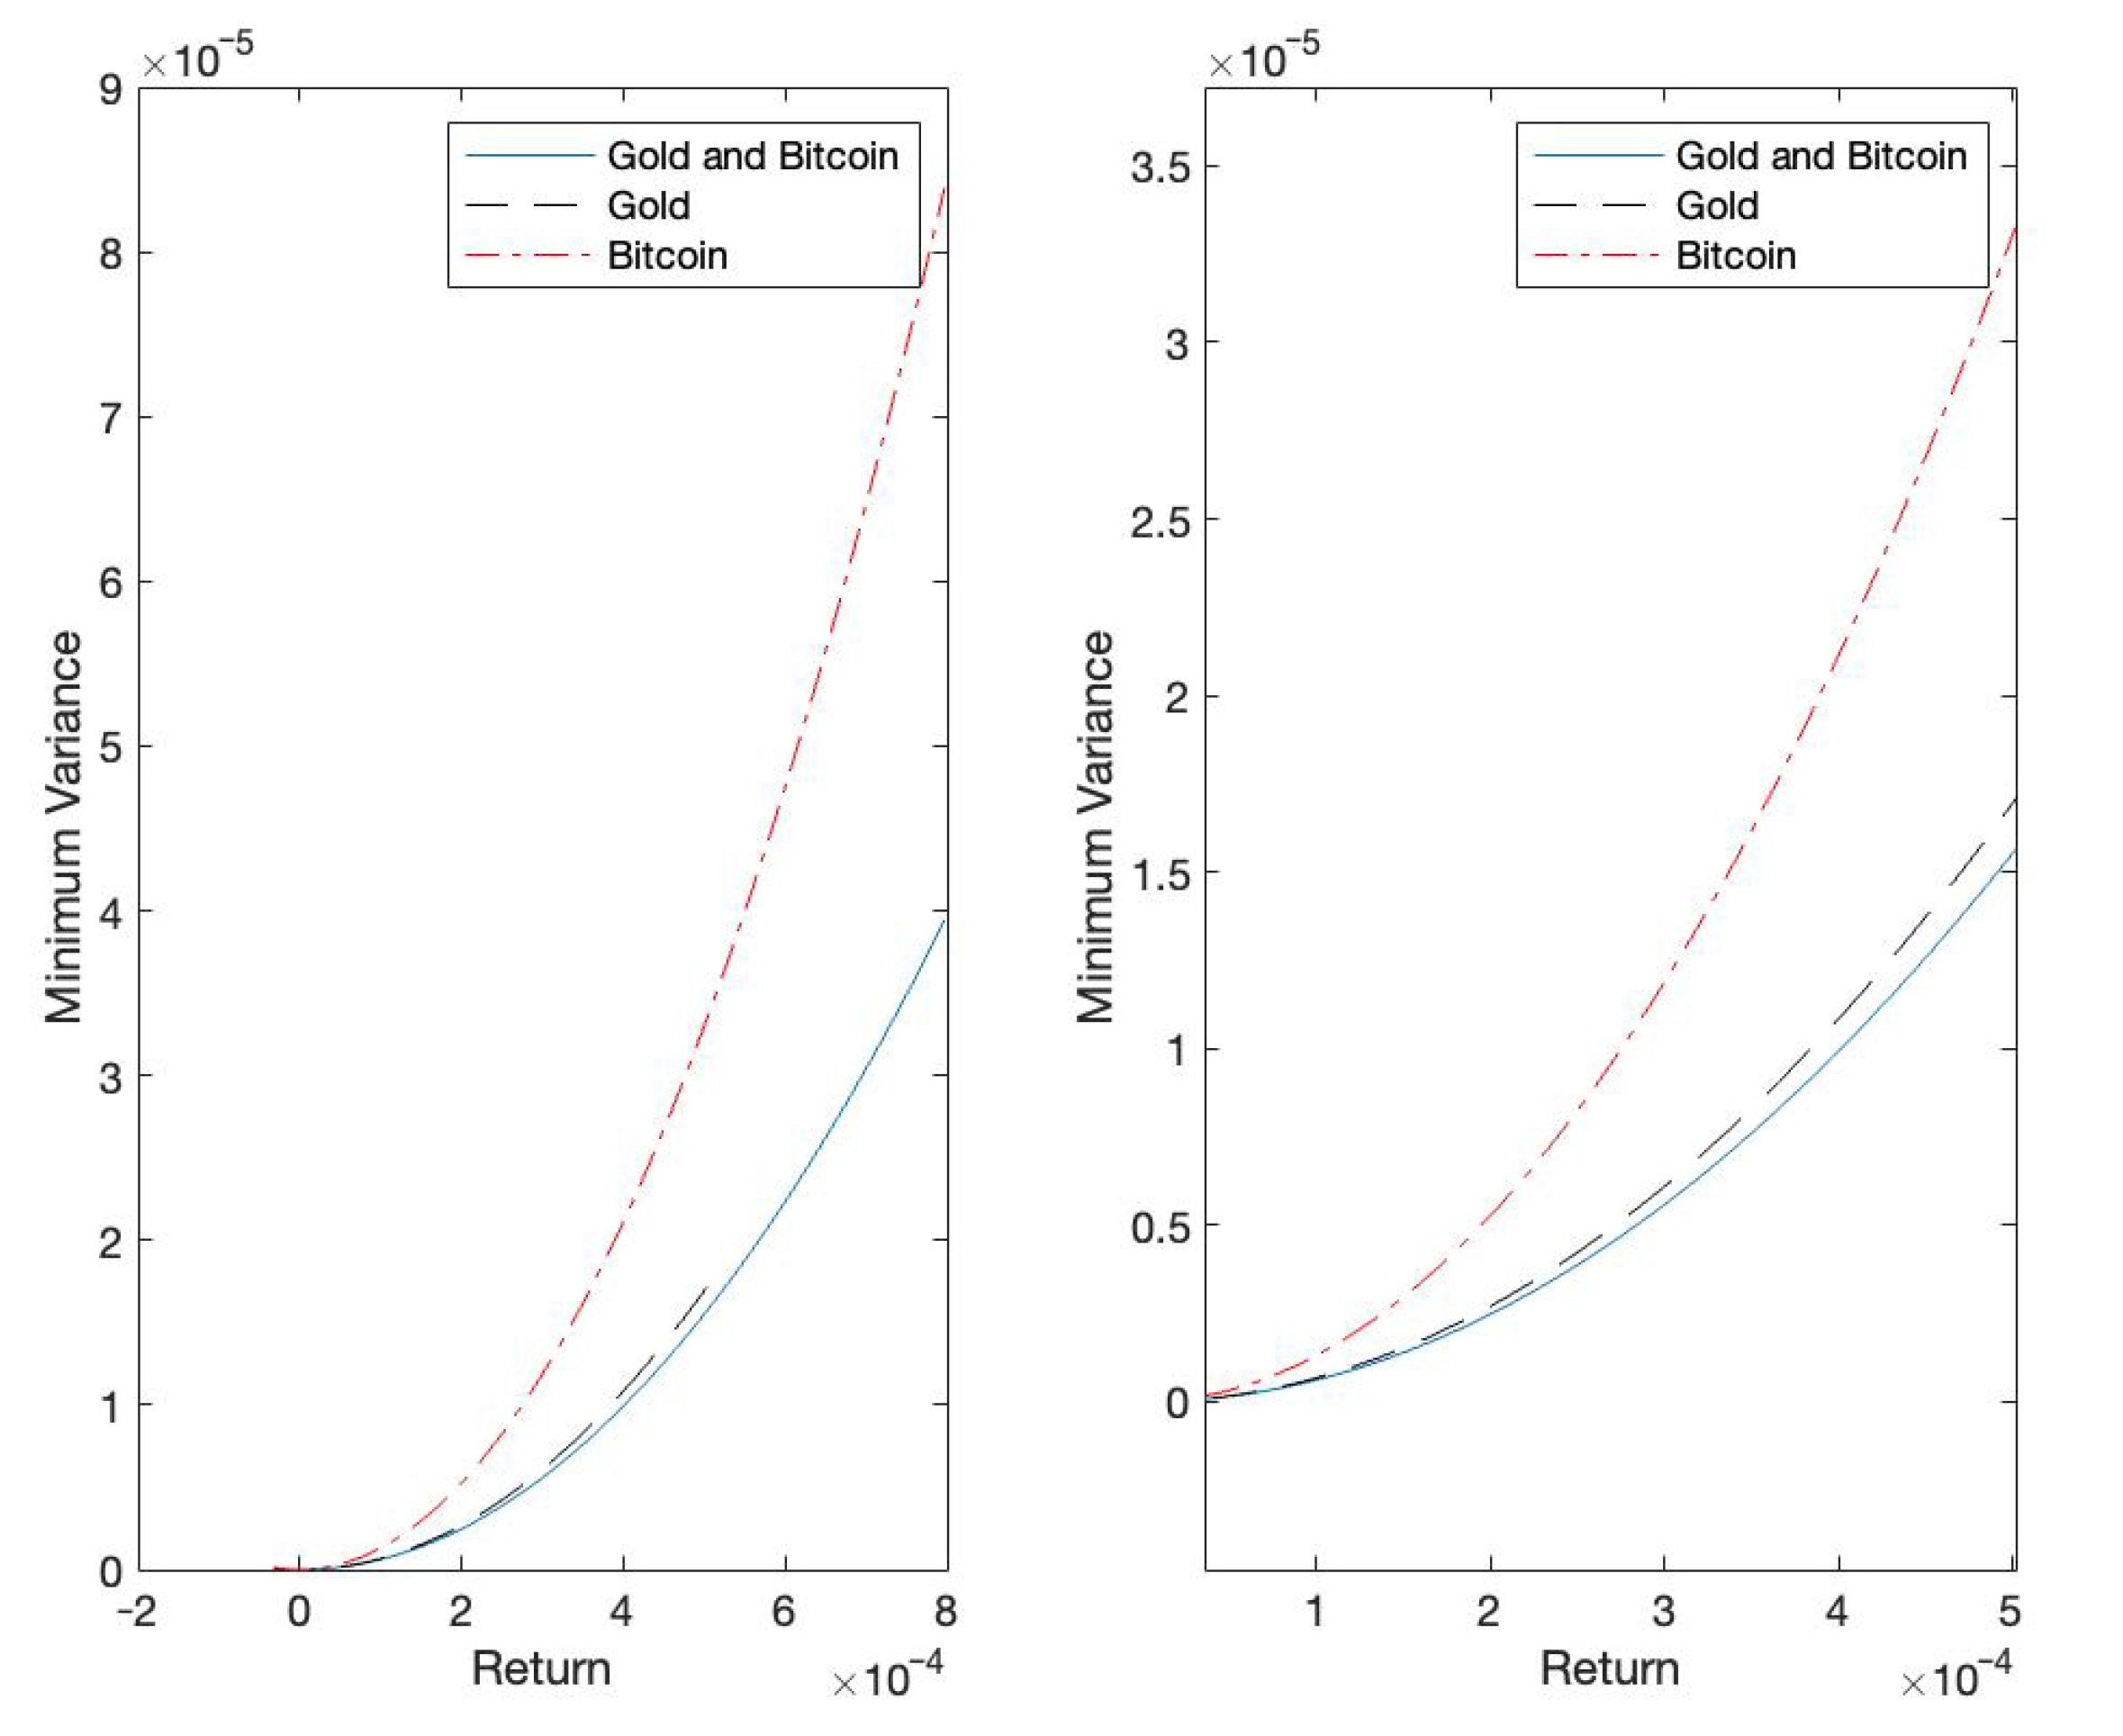
Next, we show the results of the portfolio model (
10), using exchange rate return, S & P 500 return, and Shanghai composite index return combined with gold and bitcoin to calculate the minimum variance under the condition of guaranteed return.
From
Figure 8, there is no doubt that it is best to invest in bitcoin and gold at the same time. In this case, the rate of return has the widest range, and the minimum variance is the smallest under the same rate of return. Gold has a better risk dispersion function than bitcoin, but the high return of bitcoin widens the range of return.
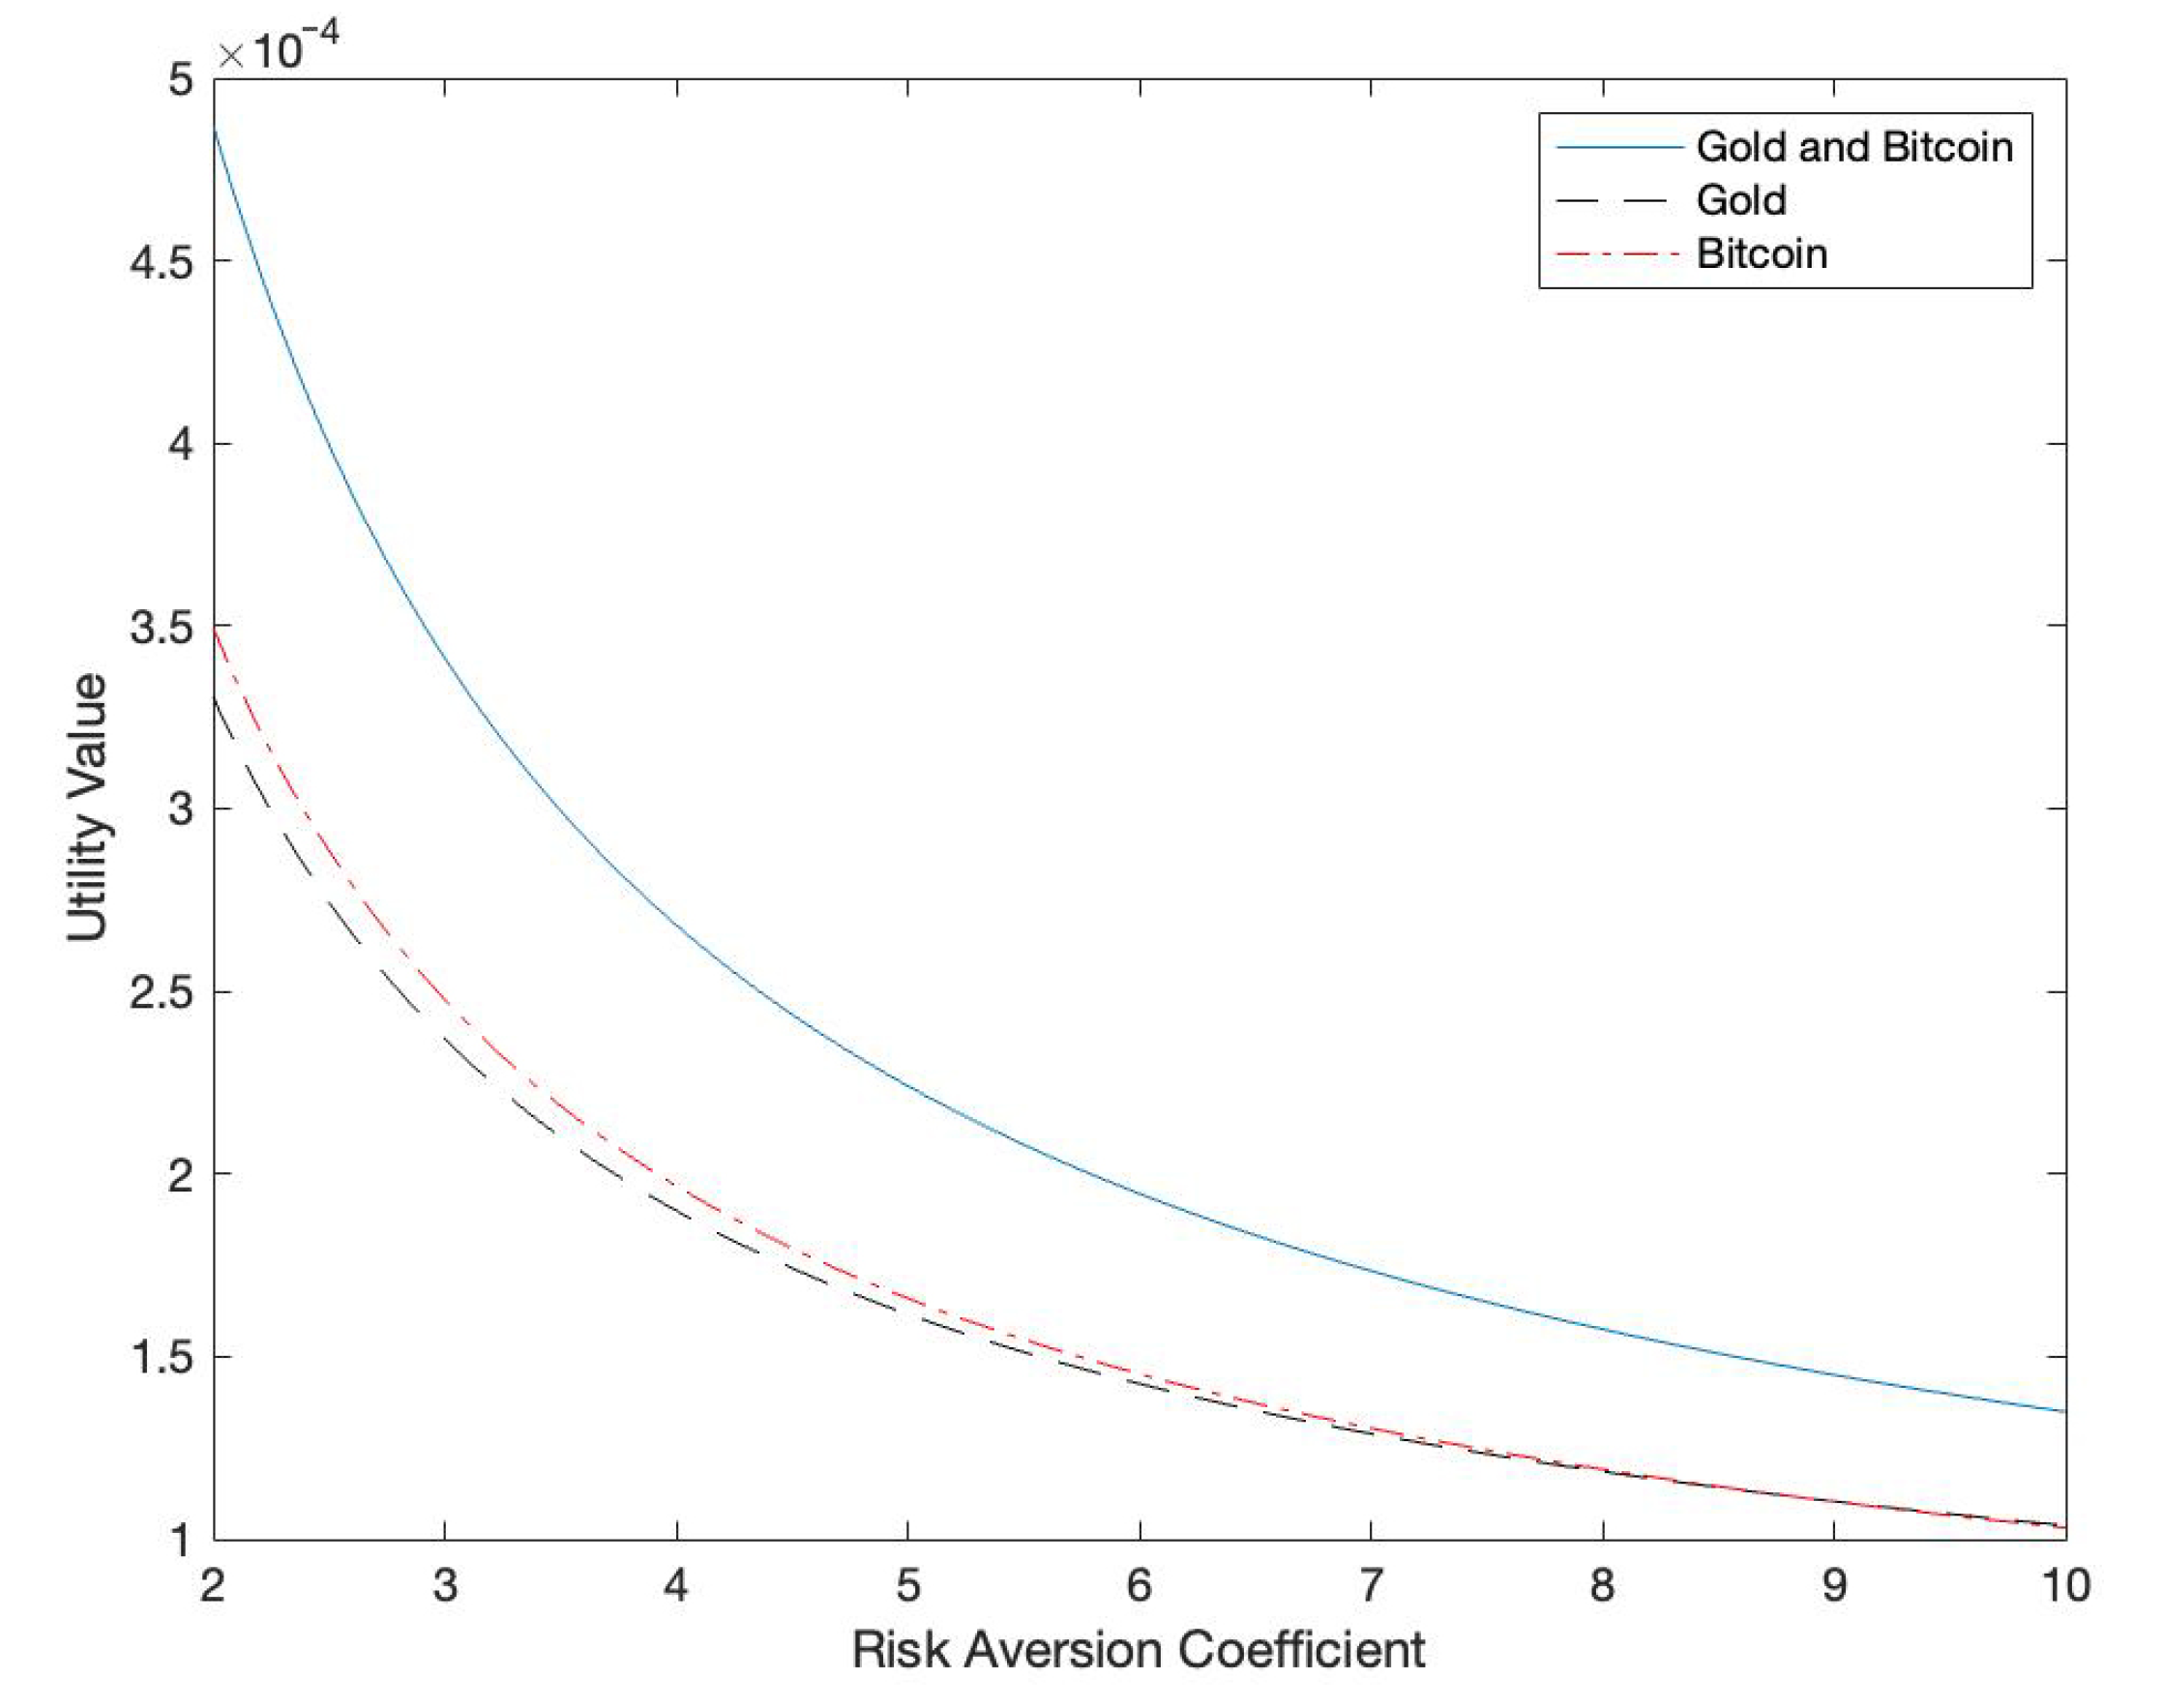
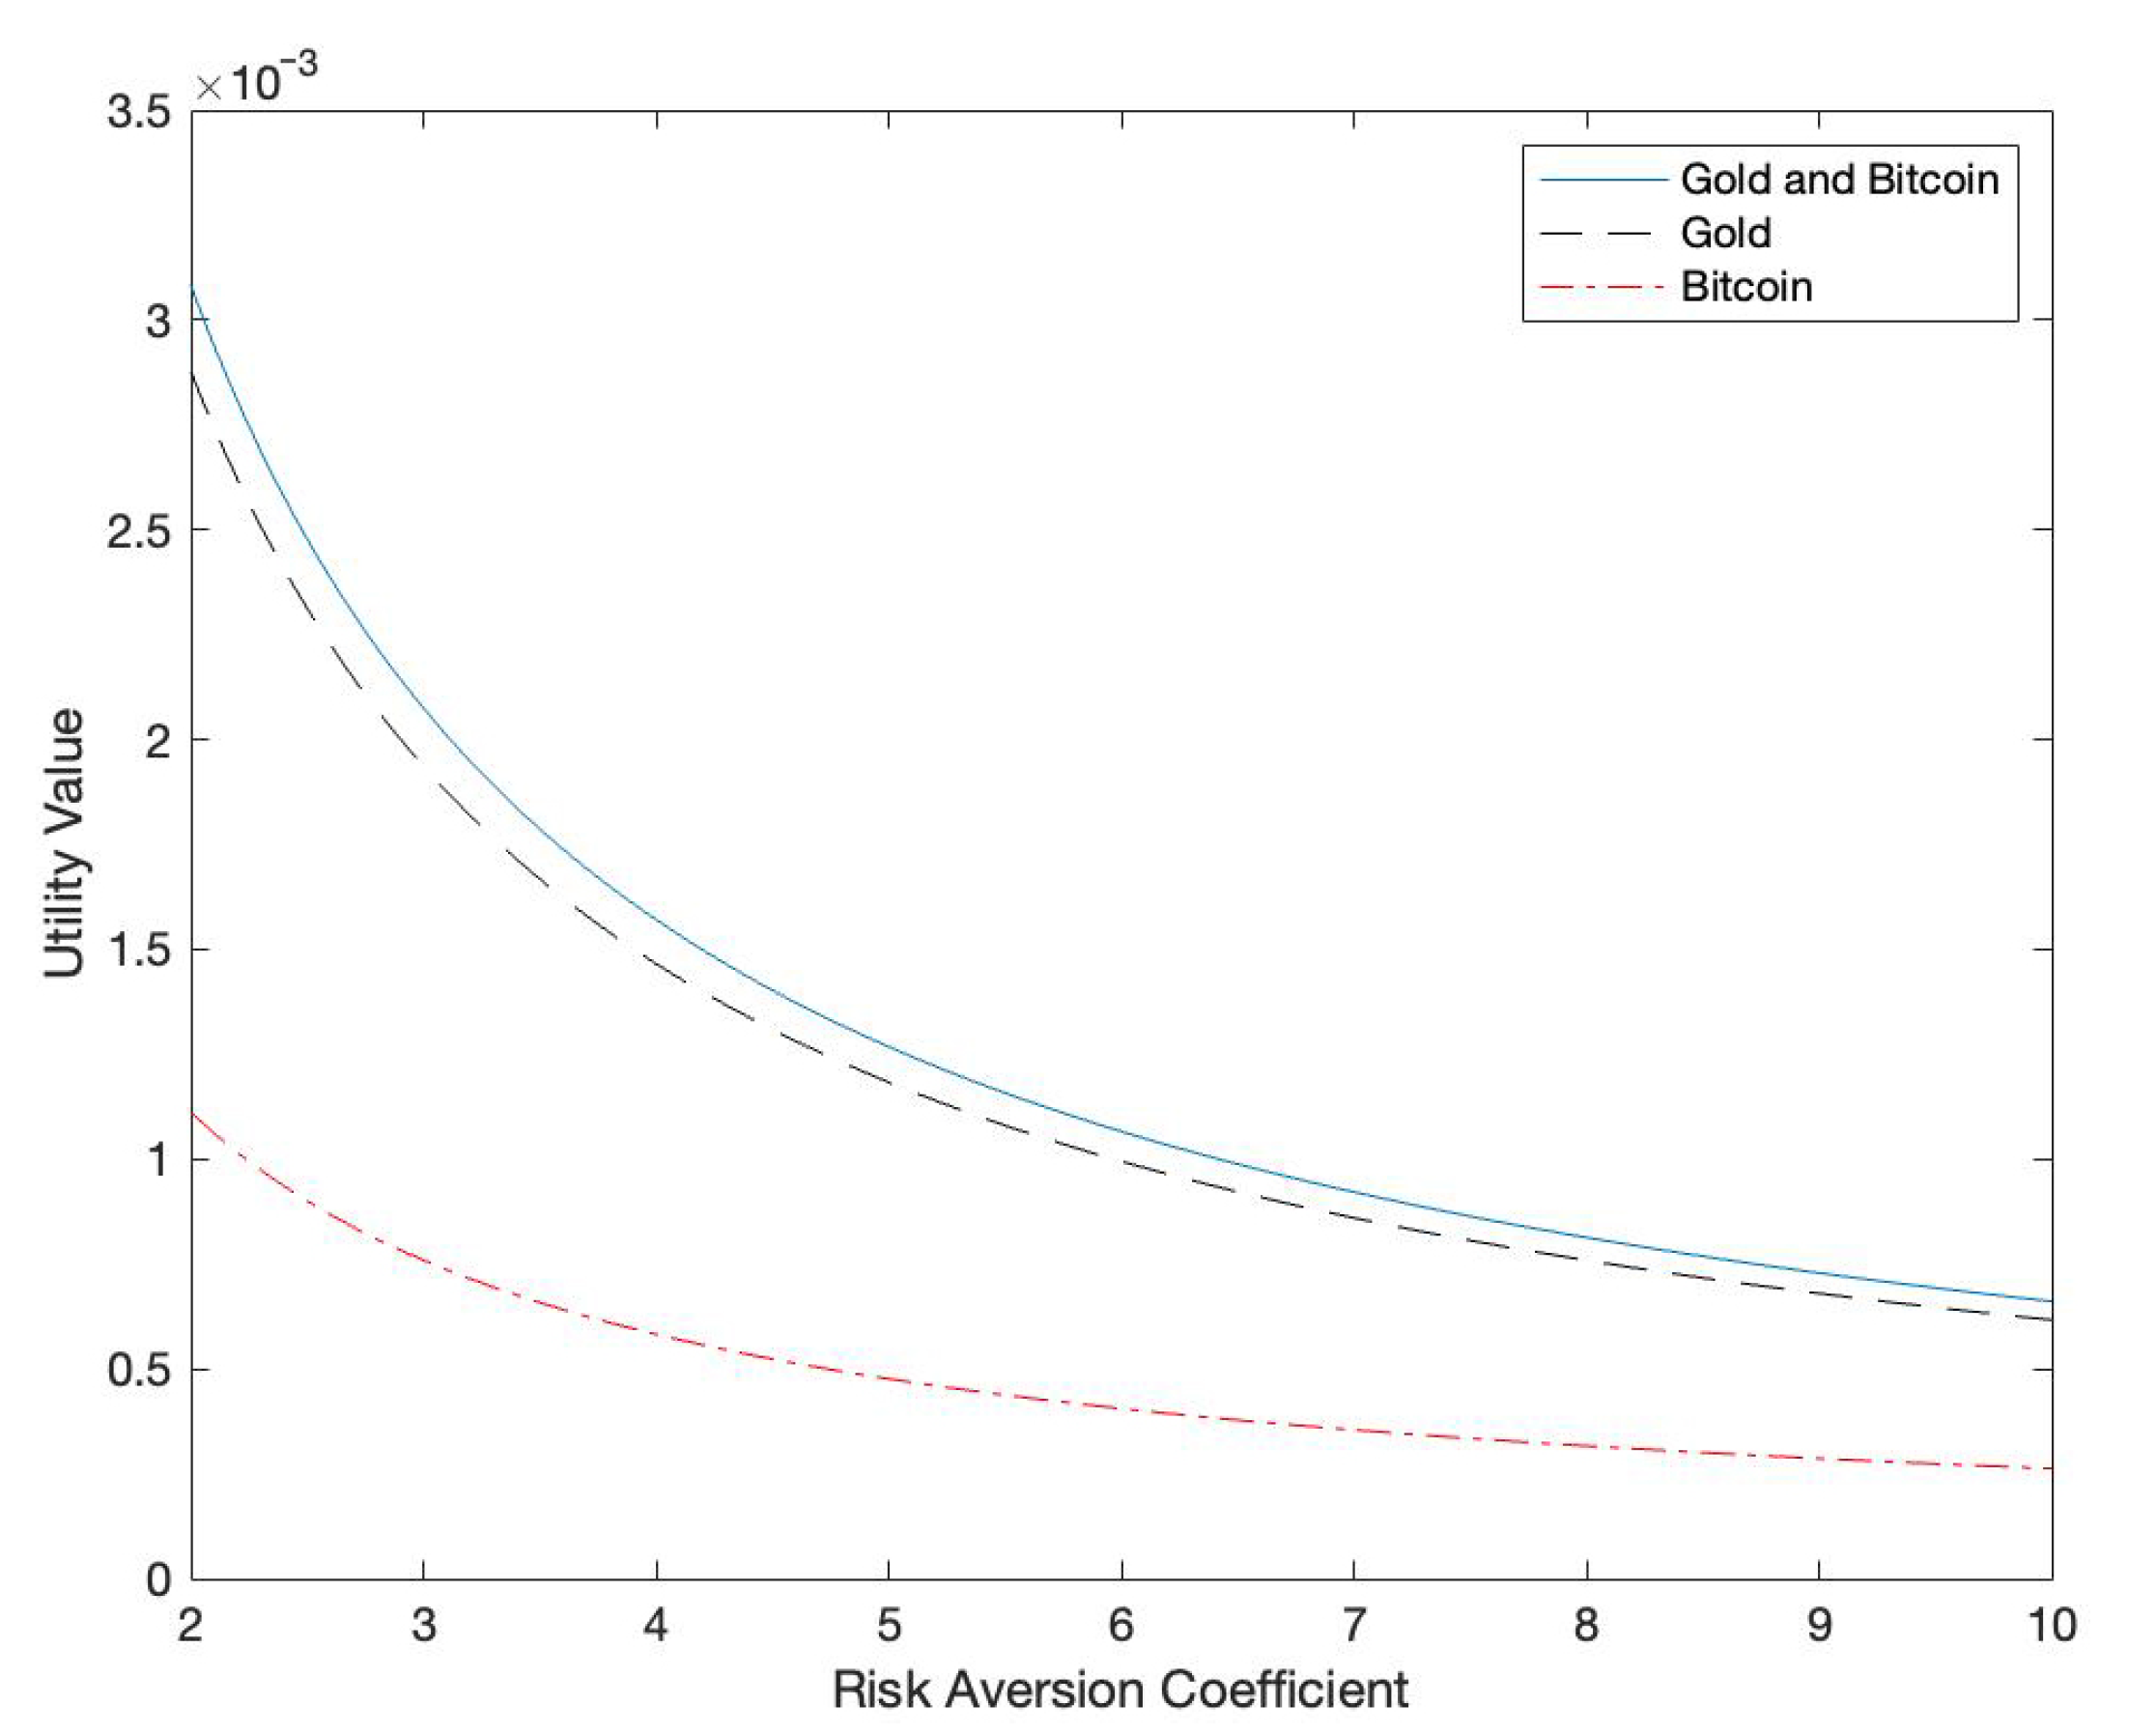
Next, we empirically analyze the portfolio model (
11) and calculate the maximum utility value under different risk aversion coefficients by using the exchange rate return, S & P 500 return, and Shanghai Composite Index Return combined with gold and bitcoin.
The case of investing in gold and bitcoin at the same time has the highest utility. However, the utility value is similar in the case of bitcoin investment or bitcoin investment, and it can be seen that the utility value is significantly lower than that in the case of bitcoin investment at the same time.
From
Figure 9, bitcoin and gold can play the role of risk diversification in asset allocation from the full sample data. However, bitcoin and gold play different and complementary roles in asset allocation.
Next, we use the data after the epidemic in 2020 to calculate. Using the results of the portfolio model (
10), we use the exchange rate return, S & P 500 return, and Shanghai composite index return combined with gold and bitcoin to calculate the minimum variance of the return.
Table 3 shows the minimum variance of the logarithmic return of the three underlying portfolios with bitcoin or gold.
From
Table 3, under the impact of the epidemic, the results of asset allocation are quite different from those in the whole sample data. Of course, under the influence of the epidemic, the risk of all assets has increased, and the volatility has become more intense. There is no doubt about that. However, bitcoin shows a better risk diversification effect than gold. This suggests that bitcoin may be a better safe haven than gold in a time of widespread health crisis.
We use the data after the epidemic in 2020 to calculate the results of the portfolio model (
10). We use the exchange rate return, S & P 500 return, and Shanghai composite index return combined with gold and bitcoin to calculate the minimum variance under the condition of ensuring the return.
From
Figure 10, the results are different from those in the whole sample. Although bitcoin still brings a wider range of income, and gold brings better risk hedging, it can be seen clearly that the return rate of gold to the portfolio has indeed improved during the epidemic period.
Then, we empirically use the data after the epidemic in 2020 to calculate the maximum utility value under different risk aversion coefficients by using the exchange rate return, S & P 500 return, and Shanghai Composite Index Return combined with gold and bitcoin.
From
Figure 11, this result is different from the result of the whole sample. Using gold as part of the asset portfolio can obtain better utility value than bitcoin during the epidemic period. Of course, it is optimal to invest in both at the same time.
7. Conclusions
The price of bitcoin has been rising for more than 10 years since it was invented, and now it has been maintained at a high level of more than USD 40,000. As a new type of financial asset which is different from all previous financial assets—that is, having no fundamental value return—it has aroused extensive discussion.
Bitcoin, as an asset first invented to replace centralized currency, is often compared with gold and legal currency. Bitcoin has a limited total amount and certain characteristics similar to gold, and it is not as difficult as gold to adapt to the current high-speed economic activities. In this paper, we use a macro model of incomplete substitution of bitcoin and centralized currency to characterize the price of bitcoin. We find that bitcoin does have a certain hedging asset attribute when the risk aversion is high, and it has a procyclical property when the risk aversion is low.
In the process of numerical simulation, we find that the positive impact of technology will bring about the positive growth of bitcoin’s price and consumption. When the risk aversion coefficient is low, the positive impact of dividends will lead to the positive growth of bitcoin’s price and consumption in the same direction. However, a higher risk aversion coefficient will lead to positive growth of consumption and negative growth of bitcoin’s price. At this time, bitcoin shows the property of hedging assets, which is consistent with the theoretical results. The comparison between
Figure 2 and
Figure 4 illustrates this point well. When an exogenous dividend shock hits, the bitcoin price changes in tandem with the shock for low-risk aversion and inversely with the shock for high-risk aversion.
For the numerical simulations, we used data from the CEIC data set and the Wind data set. We hope that future researchers can extend this to more time and assets using similar research methods.
In portfolio testing, we found that bitcoin did play a different role than gold. Bitcoin has a better return curve than gold, but its risk hedging ability is inferior to gold throughout the whole time sample. During the outbreak of COVID-19, bitcoin showed a better hedging ability than gold.


