Article

Evaluation of Cryptocurrencies for Investment Decisions in the Era of Industry 4.0: A Borda Count-Based Intuitionistic Fuzzy Set Extensions EDAS-MAIRCA-MARCOS Multi-Criteria Methodology

by
Fatih Ecer
1,
Adem Böyükaslan
2 and
Sarfaraz Hashemkhani Zolfani
3,*
1
Sub-Department of Operations Research, Faculty of Economics and Administrative Sciences, Afyon Kocatepe University, 03030 Afyonkarahisar, Turkey
2
Department of International Trade and Finance, Faculty of Economics and Administrative Sciences, Afyon Kocatepe University, ANS Campus, 03030 Afyonkarahisar, Turkey
3
School of Engineering, Universidad Catolica del Norte, Larrondo, Coquimbo 1281, Chile
*
Author to whom correspondence should be addressed.
Axioms 2022, 11(8), 404; https://doi.org/10.3390/axioms11080404
Submission received: 26 July 2022 / Revised: 10 August 2022 / Accepted: 12 August 2022 / Published: 15 August 2022
(This article belongs to the Special Issue Fuzzy Set Theory and Its Applications in Decision Making)

Abstract

:
Blockchain technologies, which form the basis of Industry 4.0, paved the way for cryptocurrencies to emerge as technological innovation in the technology age. Recently, investors worldwide have been interested in cryptocurrencies with increasing acceleration due to high earning expectations though they have no backing and intrinsic value. As such, this paper seeks to identify the most proper cryptocurrencies from an investment standpoint in our technological era. Fifteen well-known cryptocurrencies with the highest market capitalization are evaluated as per sixteen factors. An intuitionistic fuzzy set-driven methodology incorporating Evaluation Based on Distance from Average Solution (EDAS), Multi-Attributive Ideal Real Comparative Analysis (MAIRCA, and Measurement of Alternatives and Ranking according to COmpromise Solution (MARCOS), which is the study’s prominent novelty, has been applied to provide a strong group decision vehicle for cryptocurrency selection. Notwithstanding, although the results obtained with the three approaches are highly consistent, investors would not like to doubt the instrument they will invest in. The Borda count is then applied to obtain a compromise for the rankings obtained from each approach. As per our findings, Ethereum, Tether, and Bitcoin are the most suitable cryptocurrencies, whereas reliable software, ease of inclusion in the wallet, and stability are the foremost factors to consider when investing in cryptocurrencies. The findings are further discussed in detail from a financial perspective. The proposed approach could be employed to select different investment instruments in future studies.

1. Introduction

For nearly two decades, cryptocurrencies have attracted significant interest from various economic units such as monetary institutions, economists, investors, and many statutory authorities such as regulators, policymakers, and government bodies. Notwithstanding, numerous technology entrepreneurs initiated analogous blockchain networks shortly after Bitcoin’s invention. These innovative products, known as altcoins, started to appear in the novel online markets where blockchain products are perpetually on display with a non-stop, vibrant trading function. Thereby, alternative coins are a diversified version of Bitcoin for different smart blockchain purposes [1].
Due to the novel business models provided by the blockchain infrastructure, cryptocurrencies offer investors the financial opportunity in the medium and long term to invest in smart projects by offering pre-programmed and self-executed solutions. For instance, Ethereum is predominantly distinguished with dignity from other cryptocurrencies in the blockchain environment. At the same time, it also stands for the first decentralized finance (De-Fi) application due to creating and hosting the first blockchain protocol to enable the formation of decentralized applications (d’Apps) and smart contracts.
Over the years, many altcoins have emerged as a new and original project using the existing algorithm, reminiscent of Bitcoin, differentiating various features and the present Bitcoin protocol. However, some cryptocurrencies, such as Ethereum and Ripple, adopt distributed ledger technology, and decentralized software networks manage their blockchain technologies. In contrast, others use blockchain services of different underlying networks. More specifically, altcoins promenade an elaborated blockchain technology ecosystem to benefit their respective environments. They are not necessarily competing with one another except that they are established on different cryptographic algorithms. But they do have certain similarities. For instance, each altcoin has its irreplaceable market adventure adorned with its unique vision, mission, supply, and different values [2]. Furthermore, the disparities between the numerous cryptocurrencies accessible on the market at any particular time are determined by some elements, ranging from cryptographic algorithms to mining to network scale.
Clearly, cryptocurrencies may have fundamental differences, and these features are distinctly appreciated by the market [3]. Mentioned factors also support cryptocurrencies in achieving their goals by finding project partners within the specified ecosystem. Altcoins also aims to attract the interest of investors by offering unique opportunities such as highlighting their cryptographic algorithm and increasing the market value of the altcoin in the markets. Therefore, cryptocurrency investors and traders closely monitor the interactions between cryptocurrencies and try to decipher the pattern of the movements. Because Bitcoin still has a guiding notion in market movements, altcoins price movements occur after changes in Bitcoin price [4]. Although studies have shown that Bitcoin is the leader and most decisive player in the market [5], altcoins seem to change this dominance.
Meanwhile, in addition to Bitcoin, which is appreciated as the first decentralized cryptocurrency using blockchain technology, many altcoins such as Ethereum, Binance Coin, Polkadot, Shiba, Dogecoin, Solana, Ripple, Cardano, Litecoin, Avalanche, Binance, and Terra have been ranked among the most popular cryptocurrencies by market capitalization and contemplated predominant coins. Nevertheless, Bitcoin remains the prevalent entity in the market, with a crescendo share of $1.68 trillion, around 42% in market capitalization, by February 2022 [6]. Since thousands of virtual currencies are on the market as an alternative investment tool, it is a complicated and thorny task to decide on the right one among them. Although investors often trade in open markets by considering the isochronic market values of altcoins, it may not ever be a rational decision to evaluate cryptocurrencies in this way. In this respect, investors who intend to invest in cryptocurrencies are closely related to some features of altcoins, such as blockchain algorithms, project goals, the market price of cryptocurrencies, etc. The presence of these conflicting factors makes the investment decision very complicated. Thus, investors aware of the different complexities of altcoins wish to gain an advantage in finding the value of each altcoin and turning these differences into profits.
Yet, in order to determine which investors influence different factors in their decision to purchase these assets, multi-criteria decision-making (MCDM) techniques can produce helpful and realistic solutions. MCDM terminology can provide fantastic convenience and assistance in the selection process since it could ensure a final ranking for available cryptocurrencies regarding investor requirements. Further, on the one hand, MCDM has presented promising outcomes in the literature when integrated with fuzzy sets. For instance, Atanassov’s [7] intuitionistic fuzzy sets (IFSs) are exploited to cope with the loss of information and hesitation in data that could appear in operations by fuzzy numbers. In this way, this study utilizes IF-EDAS, IF-MARCOS, and IF-MAIRCA models to prioritize drivers and rank cryptocurrencies simultaneously within the group decision-making. Studies conducted by integrating EDAS, MARCOS, and MAIRCA with IFSs are also highlighted in the literature, for example, IF-EDAS for project evaluation [8], IF-MARCOS for insurance firm assessment [9], and IF-MAIRCA for coronavirus vaccine selection [10]. The foremost common features of all three models are: (i) considering the knowledge, experience, and hesitancy of the experts, important weighting can be assigned, i.e., the priority of each expert may be different from the others, (ii) both driver weights and alternative rankings can be obtained simultaneously, emphasizing that there is no need to integrate two divergent methods for weighting and ranking, and (iii) calculations are understandable and straightforward.
Consequently, this paper aims to perform these IFSs-driven approaches at the weighting and ranking phases for presenting a novel perspective in the cryptocurrency literature. On the other hand, all approaches calculate criteria weights the same, whereas final rankings of alternatives can differ from approach to approach due to their unique steps and formulations. This raises the matter of which model’s outcome is more credible and effective. The Borda count technique is therefore conducted to acquire the compromise ranking solution. Moreover, three IFS frameworks are employed to increase confidence in the results further to be achieved. Last, Borda count is preferred to get coherent ranking outcomes. Thereby, it allows for checking the validity of the outcomes of each framework concerning what has been calculated by three IFSs-based frameworks. The application of these frameworks has further been performed in a case study. Applying the IF-based frameworks and merging the results provided with the Borda count constitutes a scientific contribution to the study. Another original contribution of this research is the case study on cryptocurrencies. There has not been any evidence of a similar paper evaluating cryptocurrencies from the investors’ perspective.
This work is motivated by the facts about cryptocurrencies mentioned above, thus:
the enormous potential of cryptocurrencies in the finance world,
the growing expansion of the cryptocurrency market worldwide,
acceptance of cryptocurrency as legal tender by some countries,
achievable targets for the further progress of the cryptocurrency market.
The above drivers bring cryptocurrencies to the fore as an attractive research matter of growing practical significance and various financial implications. So, the present work target is to contribute to the literature in the following paths by examining whether the factors that affect the selection of cryptocurrencies are valid for altcoin selections. Listed below are two research questions in the context of this paper’s aim.
RQ1. What are the most influential factors in cryptocurrency investments?
RQ2. Which cryptocurrency among the alternatives has more investable features?
By sticking to these purposes, Section 2 contains a literature survey of the past studies on cryptocurrencies, while Section 3 provides the research methodologies. Section 4 depicts the experimental findings. The fifth section presents a discussion and interpretation of the findings for the whole crypto industry stakeholders. Finally, we invite some practical implications with a presentation in Section 6, while we also build up a statement that summarizes the work steps and research results in Section 7.

2. Literature Review

Cryptocurrencies have recently attracted significant attention from several scientists due to enthusiasm and innovations in economic life. In the studies that produced the early literature of cryptocurrencies, researchers generally conducted research to determine frequently pondered characteristics of cryptocurrencies, such as user’s latent intention-asset or a currency node [11,12,13], fundamental price and speculative bubble [14,15,16], investor attention and behavioral determinants [17,18,19,20], portfolio management [21,22,23,24], volatility spillover and value forecasting [25,26,27], liquidity [28,29], risk management and hedging opportunities [30,31], cryptomarket efficiency [32,33], price dependence and movements [34,35], crash risk and bubble form [36,37,38,39], connectedness with traditional assets/currencies or markets [40,41,42,43,44], and energy consumption [45,46,47].
Accordingly, the research initially focused on Bitcoin has become richer with the increase in other cryptocurrencies over time and has deepened the strands of the cryptocurrency literature by arousing interest in the interrelationship between Bitcoin and altcoins. In a significant majority of these studies, the relationship between volatility and interdependencies among several cryptocurrencies; especially time-varying volatility connectedness [48], information connectedness [49], price connectedness [2], and return connectedness [50] are successfully clarified with investment perspectives. Moreover, extant studies have brought significant findings to the common attention of investors and those interested in the cryptocurrencies ecosystem, such as Bitcoin still prevailed in investor sentiment despite losing market dominance in return connectedness against altcoins [50], and cryptocurrencies are immune to exogenous risk factors so that investors evaluate Bitcoin and altcoins together when creating long-term investment strategies against shocks such as the pandemic and unpredictable geopolitical risks [2,51], or Corbet et al.’s [52] argument that Bitcoin is not separated from conventional international financial markets.
In another vein, some other studies focused on the analysis of which of the listed assets in the cryptocurrency markets is more dominant than the others. For instance, Corbet et al. [52] revealed that Ethereum is a more solid asset for all the times studied, and Bitcoin is no longer the predominant currency in the market while it is less affected by shocks acting as the largest net transmitter of returns spillovers. However, in another study confirming this finding, Sensoy et al. [53] and Xu et al. [54] similarly concluded that Ethereum, which has the second-highest market capitalization, plays a dominant role in volatility spillovers and serves as a kind of connection hub for other altcoins in the market though Corbet et al. [41] and Ji et al. [55] reported Bitcoin is yet driving the crypto market movement. On the contrary, Katsiampa [56] detected a bi-directional transmission of shocks between Bitcoin and Etherium/Litecoin. Similarly, Corbet et al. [52] demonstrated the causal relationship, while Demir et al. [57] studied the asymmetric movements between Bitcoin and three altcoins and reporting Bitcoin also has an asymmetric impact on other altcoins in the short and long term. The studies in which altcoins are mainly discussed are not undoubtedly limited to these studies. For instance, Katsiampa [56] expressed that Bitcoin and Ethereum are responsive to mainstream news, while the author also detected a volatility interdependence and correlational relationship between cryptocurrencies.
Therewith, another strand of the crypto market that was inspected in the literature has been to elucidate hidden intention to adopt the users’ cryptocurrencies. For instance, Huynh et al. [58] reported that users tend to own cryptocurrencies for speculative purposes, and cryptocurrency adopters are trending in society while people are moving to use cryptocurrencies more often for transactions in connection with Bitcoin adoption. Additionally, Gupta et al. [59] tried to determine for prioritizing participant’s hidden intentions to invest in cryptocurrency with a fuzzy analytical approach and found that social influencing is the most influencing component while effort expectancy is the least critical factor in eight principal categories considered by investors.
In one of the pioneer studies, Alzahrani and Daim [60] discussed cryptocurrency adoption at different levels by also claiming that users wish to hold cryptocurrencies for various motivations. The authors suggested that the principal drivers of the cryptocurrency holding decisions are: investment opportunity, cryptocurrency forms, transaction privacy, the anonymity of the interactions, rapid transfer of the funds, low transaction cost, and curiosity about blockchain networks from a total of 19 factors, including six technical factors, seven economic factors, three social factors, and three personal factors. In a similar study, Stix [61] revealed households’ purchase intention and ownership motivations of cryptocurrencies. The author reported that cryptocurrency owners principally have good financial knowledge and a higher risk-taking attitude, while their primary motivations for owning the cryptocurrency are profit expectations and fast and easy transactions. Besides, they stated that high volatility or risk factors such as fraud and online theft reduce users’ demand for crypto assets. Furthermore, Nadeem et al. [62] showed that perceived ease of use and perceived usefulness positively affect the intention to use cryptocurrencies, and perceived usefulness also mediates the interplay between perceived ease of use and intention to adopt cryptocurrencies.
In one of the most comprehensive current studies examining the drivers that direct investors to invest in crypto assets, Böyükaslan and Ecer [63] employed twenty-three sub-variables within five main dimensions: functionality, financial, legal infrastructure, technology, and security. The authors revealed that the most crucial variable for the intentions behind the crypto investment is security, which is narrowly followed by the financial motivation variable. The findings in this study are also interpreted by Mendoza-Tello et al. [64]’s six-social factors work, highlighting that social commerce can strengthen the relationship between trust and intention to adopt cryptocurrencies. Because investors’ concerns about the insecurity of cryptocurrencies will inevitably impede their adoption and investment decisions, and in this regard, it is thought that the way for crypto assets to gain the trust of investors is possible through the promotion of social experiences as well as technological processes.
On the other hand, a limited number of cryptocurrency studies using MCDM terminology appear in the literature. For instance, Gupta et al. [59] used the FAHP model to prioritize factors behind cryptocurrency investments, while Aljinović et al. [65] intended to build a multi-criteria approach for portfolio selection based on the PROMETHEE II model. Hacioglu et al. [66] employed the combined approach of AHP and F-TOPSIS to create cryptocurrency mining strategies. Maček and Alagić [67] evaluated the performance of the bitcoin cryptosystem with AHP. Applying fuzzy CODAS, Katrancı and Kundakcı [68] assessed some cryptocurrencies. Through the Delphi–BWM–TOPSIS approach, Wang et al. [69] aimed to decide the best coin exchange solution. In the age of technology, where many investors see cryptocurrencies as an attractive investment tool, it is evident that reliable and effective decision support tools will be needed to evaluate cryptocurrencies. This research can, therefore, contribute to filling such a critical gap in the literature.
Finally, hundreds of studies examining the different aspects and characteristics of cryptocurrencies offer researchers and financial industry participants a vast field of knowledge. Hereby, Table 1 shows the criteria created by compiling many studies summarized in the literature section of this study. In that way, we use the data we obtained in the analysis for the purposes of this study, considering that each of the presented factors has the potential to impact investor attention. Accordingly, the market-cap data set has been meticulously obtained by calculating the weighted temporal averages of the market capitalizations of the cryptocurrencies specified in Table 1 for the period from February 2022 to March 2022. Yet, it should be remembered that related values may change at other time intervals while interpreting the analysis results. The following section contains more comprehensive information about our data and analysis method.

3. Methodology

3.1. Preliminaries on IFSs

The fuzzy theory is a rather effective vehicle for handling MCDM-related issues. Notwithstanding, it only considers membership and non-membership degrees. To overcome such a constraint, Atanassov [70] offered IFSs. IFSs can more easily deal with uncertainty through the degree of hesitation as well as membership and non-membership. In IFS, μ ( x ) and ϑ ( x ) demonstrate the membership degree and non-membership degree, respectively, that builds ( μ ( x ) , ϑ ( x ) ) such that μ ( x )   +   ϑ ( x ) [ 0 , 1 ] . Also, π = 1 μ ( x ) ϑ ( x ) denotes the degree of hesitancy [71]. Hot work on IFS can be explored by Mishra and Rani [72], Schitea et al. [73], and Krishankumar et al. [74] to see the real-world applications of IFSs.

3.2. Intuitionistic Fuzzy Multi-Criteria Process

To derive the weight coefficients concerning IF methods in this research, the IFWAA technique suggested by Xu [75] is employed. Moreover, all linguistic judgments expressed by experts are converted into IFNs. Consequently, the model’s flowchart is displayed in Figure 1.
d = {1, 2, …, s} is the team of experts, and their relative weights are φ = [ φ 1 , φ 2 , , φ s ] where d = 1 k φ d = 1 .
φ d = ( μ d + π d . ( μ d μ d + ϑ d ) ) d = 1 s ( μ d + π s . ( μ d μ d + ϑ d ) )  
where μ ,   ϑ , and π refer to membership, non-membership, and hesitancy levels, respectively.
C z refers to the number of evaluation factors whose weights are W = [w1, w2, …, wt], z = 1 t w z = 1 , where z = 1 , 2 , , t .
Below are the steps common to the three IF methods.
Step-1.
Identifying the significance of experts
Using Table 2, linguistic assessments of experts and criteria are performed.
Step-2.
Create the aggregated IF decision matrix.
Suppose that F = [ T z d ] t x s   ( d = 1 , 2 , , s ; z = 1 , 2 , , t ) is the IF decision-matrix of experts, in which T z d Indicates the judgment of eth expert about the jth criterion. T z d is employed by IFN, and it can be said that T z d = ( μ T z d ,   ϑ T z d , π T z d ) where π S j e is the hesitation degree of π z d is found via Equation (2).
π z d = 1 μ T z d ϑ T z d
The aggregated IF decision matrix is illustrated as T ^ = [ T ^ z d ] t x s
T ^ z = I F W A A w ( T z 1 , T z 2 , , T z d ) = [ 1 d = 1 s ( 1 μ T z d ) φ d , d = 1 s ( ϑ T z d ) φ d , d = 1 s ( 1 μ T z d ) w d d = 1 s ( 1 ϑ T z d ) φ d ]
where T ^ z = ( μ T ^ z ,   ϑ T ^ z , π T ^ z ) .
Via Table 3, the linguistic assessments for the options are realized.
Step-3.
Depict the ideal solutions for IF.
According to Atanassov [76] any IFN has not only a negative (non-positive) ideal solution (IFNIS) but also a positive ideal solution (IFPIS), which takes values Λ + = ( 1 , 0 , 0 ) and Λ = ( 0 , 1 , 0 ) , respectively. He further indicates that there is no considerable space in their achievements.
Step-4.
Obtain the distance measures.
In this step, a Euclidean distance formula is employed [77]. δ z + and δ z Equations (4) and (5) are utilized to state positive and non-positive distance measures, respectively.
δ z + = ( μ   T ^ z Λ + ) 2 + ( ϑ   T ^ z Λ + ) 2 + ( π   T ^ z Λ + ) 2
δ z = ( μ   T ^ z Λ ) 2 + ( ϑ   T ^ z Λ ) 2 + ( π   T ^ z Λ ) 2
Step-5.
Find the closeness coefficients (CC) and derive the criteria weight values.
The CC value of the zth criterion, C W z , is obtained as follows.
CW z = δ z δ z + δ z +
It is noted that criteria weights are also computed in this step, whereas normalization is applied to get final weights.
Step-6.
Build the initial IF decision-matrix.
The initial matrix consists of the CW values of the alternatives regarding the criteria in the previous step.

3.2.1. Intuitionistic Fuzzy MAIRCA (IF-MAIRCA)

The MAIRCA method, which highlights the difference between the theoretical and actual values and chooses the option having the most negligible difference as the most preferable, was offered by Pamucar et al. [78]. So far, researchers have successfully applied MAIRCA in different fields [79,80]. The steps of IF-MAIRCA are given below [9].
Step-7.
Create the normalized IF decision-matrix.
As given in Equations (7) and (8), criteria are normalized concerning whether they are non-cost or cost-oriented. Thus, Equation (7) is employed for benefit-direction factors, whilst Equation (8) is handled for cost-direction factors.
n v i j = x i j x m i n x m a x x m i n , i f   x i j   i s   n o n c o s t   c r i t e r i o n
n v i j = x m a x x i j x m a x x m i n , i f   x i j   i s   c o s t   c r i t e r i o n
Step-8.
Create the theoretical IF decision-matrix.
The following equation finds the preference for any h possible options.
ς A i = 1 h i = 1 h ς A i = 1 .
Afterward, preferences of options are multiplied with criteria weight coefficients to obtain the theoretical matrix ( ϱ p ).
ϱ p = P A i . [ ϱ p 1 ϱ p 2   ϱ p n ]
In which n denotes the total number of factors, whilst ϱ p i displays the theoretical assessment.
Step-9.
Create the real IF evaluation-matrix.
To create the real IF evaluation matrix, Equation (11) is utilized.
ξ i j = n v i j .   ϱ p i
Step-10.
Create the IF gap-matrix.
The IF gap matrix is obtained via Equation (12).
Θ i j = ϱ p i ξ i j
Step-11.
Find the utility scores of options.
As can be understood from Equation (13), by summing the rows of the matrix, the utility scores of options are obtained.
Δ i j = j = 1 t Θ i j , i = 1 , 2 , , h
where t is the total number of factors and h is the total number of options.
Step-12.
Rank the options.
Lastly, options are ranked regarding increasing values, i.e., minimum utility score means the best option and vice-e-versa.

3.2.2. Intuitionistic Fuzzy MARCOS (IF-MARCOS)

MARCOS depicts a new MCDM technique offered by Stević et al. [81]. The method determines the utility functions of the options with the help of ideal and non-ideal solutions. Scholars have successfully employed MARCOS in various areas [82,83,84]. The following steps are portrayed in IF-MARCOS for making decisions [9].
Step-13.
Create an extended IF decision-matrix
By calculating the anti-ideal E D M ^ A I and ideal E D M ^ I solution, the extended decision-matrix E D M ^ is formed.
[ w ^ 1 w ^ 2 w ^ n ] E D M ^ = A ^ 1 A ^ 2 A ^ z E D M ^ A I E D M ^ I [ x ^ 11 x ^ 12 x ^ 1 t x ^ 21 x ^ 22 x ^ 2 t x ^ z 1 x ^ z 2 x ^ z t x ^ a i 1 x ^ a i 2 x ^ a i t x ^ i d 1 x ^ i d 2 x ^ i d t ]
The A ˘ A I is the worst option, whilst the A ˘ I is the most preferred performance. To compute these values, Equations (7) and (8) are employed, respectively.
E D M ^ A I = m i n   i x ˘ i j ,   i f   j   i s   n o n c o s t   c r i t e r i o n   a n d   m a x   i x ˘ i j ,   i f   j   i s   c o s t   c r i t e r i o n
E D M ^ I = m a x   i x ˘ i j ,   i f i s   n o n c o s t   c r i t e r i o n   a n d   m i n   i x ˘ i j ,   i f   j   i s   c o s t   c r i t e r i o n  
Step-14.
Create the normalized IF decision-matrix.
The normalized values of options are decided by Equation (17).
ψ ^ i j = { x ^ a i j x ^ i d j ,   j   i s   n o n c o s t   c r i t e r i o n   x ^ i d j x ^ a i j ,   j   i s   c o s t   c r i t e r i o n  
Step-15.
Create the weighted IF decision-matrix.
Equation (18) is used to calculate the weighted values for each option.
ϕ ^ i j = ψ ^ i j w ^ j
where w ^ j denotes the significant weight of jth criterion.
Step-16.
Form the A ^ i matrix.
To get the elements of A ^ i matrix, Equation (19) is utilized.
A ^ i = i = 1 t ϕ ^ i j
Step-17.
Obtain the utility degrees of options.
Via Equations (20) and (21), the utility degrees of options are derived.
Γ ^ i = A ^ i A ^ a i
Γ ^ i + = A ^ i A ^ i d
Step-18.
Compute the utility function of options.
Via Equation (22), the utility functions of options are found.
f ( Γ i ) = Γ ^ i + + Γ ^ i 1 + 1 f ( Γ ^ i + ) f ( Γ ^ i + ) + 1 f ( Γ ^ i ) f ( Γ ^ i )
where f ( Γ ^ i + ) displays the ideal solution’s utility function, whilst f ( Γ ^ i ) demonstrates the utility function concerning the anti-ideal solution. On the other hand, f ( Γ ^ i + ) and f ( Γ ^ i ) are determined by Equations (23) and (24).
f ( Γ ^ i + ) = Γ ^ i Γ ^ i + Γ ^ i +
f ( Γ ^ i ) = Γ ^ i + Γ ^ i + Γ ^ i +
Step-19.
Rank the options.
Last, the final ranking is decided by reducing the values of options’ utility functions.

3.2.3. Intuitionistic Fuzzy EDAS (IF-EDAS)

EDAS, as a novel and effective MCDM technique, was introduced by Keshavarz Ghorabaee et al. [85]. The method aims to determine the preferable option through the distances from the average solution. Many researchers have successfully used EDAS in various fields [86,87]. Below are the six steps of IF-EDAS [73].
Step-20.
Compute the average solution value.
The average solution value Γ m is calculated using Equation (25).
Ω z = p = 1 y x p z y
Step-21.
Calculate the measures of positive distance ( p d c p z ) and negative distance. ( n d c p z )
p d c p z = { m a x ( 0 , x p z Ω z ) Ω z ,     i f   z   i s   n o n c o s t   c r i t e r i o n m a x ( 0 , Ω z x p z ) Ω z   ,     i f   z   i s   c o s t   c r i t e r i o n
n d c p z = { m a x ( 0 , Ω z x p z ) Ω z ,     i f   z   i s   n o n c o s t   c r i t e r i o n m a x ( 0 , x p z Ω z ) Ω z   ,     i f   z   i s   c o s t   c r i t e r i o n
Step-22.
Determine the weighted positive and negative distances.
Each choice’s weighted positive and negative distances are computed using the following equations.
w s p p = z = 1 t w z p d c p z
w s n p = z = 1 t w z n d c p z
Step-23.
Determine the normalized values of w s p p and w s n p
Equations (30) and (31) are performed to derive the normalized values of w s p p and w s n p .
w s p p ( r ) = w s p p w s p m a x
w s n p ( r ) = 1 w s n p w s n m a x
Step-24.
Calculate the performance scores and rank the options.
The performance score for each choice is determined as below.
P S p = 1 2 ( w s p p ( r ) + w s n p ( r ) )
Step-25.
Rank the options.
Last, the final ranking is decided by reducing the values of options’ performance scores.

3.2.4. The Borda Count

The Borda count was offered by Borda [88] to merge the rankings of different models. Let us address a decision problem with n alternative. This method recommends the best alternative (n-1) points. Similarly, the second-best alternative (n-2), the next (n-3), etc. Regarding their scores, alternatives are sorted from the highest to the lowest [89].

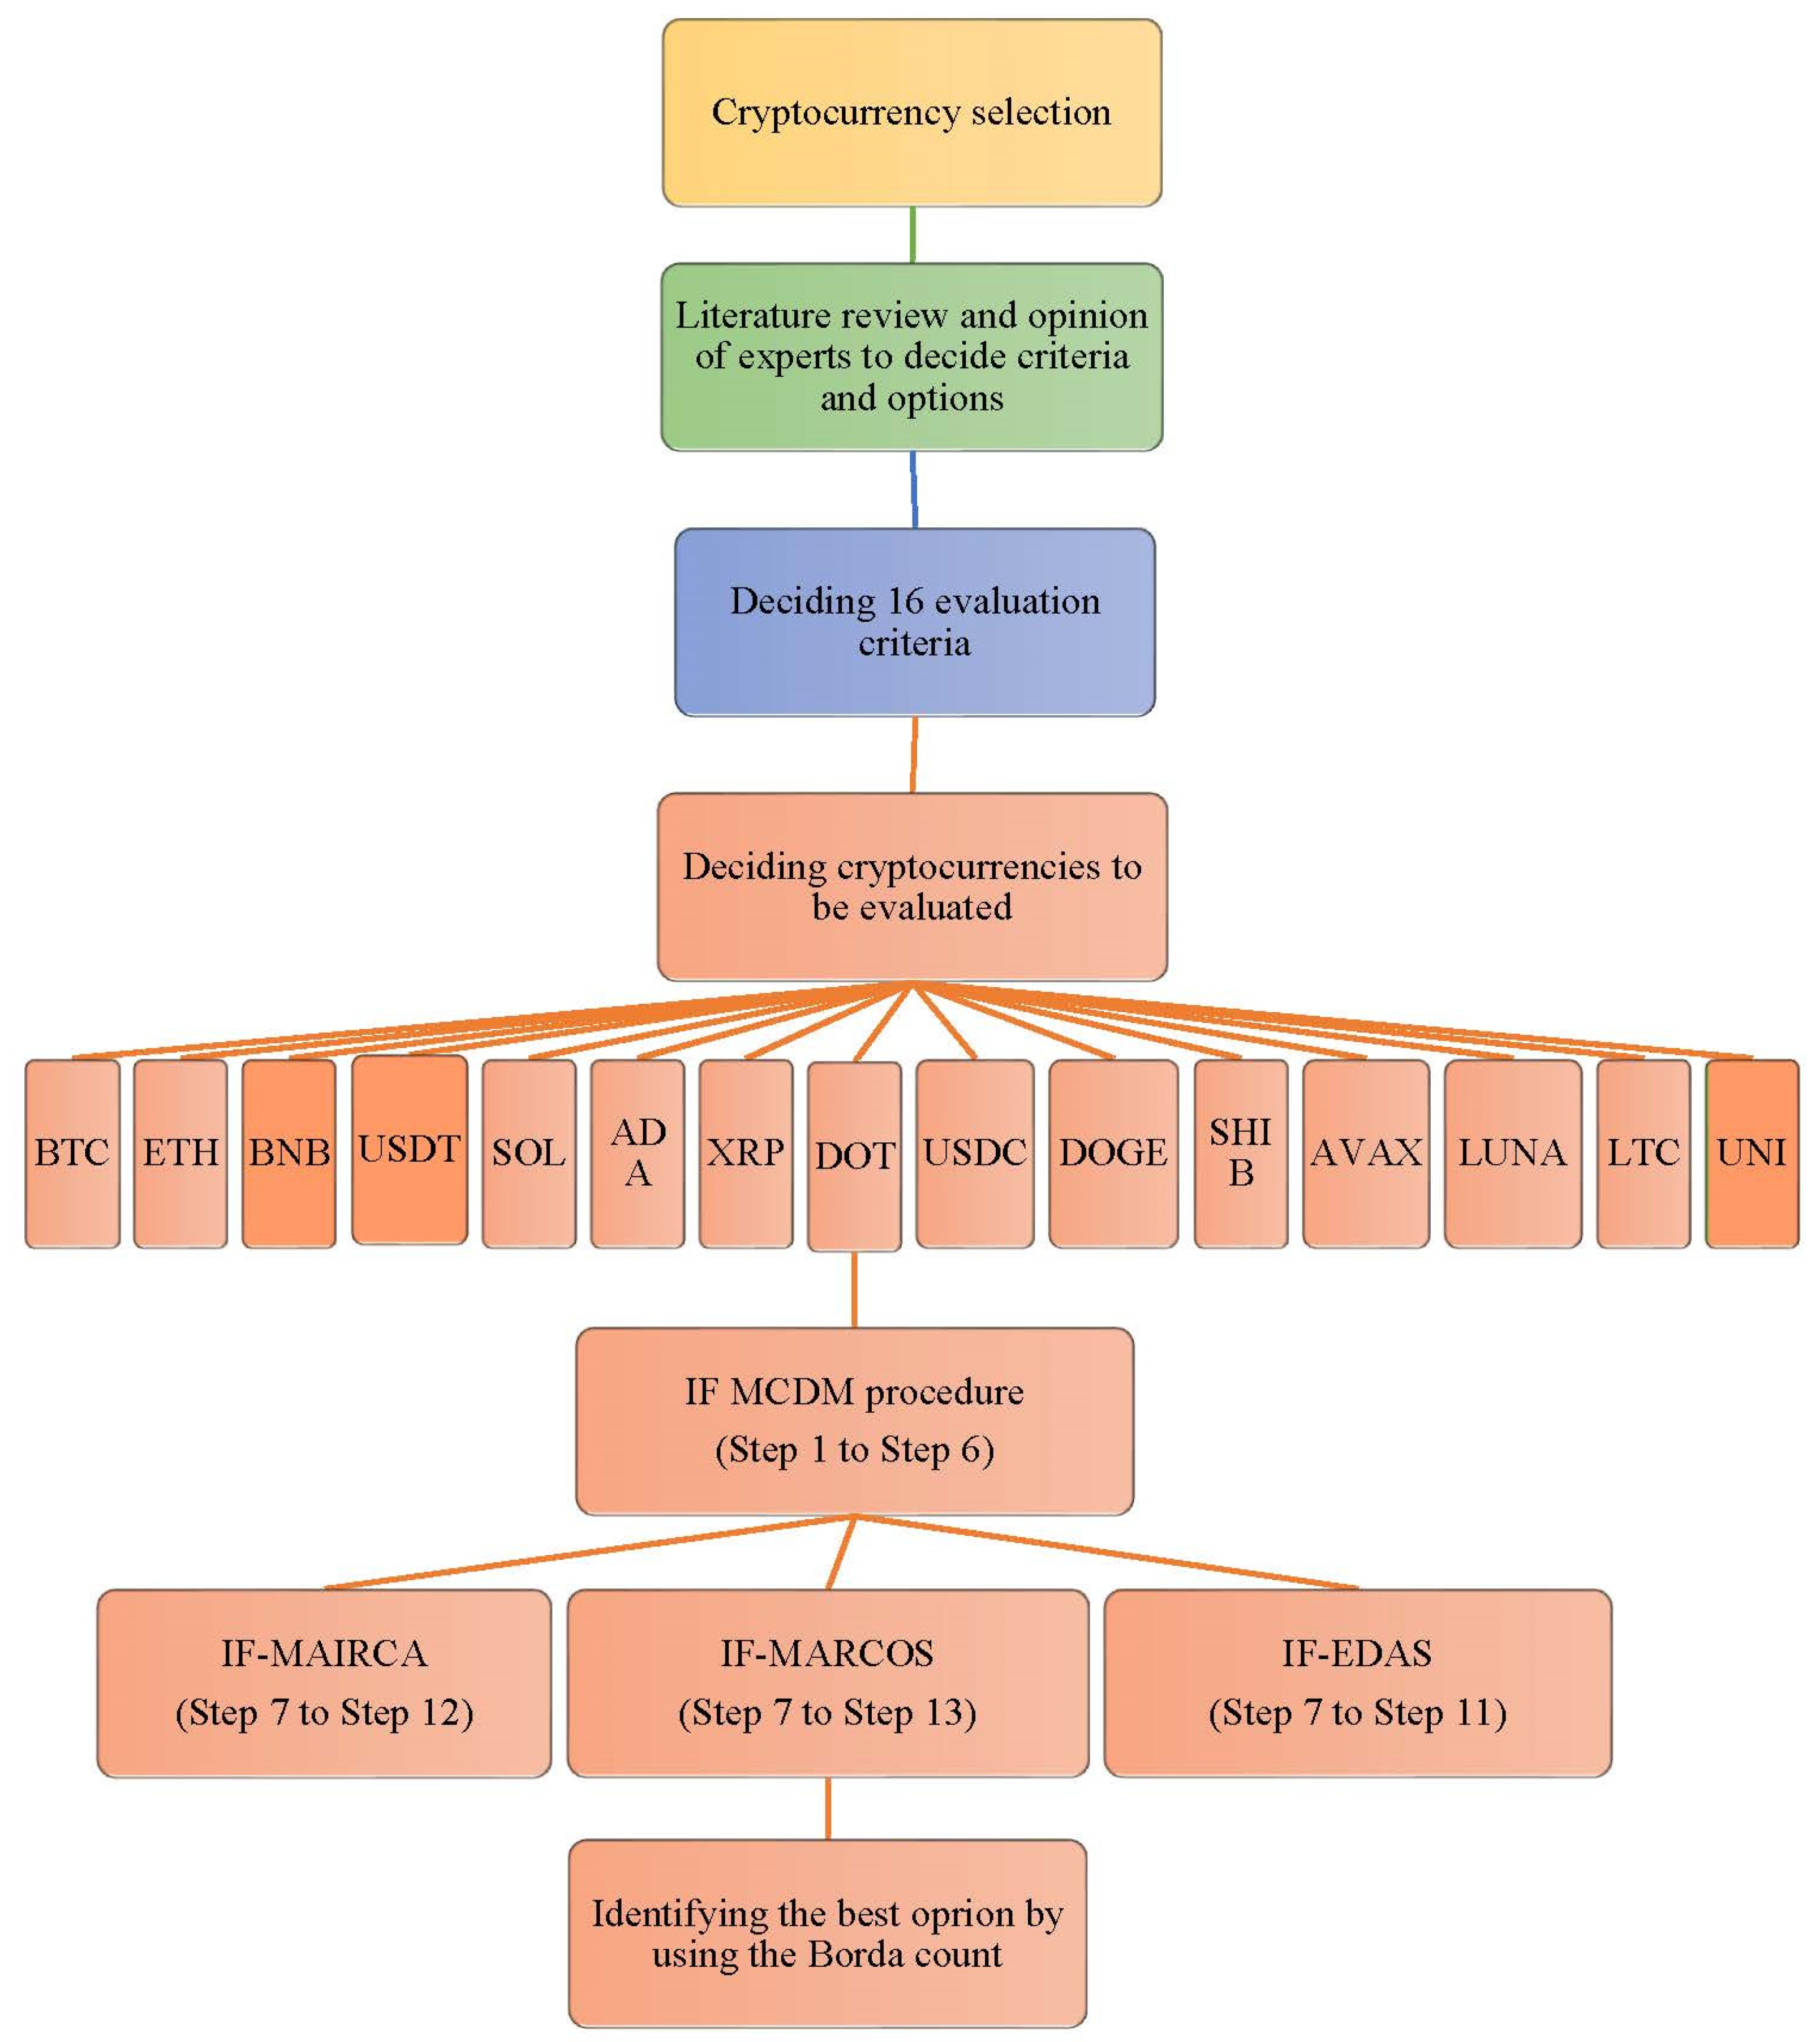
4. Application of the Methods for Cryptocurrency Selection

Four crypto-market specialists are requested to contribute their sentiments on both weightings of the factors crucial in selecting and ranking cryptocurrencies with the highest market capitalization. These experts consist of a businessman (Expert 1), a financial market specialist (Expert 2), a financial advisor (Expert 3), and an academician (Expert 4). The investment specialists mentioned who are competent in their business fields have been actively investing for nearly two decades and effectively following financial markets and instruments for many years.
This work proposes combining the results of the extensions of MAIRCA, MARCOS, and EDAS methods under the IF environment to determine the best option for cryptocurrency investment. In this regard, 15 cryptocurrency options are examined regarding 16 criteria. As presented in Table 1, evaluation criteria are decided concerning the literature review and expert ideas, whereas the options are decided on the first 15 cryptocurrencies with the highest market capitalization. Though increasing the criteria number may allow for better outcomes, the authors focus on these criteria since the experts consider the 16 criteria sufficient. On the other hand, there are findings in the cryptocurrency literature that Bitcoin is the primary determinant of other altcoins in terms of price and return volatility. This interconnectedness remains a subject that is still in suspense. Furthermore, many investors suppose cryptocurrencies as equivalent to Bitcoin and take their investment positions according to Bitcoin’s movements. For this reason, although it is not considered a cryptocurrency in altcoin status, Bitcoin is included in the analysis due to its homogeneous affinity with other altcoins and its dominant effect on other cryptocurrencies.
Firstly, experts evaluated criteria and options using Table 2 and Table 3. These linguistic assessments are provided in Table 4 and Appendix A.
Then, the experts’ weights, provided in Table 5, are computed via Equation (1) for use in the calculations of the analyses.
The aggregated IF decision-matrix concerning criteria is depicted in Table 6. To obtain this matrix, we use Equation (3).
With the aid of the aggregated IF decision-matrix and Equations (4)–(6), we achieve the criteria weights shown in Table 7.
Using Appendix A and Equation (3), we get the aggregated IF decision-matrix concerning alternatives as depicted in Appendix B. Moreover, with the aid of Equations (4)–(6) and Appendix A, closeness coefficients are gathered (Appendix C).
It should be noted that the first six steps in the IF-MARCOS, IF-MAIRCA, and IF-EDAS methods are like each other. In this study, since there are many processing steps due to the simultaneous use of more than one method, it is thought to be a more appropriate and effective way to include only the result tables to eliminate the complexity. Thus, the results obtained using the IF-MARCOS, IF-MAIRCA, and IF-EDAS methods are given in Table 8.
Finally, 
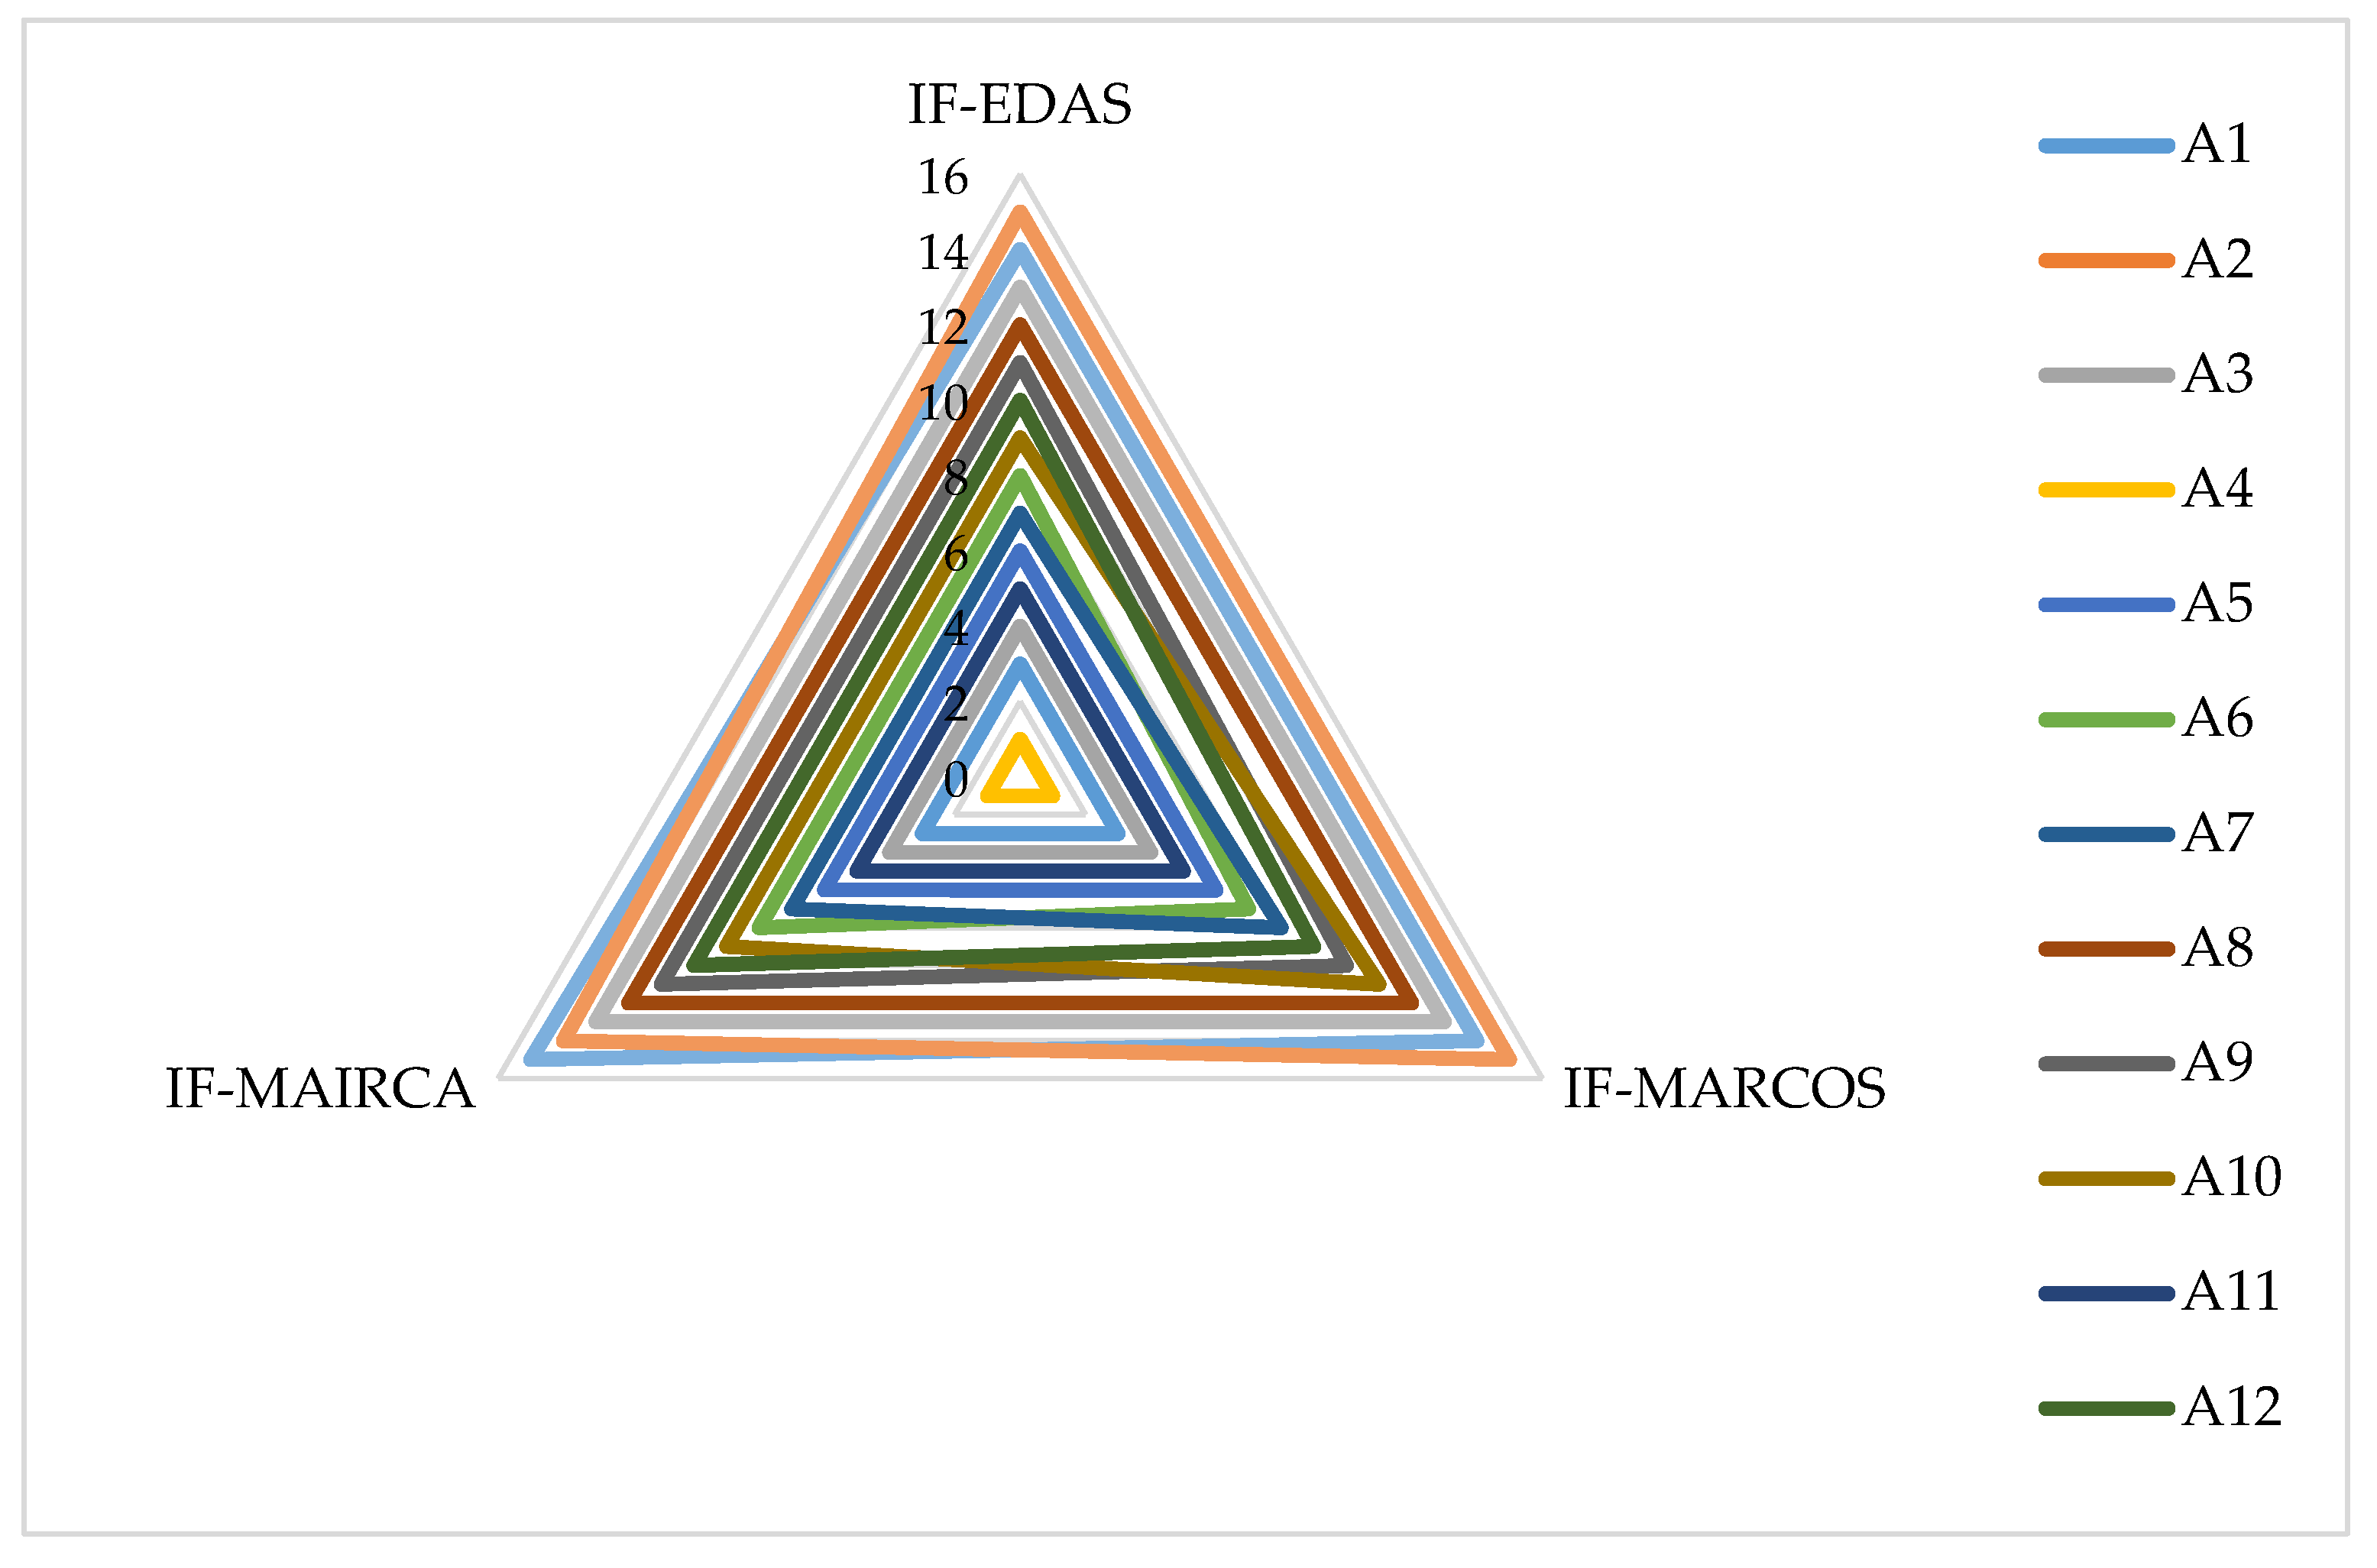
Table 9 reports the obtained rankings for the three IF-based approaches. Obviously, these approaches achieve to yield the same ranking for the six first positions. Notwithstanding, some differences are noticed for the nine last positions. To determine the compromise solution, therefore, the Borda count principle is exploited in this research. Borda scores calculated for each cryptocurrency allow for consensus ranking between the three approaches.
As can be viewed in Table 9, the ranking results obtained with the three approaches are almost the same. For example, A7 ranks 7th in the IF-EDAS and IF-MAIRCA approaches and 8th in the IF-MARCOS approaches. As displayed in Figure 2, the results found via IF-EDAS and IF-MAIRCA are the same, except for one ranking position, which is the position of alternatives A14 and A15. IF-EDAS and IF-MARCOS ranking results are obtained to be the same for the place of twelve alternatives. Finally, it is noteworthy that in the IF-MARCOS and IF-MAIRCA ranking results, the positions of the eleven alternatives are the same, whereas the ranks of the rest are very close to each other. Not surprisingly, the rankings of the first six alternatives and the 12th and 13th alternatives have the same position in the final rankings of the three methodologies. Additionally, according to Spearman’s rank correlation coefficient analysis, the results produced by IF-EDAS are 98.6% and 99.6% compatible with IF-MARCOS and IF-MAIRCA, respectively. Again, IF-MARCOS and IF-MAIRCA results are also very consistent, with a rate of 98.2%. Thereby, it is evident that the results obtained by Spearman’s rank correlation coefficient analysis have high consistency, which emphasizes the reliability and acceptability of the alternative rankings in general.
However, investors wish to be sure of their decisions when making investment decisions. For example, the results obtained in this study may be insufficient for the investor who wants to divide his current investment among the top ten cryptocurrencies, taking into account the order of importance of cryptocurrencies. Therefore, a precise ranking is needed. The Borda count is a compromise tool developed to resolve such problems. In the last column of Table 9, the findings of the Borda count are demonstrated. Consequently, according to the findings of this study, ETH, USDT, and BTC are the most suitable cryptocurrencies to invest in, respectively. They are followed by BNB, SHIB, and SOL, respectively.

5. Discussion and Interpretation of the Results

The analysis results can be interpreted by collecting two groups: (i) the significance of criteria where investors pay attention to investing in cryptocurrencies, and (ii) the ranking of cryptocurrencies.
The first component of our main findings reveals the priority factors weighted by investors in adopting altcoins. Concerning the final results, our findings showed that all three criteria, namely reliable software platform (C1), easiness of inclusion in the wallet (C3), and price volatility and trading volume (C13), are the most critical factors among the sixteen criteria. These factors are followed by digital encryption (C4; 0.0682), providing storage space on a central platform (C2; 0.0678), and return/risk balance (C14; 0.0669), respectively. The last three factors indicated by the investors are, however, use in portfolio diversification (C15; 0.0560), the feasibility of the blockchain project (C8; 0.0549), and smart contracts (C10; 0.0541).
As summarized in Alzahrani and Daim [60], Esmaeilzadeh et al. [90], and Bennani and Arpaci’s [91] review, extant literature showed that different factors (such as economic, technical, social, and personal) could be influential when investors decide to invest in cryptocurrencies, and the various, new and rich features offered by crypto products continue to attract investors. Our findings, which we have enriched by including the block-chain-based projection stages of altcoins and crypto market characteristics, point out that investors, nowadays, prioritize the security of software platforms, the functional usefulness of crypto wallets, and price movements and transaction volume. It is, of course, not possible to make a materiality classification among these three factors, but it makes a difference in terms of better understanding investor tendencies. In this respect, the results of the analysis are open to the interpretation that investors make choices by considering multiple factors, not just one factor in their altcoin selections.
Cryptocurrencies can be stored in crypto wallets, and they can be withdrawn to cold wallets with the motivation to keep their value in the long term. In this wise, the study’s findings can also be depicted as a factor affecting investor sentiment by directing users’ expectations from altcoins that such technological features. Besides, our findings regarding the ease with which altcoins can be effortlessly withdrawn to crypto wallets align with Nadeem et al. [62]’s findings as revealed by the perceived usefulness and ease of use factors in investors’ use of cryptocurrencies. It can be regarded as an initiator that activates the intention of adopting altcoins. Our findings also exposed that security criteria are considered by investors as much as functional conveniences during the use of cryptocurrencies and the selection of altcoins. This result should accordingly be evaluated in the same direction as the multi-factor study of Böyükaslan and Ecer [63], in which the security factor was determined as the most effective component in cryptocurrency investments.
We acquired other main findings through the agency of the ranking for the cryptocurrencies with the highest market capitalization by investors. When the findings related to the ranking of the altcoins are pondered, the findings highlighted that investors have positively differentiated ETH and USDT from the other cryptocurrencies with the highest market capitalization while BTC followed both. The most minor weighted assets by the investors are UNI, LUNA, and LTC, respectively, and they appeared as the cryptocurrencies preferred by the investors in the last three rows.
Findings on the top-three rated assets can be considered partly surprising. Because BTC still has the highest market cap in the market while its congeneric follower ETH floats at levels of almost 50% of it. When investors rank cryptocurrencies, ETH is the first among those with the highest market value, which can be discussed with the results of previous research that the fluctuations in the price of altcoins were initially linked to the movement of BTC. For instance, some earlier studies, such as Corbet et al. [92], reported before that there had been a close relationship between BTC and ETH as per price discovery. Some studies, such as Ji et al. [55,93], concluded that BTC-induced shocks have varying effects on other cryptocurrency returns. Further, Kyriazis [94] and Akyildirim et al. [50] produced evidence that BTC stands still the dominant cryptocurrency in the market and strongly influences investor sentiment directing the market with the net-transmitter role. In another recent study, Anamika and Subramaniam [95] found that although BTC continues to dominate the market and is determinant in the price of other cryptocurrencies, this dominance is particularly evident when investors are optimistic about BTC prices. This finding is essential since the anxiety created by the increasing uncertainties around the world recently may have negatively caused investors to change their attitudes towards BTC. In this respect, it may be possible that the multidimensional movement between these two assets is not only followed by researchers but also makes possible the existence of an interaction that is carefully followed by investors in the crypto market and has an impact on the perceptions of the market experts participating in our study. In this sense, our findings may mean that crypto investors are skeptical about BTC’s leadership in the market and admit ETH as a more reliable cryptocurrency than BTC. In this perspective, this finding also goes in the same direction as Corbet et al. [52]’s research that implied BTC was not the most dominant asset in the crypto market. In line with our study findings, it seems that ETH is nominated for a role as the new leader of the crypto market by market specialists.
On the other hand, this ranking may also indicate that investors find ETH less susceptible to endogenous and exogenous shocks, including geopolitical risks such as pandemics and political tensions that deeply affect financial markets. Considering the fluctuations that financial assets have been exposed to in the last few years, another finding in the study supports this view. Because, in the ranking where investors evaluate altcoins, USDT takes first place next to ETH. Therefore, this result may indicate that investors have tended to use stable coins in highly volatile investment conditions against recent price fluctuations in the financial markets. This tendency is possibly driven by investors diversifying their portfolios with stable coins avoiding possible losses during periods of intense market instability or stablecoins, which are relatively less volatile than other cryptocurrencies since their pegged values to USD or Gold, to retain the actual value of their investments. Meanwhile, stablecoins are widely used as risk-reducing instruments in crypto markets and hybrid portfolios with other traditional investment instruments. Moreover, some researchers, such as Wang et al. [96], reported notable empirical findings that all stablecoins could be used as an effective diversifier. However, their potency varies, whether Gold-backed or USD-backed.
Nevertheless, it is pretty exciting and requires a reasonable explanation that crypto experts only give credit to USDT, while there exist two stablecoins in the form of USDT and USDC among the altcoins in the dataset. USDT seems to have attracted more investors’ attention than other USDCs in crypto markets. We can clarify this finding by increasing investor attention since USDT has approximately five times more circulation than USDC and has about 1.5 times the market value of USDC, and at the same time, the transaction volume is relatively higher. However, as far as Chohan [97] is concerned, stablecoin demand may also be affected due to the direct impact of specific economic or political uncertainties on the market. This wise, the reliability of stable currencies or precious commodities is not evident. In this regard, as suggested by Wang et al. [96], we carefully discuss our findings’ interpretation by cautiously approaching stablecoins, assuming that the demand for stablecoins would not be affected in uncertain conditions and would provide price stability in terms of investments.

6. Practical Implications

Whereas the depth and diversity that blockchain-based products and services add to daily life have become more noticeable, the finance world is witnessing the dizzying development of various industries and sectors with new technological products every day. The effects of the revolutionary transformation created by blockchain technology, which is one of the most powerful tools of innovative products recently in the economic and financial environments, reveal the most curious research areas by scientists in this regard. Thence, many academic studies produced by scientists, on the one hand, reveal the ultimate stage of innovative technological products. On the other hand, they create opportunities for novel and innovative ideas to flourish by meeting with sectoral stakeholders.
Notably, new blockchain-based financial products and why users prefer blockchain-based financial products and user experiences have been the subject of many kinds of research. This study includes many implications for blockchain technology stakeholders and users by revealing and analyzing the factors that investors attribute importance in selecting and investing altcoins in the ever-increasing cryptocurrency market. Moreover, our evidence implies that there may be a change in investor perception in the known and generally accepted ranking of adopted cryptocurrencies by those who intend to invest in the highest market valued cryptocurrencies that crypto investors frequently trade. Therefore, the findings can be interpreted as having common implications and holistic outcomes for a wide range of financial participants in the crypto market through a volatile economic environment of intense uncertainty likely to be experienced soon.
Adhering to our findings, the first implication brings Blockchain projectors and cryptocurrency developers to the fore. Because crypto investors also carefully monitor whether the platforms they transfer their savings to have the infrastructures to make transactions safely alongside the asset’s price volatility and transaction volumes. But this alone is not enough. Investors also care about crypto wallets that allow cryptocurrencies that they have/think of having to be stored in the blockchain system and prove ownership for the holder. In this respect, the ability of blockchain technology developers to design applications that would simultaneously improve these expectations may have a function that increases investors’ confidence and leads more investors to trade with confidence in the market. Such innovative applications can also help diversify cryptocurrencies in financial markets and increase the depth of cryptomarkets.
The second implication is for multiple parties such as investors, market professionals/market-makers, and enterprise blockchain project developers. Fundamental factors followed by investors, such as price changes of cryptocurrencies, security functions, and ease of transaction, may indicate that the innovations offered by cryptocurrencies are not sufficiently successful in public communication. Notably, potential investors are likely to refrain from investing due to extraordinary price changes. Adding security doubts alongside highly volatile market movements may explain some market-making difficulties. To avoid such disruptions, the processes before cryptocurrencies are listed in the markets can be brought to the fore, and communication campaigns promoting these processes can be shared with investors. For example, identifying investors who avoid extreme fluctuations in the price of listed assets on crypto platforms as long-term project investors can be fulfilled as part of this communication. Thus, investors can be protected from short-term price fluctuations and early become a partner in projects that will provide high returns in the future. For this purpose, blockchain technology provides a function that brings together the fund supplies of those who request funds to be used in the financing of innovative projects on which cryptocurrencies are based and those who wish to be project investors, just before the newly developed altcoins are listed on the stock exchanges. Cooperation of investors and other market participants to initiate the seedify start-up fund (S-Fund) and Initial Coin Offering’s (ICO’s) processes into an institutional structure can be effective in solving these problems.

7. Conclusions

The ongoing cryptocurrency wave makes it more challenging for investors to decide which coin to invest in. The work explores the cryptocurrency market and advises the most investible cryptocurrency from the investor mindset. The purpose of the work is achieved with the usage of three MCDM techniques with IF information, which cope well with the vagueness of data and hesitancy of decision-makers. IF-MAIRCA, IF-MARCOS, and IF-EDAS are employed to identify the most investable cryptocurrency. We first, therefore, highlight the priorities of drivers affecting cryptocurrency investment in this work. Afterward, we convert the experts’ assessments to fuzzy numbers and rank them concerning their scores from the framework proposed that produces meaningful results. Since the results from the three different approaches are not the same due to specific characteristics of the methods, the final results are highlighted with the Borda count.
The results provided make it possible to respond persuasively to the research questions asked in the paper’s first section. Regarding the most influential factors in cryptocurrency investments, reliable software, ease of inclusion in the wallet, and price volatility/trade volume stand out as the factors that investors consider when investing in cryptocurrencies. The second research question, Ethereum, Tether, and Bitcoin, are the finest choices regarding evaluation factors and experts’ opinions concerning the issue related to the best performing cryptocurrencies.
One work limitation is that the research includes only 15 cryptocurrencies with the highest market capitalization, excluding other possible investible cryptocurrencies. A broader set of alternatives, including different cryptocurrencies, may be considered in future studies. Another limitation is the development and expansion of the cryptocurrency market at an unbelievable rate. Therefore, the outcomes of this study may disappear in the near future.
Based on the conclusions offered, an alternative recommendation for future work seems to be the widening of the methods toward vagueness employed in the MCDM field under study. In the long run, the integration of rough and fuzzy models could drive the discovery of novel decision support tools. Such approaches may cope with different types of ambiguities and ensure worthy proposals for decision-makers, researchers, and authorities.

Author Contributions

Conceptualization, F.E. and A.B.; methodology, F.E. and A.B.; validation, F.E., A.B. and S.H.Z.; formal analysis, F.E., A.B. and S.H.Z.; investigation, F.E. and A.B.; writing—original draft preparation, F.E. and A.B.; writing—review and editing, S.H.Z.; supervision, F.E. and S.H.Z.; project administration, S.H.Z.; All authors have read and agreed to the published version of the manuscript.

Funding

This research received no external funding.

Institutional Review Board Statement

Not applicable.

Informed Consent Statement

Not applicable.

Data Availability Statement

The study did not report any data.

Conflicts of Interest

The authors declare no conflict of interest.

Appendix A. Linguistic Judgments of Cryptocurrencies

C1C2C3C4C5C6C7C8C9C10C11C12C13C14C15C16
ExpertCoinMaxMaxMaxMaxMaxMaxMaxMaxMaxMaxMaxMaxMaxMaxMaxMax
Exp#1BTCEGEGGEGEGEGGEGEGBEGEGEGEGEGF
ETHGGGGGEGEGGEGBGEGEGGEGF
BNBGGEGGEGEGGFEGBGEGEGEGEGF
USDTMBMBGGGEGEGEGEGBGGEGEGEGF
SOLMBMBFGMBFGGEGBFGEGFEGF
ADAMBMBMBFMBFGEGFBFGVVGFEGF
XRPMBMBMBMBFFFGEGBFGVVGFEGF
DOTMBMBMBMBFFFGEGBFEGVVGFFF
USDCBBGMBFFFMBEGBBFVVGFEGF
DOGEVVBBFEGMBVBVBMBEGVBVBFVVGVVBFF
SHIBGGEGGMBEGEGEGEGGEGEGVVGFEGEG
AVAXFFGFGGGGEGFGFVVGVBEGF
LUNAFFFFEGGFGFBGFEGBFF
LTCFFFFGGFGFBGFEGFFVB
UNIFFFFGFFFFBGFEGBFF
Exp#2BTCVVGVVGEGEGEGEGVVGVVGEGVGEGEGEGEGEGEG
ETHEGVVGEGEGEGEGEGEGEGVVGEGEGEGEGEGEG
BNBVVGGGEGVVGVGGVVGVGEGVVGGEGEGVGMG
USDTEGEGEGEGEGEGEGEGEGEGEGEGEGVGEGEG
SOLVGGGVGVGVVGVVGVGVVGEGVGVVGVVGVVGVVGVVG
ADAGVGVVGVGVVGVVGVVGVGVVGVVGVGEGVGVGVVGVVG
XRPVGVVGVVGVVGVVGVVGVVGVVGEGVGVVGEGGGVVGVVG
DOTGVGVGGVGVGVGEGVGVVGVGVVGVGGVGVG
USDCGEGGVGVGEGVGVVGEGVGVGVGGFGG
DOGEVBGMGFGVVBEGGFGVVGEGVVGVVGGEG
SHIBVVBGGFFVVBEGFFGVVGEGVVGVVGGEG
AVAXGVGGGGVGGVGVGVVGVGVVGVGGVGVG
LUNAGGGGVGVGGVGGVVGVGVVGGGVGVG
LTCMGGGVGVGVVGVGVVGVVGVGVVGVVGGFGVG
UNIGGGVGGVGVGVGGVGGVVGGGVGVG
Exp#3BTCVGVVGVGVGVGGGGGVGVGVVGGGVGVG
ETHVVGVVGVGEGVGGVGVGGVGEGVVGGGVVGVG
BNBVGVVGVGVGVGGVGVGGVGVGVVGGGVGVG
USDTGVGGVGVGGVGVGGVGGVVGGGGVG
SOLGVGGVGVVGGGGGVGVGVVGGGGVG
ADAGVGGVGVGGGGGGVGVVGGGGVG
XRPFGFGGGGGGGGVVGFFGVG
DOTGGGGGGGGGGGVVGFFGVG
USDCGGGGGGGGGGGVVGGGGVG
DOGEFGGGGGFFGGGVVGFFFVG
SHIBFGGGGGFFGGGVVGFFFVG
AVAXGVGGGVGGVGVGGVGVGVVGGGVGVG
LUNAFGGGVGGGGGGGVVGGGGVG
LTCFGGGVGGGVGGGGVVGGGGVG
UNIGGGVGVVGGVGVGGVGVGVVGGGVGVG
Exp#4BTCEGVGVVGEGVGEGEGEGEGVGEGEGEGMBEGEG
ETHEGEGEGEGEGEGEGEGEGEGEGEGEGEGEGEG
BNBMBGGVVGGEGGVGVVGMGVGMGMBMBVVGVG
USDTGMBGVVGVVGEGVVGVGVVGMGGMGVGGVVGG
SOLMBGGVGGVGMGMGVVGVVGGVGMGVVGVVGG
ADAMGVGVGVVGGVVGMGMGVVGVVGVGVGMGVVGVVGVG
XRPMGVGVGVVGVVGVGVVGVVGVVGVVGVVGVVGVBMBGVG
DOTFMGGGMGMGMGMGVVGMGGMGVBVVGGMG
USDCGMBMBVVGGVVGMGGVGGGGVGGGG
DOGEVVBMBGMGVGVGMGVVGVGGMGMGVVBEGVVGMG
SHIBVBMBGMGMGVGMGMBVGGMGMGVVBVVGVVGMG
AVAXMGVVGVGVVGVVGVVGVVGVVGVVGVVGVVGVGVBVGVVGMG
LUNABGGMGMGMGMGMBMGGGGMBMGGMG
LTCBGGVVGGMGGMBMGGGGMBFGVG
UNIMBMGVGVGMGVVGVVGMGVVGMGVGVVGMBFVGVG

Appendix B. The Aggregated IF Decision-Matrix Concerning Cryptocurrencies

C1 C2 C3 C4 C5 C6 C7 C8
μ ϑ π μ ϑ π μ ϑ π μ ϑ π μ ϑ π μ ϑ π μ ϑ π μ ϑ π
BTC1.0000.0000.0001.0000.0000.0001.0000.0000.0001.0000.0000.0001.0000.0000.0001.0000.0000.0001.0000.0000.0001.0000.0000.000
ETH1.0000.0000.0001.0000.0000.0001.0000.0000.0001.0000.0000.0001.0000.0000.0001.0000.0000.0001.0000.0000.0001.0000.0000.000
BNB0.7530.1760.0700.7500.1670.0831.0000.0000.0001.0000.0000.0001.0000.0000.0001.0000.0000.0000.7300.1860.0840.7670.1710.061
USDT1.0000.0000.0001.0000.0000.0001.0000.0000.0001.0000.0000.0001.0000.0000.0001.0000.0000.0001.0000.0000.0001.0000.0000.000
SOL0.6410.2730.0860.6770.2360.0880.6570.2400.1030.7780.1620.0610.7350.1940.0710.7410.1850.0740.7440.1740.0820.7210.1970.082
ADA0.6220.2730.1050.7340.2050.0610.7040.2210.0750.7580.1810.0610.7380.1910.0710.7540.1720.0740.7440.1740.0821.0000.0000.000
XRP0.6180.3000.0820.7280.1960.0760.6610.2650.0730.7420.1820.0760.7540.1720.0740.7410.1850.0740.7540.1720.0740.7850.1440.072
DOT0.6070.2870.1060.6660.2500.0840.7090.2060.0850.6400.2540.1050.6810.2360.0830.6810.2360.0830.6810.2360.0831.0000.0000.000
USDC0.6190.2660.1151.0000.0000.0000.6620.2350.1040.7180.2060.0750.6970.2200.0831.0000.0000.0000.6810.2360.0830.7090.2060.085
DOGE0.2280.6890.0830.5700.3130.1170.6260.2710.1031.0000.0000.0000.6650.2420.0930.6980.2180.0841.0000.0000.0000.6360.2700.094
SHIB0.4210.4760.1030.6620.2350.1041.0000.0000.0000.6320.2650.1030.5320.3530.1151.0000.0000.0001.0000.0000.0001.0000.0000.000
AVAX0.6400.2570.1030.7580.1810.0610.7200.1900.0890.6960.2120.0910.7610.1640.0750.7650.1620.0730.7610.1640.0750.7890.1510.061
LUNA0.5400.3480.1120.6570.2400.1030.6570.2400.1030.6400.2570.1031.0000.0000.0000.7210.1970.0820.6400.2570.1030.7010.2150.084
LTC0.4990.3930.1080.6570.2400.1030.6570.2400.1030.7310.1950.0740.7610.1700.0690.7440.1740.0820.6970.2200.0830.7530.1760.070
UNI0.6130.2400.1470.6400.2400.1210.6810.2400.0800.7460.1940.0600.7370.1480.1150.7310.2200.0490.7580.1940.0480.7130.1940.093
C9 C10 C11 C12 C13 C14 C15 C16
μ ϑ π μ ϑ π μ ϑ π μ ϑ π μ ϑ π μ ϑ π μ ϑ π μ ϑ π
BTC1.0000.0000.0000.7180.2150.0671.0000.0000.0001.0000.0000.0001.0000.0000.0001.0000.0000.0001.0000.0000.0001.0000.0000.000
ETH1.0000.0000.0001.0000.0000.0001.0000.0000.0001.0000.0000.0001.0000.0000.0001.0000.0000.0001.0000.0000.0001.0000.0000.000
BNB1.0000.0000.0001.0000.0000.0000.7960.1430.0611.0000.0000.0001.0000.0000.0001.0000.0000.0001.0000.0000.0000.6860.2390.074
USDT1.0000.0000.0001.0000.0000.0001.0000.0000.0001.0000.0000.0001.0000.0000.0001.0000.0000.0001.0000.0000.0001.0000.0000.000
SOL1.0000.0000.0001.0000.0000.0000.6970.2270.0770.8110.1290.0601.0000.0000.0000.7540.1720.0741.0000.0000.0000.7500.1800.070
ADA0.7540.1720.0740.7260.1910.0820.7040.2280.0681.0000.0000.0000.7670.1640.0690.7310.1950.0741.0000.0000.0000.7670.1710.061
XRP1.0000.0000.0000.7010.2160.0821.0000.0000.0001.0000.0000.0000.6540.2520.0950.5580.3370.1051.0000.0000.0000.7670.1710.061
DOT1.0000.0000.0000.6750.2320.0930.6970.2200.0831.0000.0000.0000.6940.2310.0760.6530.2550.0930.6970.2200.0830.7130.2190.068
USDC1.0000.0000.0000.6630.2440.0930.6630.2440.0930.7470.1830.0700.7670.1590.0750.6000.2960.1041.0000.0000.0000.6920.2220.086
DOGE1.0000.0000.0000.6000.2820.1170.6590.2460.0951.0000.0000.0000.7190.2110.0701.0000.0000.0000.6530.2550.0931.0000.0000.000
SHIB1.0000.0000.0000.7000.2000.1001.0000.0000.0001.0000.0000.0000.7190.2110.0700.7190.2060.0751.0000.0000.0001.0000.0000.000
AVAX1.0000.0000.0000.7790.1600.0620.7890.1510.0610.7840.1540.0620.7540.1700.0750.6280.2690.1041.0000.0000.0000.7130.2190.068
LUNA0.6400.2570.1030.6910.2160.0930.7350.1830.0820.7680.1620.0701.0000.0000.0000.5990.2860.1150.6970.2200.0830.7130.2190.068
LTC0.7080.2080.0840.6630.2440.0930.7570.1620.0810.7680.1620.0701.0000.0000.0000.5620.3340.1040.6570.2400.1030.7040.2280.068
UNI0.6960.2400.0640.6810.2150.1030.7490.1760.0750.7950.1440.0621.0000.0000.0000.5830.2660.1500.7460.1940.0600.7460.1940.060

Appendix C. Closeness Coefficients (CWs) of Cryptocurrencies

C1 C2 C3 C4 C5 C6 C7 C8
δ z + δ z CW1 δ z + δ z CW2 δ z + δ z CW3 δ z + δ z CW4 δ z + δ z CW5 δ z + δ z CW6 δ z + δ z CW7 δ z + δ z CW8
BTC0.0001.4141.0000.0001.4141.0000.0001.4141.0000.0001.4141.0000.0001.4141.0000.0001.4141.0000.0001.4141.0000.0001.4141.000
ETH0.0001.4141.0000.0001.4141.0000.0001.4141.0000.0001.4141.0000.0001.4141.0000.0001.4141.0000.0001.4141.0000.0001.4141.000
BNB0.3111.1180.7820.3121.1240.7830.0001.4141.0000.0001.4141.0000.0001.4141.0000.0001.4141.0000.3381.0970.7640.2961.1310.793
USDT0.0001.4141.0000.0001.4141.0000.0001.4141.0000.0001.4141.0000.0001.4141.0000.0001.4141.0000.0001.4141.0000.0001.4141.000
SOL0.4590.9730.6800.4101.0250.7140.4311.0100.7010.2821.1450.8030.3361.0930.7650.3271.1040.7720.3201.1150.7770.3511.0830.755
ADA0.4780.9630.6680.3421.0830.7600.3771.0520.7360.3081.1180.7840.3321.0970.7680.3091.1220.7840.3201.1150.7770.0001.4141.000
XRP0.4920.9380.6560.3431.0880.7600.4360.9910.6940.3251.1060.7730.3091.1220.7840.3271.1040.7720.3091.1220.7840.2691.1640.812
DOT0.4980.9430.6540.4261.0060.7030.3671.0680.7440.4530.9890.6860.4051.0270.7170.4051.0270.7170.4051.0270.7170.0001.4141.000
USDC0.4790.9670.6690.0001.4141.0000.4251.0170.7050.3571.0730.7500.3841.0500.7320.0001.4141.0000.4051.0270.7170.3671.0680.744
DOGE1.0380.3940.2750.5440.9010.6230.4730.9660.6710.0001.4141.0000.4241.0130.7050.3821.0520.7340.0001.4141.0000.4630.9730.678
SHIB0.7570.6800.4730.4251.0170.7050.0001.4141.0000.4650.9750.6770.5970.8460.5860.0001.4141.0000.0001.4141.0000.0001.4141.000
AVAX0.4550.9860.6840.3081.1180.7840.3501.0880.7570.3821.0550.7340.3001.1330.7910.2951.1370.7940.3001.1330.7910.2671.1610.813
LUNA0.5870.8540.5930.4311.0100.7010.4311.0100.7010.4550.9860.6840.0001.4141.0000.3511.0830.7550.4550.9860.6840.3781.0560.736
LTC0.6460.7930.5510.4311.0100.7010.4311.0100.7010.3401.0900.7620.3011.1280.7890.3201.1150.7770.3841.0500.7320.3111.1180.782
UNI0.4780.9880.6740.4491.0010.6900.4071.0240.7150.3251.1000.7720.3231.1320.7780.3501.0710.7530.3131.1080.7790.3581.0800.751
C9 C10 C11 C12 C13 C14 C15 C16
δ z + δ z CW9 δ z + δ z CW10 δ z + δ z CW11 δ z + δ z CW12 δ z + δ z CW13 δ z + δ z CW14 δ z + δ z CW15 δ z + δ z CW16
BTC0.0001.4141.0000.3621.0650.7470.0001.4141.0000.0001.4141.0000.0001.4141.0000.0001.4141.0000.0001.4141.0000.0001.4141.000
ETH0.0001.4141.0000.0001.4141.0000.0001.4141.0000.0001.4141.0000.0001.4141.0000.0001.4141.0000.0001.4141.0000.0001.4141.000
BNB0.0001.4141.0000.0001.4141.0000.2561.1710.8210.0001.4141.0000.0001.4141.0000.0001.4141.0000.0001.4141.0000.4011.0270.719
USDT0.0001.4141.0000.0001.4141.0000.0001.4141.0000.0001.4141.0000.0001.4141.0000.0001.4141.0000.0001.4141.0000.0001.4141.000
SOL0.0001.4141.0000.0001.4141.0000.3861.0440.7300.2361.1920.8340.0001.4141.0000.3091.1220.7840.0001.4141.0000.3161.1130.779
ADA0.3091.1220.7840.3441.0900.7600.3801.0470.7340.0001.4141.0000.2931.1370.7950.3401.0900.7620.0001.4141.0000.2961.1310.793
XRP0.0001.4141.0000.3781.0550.7360.0001.4141.0000.0001.4141.0000.4390.9980.6950.5660.8730.6070.0001.4141.0000.2961.1310.793
DOT0.0001.4141.0000.4101.0270.7150.3841.0500.7320.0001.4141.0000.3911.0390.7270.4400.9950.6930.3841.0500.7320.3671.0600.743
USDC0.0001.4141.0000.4261.0100.7030.4261.0100.7030.3201.1090.7760.2921.1410.7960.5090.9310.6470.0001.4141.0000.3901.0440.728
DOGE0.0001.4141.0000.5030.9430.6520.4311.0060.7000.0001.4141.0000.3581.0700.7490.0001.4141.0000.4400.9950.6930.0001.4141.000
SHIB0.0001.4141.0000.3741.0680.7410.0001.4141.0000.0001.4141.0000.3581.0700.7490.3571.0730.7500.0001.4141.0000.0001.4141.000
AVAX0.0001.4141.0000.2801.1470.8040.2671.1610.8130.2721.1550.8090.3081.1240.7850.4710.9690.6730.0001.4141.0000.3671.0600.743
LUNA0.4550.9860.6840.3881.0490.7300.3331.1020.7680.2911.1390.7960.0001.4141.0000.5050.9390.6500.3841.0500.7320.3671.0600.743
LTC0.3681.0650.7430.4261.0100.7030.3031.1320.7890.2911.1390.7960.0001.4141.0000.5600.8780.6110.4311.0100.7010.3801.0470.734
UNI0.3921.0330.7250.3981.0440.7240.3161.1150.7790.2581.1700.8190.0001.4141.0000.5170.9490.6470.3251.1000.7720.3251.1000.772

References

  1. Smales, L.A. Volatility Spillovers among Cryptocurrencies. J. Risk Financ. Manag. 2021, 14, 493. [Google Scholar] [CrossRef]
  2. Aysan, A.F.; Khan, A.U.I.; Topuz, H. Bitcoin and Altcoins Price Dependency: Resilience and Portfolio Allocation in COVID-19 Outbreak. Risks 2021, 9, 74. [Google Scholar] [CrossRef]
  3. Spurr, A.; Ausloos, M. Challenging practical features of Bitcoin by the main altcoins. Qual. Quant. 2021, 55, 1541–1559. [Google Scholar] [CrossRef]
  4. Meynkhard, A. Effect of Bitcoin Volatility on Altcoins Pricing. In Proceedings of the Computational Methods in Systems and Software, Online, Czech Republic, 14–17 October 2020; pp. 652–664. [Google Scholar] [CrossRef]
  5. Jalali, M.F.M.; Heidari, H. Predicting changes in Bitcoin price using grey system theory. Financ. Innov. 2020, 6, 13. [Google Scholar] [CrossRef]
  6. Reuters. Available online: https://www.reuters.com/markets/europe/cryptoverse-bitcoin-squeezes-smaller-rivals-its-crown-2022-02-01/ (accessed on 24 February 2022).
  7. Atanassov, K.T. Intuitionistic fuzzy sets. Fuzzy Sets Syst. 1986, 20, 87–96. [Google Scholar] [CrossRef]
  8. Liang, Y. An EDAS Method for Multiple Attribute Group Decision-Making under Intuitionistic Fuzzy Environment and Its Application for Evaluating Green Building Energy-Saving Design Projects. Symmetry 2020, 12, 484. [Google Scholar] [CrossRef]
  9. Ecer, F.; Pamucar, D. MARCOS technique under intuitionistic fuzzy environment for determining the COVID-19 pandemic performance of insurance companies in terms of healthcare services. Appl. Soft Comp. 2021, 104, 107199. [Google Scholar] [CrossRef]
  10. Ecer, F. An extended MAIRCA method using intuitionistic fuzzy sets for coronavirus vaccine selection in the age of COVID-19. Neural Comput. Appl. 2022, 34, 5603–5623. [Google Scholar] [CrossRef] [PubMed]
  11. Jiang, Y.; Lie, J.; Wang, J.; Mu, J. Revisiting the roles of cryptocurrencies in stock markets: A quantile coherency perspective. Econ. Model. 2021, 95, 21–34. [Google Scholar] [CrossRef]
  12. Glaser, F.; Zimmermann, K.; Haferkorn, M.; Weber, M.C.; Siering, M. Bitcoin—Asset or Currency? Revealing Users’ Hidden Intentions (April 15, 2014). ECIS 2014 (Tel Aviv). Available online: https://ssrn.com/abstract=2425247 (accessed on 14 July 2022).
  13. Hui, C.-H.; Lo, C.-F.; Chau, P.-H.; Wong, A. Does Bitcoin behave as a currency?: A standard monetary model approach. Int. Rev. Financ. Anal. 2020, 70, 101518. [Google Scholar] [CrossRef]
  14. Fry, J. Booms, busts and heavy-tails: The story of bitcoin and cryptocurrency markets? Econ. Lett. 2018, 17, 225–229. [Google Scholar] [CrossRef]
  15. Cheah, E.-T.; Fry, J. Speculative bubbles in Bitcoin markets? An empirical investigation into the fundamental value of Bitcoin. Econ. Lett. 2015, 130, 32–36. [Google Scholar] [CrossRef]
  16. Phillips, P.C.B.; Shi, S.; Yu, J. Testing for multiple Bubbles: Historical Episodes of Exuberance and Collapse in the s&p 500. Int. Econ. Rev. 2015, 56, 1043–1078. [Google Scholar] [CrossRef]
  17. Dastgir, S.; Demir, E.; Downing, G.; Gozgor, G.; Lau, C.K.M. The causal relationship between Bitcoin attention and Bitcoin returns: Evidence from the Copula-based Granger causality test. Financ. Res. Lett. 2019, 28, 160–164. [Google Scholar] [CrossRef]
  18. Bleher, J.; Dimpfl, T. Today I got a million, tomorrow, I don’t know: On the predictability of cryptocurrencies by means of Google search volume. Int. Rev. Financ. Anal. 2019, 63, 147–159. [Google Scholar] [CrossRef]
  19. Amirat, A.; Alwafi, W. Does herding behavior exist in cryptocurrency market? Cogent Econ. Financ. 2020, 8, 1735680. [Google Scholar] [CrossRef]
  20. Mokni, K.; Bouteska, A.; Nakhli, M.S. Investor sentiment and Bitcoin relationship: A quantile-based analysis. N. Am. J. Econ. Financ. 2022, 60, 101657. [Google Scholar] [CrossRef]
  21. Baek, C.; Elbeck, M. Bitcoins as an investment or speculative vehicle? A first look. Appl. Econ. Lett. 2015, 22, 30–34. [Google Scholar] [CrossRef]
  22. Demiralay, S.; Bayracı, S. Should stock investors include cryptocurrencies in their portfolios after all? Evidence from a conditional diversification benefits measure. Int. J. Financ. Econ. 2021, 26, 6188–6204. [Google Scholar] [CrossRef]
  23. Akhtaruzzaman, M.; Sensoy, A.; Corbet, S. The influence of Bitcoin on portfolio diversification and design. Financ. Res. Lett. 2020, 37, 101344. [Google Scholar] [CrossRef]
  24. Nasreen, S.; Tiwari, A.K.; Yoon, S.-M. Dynamic Connectedness and Portfolio Diversification during the Coronavirus Disease 2019 Pandemic: Evidence from the Cryptocurrency Market. Sustainability 2021, 13, 7672. [Google Scholar] [CrossRef]
  25. Abakah, E.J.A.; Gil-Alana, L.A.; Madigu, G.; Romero-Rojo, F. Volatility persistence in cryptocurrency markets under structural breaks. Int. Rev. Econ. Financ. 2020, 69, 680–691. [Google Scholar] [CrossRef]
  26. Akkus, H.T.; Celik, I. Modeling, forecasting the cryptocurrency market volatility and value at risk dynamics of Bitcoin. Muh. Muhasebe Bilim Dünyası Derg. 2020, 22, 296–312. [Google Scholar]
  27. Moratis, G. Quantifying the spillover effect in the cryptocurrency market. Financ. Res. Lett. 2021, 38, 101534. [Google Scholar] [CrossRef]
  28. Brauneis, A.; Mestel, R.; Theissen, E. What drives the liquidity of cryptocurrencies? A long-term analysis. Financ. Res. Lett. 2021, 39, 101537. [Google Scholar] [CrossRef]
  29. Fang, T.; Su, Z.; Yin, L. Economic fundamentals or investor perceptions? The role of uncertainty in predicting long-term cryptocurrency volatility. Int. Rev. Financ. Anal. 2020, 71, 101566. [Google Scholar] [CrossRef]
  30. Angerer, M.; Hoffmann, C.H.; Neitzert, F.; Kraus, S. Objective and subjective risks of investing into cryptocurrencies. Financ. Res. Lett. 2021, 40, 101737. [Google Scholar] [CrossRef]
  31. Thampanya, N.; Nasir, M.A.; Huynh, T.L.D. Asymmetric correlation and hedging effectiveness of gold & crypto currencies: From pre-industrial to the 4th industrial revolution. Technol. Forecast. Soc. Chang. 2020, 159, 120195. [Google Scholar]
  32. Al-Yahyaee, K.H.; Mensi, W.; Ko, H.-U.; Yoon, S.-M.; Kang, S.H. Why cryptocurrency markets are inefficient: The impact of liquidity and volatility. N. Am. J. Econ. Financ. 2020, 52, 101168. [Google Scholar] [CrossRef]
  33. Colon, F.; Kim, C.; Kim, H.; Kim, W. The effect of political and economic uncertainty on the cryptocurrency market. Financ. Res. Lett. 2021, 39, 101621. [Google Scholar] [CrossRef]
  34. Dimpfl, T.; Peter, F.J. Nothing but noise? Price discovery across cryptocurrency exchanges. J. Financ. Mark. 2021, 54, 100584. [Google Scholar] [CrossRef]
  35. Demir, E.; Gozgor, G.; Lau, C.K.M.; Vigne, S.A. Does economic policy uncertainty predict the Bitcoin returns? An empirical investigation. Financ. Res. Lett. 2018, 26, 145–149. [Google Scholar] [CrossRef]
  36. Liu, Y.; Tsyvinski, A.; Wu, X. Common Risk Factors in Cryptocurrency. J. Financ. 2022, 77, 1133–1177. [Google Scholar] [CrossRef]
  37. Fruehwirt, W.; Hochfilzer, L.; Weydemann, L.; Roberts, S. Cumulation, crash, coherency: A cryptocurrency bubble wavelet analysis. Financ. Res. Lett. 2021, 40, 101668. [Google Scholar] [CrossRef]
  38. Tan, Z.; Huang, Y.; Xiao, B. Value at risk and returns of cryptocurrencies before and after the crash: Long-run relations and fractional cointegration. Res. Int. Bus. Financ. 2021, 56, 101347. [Google Scholar] [CrossRef]
  39. Chowdhury, M.S.R.; Damianov, D.S.; Elsayed, A.H. Bubbles and crashes in cryptocurrencies: Interdependence, contagion, or asset rotation? Financ. Res. Lett. 2021, 46, 102494. [Google Scholar] [CrossRef]
  40. Chuen, D.L.K.; Guo, L.; Wang, Y. Cryptocurrency: A new investment opportunity? J. Altern. Invest. 2017, 20, 16–40. [Google Scholar] [CrossRef]
  41. Corbet, S.; Meegan, A.; Larkin, C.; Lucey, B.; Yarovaya, L. Exploring the dynamic relationships between crypto currencies and other financial assets. Econ. Lett. 2018, 165, 28–34. [Google Scholar] [CrossRef]
  42. Chemkha, R.; BenSaïda, A.; Ghorbel, A. Connectedness between cryptocurrencies and foreign exchange markets: Implication for risk management. J. Multinatl. Financ. Manag. 2021, 59, 100666. [Google Scholar] [CrossRef]
  43. Andrada-Félix, J.; Fernandez-Perez, A.; Sosvilla-Rivero, S. Distant or close cousins: Connectedness between crypto currencies and traditional currencies volatilities. J. Int. Financ. Mark. Inst. Money 2020, 67, 101219. [Google Scholar] [CrossRef]
  44. Fousekis, P.; Tzaferi, D. Returns and volume: Frequency connectedness in cryptocurrency markets. Econ. Model. 2021, 95, 13–20. [Google Scholar] [CrossRef]
  45. Truby, J. Decarbonizing Bitcoin: Law and policy choices for reducing the energy consumption of Blockchain technologies and digital currencies. Energy Res. Soc. Sci. 2018, 44, 399–410. [Google Scholar] [CrossRef]
  46. Gallersdörfer, U.; Klaaßen, L.; Stoll, C. Energy Consumption of Cryptocurrencies Beyond Bitcoin. Joule 2020, 4, 1843–1846. [Google Scholar] [CrossRef] [PubMed]
  47. De Vries, A. Bitcoin boom: What rising prices mean for the network’s energy consumption. Joule 2021, 5, 509–513. [Google Scholar] [CrossRef]
  48. Yi, S.; Xu, Z.; Wang, G.J. Volatility connectedness in the cryptocurrency market: Is Bitcoin a dominant crypto currency? Int. Rev. Financ. Anal. 2018, 60, 98–114. [Google Scholar] [CrossRef]
  49. Katsiampa, P. An empirical investigation of volatility dynamics in the cryptocurrency market. Res. Int. Bus. Financ. 2019, 50, 322–335. [Google Scholar] [CrossRef]
  50. Akyildirim, E.; Aysan, A.F.; Cepni, O.; Darendeli, S.P.C. Do investor sentiments drive cryptocurrency prices? Econ. Lett. 2021, 206, 109980. [Google Scholar] [CrossRef]
  51. Kumar, A.; Iqbal, N.; Mitra, S.K.; Kristoufek, L.; Bouri, E. Connectedness among major cryptocurrencies in standard times and during the COVID-19 outbreak. J. Int. Financ. Mark. Inst. Money 2022, 77, 101523. [Google Scholar] [CrossRef]
  52. Corbet, S.; Katsiampa, P.; Lau, C.K.M. Measuring quantile dependence and testing directional predictability between Bitcoin, altcoins and traditional financial assets. Int. Rev. Financ. Anal. 2020, 71, 101571. [Google Scholar] [CrossRef]
  53. Sensoy, A.; Silva, T.C.; Corbet, S.; Tabak, B.M. High-frequency return and volatility spillovers among crypto currencies. Am. Econ. J. Appl. Econ. 2021, 53, 4310–4328. [Google Scholar]
  54. Xu, Q.; Zhang, Y.; Zhang, Z. Tail-risk spillovers in cryptocurrency markets. Financ. Res. Lett. 2021, 38, 101453. [Google Scholar] [CrossRef]
  55. Ji, Q.; Bouri, E.; Lau, C.K.M.; Roubaud, D. Dynamic connectedness and integration in cryptocurrency markets. Int. Rev. Financ. Anal. 2019, 63, 257–272. [Google Scholar] [CrossRef]
  56. Katsiampa, P. Volatility co-movement between Bitcoin and Ether. Financ. Res. Lett. 2019, 30, 221–227. [Google Scholar] [CrossRef]
  57. Demir, E.; Simonyan, S.; García-Gómez, C.-D.; Lau, C.K.M. The asymmetric effect of bitcoin on altcoins: Evidence from the nonlinear autoregressive distributed lag (NARDL) model. Financ. Res. Lett. 2021, 40, 101754. [Google Scholar] [CrossRef]
  58. Huynh, K.; Henry, C.; Nicholls, G.; Nicholson, M. Benchmarking Bitcoin Adoption in Canada: Awareness, Ownership and Usage in 2018. Ledger 2020, 5, 74–78. [Google Scholar] [CrossRef]
  59. Gupta, S.; Gupta, S.; Mathew, M.; Sama, H.R. Prioritizing intentions behind investment in cryptocurrency: A fuzzy analytical framework. J. Econ. Stud. 2020, 48, 1442–1459. [Google Scholar] [CrossRef]
  60. Alzahrani, S.; Daim, T.U. Analysis of the cryptocurrency adoption decision: Literature review. In Proceedings of the 2019 Portland International Conference on Management of Engineering and Technology (PICMET), Portland, OR, USA, 25–29 August 2019; pp. 1–11. [Google Scholar]
  61. Stix, H. Ownership and purchase intention of crypto-assets: Survey results. Empirica 2021, 48, 65–99. [Google Scholar] [CrossRef]
  62. Nadeem, M.A.; Liu, Z.; Pitafi, A.H.; Younis, A.; Xu, Y. Investigating the Adoption Factors of Cryptocurrencies—A Case of Bitcoin: Empirical Evidence From China. SAGE Open 2021, 11, 1–15. [Google Scholar] [CrossRef]
  63. Böyükaslan, A.; Ecer, F. Determination of drivers for investing in cryptocurrencies through a fuzzy full consistency meth-od-Bonferroni (FUCOM-F’B) framework. Technol. Soc. 2021, 67, 101745. [Google Scholar] [CrossRef]
  64. Mendoza-Tello, J.C.; Mora, H.; Pujol-López, F.A.; Lytras, M.D. Social commerce as a driver to enhance trust and intention to use cryptocurrencies for electronic payments. IEEE Access 2018, 6, 50737–50751. [Google Scholar] [CrossRef]
  65. Aljinović, Z.; Marasović, B.; Šestanović, T. Cryptocurrency Portfolio Selection—A Multicriteria Approach. Mathematics 2021, 9, 1677. [Google Scholar] [CrossRef]
  66. Hacioglu, U.; Chlyeh, D.; Yilmaz, M.K.; Tatoglu, E.; Delen, D. Crafting performance-based cryptocurrency mining strategies using a hybrid analytics approach. Decis. Support Syst. 2021, 142, 113473. [Google Scholar] [CrossRef]
  67. Maček, D.; Alagić, D. Comparisons of Bitcoin Cryptosystem with Other Common Internet Transaction Systems by AHP Technique. J. Inf. Organ. Sci. 2017, 41, 69–87. [Google Scholar] [CrossRef]
  68. Katrancı, A.; Kundakcı, N. Bulanık CODAS yöntemi ile kripto para yatırım alternatiflerinin değerlendirilmesi. Afyon Kocatepe Üniversitesi Sosyal Bilimler Dergisi 2020, 22, 958–973. (In Turkish) [Google Scholar] [CrossRef]
  69. Wang, W.-Y.; Yang, Y.-C.; Lin, C.-Y. Integrating the BWM and topsis algorithm to evaluate the optimal token exchanges platform in Taiwan. Technol. Econ. Dev. Econ. 2021, 28, 358–380. [Google Scholar] [CrossRef]
  70. Atanassov, K.T. Intuitionistic Fuzzy Sets. In Proceedings of the VII ITKR Session, Sofia, Bulgaria, 20–23 June 1983. (In Bulgarian). [Google Scholar]
  71. Atanassov, K.T. On Intuitionistic Fuzzy Sets Theory; Springer: Berlin/Heidelberg, Germany, 2012. [Google Scholar]
  72. Mishra, A.R.; Rani, P. Interval-valued intuitionistic fuzzy WASPAS method: Application in reservoir flood control manage-ment policy. Group Decis. Negot. 2018, 27, 1047–1078. [Google Scholar] [CrossRef]
  73. Schitea, D.; Deveci, M.; Iordache, M.; Bilgili, K.; Akyurt, I.Z.; Iordache, I. Hydrogen mobility roll-up site selection using intuitionistic fuzzy sets based WASPAS, COPRAS and EDAS. Int. J. Hydrogen Energy 2019, 44, 8585–8600. [Google Scholar] [CrossRef]
  74. Krishankumar, R.; Ravichandran, K.S.; Tyagi, S.K. Solving cloud vendor selection problem using intuitionistic fuzzy decision framework. Neural Comput. Appl. 2020, 32, 589–602. [Google Scholar] [CrossRef]
  75. Xu, Z. Intuitionistic Fuzzy Aggregation Operators. IEEE Trans. Fuzzy Syst. 2007, 15, 1179–1187. [Google Scholar] [CrossRef]
  76. Atanassov, K.T. Intuitionistic fuzzy sets. In Physica; Springer: Berlin/Heidelberg, Germany, 1999; pp. 1–137. [Google Scholar]
  77. Szmidt, E.; Kacprzyk, J. Distances between intuitionistic fuzzy sets. Fuzzy Sets Syst. 2000, 114, 505–518. [Google Scholar] [CrossRef]
  78. Pamucar, D.; Vasin, L.; Lukovac, L. Selection of railway level crossings for investing in security equipment using hybrid DEMATEL-MARICA model. In Proceedings of the XVI International Scientific Expert Conference on Railway, Railcon, Belgrade, Serbia, 9–10 October 2014; pp. 89–92. [Google Scholar]
  79. Zolfani, S.H.; Ecer, F.; Pamucar, D.; Raslanas, S. Neighborhood selection for a newcomer via a novel BWM-based revised mairca integrated model: A case from the coquimbo-la serena conurbation, Chile. Int. J. Strat. Prop. Manag. 2020, 24, 102–118. [Google Scholar] [CrossRef]
  80. Ecer, F. Sustainable supplier selection: FUCOM subjective weighting method based MAIRCA approach. J. Econ. Adm. Sci. Fac. 2021, 8, 26–47. [Google Scholar]
  81. Stević, Ž.; Pamucar, D.; Puška, A.; Chatterjee, P. Sustainable supplier selection in healthcare industries using a new MCDM method: Measurement of alternatives and ranking according to Compromise solution (MARCOS). Comput. Ind. Eng. 2020, 140, 106231. [Google Scholar] [CrossRef]
  82. Zolfani, S.H.; Bazrafshan, R.; Ecer, F.; Karamaşa. The Suitability-Feasibility-Acceptability Strategy Integrated with Bayesian BWM-MARCOS Methods to Determine the Optimal Lithium Battery Plant Located in South America. Mathematics 2022, 10, 2401. [Google Scholar] [CrossRef]
  83. Zolfani, S.H.; Bazrafshan, R.; Akaberi, P.; Yazdani, M.; Ecer, F. Combining the Suitability-Feasibility-Acceptability (Sfa) Strategy with the MCDM Approach. Facta Univ. Ser. Mech. Eng. 2021, 19, 579–600. [Google Scholar] [CrossRef]
  84. Pamucar, D.; Ecer, F.; Deveci, M. Assessment of alternative fuel vehicles for sustainable road transportation of United States using integrated fuzzy FUCOM and neutrosophic fuzzy MARCOS methodology. Sci. Total Environ. 2021, 788, 147763. [Google Scholar] [CrossRef] [PubMed]
  85. Ghorabaee, M.K.; Zavadskas, E.K.; Olfat, L.; Turskis, Z. Multi-Criteria Inventory Classification Using a New Method of Evaluation Based on Distance from Average Solution (EDAS). Informatica 2015, 26, 435–451. [Google Scholar] [CrossRef]
  86. Ecer, F. Third-party logistics (3PLS) provider selection via fuzzy AHP and EDAS integrated model. Technol. Econ. Dev. Econ. 2018, 24, 615–634. [Google Scholar] [CrossRef]
  87. Zolfani, S.H.; Torkayesh, A.E.; Ecer, F.; Turskis, Z.; Šaparauskas, J. International market selection: A MABA based EDAS analysis framework. Oecon. Copernic. 2021, 12, 99–124. [Google Scholar] [CrossRef]
  88. Borda, J.C. Memoire sur les Elections au Scrutin; Histoire de l’Academie Royale des Sciences: Paris, France, 1784. [Google Scholar]
  89. Ecer, F. A consolidated MCDM framework for performance assessment of battery electric vehicles based on ranking strategies. Renew. Sustain. Energy Rev. 2021, 143, 110916. [Google Scholar] [CrossRef]
  90. Esmaeilzadeh, P.; Subramanian, H.; Cousins, K. Individuals’ Cryptocurrency Adoption: A Proposed Moderated-Mediation Model. In Proceedings of the Americas’ Conference on Information Systems AMCIS, Cancún, Mexico, 15–17 August 2019. [Google Scholar]
  91. Bennani, K.S.; Arpaci, I. Factors Influencing Individual and Organizational Adoption of Cryptocurrencies. In Cryptofinance; World Scientific Publishing Co. Pte. Ltd.: Singapore, 2021; pp. 147–169. [Google Scholar] [CrossRef]
  92. Corbet, S.; Lucey, B.; Yarovaya, L. Datestamping the Bitcoin and Ethereum bubbles. Financ. Res. Lett. 2018, 26, 81–88. [Google Scholar] [CrossRef]
  93. Ji, Q.; Bouri, E.; Roubaud, D.; Kristoufek, L. Information interdependence among energy, cryptocurrency and major commodity markets. Energy Econ. 2019, 81, 1042–1055. [Google Scholar] [CrossRef]
  94. Kyriazis, N.A. A Survey on Empirical Findings about Spillovers in Cryptocurrency Markets. J. Risk Financ. Manag. 2019, 12, 170. [Google Scholar] [CrossRef]
  95. Anamika, C.M.; Subramaniam, S. Does sentiment impact cryptocurrency? J. Behav. Financ. 2021, 1–17. [Google Scholar] [CrossRef]
  96. Wang, G.J.; Ma, X.Y.; Wu, H.Y. Are stablecoins truly diversifiers, hedges, or safe havens against traditional cryptocurrencies as their name suggests? Res. Int. Bus. Financ. 2020, 54, 101225. [Google Scholar] [CrossRef]
  97. Chohan, U.W. Are Stable Coins Stable? Notes on the 21st Century (CBRi). 2019. Available online: https://papers.ssrn.com/sol3/pa pers.cfm?abstract_id=3326823 (accessed on 12 February 2022).
Figure 1. A flowchart of the proposed model.
Axioms 11 00404 g001
Figure 2. A ranking of cryptocurrencies.
Axioms 11 00404 g002
Table 1. Explanatory information on the criteria and cryptocurrencies.
Criteria TickersCryptocurrencyMarket Cap (USD)
C1Reliable software platformA1BTCBitcoin1,148,743,134,467.63
C2Providing storage space on a central platformA2ETHEthereum482,628,847,456.41
C3Ease of inclusion in the walletA3BNBBinance Coin79,502,953,196.65
C4Digital encryptionA4USDTTether69,870,632,222.32
C5The technology offered by the altcoin and the project behind itA5SOLSolana69,589,618,742.78
C6Invention purposeA6ADACardano60,902,871,289.69
C7Sector to be servedA7XRPRipple50,903,113,917.35
C8Feasibility of the projectA8DOTPolkadot41,859,199,395.07
C9Monitoring the market and the movement of the crypto assetsA9USDCUSD Coin36,522,677,815.62
C10Smart contractA10DOGEDogecoin32,598,764,545.06
C11Access to benefits and key features of the projectA11SHIBShiba Inu16,651,413,284.97
C12Asset tracking with online appsA12AVAXAvalanche15,803,193,850.13
C13Price volatility/stability and trading volumeA13LUNATerra14,212,535,568.49
C14Return and riskA14LTCLitecoin14,141,224,200.13
C15Portfolio allocation purposes UNIUniswap13,724,649,241.13
C16Listing, trading, convertibility in the foreign exchange marketA15
Note: Data on the market value of the cryptocurrencies have been compiled from (www.coinmarketcap (accessed on 14 February 2022)). The market value is determined by the daily values and circulations of cryptocurrencies at a certain time. It may change in the future depending on these factors.
Table 2. A scale regarding the assessment of criteria and experts [73].
PhraseIF Numbers
Very important (VI) ( μ = 0.88 ,   ϑ = 0.08)
Important (I) ( μ = 0.75 ,   ϑ = 0.20)
Medium (M) ( μ = 0.50 ,   ϑ = 0.45)
Unimportant (UI) ( μ = 0.35 ,   ϑ = 0.60)
Very unimportant (VU) ( μ = 0.08 ,   ϑ = 0.88)
Table 3. Linguistic phrases for rating options [73].
Phrase IFNs   [ μ , ϑ ]
Extremely good (EG) [ μ = 1.00 ,   ϑ = 0.00]
Very very good (VVG) [ μ = 0.85 ,   ϑ = 0.10]
Very good (VG) [ μ = 0.80 ,   ϑ = 0.15]
Good (G) [ μ = 0.70 ,   ϑ = 0.20]
Medium good (MG) [ μ = 0.60 ,   ϑ = 0.30]
Fair (F) [ μ = 0.50 ,   ϑ = 0.40]
Medium bad (MB) [ μ = 0.40 ,   ϑ = 0.50]
Bad (B) [ μ = 0.25 ,   ϑ = 0.60]
Very bad (VB) [ μ = 0.10 ,   ϑ = 0.75]
Very very bad (VVB) [ μ = 0.10 ,   ϑ = 0.90]
Table 4. Linguistic evaluations of criteria.
C1C2C3C4C5C6C7C8
VI, I, VI, VIVI, I, VI, IVI, I, VI, VII, VI, VI, IM, VI, I, UIUI, VI, I, UIUI, VI, I, UIM, I, I, M
C9C10C11C12C13C14C15C16
VI, M, I, VII, M, I, MM, VI, I, MI, I, I, IVI, I, VI, VIVI, I, I, VIM, M, I, VIVI, M, I, VI
Table 5. The experts’ importance of weights.
BasisExp#1Exp#2Exp#3Exp#4
Linguistic judgment‘I’‘VI’‘I’‘M’
Weight of expert0.26120.30330.26120.1742
Table 6. The aggregated IF decision-matrix regarding criteria.
μ ϑ π μ ϑ π μ ϑ π μ ϑ π
C10.8500.1060.044C50.7170.2270.057C90.7760.1720.052C130.8500.1060.044
C20.8300.1240.046C60.6970.2440.059C100.6520.2950.054C140.8180.1340.047
C30.8500.1060.044C70.6970.2440.059C110.7290.2160.055C150.6750.2700.056
C40.8350.1190.046C80.6620.2850.053C120.7500.2000.050C160.7760.1720.052
Table 7. Criteria weights.
Criteria δ z + δ z CCNormalized WeightsCriteria δ z + δ z CCNormalized Weights
C10.1891.2350.8670.0693C90.2871.1360.7980.0638
C20.2161.2070.8480.0678C100.4590.9620.6770.0541
C30.1891.2350.8670.0693C110.3501.0730.7540.0602
C40.2091.2140.8530.0682C120.3241.0980.7720.0617
C50.3671.0560.7420.0593C130.1891.2350.8670.0693
C60.3941.0290.7230.0578C140.2311.1920.8380.0669
C70.3941.0290.7230.0578C150.4260.9960.7000.0560
C80.4450.9760.6870.0549C160.2871.1360.7980.0638
Table 8. Results of IF-EDAS, IF-MARCOS, and IF-MAIRCA.
IF-EDASIF-MARCOSIF-MAIRCA
w s p p ( r ) w s n p ( r ) P S p f ( Γ ^ i ) f ( Γ ^ i + ) f ( Γ i ) Δ i j
BTC15.00015.63815.3190.3940.6060.7860.003
ETH16.00016.00016.0000.3940.6060.7960.000
BNB10.29813.97612.1370.3940.6060.7300.016
USDT16.00016.00016.0000.3940.6060.7960.000
SOL4.00010.8357.4180.3940.6060.6500.036
ADA3.00011.1567.0780.3940.6060.6390.037
XRP4.00010.3337.1670.3940.6060.6370.037
DOT3.0007.4165.2080.3940.6060.6090.045
USDC4.0008.0706.0350.3940.6060.6300.041
DOGE6.0006.8976.4490.3940.6060.6210.039
SHIB9.00011.63410.3170.3940.6060.6760.025
AVAX2.01810.8676.4420.3940.6060.6330.040
LUNA2.0005.8633.9320.3940.6060.5940.050
LTC1.0006.6163.8080.3940.6060.5900.050
UNI1.0007.8404.4200.3940.6060.6050.047
Table 9. Produced ranking results.
IF-EDASIF-MARCOSIF-MAIRCABorda ScoreBorda Rank
BTC333363
ETH111421
BNB444334
USDT111421
SOL666276
ADA878228
XRP787237
DOT121212912
USDC1110111311
DOGE9119169
SHIB555305
AVAX10910169
LUNA141415214
LTC151514115
UNI131313613
Publisher’s Note: MDPI stays neutral with regard to jurisdictional claims in published maps and institutional affiliations.

