Article

A Two-Stage Model Based on EFQM, FBWM, and FMOORA for Business Excellence Evaluation in the Process of Manufacturing

1
Faculty of Engineering, University of Kragujevac, 34000 Kragujevac, Serbia
2
Faculty of Technical Sciences, University of Kragujevac, 32000 Čačak, Serbia
3
Faculty of Management, Union Nikola Tesla University, 11000 Belgrade, Serbia
4
Faculty of Mechanical Engineering, University of Belgrade, 11000 Belgrade, Serbia
*
Author to whom correspondence should be addressed.
Axioms 2022, 11(12), 704; https://doi.org/10.3390/axioms11120704
Submission received: 15 November 2022 / Revised: 30 November 2022 / Accepted: 3 December 2022 / Published: 7 December 2022
(This article belongs to the Special Issue Fuzzy Logic and Application in Multi-Criteria Decision-Making (MCDM))

Abstract

:
In recent decades, many researchers and practitioners have believed that reaching a high level of business excellence leads to the continuous realization of a set of business goals. In the literature, a vast number of models for business excellence evaluation that contain different criteria depending on the cultural, technological, organizational, and socio-economic factors can be found. The aims of the proposed fuzzy two-stage model are to address some of the main shortcomings of the EFQM2020 model and to adapt it to the needs of process manufacturing. The relative importance of quality criteria and their values are presented by pre-defined linguistic expressions modeled by the triangular fuzzy numbers. The determination of the weight vector of criteria is stated as a fuzzy group decision-making problem and determined by using the fuzzy best-worst method. The proposed fuzzy multi-objective optimization by ratio analysis is implemented for determining the rank of enterprises. The management initiatives that should lead to the improvement of business excellence should be based on the business practices of enterprises that are highly placed in the rank. Testing and verification of the proposed model are performed on real data originating from enterprises operating in the same economic sector.

1. Introduction

Business excellence (BE) is often described as an outstanding practice in achieving results as well as managing an organization in order to improve and maintain competitiveness while keeping track of their performance [1]. For enterprises, in order to attain the planned results in today’s competitive world, it is recommended that they use some of the business excellence models (BEM). The most common are the European Foundation for Quality Management model (EFQM), the Malcolm Baldrige National Quality Award (MBNQA), and the Deming Prize used in Japan. Following the mentioned models, there are also national and regional ones, which contain similar or the same criteria for performance assessment [2]. Empirical evidence on the validity, reliability, and predictive power of the BEMs applied to enterprises of different sizes and sectors of activity can be found in the literature. It is stated in [3] that enterprises that have won some of the recognitions of the European Foundation for Quality achieve better results than those that do not have awards or recognitions for excellence. Enterprises with high maturity in BE have better results than enterprises with low BE maturity, as pointed out in [4]. The most significant benefits after the implementation of the EFQM model are emphasized in [5]: image improvement, greater client satisfaction, increased commitment and satisfaction of employees, greater profit achieved by increasing exports, better predisposition for innovation, strengthening the efficiency of knowledge and management projects, and optimization of information systems within the enterprises observed.
Enterprises operating in different conditions, i.e., in different national frameworks, have different organizational preferences. By implementing their own way of doing business and changing the weight of certain criteria, they provide an important basis for assessing the state of business excellence at the national or regional level. The BEMs are also the basis for receiving recognition, i.e., a prize for quality, in addition to being a tool for self-assessment and improving the quality of the organization. Therefore, the scoring system has been developed. Each dimension of the model carries a certain number of points, as does each criterion within it. The scientific literature supports the fact that enterprises operate in an uncertain environment with different national frameworks along with different conditions, and therefore the dimensions and criteria of the BEM have to be adjusted [2,6,7]. The EFQM model criteria, since they were developed for the needs of the European market, meet the needs of enterprises operating on the territory of the Republic of Serbia; nevertheless, score distribution needs adjustment in order to fulfill distinctive market needs. This problem was treated as a two-stage fuzzy multi-attribute decision-making (MADM) model. Firstly, the proposed FBWM is used for obtaining the weighted vector of quality criteria taken from the EFQM. After that, the rank of identified enterprises is given by using fuzzy multi-objective optimization on the basis of ratio analysis (FMOORA).
There are many papers in which the ranking problem is stated by the proposed two-stage fuzzy multi-criteria decision-making problem. The vagueness in the relative importance of criteria and their values is expressed by pre-defined linguistic terms that are modeled by triangular fuzzy numbers (TFNs), as suggested in the relevant literature [8,9]. It should be emphasized that in the literature there are a large number of works in which different forms of membership functions are used for modeling uncertain and imprecise data [10,11]. Although the triangular membership function is less tolerant, many authors believe that triangular fuzzy numbers (TFNs) describe uncertain data well enough. Moreover, handling TFNs requires fewer complex mathematical operations, which is an advantage of using TFNs.
In this research, a fuzzy two-stage model for rating and ranking enterprises with respect to quality criteria is proposed. Calculating the weight vector of quality criteria is set up as a fuzzy group decision-making problem. It can be considered that it is closer to the human way of thinking that decision makers (DMs) evaluate the relative importance of quality criteria in pairs by using pre-defined linguistic terms. Therefore, in this research, it is supposed that the determination of quality criteria weights is based on the proposed fuzzy best-worst method (FBWM). The aggregation of decision makers’ assessments into a single assessment can be performed by applying different operators [12,13,14]. The aggregated weights of the quality criteria in this paper were obtained by using a fuzzy geometric mean.
Comparison of different multi-attribute decision-making methods is presented in Table 1.
Based on the characteristics presented in Table 1, it can be concluded that MOORA has certain advantages compared to the other analyzed MADM methods. Starting from the fact that quality managers can better describe quality criteria by linguistic terms than using the measurement scale proposed in the traditional EFQM, in this research, MOORA was extended with TFNs (FMOORA). There are many papers that use FMOORA [9,16,17,18,19,20], as in this research. In all analyzed papers, the authors suggested that uncertain values can be modeled well enough by using TFNs. All these authors suggested the fuzzy arithmetic mean for aggregating DMs’ opinions into a single rating. Many authors use the common measurement scale [17,18,19], as proposed in this research.
The motivation for this research comes from the fact that there are no research papers that treat the problem of business excellence evaluation of enterprises according to the new EFQM 2020 model in an uncertain environment in an exact way in a fuzzy environment. The wider objective of this research may be presented as the integration of embracing methods: (a) introduction of quality criteria for evaluation enterprises by analogy EFQM; (b) modeling of the relative importance of quality criteria and their values by TFNs; (c) determination of weights of the quality criteria by FBWM and fuzzy geometric mean; (d) ranking of enterprises by using the proposed FMOORA; and (e) in order to increase business excellence, the enterprise’s management can apply to benchmarks based on the obtained ranking of the considered enterprises.
The novelty of this research paper can be expressed as follows: (1) Using the new EFQM 2020 model; (2) BWM was used because the rationale of the BWM method is clearer and more understandable for DMs compared to FAHP; (3) FMOORA was used, which is clear and easy to apply, and with its application, adequate results are obtained.
The research gap of this paper is reflected in the determination of the number of linguistic terms as well as the form of membership function and granulation of fuzzy numbers that are burdened by subjective assessments of decision-makers and the researchers. The rest of the paper is organized as follows: Section 2 presents a literature review of EFQM, integration fuzzy sets theory, BWM, and FMOORA. The proposed model is presented in Section 3. The proposed model is tested with real-life data in Section 4, and Section 5 sets a conclusion.

2. Literature Review

2.1. European Foundation for Quality Management Model

Over the years, the EFQM model has undergone some changes and evolved in order to keep pace with trends in business. The weights of the criteria have been changed over time to keep up with changes in business trends. Along with those changes, practitioners and academics have made efforts to modify EFQM model scores and adapt them to various fields of study. Several modified EFQM models based on the model established in 1992 and its following revisions up to 2013, processed with MCDM techniques, can be found in the literature. EFQM model adapted to: (i) a specific country by [21], (ii) a service industry by [22], (iii) a management tool within the organization by [23]. However, studies on the EFQM 2020 model are still scarce [24].
The main focus of the new EFQM 2020 model is shifted from excellence to outstanding results. This new version of the model integrates the United Nations Sustainable Development Goals and gains a wider scope of use. The EFQM2020 model consists of seven criteria grouped in three dimensions, in contrast to previous versions, which consisted of nine criteria grouped in two dimensions [25].

2.2. Fuzzy Best-Worst Method

The best-worst method (BWM) is a compromise-based method that requires less information than other methods from this group, and also the comparisons are more consistent [26]. For applying BWM it is important to identify the best and the worst criterion. Each criterion is compared to the best criterion and the worst criterion using the proposed measurement scale [26]. Although the classic BWM method has found its application in the relevant literature [27], considering the subjective nature of sustainability criteria, many authors have extended conventional BWM with fuzzy set theory, such as that presented in Table 2. The extension of BWM to fuzzy numbers includes the use of linguistic scales for constructing fuzzy best for other vectors and fuzzy worst for other vectors. A comparative analysis of the presented papers shows similarities and differences between the FBWM proposed in this research and various FBWMs from the relevant literature.
Almost all authors use five linguistic terms for describing the elements of the fuzzy best ordered matrix (FBO) and fuzzy worst ordered matrix (FWO) [29,30,33,34,35,38,39,41]. Some authors suggest adding another linguistic term that describes the equal relative importance of one criterion to another [28,31,42]. Ref. [36] investigated the satisfiability of the results if a different number of linguistic expressions were used. The choice of linguistic expressions depends on several factors, such as the type of problem, as well as on the number of DMs participating in the decision-making process. Starting from this fact, the authors of this research have defined five linguistic variables to describe the relative importance of the criteria according to which the quality of the enterprise’s operations is evaluated, which represents a difference compared to the analyzed works. Modeling of linguistic expressions is based on using TFNs in all analyzed papers, as in this research. Researchers use different intervals on the set of real numbers on which the domains of TFNs are defined. The standard measurement scale defined in conventional AHP [44], i.e., (1–9), is used in Refs. [28,31,36], as well as in this research.
Many authors suggest that the construction of FBO and FWO is realistically given as a fuzzy group decision-making problem [34,36,41,42,43], as in this research. Firstly, weights of considered items at the level of each DM were performed, and then their aggregation was performed. It should be emphasized that this assumption was introduced considering the fact that it is easier to repeat the survey only with those DMs who made inconsistent assessments.
As it is known, Ref. [26] transformed the proposed model into a linear programming (LP) model. The optimal solution of LP presents the criteria weights. Analogy, the proposed fuzzy model is transformed into the fuzzy linear programming (FLP) model. Procedures for solving FLP were developed by [28]. In the proposed procedure, the defuzzified sum of the weights is normalized. These authors used the graded mean integration representation (GRIM) [45] defuzzification method. The proposed procedure [28] is applied in the analyzed papers. FLP solving procedures were used by [31,32] to determine criteria weights. In Ref. [39] authors got the weight vector using the mixed approach developed by [40]. Procedures for checking consistency based on the self-reliance coefficient and possibility level were developed by [28]. Ref. [31] first performed defuzzification and then used consistency check procedures developed in conventional BWM [26]. The consistency check of estimates by [39] was performed by analogy [40]. The fuzzy consistency index, defined by [29], was used in all other analyzed papers as well as in this research.
The authors suggest that FBWM is convenient to apply for determining criteria weights according to which alternatives in different economic domains are evaluated.

2.3. Fuzzy Multi-Objective Optimization by Ratio Analysis
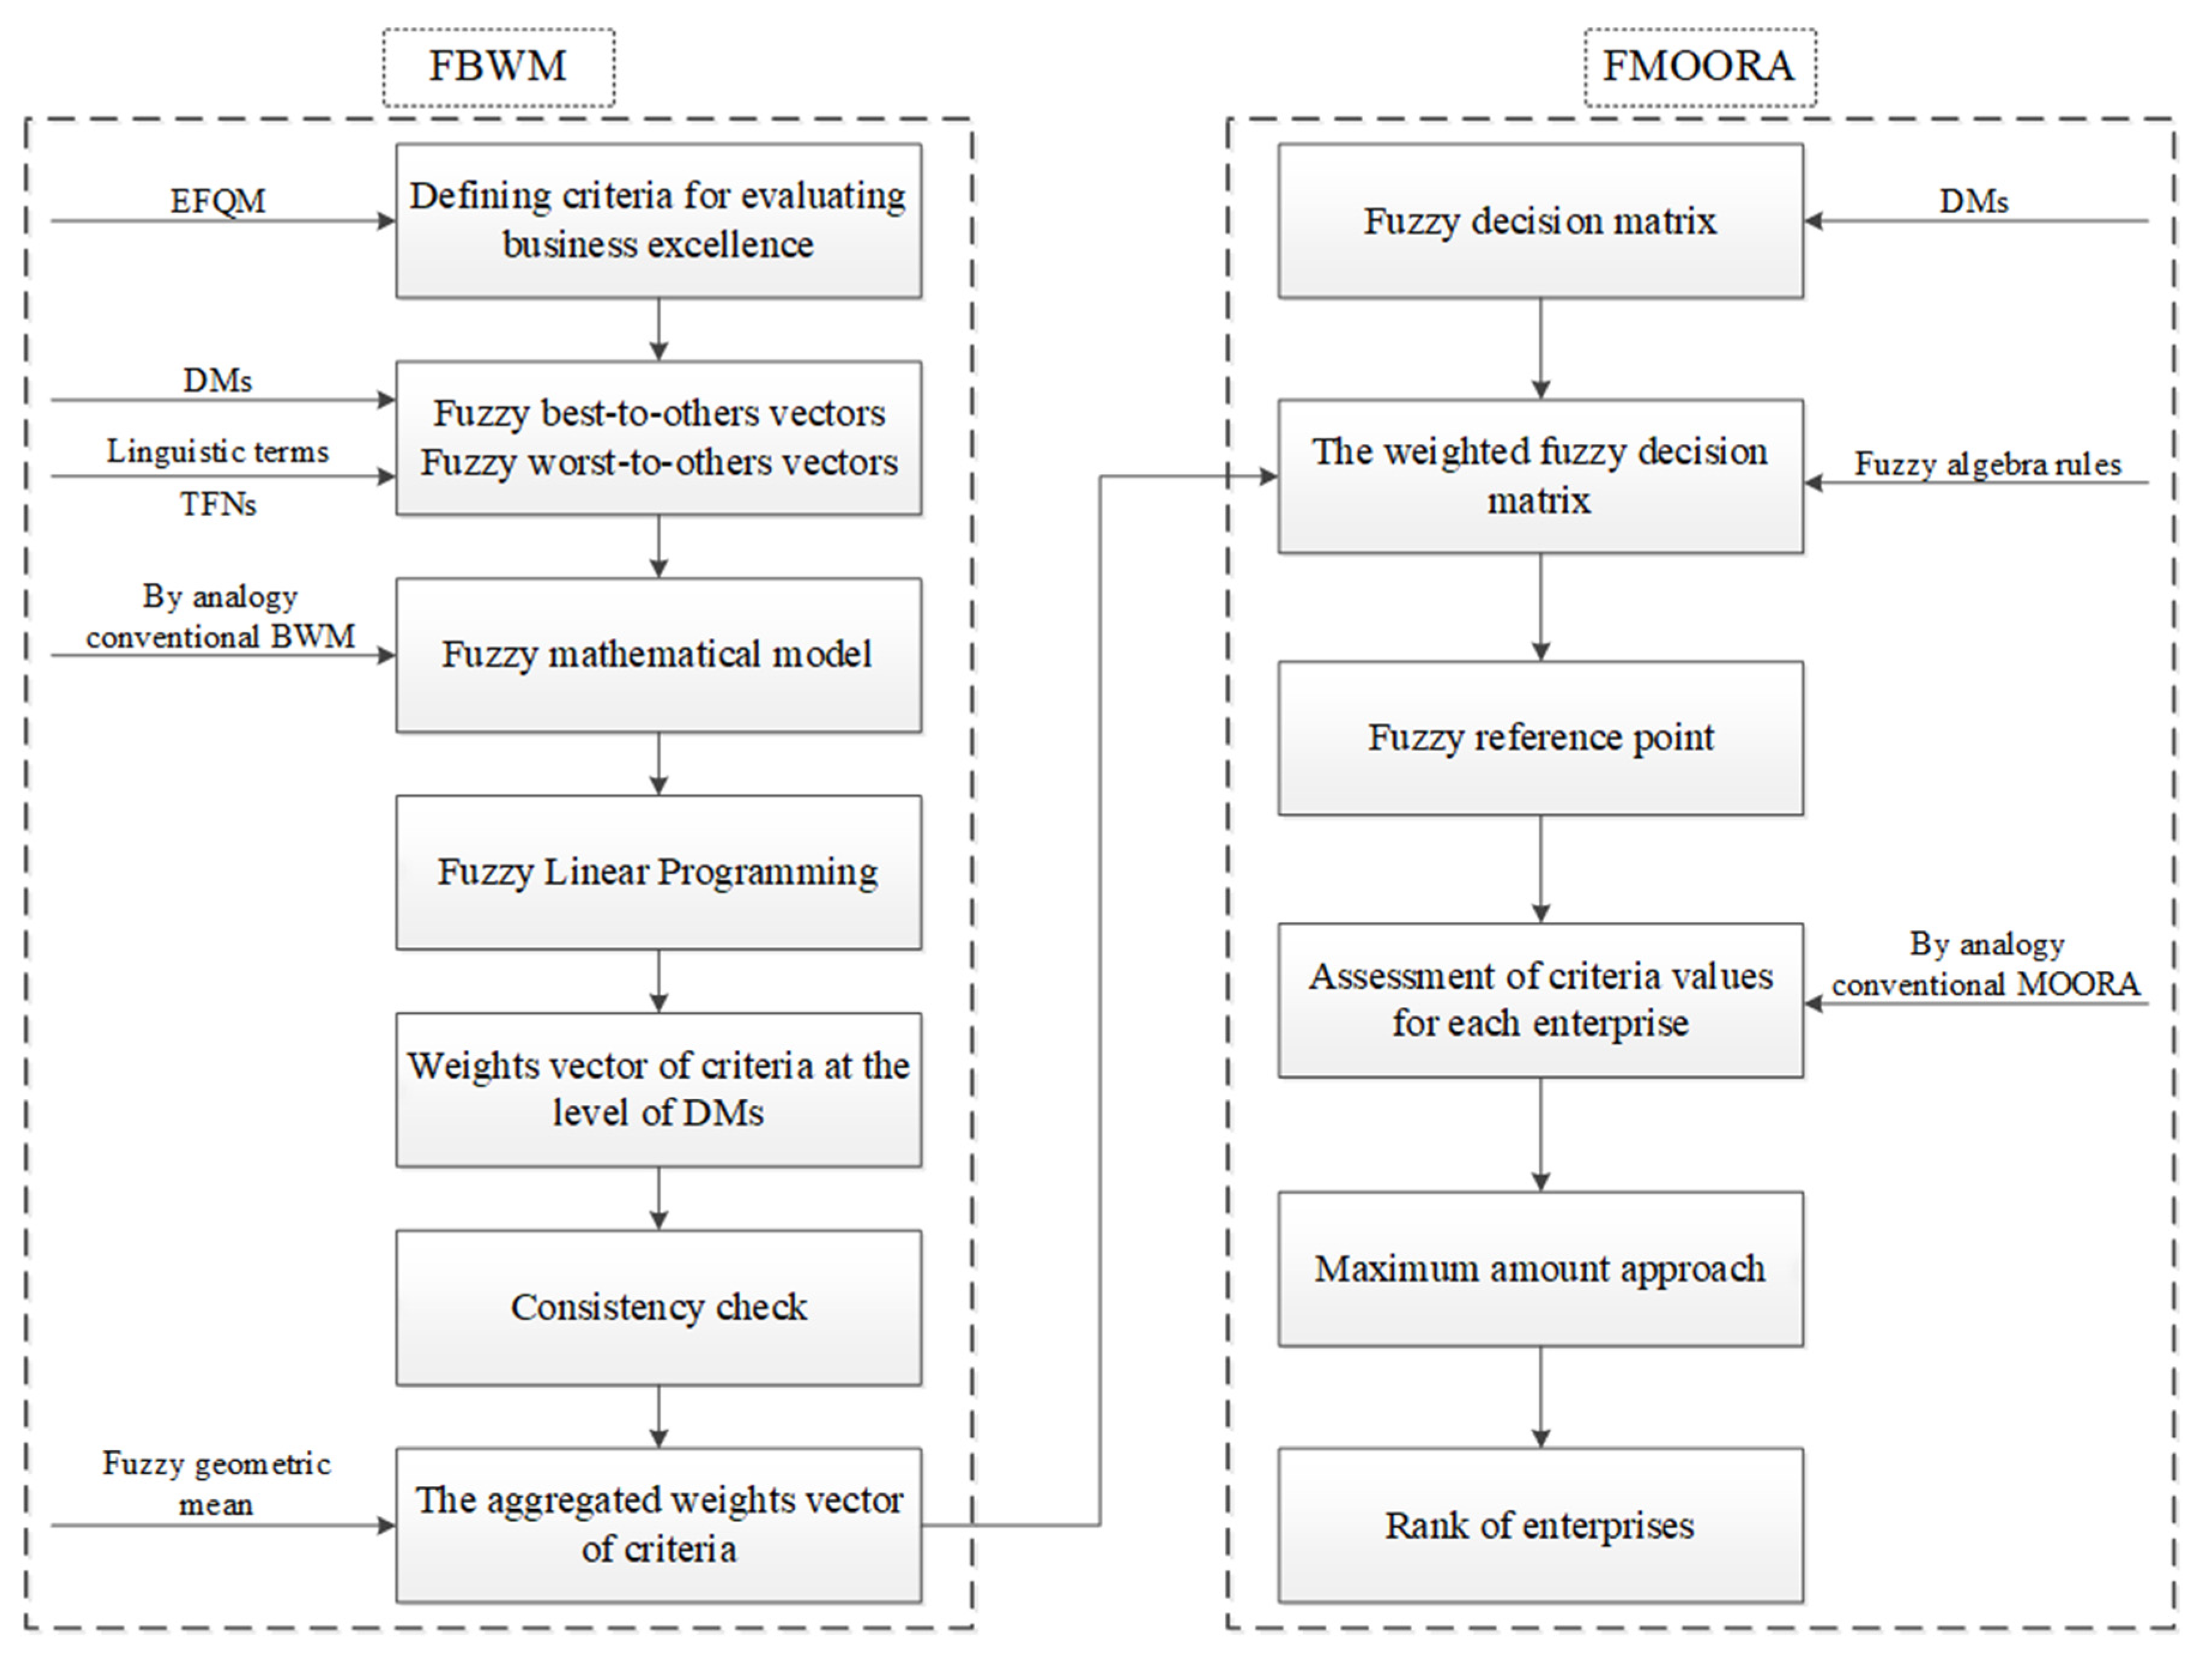
Multi-objective optimization by ratio analysis (MOORA) has a wide range of applications to make decisions in conflicting and complex areas of various decision-making problems. In conventional MOORA, value criteria are obtained by measurement or assessment using pre-defined measurement scales on the real line. The outcomes can be measured for each decision alternative. Objective outcomes provide the basis for the comparison of choices and ultimately lead to the selection of the best. The fuzzification of these MADM methods consists of the use of linguistic terms for describing the values of criteria.
The conventional MOORA consists of three parts: (i) the fuzzy ratio method, (ii) the fuzzy reference point, and (iii) the fuzzy multiplicative form. Some authors believed that the optimal solution should be based on the fuzzy ratio method [16,17,18,19,20], the ratio method extended with grey theory [46], or a combination of all three parts [9]. The ratio system is based on the calculation of aggregated, weighted, normalized values of attributes. By using ratio analysis, an alternative with poor performance with respect to some criteria and fine performance with respect to the remaining criteria can be substituted by an alternative with moderate performance with respect to all criteria [47], which can be marked as a deficiency in these procedures. In the reference point approach, a maximum objective reference point is considered [48]. Some authors believe [49] that the maximal objective reference point approach is more realistic than the ratio system. Therefore, the ranking of considered enterprises is based on the reference points. Since all considered quality criteria are of the benefit type, the fuzzy multiplicative form does not make sense to use for ranking.
There are papers in which MOORA is extended with fuzzy set theory. Furthermore, the similarities and differences between different FMOORA approaches are presented in Table 3.
Elements of the fuzzy decision matrix are described by using five linguistic terms [16,17,18,19] or seven linguistic terms [9,20], as in this paper. In all the analyzed papers, the authors suggested that uncertain values can be modeled well enough by using TFNs. All these authors suggested the fuzzy arithmetic mean for aggregating DMs’ opinions into a single rating. Many authors use the common measurement scale [17,18,19], as in this research.
Determining the value of the fuzzy decision matrix is constructed as a fuzzy group decision-making problem [16,17,19]. The authors of paper [18] used the FMEA framework to evaluate suppliers, so that DMs evaluate suppliers with respect to the type of criteria by analogy to conventional FMEA. Therefore, it can be considered that these criteria are of the same type. In this research, quality criteria were taken from the EFQM model, so they are of the benefit type. The authors believed that in order to reduce the complexity of the calculation, there was no need to construct a normalized fuzzy decision matrix. In all other analyzed works, the authors used the vector normalization procedure developed by [49]. The rank of treated alternatives is based on the ratio system used in all analyzed papers. Some authors calculated the assessment values criteria as the Euclidean distance between the sum of weighted normalized fuzzy values for benefit criteria and the sum of weighted normalized fuzzy values for cost criteria [17,20].
The sum of the weighted normalized fuzzy criteria values is defuzzified by using the modified center of area (MCOA) defined by [51]. After that, the rank of alternatives is determined by using conventional MOORA [16,18,19]. By using fuzzy referents, the point for determination of rank is applied by [9], as in this research. In our paper, the difference between the assessment values of quality criteria and fuzzy reference points is based on the extension of Grzegorzewski’s method [50] as well as the procedure proposed in conventional MOORA. It can be marked as a basic difference, at the same time as an advantage, between the procedure proposed in our paper and the procedure proposed by [9].

3. The Methodology

The proposed model combines the FBWM and FMOORA for estimation and ranking of enterprises as presented in Figure 1.

3.1. Definition of a Finite Set of Criteria

According to the relevant literature, many quality criteria have been identified according to which enterprises are evaluated in order to improve the enterprise’s ability to meet the demands of all stakeholders. Generally, they may be presented by the set of indexes { 1 , , k , , K } , where K presents the total number of quality criteria and the index of each quality criterion is denoted as k ,   k = 1 , , K . The quality criteria in this research paper are taken from EFQM2020 model and are as follows: Organizational culture and leadership ( k = 1 ) , Purpose, Vision, and Strategy   ( k = 2 ) , Stakeholder perceptions ( k = 3 ) , Strategic and operational performance   ( k = 4 ) , Engaging stakeholders   ( k = 5 ) , Creating sustainable value   ( k = 6 ) , and Driving performance and transformation   ( k = 7 ) . These quality criteria, since they were developed for the distinctive European market needs, are suitable for the enterprises operating at the territory of Republic of Serbia.

3.2. Definition of a Finite Set of Enterprises

The observed enterprises operate in the process manufacturing sector. These enterprises can be formally represented by the set { 1 , , i , , I } . The total number of enterprises is denoted as I , and i ,   i = 1 , , I   is the index of enterprises. It should be noted that these enterprises belong to a group of small and medium-sized enterprises operating in one region of the Republic of Serbia.

3.3. Definition of Set of Decision Makers

Decision makers (DMs) are formally represented by a set of indices { 1 , , e , , E } , where E is the total number of DMs. The index of DM is denoted as e ,   e = 1 , , E . The set of DMs that evaluate the relative importance of quality criteria are: (i) a representative from the quality agency, (ii) a representative of the chamber of commerce, and (iii) a professor from the department of industrial engineering. At the level of each enterprise, the criteria values are rated by the quality manager.
Although some authors suggest that decision-makers should have different relative importance [14], in this research, it is considered that decision-makers have the same relative importance as is considered in solving different problems [34,42,52].

3.4. Modeling of the Existing Uncertainties

The uncertainties about the relative importance of quality criteria and their values can be better expressed by natural language words than by crisp values. Existing uncertainties can be modeled by using TFNs. Formally, each TFN can be presented as ( l , m , u ) . Upper and lower bounds are denoted as u and l , respectively. Modal value is denoted as m . Generally, these values are determined based on the subjective assessment of DMs with respect to relevant literature sources. The crisp value, e.g., 1, is represented as ( 1 , 1 , 1 ) . In general, the number of linguistic expressions is determined with respect to the size and type of the problem. In the literature, the common measurement scale is Saaty’s scale [44], which was used in the largest number of works, as in this research.
The relative importance of quality criteria can be appropriately described by using a five-point scale:
  • equally important (E1): ( 1 , 1 , 1 )
  • slightly more important (E2): ( 1 , 2.5 , 4 )
  • medium more important (E3): ( 3 , 5 , 7 )
  • much more important (E4): ( 6 , 7.5 , 9 )
  • extremely more important (E5): ( 9 , 9 , 9 )
The values of quality criteria can be assessed by using seven linguistic terms which are modeled by TFNs:
  • very low value (V1): ( 1 , 1 , 2.5 )
  • low value (V2): ( 1 , 2.5 , 4 )
  • fairly low value (V3): ( 2.5 , 4 , 5.5 )
  • medium value (V4): ( 3.5 , 5.5 , 7.5 )
  • fairly high value (V5): ( 5.5 , 7 , 8.5 )
  • high value (V6): ( 6 , 7.5 , 9 )
  • very high value (V7): ( 7.5 , 9 , 9 )

3.5. The Proposed Fuzzy Best-Worst Method

The weight vector of quality criteria is given by using the proposed FBWM. For an easier understanding of the proposed FBWM, the following notation is given.
Notation:
  • a ˜ B k = ( l B k , m B k , u B k ) is TFN that corresponds to the relative importance of the best criterion over the rest criteria
  • a ˜ W k = ( l W k , m W k , u W k ) is TFN that corresponds to the relative importance of the worst criterion over the rest criteria
  • ω ˜ B = ( l B , m B , u B ) is TFN that corresponds to the weight of the best criterion
  • ω ˜ W = ( l W , m W , u W ) is TFN that corresponds to the weight of the worst criterion
  • ω ˜ k = ( l k , m k , u k ) is TFN that corresponds to the weight of the criterion k , k = 1 , , K .
This extended model could be realized through the following steps:
Step 1. Each DM should assess the relative importance of quality criteria by using the pre-defined linguistic expressions that are modeled by TFNs. The resulting fuzzy best-to-others vector (FBO) A ˜ B and fuzzy other-to-worst vector (FOW) A ˜ W would be presented as:
A ˜ B = ( a ˜ B 1 , , a ˜ B k , , a ˜ B K )   and   A ˜ W = ( a ˜ W 1 , , a ˜ W k , , a ˜ W K ) T
where:
Step 2. At the level of DM e ,   e = 1 , , E ,   the optimal weights of criteria are found by using the following mathematical model:
The objective function
m i n max 1 = 1 , , K { | ω ˜ B ω ˜ k a ˜ B k | , | ω ˜ k ω ˜ W a ˜ k W | }
Subject to
defuzz   ( k = 1 K ω ˜ k = 1 ) l k 0     k = 1 , , K l k m k k = 1 , , K m k u k k = 1 , , K
Step 3. The transformation of the presented mathematical model into a linear programming model can be calculated as minimum of the absolute gap as ( φ * , φ * , φ * ) :
The objective function
min φ *
Subject to
| l B u k · l B k | φ * k = 1 , , K | m B m k · m B k | φ * k = 1 , , K | u B l k · u B k | φ * k = 1 , , K | l k u W · l W k | φ * k = 1 , , K | m k m W · m W k | φ * k = 1 , , K | u k l W · u W k | φ * k = 1 , , K 1 6 · ( k = 1 , , K l k + 4 ·   k = 1 , , K m k + k = 1 , , K u k ) = 1 l k m k k = 1 , , K m k u k k = 1 , , K l k 0 k = 1 , , K
Step 4. The minimum consistency is achieved if the following condition is satisfied:
δ ˜ 2 ( 1 ˜ 2 · A ˜ B W ) · δ ˜ + ( A ˜ B W 2 A ˜ B W ) = 0 ˜
where: A ˜ B W = ( 1 , 1 , 1 )
The fuzzy Equation (5) is transformed into equation:
δ 2 ( 1 2 · A B W ) · δ + ( A B W 2 A B W ) = 0
where: A B W is the representative scalar of TFN A ˜ B W .
The consistency index (CI) is obtained by solving the equation (Equation (7)). The consistency ratio (CR):
C R = δ * C I
The degree of consistency and reliability of the obtained criteria weights can be checked by calculating CR.
Step 5. The weight vector of quality criteria, ( ω ˜ 1 e * , , ω ˜ k e * , , ω ˜ K e * ) is determined by LINGO software.
Step 6. The aggregated weight vector of quality criteria ( ω ˜ 1 * , , ω ˜ k * , , ω ˜ K * ) is given by using fuzzy geometric operator.

3.6. The Proposed Fuzzy Multi-Objective Optimization by Ratio Analysis

The proposed MOORA is extended with TFNs and presented as:
Step 1. The assessment of identified criteria values at the level of each enterprise is stated in matrix form:
[ x ˜ i k ] I x K
The elements of this matrix are defined as criteria values at the level of each enterprise i ,   i = 1 , , . I .
Step 2. The weighted normalized fuzzy decision matrix is given by using the fuzzy algebra rule [53], where:
z ˜ i k = ω ˜ k · x ˜ i k = ( l i k ,   m i k ,   u i k )
Step 3. The fuzzy reference point, f ˜ k is determined for each criterion k ,   k = 1 , , K :
f ˜ k = ( max i = 1 , , I l i k ,   max i = 1 , , I m i k ,   max i = 1 , , I u i k ) = ( L k , M k , U k )
Step 4. The assessment value criteria for each enterprise are calculated as:
d i k = 1 K · d ( f ˜ k , z ˜ i k )
where d ( f ˜ k , z ˜ i k ) is the distance between the two TFNs based on the extension of Grzegorzewski’s method [50]:
d ( f ˜ k , z ˜ i k ) = 1 2 · { max ( | L k l i k | , | M k m i k | ) + max ( | M k m i k | , | U k u | ) }
Step 5. By specifying the maximum amount of d i k for each enterprise i ,   i = 1 , , I is given according to [54]:
δ i = m i n max k = 1 , , K d i
Step 6. The ranking of the enterprises is determined according to the calculated values δ i .
Step 7. Improving the quality of business operations of the considered enterprises is done by taking measures that should lead to an improvement in the value of the quality criteria, considering their target values to be those of the first-ranked enterprises.

4. Case Study

The proposed model has been tested on real-life data obtained from 20 randomly selected SMEs from the Republic of Serbia. These enterprises differ from each other in terms of size and represented technological level, as well as in terms of final product diversity. The metal processing industry is implemented in 50% of the considered companies. Products made of wood, plastic, and leather are produced in five, three, and two enterprises, respectively. Some of these companies, predominantly from the metal processing industry, are parts of larger production supply chains that exist on the territory of the Republic of Serbia. The common characteristic of the considered enterprises is that they are classified as SMEs and belong to the process manufacturing industry, which has the greatest impact on the gross national income of the Republic of Serbia. It should be emphasized that all the considered companies are certified according to the ISO 9001 standard.
In the first part of this research, the relative importance of quality criteria taken from the EFQM model was assessed by three DMs through an interview: (i) a representative from the quality agency, (ii) a representative of the chamber of commerce, and (iii) a professor from the department of industrial engineering.
In the second part of this research, the organizations’ performances were assessed by quality managers at the level of each considered enterprise according to the given criteria. Each quality manager received a questionnaire via email, in which it was explained that the estimations of organization performance according to given criteria can be described using one of seven linguistic expressions. Quality managers sent their evaluations by email.

4.1. An application of the proposed Fuzzy Best-Worst Method for Determining the Criteria Weights

The developed FBWM procedure is illustrated in the example of calculating the weight vector for the first DM.
Assessments of the relative importance of quality criteria are presented (Step 1):
A ˜ B = ( E 5 , E 4 , E 3 , E 2 , E 2 , E 2 , E 1 )
A ˜ w = ( E 1 , E 2 , E 3 , E 4 , E 3 , E 3 , E 5 )
The model of linear programming can be stated by applying the proposed algorithm (Step 2 to Step 4):
The objective function
min φ *
Subject to
| l 7 u 1 · 9 | φ * | m 7 m 1 · 9 | φ * | u 7 l 1 · 9 | φ * | l 7 u 2 · 6 | φ * | m 7 m 2 · 7.5 | φ * | u 7 l 2 · 9 | φ * | l 7 u 3 · 3 | φ * | m 7 m 3 · 5 | φ * | u 7 l 3 · 7 | φ * | l 7 u 4 · 1 | φ * | m 7 m 4 · 2.5 | φ * | u 7 l 3 · 4 | φ * | l 7 u 5 · 1 | φ * | m 7 m 5 · 2.5 | φ * | u 7 l 5 · 4 | φ * | l 7 u 6 · 1 | φ * | m 7 m 6 · 2.5 | φ * | u 7 l 6 · 4 | φ * | l 2 u 1 · 1 | φ * | m 2 m 1 · 2.5 | φ * | u 2 l 1 · 4 | φ * | l 3 u 1 · 3 | φ * | m 3 m 1 · 5 | φ * | u 3 l 1 · 7 | φ * | l 4 u 1 · 6 | φ * | m 4 m 1 · 7.5 | φ * | u 4 l 1 · 9 | φ * | l 5 u 1 · 3 | φ * | m 5 m 1 · 5 | φ * | u 5 l 1 · 7 | φ * | l 6 u 1 · 3 | φ * | m 6 m 1 · 5 | φ * | u 6 l 1 · 7 | φ * 1 6 · ( k = 1 , , 7 l k + 4 ·   k = 1 , , 7 m k + k = 1 , , 7 u k ) = 1 l k m k u k k = 1 , , 7 l k 0 k = 1 , , 7
C R = 0.071 5.23 = 0.014
Weight vector of quality criteria (Step 5) at the level of the first DM are obtained by applying LINGO software:
ω ˜ 11 = ( 0.03 , 0.03 , 0.03 ) ω ˜ 21 = ( 0.04 , 0.05 , 0.07 ) ω ˜ 31 = ( 0.06 , 0.08 , 0.13 ) ω ˜ 41 = ( 0.09 , 0.16 , 0.32 )
ω ˜ 51 = ( 0.09 , 0.16 , 0.27 ) ω ˜ 61 = ( 0.09 , 0.16 , 0.27 ) ω ˜ 71 = ( 0.33 , 0.32 , 0.32 )
The fuzzy other-to-best and fuzzy other-to-worst vector for the second DM is assessed:
A ˜ B = ( E 4 , E 2 , E 2 , E 1 , E 5 , E 3 , E 2 )
A ˜ w = ( E 2 , E 3 , E 3 , E 4 , E 1 , E 4 , E 4 )
The consistency index is:
C R = 0.097 5.23 = 0.019
Weights vector of quality criteria at the level of the second DM is:
ω ˜ 12 = ( 0.05 , 0.05 , 0.07 ) ω ˜ 22 = ( 0.10 , 0.16 , 0.26 ) ω ˜ 32 = ( 0.10 , 0.16 , 0.26 ) ω ˜ 42 = ( 0.31 , 0.31 , 0.31 )
ω ˜ 52 = ( 0.02 , 0.02 , 0.03 ) ω ˜ 62 = ( 0.06 , 0.08 , 0.14 ) ω ˜ 72 = ( 0.10 , 0.16 , 0.31 )
The weight vector of quality criteria for the third DM is determined in a similar way. FBO and FWO are assessed:
A ˜ B = ( E 4 , E 5 , E 1 , E 2 , E 3 , E 4 , E 2 )
A ˜ w = ( E 2 , E 1 , E 5 , E 4 , E 3 , E 3 , E 4 )
The consistency index is:
C R = 0.109 5.23 = 0.021
Weight vector of quality criteria at the level of the third DM is:
ω ˜ 13 = ( 0.05 , 0.06 , 0.08 ) ω ˜ 23 = ( 0.03 , 0.03 , 0.04 ) ω ˜ 33 = ( 0.35 , 0.35 , 0.35 ) ω ˜ 43 = ( 0.11 , 0.18 , 0.35 )
ω ˜ 53 = ( 0.06 , 0.09 , 0.15 ) ω ˜ 63 = ( 0.05 , 0.06 , 0.08 ) ω ˜ 73 = ( 0.11 , 0.18 , 0.35 )
Determining the aggregated weights of quality criteria (Step 6 of the proposed algorithm) is illustrated for quality criterion ( k = 1 ) :
ω ˜ 1 = ω ˜ 11 · ω ˜ 12 · ω ˜ 13 3 = ( 0.03 · 0.05 · 0.05 3 , 0.03 · 0.05 · 0.06 3 , 0.03 · 0.07 · 0.08 3 ) = ( 0.04 , 0.04 , 0.06 )
The aggregated weights for the reset considered quality criteria are given in this way:
ω ˜ 2 = ( 0.05 , 0.06 , 0.09 ) ω ˜ 3 = ( 0.13 , 0.16 , 0.23 ) ω ˜ 4 = ( 0.15 , 0.21 , 0.33 )
ω ˜ 5 = ( 0.05 , 0.07 , 0.11 ) ω ˜ 6 = ( 0.06 , 0.09 , 0.14 ) ω ˜ 7 = ( 0.15 , 0.21 , 0.33 )

4.2. An Application of the Proposed Fuzzy Multi-Objective Optimization by Ratio Analysis

The quality criteria values are assessed by a quality manager at the level of each treated enterprise (Step 1) and presented in Table 4.
The weighted fuzzy decision matrix and reference points are constructed and presented in Table 5 by applying the proposed algorithm (Step 2 to Step 3).
Determining distance between two TFNs is illustrated on the following example:
d ( f ˜ 1 , z ˜ 11 ) = 1 2 · { max ( | 0.30 0.22 | , | 0.36 0.28 | ) + max ( | 0.36 0.28 | , | 0.54 0.51 | ) } = 1 2 · { max ( 0.08 , 0.08 ) + max ( 0.08 , 0.03 ) } = 1 2 · { 0.08 + 0.08 } = 0.08
The assessment values of quality criteria are illustrated on an example of company i = 1 at the level the first quality criteria:
d 11 = 1 7 · 0.08 = 0.0114
The assessment values of quality criteria as well as specifying the maximum amount of d i k ,   δ i and rank enterprises (Step 4 to Step 6) are calculated and presented in Table 6.
By respecting the obtained results, it can be clearly concluded that company i = 4 has reached the highest level of business excellence. The obtained result can be very useful to other companies from the considered group of companies for conducting benchmarking. Criteria that have the greatest weight, such as performance management and transformations ( k = 7 ) , as well as strategic and operational performance ( k = 4 ) , should be enhanced by applying appropriate management initiatives. Applying modern methods for performance measurement and management can significantly improve the value of these two criteria.

5. Conclusions

This research proposes a fuzzy two-model whose application should lead to the ranking of enterprises under a fuzzy environment and set the base for the realization of the brainstorming method appointed to improve the business excellence of enterprises.
The proposed model is tested and verified using real-life data obtained from 20 manufacturing enterprises. The assessment of business excellence in SMEs is based on a modified EFQM model that is adapted to distinctive European market needs. The assessment of the relative importance of the EFQM criteria as well as their estimated value at the level of each enterprise is based on the assessment of DMs. The DMs used their experience and evidence data for their assessments.
The main contributions of the presented research, are:
(1)
Modeling of existing uncertainties based on TFNs,
(2)
The relative importance of the EFQM criteria is set as a fuzzy group decision-making problem;
(3)
The weight vector of EFQM criteria at the level of each DM is determined by FBWM; from the aspect of practical application, applying FBWM has certain advantages related to the AHP framework;
(4)
The aggregated weighted vector of EFQM criteria is given by using a fuzzy geometric mean. The authors believe that the aggregation procedure applied in this research has significantly better characteristics in relation to the aggregation of estimates of DMs because, due to the occurrence of inconsistency in the estimates of DMs, it can be easily determined and the error can be eliminated more quickly;
(5)
The SMEs are ranked by using the proposed FMOORA based on the fuzzy reference point; compared to other similar MADMs extended with fuzzy sets theory the proposed FMOORA requires less complex calculation.
The practical implications of the proposed fuzzy two-level model are oriented towards the practice of managers, who should apply the benchmarking method and choose appropriate management initiatives, whose implementation should lead to the improvement of business excellence in SMEs.
The main advantage of the proposed fuzzy two-stage model in relation to the conventional EFQM is that: (i) it introduces that the weight of the criteria is not equal, this assumption fully corresponds to best practice experiences; (ii) the rank of enterprises is determined in an exact way; and (iii) changes in the number of enterprises, the relative importance of business excellence criteria, as well as the fact that the values can be easily incorporated into the model. In this way, it is possible to apply benchmarking and determine a set of management initiatives that contribute to improving business excellence at the level of each SME. The proposed model can be extended to the analysis of different types of enterprises that exist in various economic sectors.
The main limitations of the proposed fuzzy two-stage model are: (i) subjectivity in the assessments of DMs, which affects the accuracy of the input data; (ii) the practical application of the proposed model requires a software solution. Future research in the theoretical domain includes: (i) modeling existing uncertainties using higher-order fuzzy numbers and (ii) using different MCDM methods for ranking companies. In the practical domain, future research should include: (i) testing and verification of the model on large enterprises as well as on enterprises that operate in various economic sectors, and (ii) the development of a software solution that would enable the user-friendliness of the proposed fuzzy two-stage model.

Author Contributions

Conceptualization, T.P., N.K. and Đ.K.; Investigation, T.P., Đ.K. and G.Đ.; Methodology, J.V.V., D.T. and G.Đ.; Supervision, J.V.V. and D.T.; Validation, N.K.; Writing—original draft, T.P. and D.T.; Writing—review & editing, N.K. All authors have read and agreed to the published version of the manuscript.

Funding

This research received no external funding.

Data Availability Statement

Not applicable.

Conflicts of Interest

The authors declare no conflict of interest.

Abbreviations

AHPAnalytic Hierarchy Process
BEBusiness Excellence
BEMBusiness Excellence Model
BWMBest Worst Method
DMDecision Makers
EFQMEuropean Foundation for Quality Management model
ELECTREElimination and Choice Translating Reality
FBOFuzzy Best-Ordered Matrix
FBWMFuzzy Best-Worst Method
FLPFuzzy Linear Programming
FMEAFailure Mode and Effect Analysis
FMOORAFuzzy Multi-Objective Optimization by Ratio Analysis
FOWfuzzy Other-to-Worst Vector
FWOFuzzy Worst Ordered Matrix
GRIMGraded Mean Integration Representation
MADMMulti-Attribute Decision-Making
MBNQAMalcolm Baldrige National Quality Award
MCDMMulti-Criteria Decision-Making
MCOAModified Center of Area
MOORAMulti-Objective Optimization by Ratio Analysis
PROMETHEEThe Preference Ranking Organization Method for Enrichment of Evaluations
TFNTriangular Fuzzy Number
TOPSISTechnique for Order of Preference by Similarity to Ideal Solution

References

  1. Sulistyo, B.; Amani, H.; Widaningrum, S.; Mohammad, M.; Ibrahim, R. Comparative Study of Business Excellence Frameworks and Awards in Southeast Asian Countries. Int. J. Bus. Soc. 2021, 22, 1123–1142. [Google Scholar] [CrossRef]
  2. Jankalová, M.; Jankal, R. Sustainability assessment according to the selected business excellence models. Sustainability 2018, 10, 3784. [Google Scholar] [CrossRef] [Green Version]
  3. Calvo-Mora, A.; Picón, A.; Ruiz, C.; Cauzo, L. The relationships between soft-hard TQM factors and key business results. Int. J. Oper. Prod. Manag. 2014, 34, 115–143. [Google Scholar] [CrossRef]
  4. Tickle, M.; Mann, R.; Adebanjo, D. Deploying business excellence—Success factors for high performance. Int. J. Qual. Reliab. Manag. 2016, 33, 197–230. [Google Scholar] [CrossRef]
  5. Suárez, E.; Calvo-Mora, A.; Roldán, J.L.; Periánez-Cristóbal, R. Quantitative research on the EFQM excellence model: A systematic literature review (1991–2015). Eur. Res. Manag. Bus. Econ. 2017, 23, 147–156. [Google Scholar] [CrossRef]
  6. Rahman, M.; Islam, R.; Husain, W.R.W.; Ahmad, K. Developing a hierarchical model to enhance business excellence in hotel industry of Bangladesh. Int. J. Contemp. Hosp. Manag. 2019, 31, 1836–1856. [Google Scholar] [CrossRef] [Green Version]
  7. Amponsah, C.T.; Ahmed, G. New global dimensions of business excellence. Int. J. Bus. Excell. 2017, 13, 60–78. [Google Scholar] [CrossRef]
  8. Bakır, M.; Atalık, Ö. Application of fuzzy AHP and fuzzy MARCOS approach for the evaluation of e-service quality in the airline industry. Decis. Mak. Appl. Manag. Eng. 2021, 4, 127–152. [Google Scholar] [CrossRef]
  9. Khorshidi, M.; Erkayman, B.; Albayrak, Ö.; Kılıç, R.; Demir, H.İ. Solar power plant location selection using integrated fuzzy DEMATEL and fuzzy MOORA method. Int. J. Ambient Energy 2022, 43, 7400–7409. [Google Scholar] [CrossRef]
  10. Mahmood, T.; Ullah, K.; Khan, Q.; Jan, N. An approach toward decision-making and medical diagnosis problems using the concept of spherical fuzzy sets. Neural Comput. Appl. 2019, 31, 7041–7053. [Google Scholar] [CrossRef]
  11. Liu, P.; Munir, M.; Mahmood, T.; Ullah, K. Some similarity measures for interval-valued picture fuzzy sets and their applications in decision making. Information 2019, 10, 369. [Google Scholar] [CrossRef] [Green Version]
  12. Ullah, K. Picture fuzzy maclaurin symmetric mean operators and their applications in solving multiattribute decision-making problems. Math. Probl. Eng. 2021, 2021, 1098631. [Google Scholar] [CrossRef]
  13. Khan, Q.; Mahmood, T.; Ullah, K. Applications of improved spherical fuzzy Dombi aggregation operators in decision support system. Soft Comput. 2021, 25, 9097–9119. [Google Scholar] [CrossRef]
  14. Nestic, S.; Gojkovic, R.; Petrovic, T.; Tadic, D.; Mimovic, P. Quality Performance Indicators Evaluation and Ranking by Using TOPSIS with the Interval-Intuitionistic Fuzzy Sets in Project-Oriented Manufacturing Companies. Mathematics 2022, 10, 4174. [Google Scholar] [CrossRef]
  15. Brauers, W.K.M.; Zavadskas, E.K. Robustness of MULTIMOORA: A method for multi-objective optimization. Informatica 2012, 23, 1–25. [Google Scholar] [CrossRef]
  16. Mavi, R.K.; Goh, M.; Zarbakhshnia, N. Sustainable third-party reverse logistic provider selection with fuzzy SWARA and fuzzy MOORA in plastic industry. Int. J. Adv. Manuf. Technol. 2017, 91, 2401–2418. [Google Scholar] [CrossRef]
  17. Ersöz, F.; Kinci, C.H.; Ersöz, T. A model proposal for course selection with the fuzzy MOORA approach. Avrupa Bilim. Teknol. Derg. 2018, 14, 369–377. [Google Scholar]
  18. Arabsheybani, A.; Paydar, M.M.; Safaei, A.S. An integrated fuzzy MOORA method and FMEA technique for sustainable supplier selection considering quantity discounts and supplier’s risk. J. Clean. Prod. 2018, 190, 577–591. [Google Scholar] [CrossRef]
  19. Emovon, I.; Okpako, O.S.; Edjokpa, E. Application of fuzzy MOORA method in the design and fabrication of an automated hammering machine. World J. Eng. 2020, 18, 37–49. [Google Scholar] [CrossRef]
  20. Arslankaya, S.; Çelik, M.T. Green supplier selection in steel door industry using fuzzy AHP and fuzzy Moora methods. Emerg. Mater. Res. 2021, 10, 357–369. [Google Scholar] [CrossRef]
  21. Aydin, S.; Kahraman, C.; Kaya, İ. A new fuzzy multicriteria decision making approach: An application for European Quality Award assessment. Knowl.-Based Syst. 2012, 32, 37–46. [Google Scholar] [CrossRef]
  22. Liu, Y.L.; Ko, P.F. A modified EFQM Excellence Model for effective evaluation in the hotel industry. Total Qual. Manag. Bus. Excell. 2018, 29, 1580–1593. [Google Scholar] [CrossRef]
  23. Metaxas, I.N.; Koulouriotis, D.E.; Spartalis, S.H. A multicriteria model on calculating the Sustainable Business Excellence Index of a firm with fuzzy AHP and TOPSIS. Benchmarking Int. J. 2016, 23, 1522–1557. [Google Scholar] [CrossRef]
  24. Fonseca, L. The EFQM 2020 model. A theoretical and critical review. Total Qual. Manag. Bus. Excell. 2022, 33, 1011–1038. [Google Scholar] [CrossRef]
  25. EFQM. EFQM 2020 Model—EFQM. 2020. Available online: https://www.efqm.org/index.php/efqm-model/download-your-free-short-copy-of-the-efqm-model/ (accessed on 20 May 2021).
  26. Rezaei, J. Best-worst multi-criteria decision-making method: Some properties and a linear model. Omega 2016, 64, 126–130. [Google Scholar] [CrossRef]
  27. Kar, B.; Mohapatra, B.; Kar, S.; Tripathy, S. Small and Medium Enterprise Debt Decision: A Best-Worst Method Framework. Oper. Res. Eng. Sci. Theory Appl. 2022. [Google Scholar] [CrossRef]
  28. Hafezalkotob, A.; Hafezalkotob, A. A novel approach for combination of individual and group decisions based on fuzzy best-worst method. Appl. Soft Comput. 2017, 59, 316–325. [Google Scholar] [CrossRef]
  29. Guo, S.; Zhao, H. Fuzzy best-worst multi-criteria decision-making method and its applications. Knowl.-Based Syst. 2017, 121, 23–31. [Google Scholar] [CrossRef]
  30. Omrani, H.; Alizadeh, A.; Emrouznejad, A. Finding the optimal combination of power plants alternatives: A multi response Taguchi-neural network using TOPSIS and fuzzy best-worst method. J. Clean. Prod. 2018, 203, 210–223. [Google Scholar] [CrossRef] [Green Version]
  31. Karimi, H.; Sadeghi-Dastaki, M.; Javan, M. A fully fuzzy best–worst multi attribute decision making method with triangular fuzzy number: A case study of maintenance assessment in the hospitals. Appl. Soft Comput. 2020, 86, 105882. [Google Scholar] [CrossRef]
  32. Allahviranloo, T.; Lotfi, F.H.; Kiasary, M.K.; Kiani, N.A.; Alizadeh, L. Solving fully fuzzy linear programming problem by the ranking function. Appl. Math. Sci. 2008, 2, 19–32. [Google Scholar]
  33. Kurniawan, V.R.B.; Puspitasari, F.H. A Fuzzy BWM Method for Evaluating Supplier Selection Factors in a SME Paper Manufacturer. In IOP Conference Series: Materials Science and Engineering, Proceedings of the International Conference on Advanced Science and Technology (ICAST 2020), Jakarta, Indonesia, 28 November 2020; IOP Publishing: Bristol, UK, 2021; Volume 1071, p. 012004. [Google Scholar] [CrossRef]
  34. Ecer, F.; Pamucar, D. Sustainable supplier selection: A novel integrated fuzzy best worst method (F-BWM) and fuzzy CoCoSo with Bonferroni (CoCoSo’B) multi-criteria model. J. Clean. Prod. 2020, 266, 121981. [Google Scholar] [CrossRef]
  35. Gul, M.; Ak, M.F. Assessment of occupational risks from human health and environmental perspectives: A new integrated approach and its application using fuzzy BWM and fuzzy MAIRCA. Stoch. Environ. Res. Risk Assess. 2020, 34, 1231–1262. [Google Scholar] [CrossRef]
  36. Guo, S.; Qi, Z. A Fuzzy Best-Worst Multi-Criteria Group Decision-Making Method. IEEE Access 2021, 9, 118941–118952. [Google Scholar] [CrossRef]
  37. Liang, F.; Brunelli, M.; Rezaei, J. Consistency issues in the best worst method: Measurements and thresholds. Omega 2020, 96, 102175. [Google Scholar] [CrossRef]
  38. Moslem, S.; Gul, M.; Farooq, D.; Celik, E.; Ghorbanzadeh, O.; Blaschke, T. An integrated approach of best-worst method (bwm) and triangular fuzzy sets for evaluating driver behavior factors related to road safety. Mathematics 2020, 8, 414. [Google Scholar] [CrossRef] [Green Version]
  39. Roy, P.K.; Shaw, K. Developing a multi-criteria sustainable credit score system using fuzzy BWM and fuzzy TOPSIS. Environ. Dev. Sustain. 2022, 24, 5368–5399. [Google Scholar] [CrossRef]
  40. Dong, J.; Wan, S.; Chen, S.M. Fuzzy best-worst method based on triangular fuzzy numbers for multi-criteria decision-making. Inf. Sci. 2021, 547, 1080–1104. [Google Scholar] [CrossRef]
  41. Soner, O.; Celik, E.; Akyuz, E. A fuzzy best–worst method (BWM) to assess the potential environmental impacts of the process of ship recycling. Marit. Policy Manag. 2022, 49, 396–409. [Google Scholar] [CrossRef]
  42. Liang, X.; Chen, T.; Ye, M.; Lin, H.; Li, Z. A hybrid fuzzy BWM-VIKOR MCDM to evaluate the service level of bike-sharing companies: A case study from Chengdu, China. J. Clean. Prod. 2021, 298, 126759. [Google Scholar] [CrossRef]
  43. Sagnak, M.; Berberoglu, Y.; Memis, İ.; Yazgan, O. Sustainable collection center location selection in emerging economy for electronic waste with fuzzy Best-Worst and fuzzy TOPSIS. Waste Manag. 2021, 127, 37–47. [Google Scholar] [CrossRef]
  44. Saaty, T.L. The modern science of multicriteria decision making and its practical applications: The AHP/ANP approach. Oper. Res. 2013, 61, 1101–1118. [Google Scholar] [CrossRef]
  45. Şişman, B. Bulanık MOORA yöntemi kullanılarak yeşil tedarikçi geliştirme programlarının seçimi ve değerlendirilmesi. Yaşar Üniversitesi E-Derg. 2016, 11, 302–315. [Google Scholar] [CrossRef] [Green Version]
  46. Stanujkic, D.; Magdalinovic, N.; Jovanovic, R.; Stojanovic, S. An objective multi-criteria approach to optimization using MOORA method and interval grey numbers. Technol. Econ. Dev. Econ. 2012, 18, 331–363. [Google Scholar] [CrossRef] [Green Version]
  47. Karabašević, D.; Stanujkić, D.; Urošević, S. The MCDM Model for Personnel Selection Based on SWARA and ARAS Methods. Management 2015, 20, 43–52. [Google Scholar]
  48. Brauers, W.K.; Zavadskas, E.K. Robustness of the multi-objective MOORA method with a test for the facilities sector. Technol. Econ. Dev. Econ. 2009, 15, 352–375. [Google Scholar] [CrossRef]
  49. Karande, P.; Chakraborty, S. Application of multi-objective optimization on the basis of ratio analysis (MOORA) method for materials selection. Mater. Des. 2012, 37, 317–324. [Google Scholar] [CrossRef]
  50. Park, J.H.; Lim, K.M.; Park, J.S.; Kwun, Y.C. Distances between interval-valued intuitionistic fuzzy sets. J. Phys. Conf. Ser. 2008, 96, 012089. [Google Scholar] [CrossRef] [Green Version]
  51. Tzeng, G.H.; Teng, J.Y. Transportation investment project selection with fuzzy multiobjectives. Transp. Plan. Technol. 1993, 17, 91–112. [Google Scholar] [CrossRef]
  52. Durmić, E.; Stević, Ž.; Chatterjee, P.; Vasiljević, M.; Tomašević, M. Sustainable supplier selection using combined FUCOM–Rough SAW model. Rep. Mech. Eng. 2020, 1, 34–43. [Google Scholar] [CrossRef]
  53. Zimmermann, H.J. Fuzzy set theory. Wiley Interdiscip. Rev. Comput. Stat. 2010, 2, 317–332. [Google Scholar] [CrossRef]
  54. Liu, H.C.; Fan, X.J.; Li, P.; Chen, Y.Z. Evaluating the risk of failure modes with extended MULTIMOORA method under fuzzy environment. Eng. Appl. Artif. Intell. 2014, 34, 168–177. [Google Scholar] [CrossRef]
Figure 1. The proposed model for business excellence evaluation.
Axioms 11 00704 g001
Table 1. Comparison of MOORA with MADM techniques [15].
MADMComputational TimeSimplicityMathematical ComputationalStabilityInformation Type
MOORAVery lessVery simpleminimumgoodquantitative
TOPSISVery highVery criticalmaximumpoormixed
AHPmoderateModerate criticalmoderatemediumquantitative
VIKORlesssimplemoderatemediumquantitative
ELECTREhighModerate criticalmoderatemediummixed
PROMETHEEhighModerate criticalmoderatemediummixed
Table 2. Comparative analyses the proposed FBWM.
AuthorsNumber, Type and Domains of Linguistic TermsGroup Decision-Making/Aggregation MethodCriteria Weights/Aggregated Criteria WeightsConsistency CheckApplication Domain
[28]6/TFNs/
[1–9]
-The proposed procedure for solving FLP [28]/TFNs Procedure based on self-reliance coefficient and possibility levelIllustrative example
[29]5/TFNs/
[1–4.5]
-Procedure proposed by [28]/TFNs Fuzzy Consistency Index [29]Illustrative example
[30]5/TFNs/
[1–4.5]
-Procedure proposed by [28]/TFNs Fuzzy Consistency Index [29]Weighing sub-indicators for finding power plant prob-lems
[31]6/TFNs/
[1–9]
-method to fully solve FLP with TFNs [32]Conventional BWM [26]Maintenance assessment in the hospitals
[33]5/TFNs/
[1–4.5]
-Procedure proposed by [28]/TFNs Fuzzy Consistency Index [29]Supplier selection
[34]5/TFNs/
[1–4.5]
Yes/-Procedure proposed by [28]/TFNs Fuzzy Consistency Index [29]Determination criteria weights for sustainable supplier selection problems
[35]5/TFNs/
[1–4.5]
-Procedure proposed by [28]Fuzzy Consistency Index [29]Determine the importance and weight of Fine–Kinney parameters prior to be used in ranking hazards
[36]5,7,9/TFNs/
[1–9]
Yes/-Procedure proposed by the [28]/mean method, the max-min method, and the method based on consensus degreeFuzzy Consistency Index [37]Illustrative example
[38]5/TFNs/
[1–4.5]
-Procedure proposed by [28]/TFNsFuzzy Consistency Index [29]Evaluating Driver Behavior Factors Related to Road Safety
[39]5/TFNs/
[1–4.5]
-mixed approach by [40]/TFNs/crispProcedure by [40]Criteria weights for evaluation of a sustainable credit score system
[41]5/TFNs/
[1–4.5]
Yes/-Procedure proposed by [28]/precise numbers by GMIR/
averaging method
Fuzzy Consistency Index [29]Assess the potential environmental impacts of the process of ship recycling
[42]6/TFNs/
[1–5.5]
Yes/-Procedure proposed by [28]/precise numbers by GMIR/
averaging method
Fuzzy Consistency Index [29]Determination of criteria weights in the problem evaluate the service level of bike-sharing enterprises
[43]-/TFNs/
[0–1]
-Procedure proposed by [28]/TFNsFuzzy Consistency Index [29]Determination weights of criteria and sub-criteria in the problem selection of locations in the emerging economy for electronic waste
The proposed model9/TFNs/
[1–9]
Yes/-Procedure proposed by [28]/fuzzy geometric mean/TFNsFuzzy Consistency Index [29]Determination criteria weights for the problem of assessing the quality of the enterprise’s operations
Table 3. Comparative analyses the proposed FMOORA.
AuthorsNumber, Type and Domains of Linguistic TermsGroup Decision Making/
Aggregation Method
The Normalized Fuzzy Decision Matrix ProcedureThe Fuzzy Ratio MethodFuzzy Reference PointFuzzy Multiplicative FormApplication Domain
[16]5/TFNs/
[0.22–1]
+/fuzzy arithmetic meanThe vector normalization procedure [49]Defuzzification by MCOA--Sustainable reverse logistic provider
[17]5/TFNs/
[1–9]
+/fuzzy arithmetic meanThe vector normalization procedure [49]By applying Euclidean distance--Course selection
[18]5/TFNs/
[1–9]
--Defuzzification by MCOA--sustainable supplier selection
[19]5/TFNs/
[1–9]
+/fuzzy arithmetic meanThe vector normalization procedure [49]Defuzzification by MCOA--design and fabrication of an automated
hammering machine
[20]7/TFNs/
[0–10]
-The vector normalization procedure [49]By applying Euclidean distance--Green supplier selection
[9]7/TFNs/
[0–1]
-The vector normalization procedure [49]Defuzzification by MCOADefuzzification by MCOA Defuzzification by center of area Selection of solar power plant location
The proposed model7/TFNs/
[1–9]
---Extended Grzegorzewski’s method [50]-Ranking production enterprises
Table 4. The fuzzy decision matrix.
k = 1 k = 2 k = 3 k = 4 k = 5 k = 6 k = 7
i = 1 V5V5V4V6V5V5V4
i = 2 V5V5V5V5V5V5V6
i = 3 V6V6V4V5V4V6V5
i = 4 V7V6V6V7V7V5V7
i = 5 V5V6V4V5V4V4V5
i = 6 V6V6V6V4V6V4V6
i = 7 V4V4V4V4V3V5V5
i = 8 V5V4V4V5V3V4V7
i = 9 V6V4V4V3V3V5V5
i = 10 V6V7V6V6V7V6V7
i = 11 V7V6V5V5V3V6V7
i = 12 V5V5V5V6V6V4V5
i = 13 V6V5V4V5V3V5V4
i = 14 V6V5V6V6V7V6V7
i = 15 V4V5V4V5V6V6V7
i = 16 V6V4V4V5V5V5V4
i = 17 V6V6V5V5V7V6V7
i = 18 V6V5V4V5V6V6V6
i = 19 V6V5V5V6V5V4V7
i = 20 V6V5V5V6V5V5V6
Table 5. The weighted fuzzy decision matrix and reference points.
k = 1 k = 2 k = 3 k = 4 k = 5 k = 6 k = 7
i = 1 ( 0.22 , 0.28 , 0.51 ) ( 0.27 , 0.42 , 0.76 ) ( 0.46 , 0.88 , 1.72 ) ( 0.90 , 1.57 , 2.97 ) ( 0.28 , 0.49 , 0.93 ) ( 0.33 , 0.63 , 1.19 ) ( 0.53 , 1.16 , 2.48 )
i = 2 ( 0.22 , 0.28 , 0.51 ) ( 0.27 , 0.42 , 0.76 ) ( 0.71 , 1.12 , 1.96 ) ( 0.82 , 1.47 , 2.81 ) ( 0.28 , 0.49 , 0.93 ) ( 0.33 , 0.63 , 1.19 ) ( 0.90 , 1.58 , 2.97 )
i = 3 ( 0.24 , 0.30 , 0.54 ) ( 0.30 , 0.45 , 0.81 ) ( 0.46 , 0.88 , 1.72 ) ( 0.82 , 1.47 , 2.81 ) ( 0.17 , 0.38 , 0.82 ) ( 0.36 , 0.68 , 1.26 ) ( 0.82 , 1.47 , 2.81 )
i = 4 ( 0.30 , 0.36 , 0.54 ) ( 0.30 , 0.45 , 0.81 ) ( 0.78 , 1.20 , 2.07 ) ( 1.12 , 1.89 , 2.97 ) ( 0.37 , 0.63 , 0.99 ) ( 0.33 , 0.63 , 1.19 ) ( 1.13 , 1.89 , 2.97 )
i = 5 ( 0.22 , 0.28 , 0.51 ) ( 0.30 , 0.45 , 0.81 ) ( 0.46 , 0.88 , 1.72 ) ( 0.82 , 1.47 , 2.81 ) ( 0.17 , 0.38 , 0.82 ) ( 0.21 , 0.49 , 1.05 ) ( 0.82 , 1.47 , 2.81 )
i = 6 ( 0.24 , 0.30 , 0.54 ) ( 0.30 , 0.45 , 0.81 ) ( 0.78 , 1.20 , 2.07 ) ( 0.52 , 1.16 , 2.48 ) ( 0.30 , 0.53 , 0.99 ) ( 0.21 , 0.49 , 1.05 ) ( 0.90 , 1.58 , 2.97 )
i = 7 ( 0.14 , 0.22 , 0.45 ) ( 0.17 , 0.33 , 0.67 ) ( 0.46 , 0.88 , 1.72 ) ( 0.52 , 1.16 , 2.48 ) ( 0.12 , 0.28 , 0.61 ) ( 0.33 , 0.63 , 1.19 ) ( 0.82 , 1.47 , 2.81 )
i = 8 ( 0.22 , 0.28 , 0.51 ) ( 0.17 , 0.33 , 0.67 ) ( 0.46 , 0.88 , 1.72 ) ( 0.82 , 1.47 , 2.81 ) ( 0.12 , 0.28 , 0.61 ) ( 0.21 , 0.49 , 1.05 ) ( 1.13 , 1.89 , 2.97 )
i = 9 ( 0.24 , 0.30 , 0.54 ) ( 0.17 , 0.33 , 0.67 ) ( 0.46 , 0.88 , 1.72 ) ( 0.37 , 0.84 , 1.82 ) ( 0.12 , 0.28 , 0.61 ) ( 0.33 , 0.63 , 1.19 ) ( 0.82 , 1.47 , 2.81 )
i = 10 ( 0.24 , 0.30 , 0.54 ) ( 0.37 , 0.54 , 0.81 ) ( 0.78 , 1.20 , 2.07 ) ( 0.90 , 1.57 , 2.97 ) ( 0.37 , 0.63 , 0.99 ) ( 0.36 , 0.68 , 1.26 ) ( 1.13 , 1.89 , 2.97 )
i = 11 ( 0.30 , 0.36 , 0.54 ) ( 0.30 , 0.45 , 0.81 ) ( 0.71 , 1.12 , 1.96 ) ( 0.82 , 1.47 , 2.81 ) ( 0.12 , 0.28 , 0.61 ) ( 0.36 , 0.68 , 1.26 ) ( 1.13 , 1.89 , 2.97 )
i = 12 ( 0.22 , 0.28 , 0.51 ) ( 0.27 , 0.42 , 0.76 ) ( 0.71 , 1.12 , 1.96 ) ( 0.90 , 1.57 , 2.97 ) ( 0.30 , 0.53 , 0.99 ) ( 0.21 , 0.49 , 1.05 ) ( 0.82 , 1.47 , 2.81 )
i = 13 ( 0.24 , 0.30 , 0.54 ) ( 0.27 , 0.42 , 0.76 ) ( 0.46 , 0.88 , 1.72 ) ( 0.82 , 1.47 , 2.81 ) ( 0.12 , 0.28 , 0.61 ) ( 0.33 , 0.63 , 1.19 ) ( 0.53 , 1.16 , 2.48 )
i = 14 ( 0.24 , 0.30 , 0.54 ) ( 0.27 , 0.42 , 0.76 ) ( 0.78 , 1.20 , 2.07 ) ( 0.90 , 1.57 , 2.97 ) ( 0.37 , 0.63 , 0.99 ) ( 0.36 , 0.68 , 1.26 ) ( 1.13 , 1.89 , 2.97 )
i = 15 ( 0.14 , 0.22 , 0.45 ) ( 0.27 , 0.42 , 0.76 ) ( 0.46 , 0.88 , 1.72 ) ( 0.82 , 1.47 , 2.81 ) ( 0.30 , 0.53 , 0.99 ) ( 0.36 , 0.68 , 1.26 ) ( 1.13 , 1.89 , 2.97 )
i = 16 ( 0.24 , 0.30 , 0.54 ) ( 0.17 , 0.33 , 0.67 ) ( 0.46 , 0.88 , 1.72 ) ( 0.82 , 1.47 , 2.81 ) ( 0.28 , 0.49 , 0.93 ) ( 0.33 , 0.63 , 1.19 ) ( 0.53 , 1.16 , 2.48 )
i = 17 ( 0.24 , 0.30 , 0.54 ) ( 0.30 , 0.45 , 0.81 ) ( 0.71 , 1.12 , 1.96 ) ( 0.82 , 1.47 , 2.81 ) ( 0.37 , 0.63 , 0.99 ) ( 0.36 , 0.68 , 1.26 ) ( 1.13 , 1.89 , 2.97 )
i = 18 ( 0.24 , 0.30 , 0.54 ) ( 0.27 , 0.42 , 0.76 ) ( 0.46 , 0.88 , 1.72 ) ( 0.82 , 1.47 , 2.81 ) ( 0.30 , 0.53 , 0.99 ) ( 0.36 , 0.68 , 1.26 ) ( 0.90 , 1.58 , 2.97 )
i = 19 ( 0.24 , 0.30 , 0.54 ) ( 0.30 , 0.45 , 0.81 ) ( 0.71 , 1.12 , 1.96 ) ( 0.90 , 1.57 , 2.97 ) ( 0.28 , 0.49 , 0.93 ) ( 0.21 , 0.49 , 1.05 ) ( 1.13 , 1.89 , 2.97 )
i = 20 ( 0.24 , 0.30 , 0.54 ) ( 0.27 , 0.42 , 0.76 ) ( 0.71 , 1.12 , 1.96 ) ( 0.90 , 1.57 , 2.97 ) ( 0.28 , 0.49 , 0.93 ) ( 0.33 , 0.63 , 1.19 ) ( 0.90 , 1.58 , 2.97 )
f ˜ k ( 0.30 , 0.36 , 0.54 ) ( 0.37 , 0.54 , 0.81 ) ( 0.78 , 1.20 , 2.07 ) ( 1.12 , 1.89 , 2.97 ) ( 0.37 , 0.63 , 0.99 ) ( 0.36 , 0.68 , 1.26 ) ( 1.13 , 1.89 , 2.97 )
Table 6. The rank of enterprises based on the reference point.
k = 1 k = 2 k = 3 k = 4 k = 5 k = 6 k = 7 δ i Rank
i = 1 0.01140.01710.04790.04500.02000.00820.10500.105015–19
i = 2 0.01140.01710.01390.06000.02000.00820.04500.06006–14
i = 3 0.00860.01290.04790.06000.035000.06000.06006–14
i = 4 00.01290000.008200.01291
i = 5 0.01140.01290.04790.04500.03500.02790.06000.06006–14
i = 6 0.00860.012900.10500.01500.02790.04500.105015–19
i = 7 0.02140.03000.04790.10500.05250.00820.06000.105015–19
i = 8 0.01140.03000.04790.06000.05250.027900.06006–14
i = 9 0.00860.03000.04790.15750.05250.00820.06000.157520
i = 10 0.0086000.04500000.04502–5
i = 11 00.01290.01390.06000.0525000.06006–14
i = 12 0.01140.01710.01390.04500.01500.02790.06000.06006–14
i = 13 0.00860.01710.04790.06000.03500.00820.10500.105015–19
i = 14 0.00860.017100.04500000.04502–5
i = 15 0.02140.01710.04790.06000.0150000.06006–14
i = 16 0.00860.03000.04790.06000.02000.00820.10500.105015–19
i = 17 0.00860.01290.01390.06000000.06006–14
i = 18 0.00860.01710.04790.06000.015000.04500.06006–14
i = 19 0.00860.01290.01390.04500.02000.027900.04502–5
i = 20 0.00860.01710.01390.04500.02000.00820.04500.04502–5
Publisher’s Note: MDPI stays neutral with regard to jurisdictional claims in published maps and institutional affiliations.

