
Brain Tumor Classification Using Dense Efficient-Net

 , ,
, ,  ,
,  and
and 
Abstract
:1. Introduction
2. Related Work
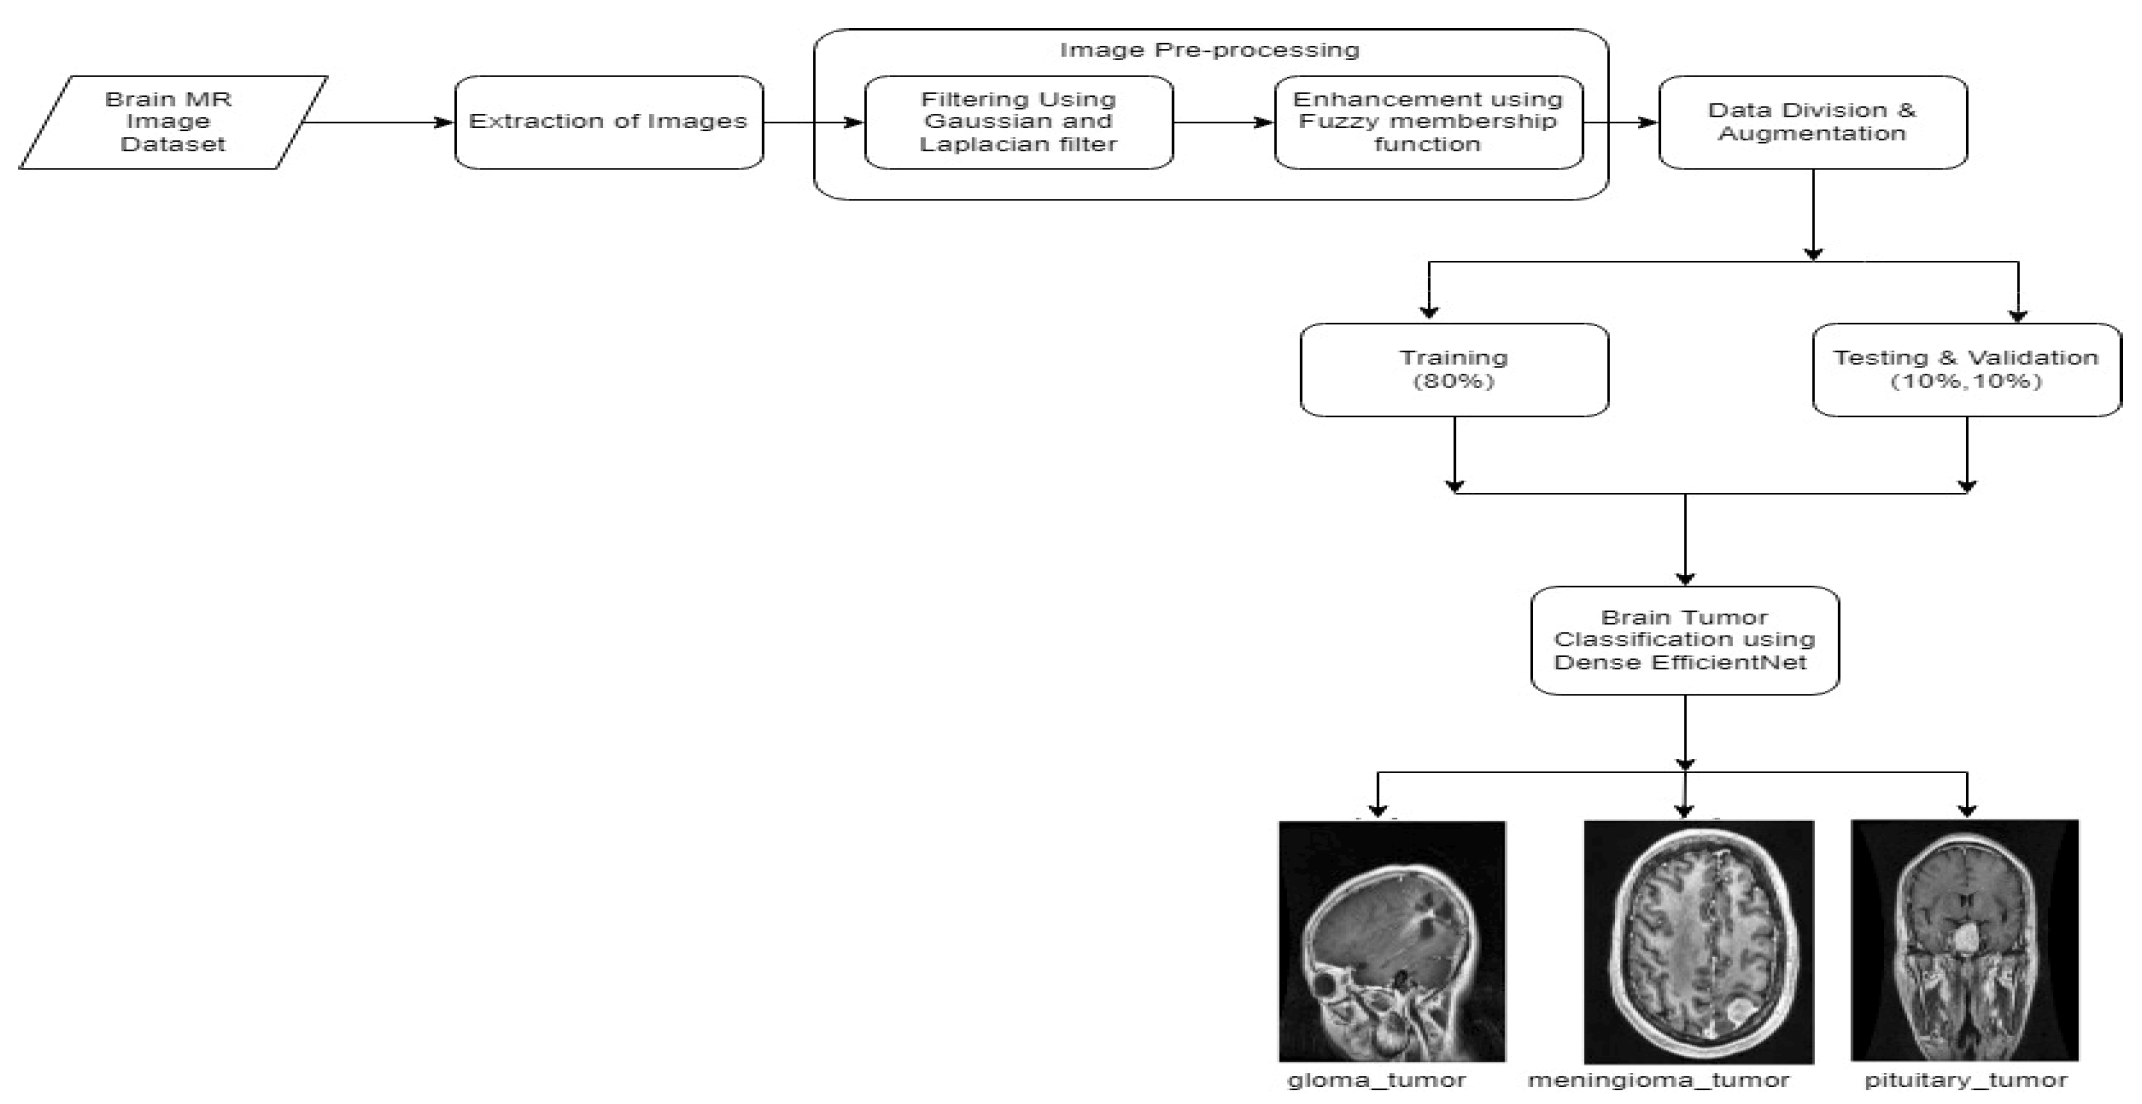
3. Proposed Methodology
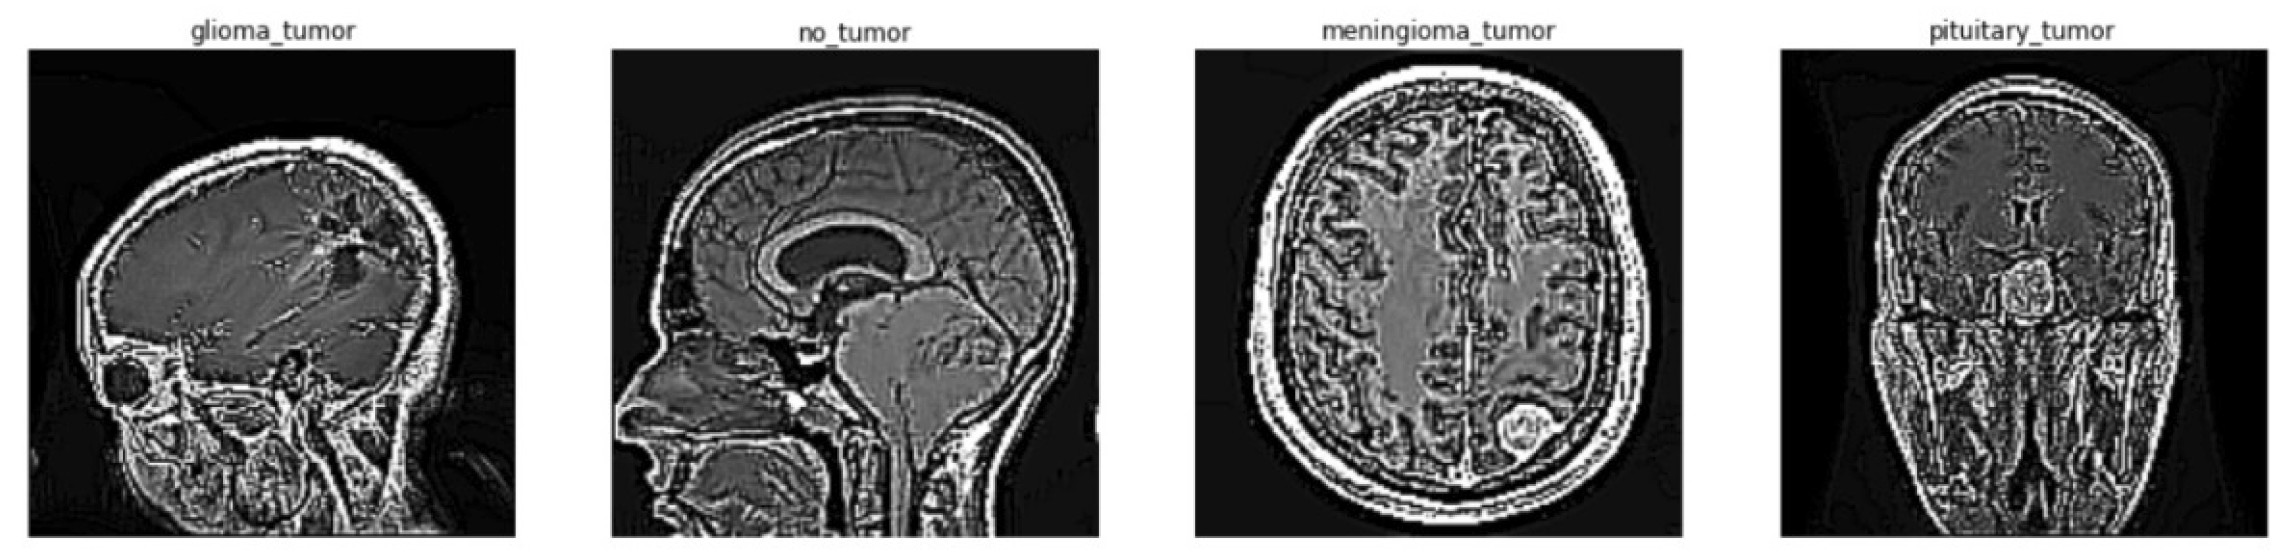
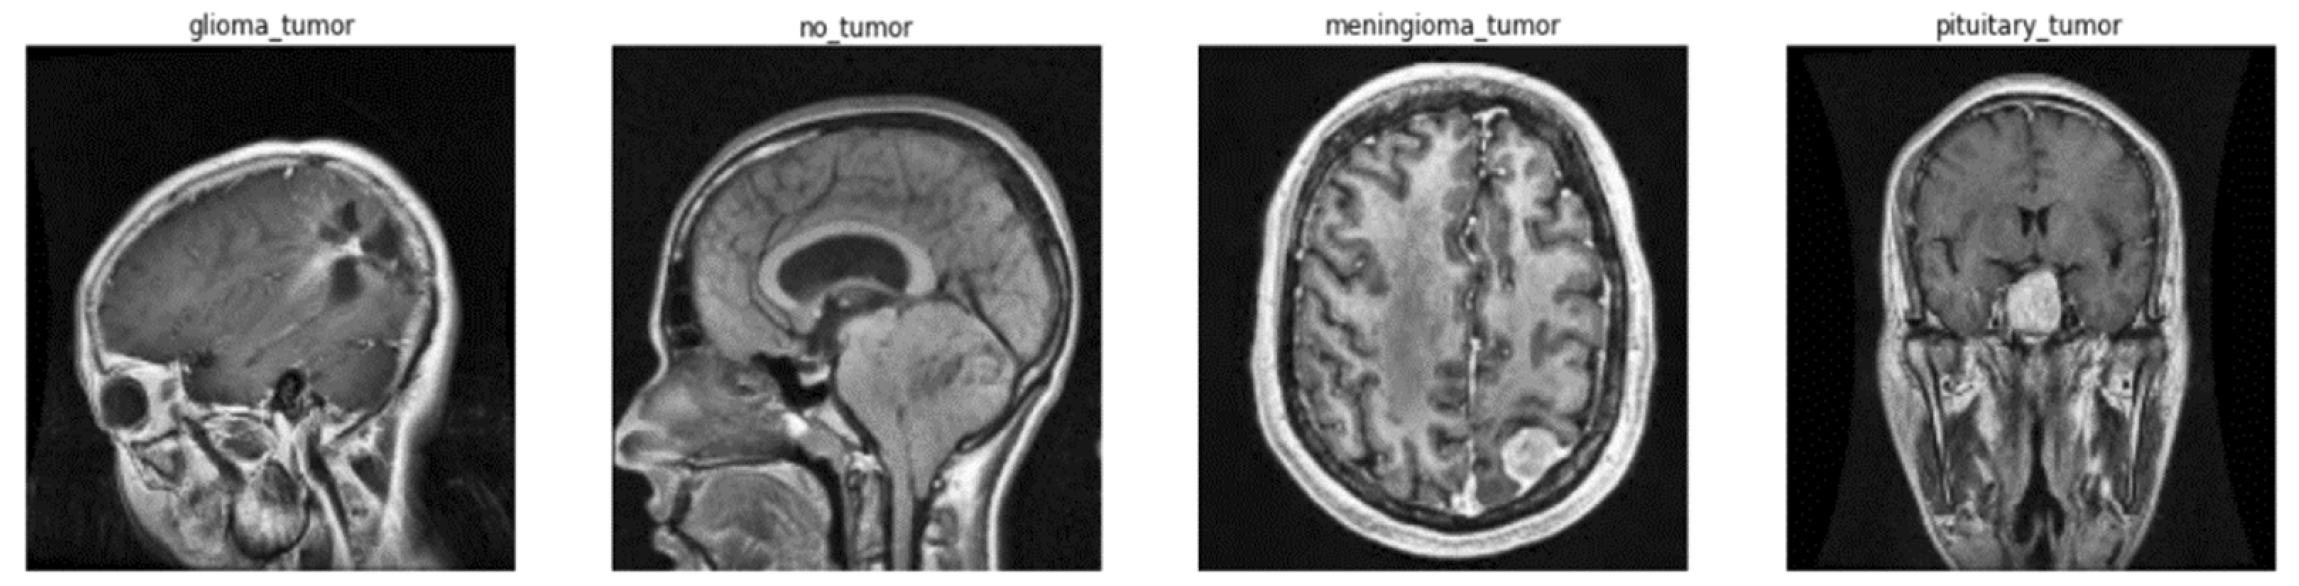
3.1. Image Pre-Processing
3.2. Data Division and Augmentation
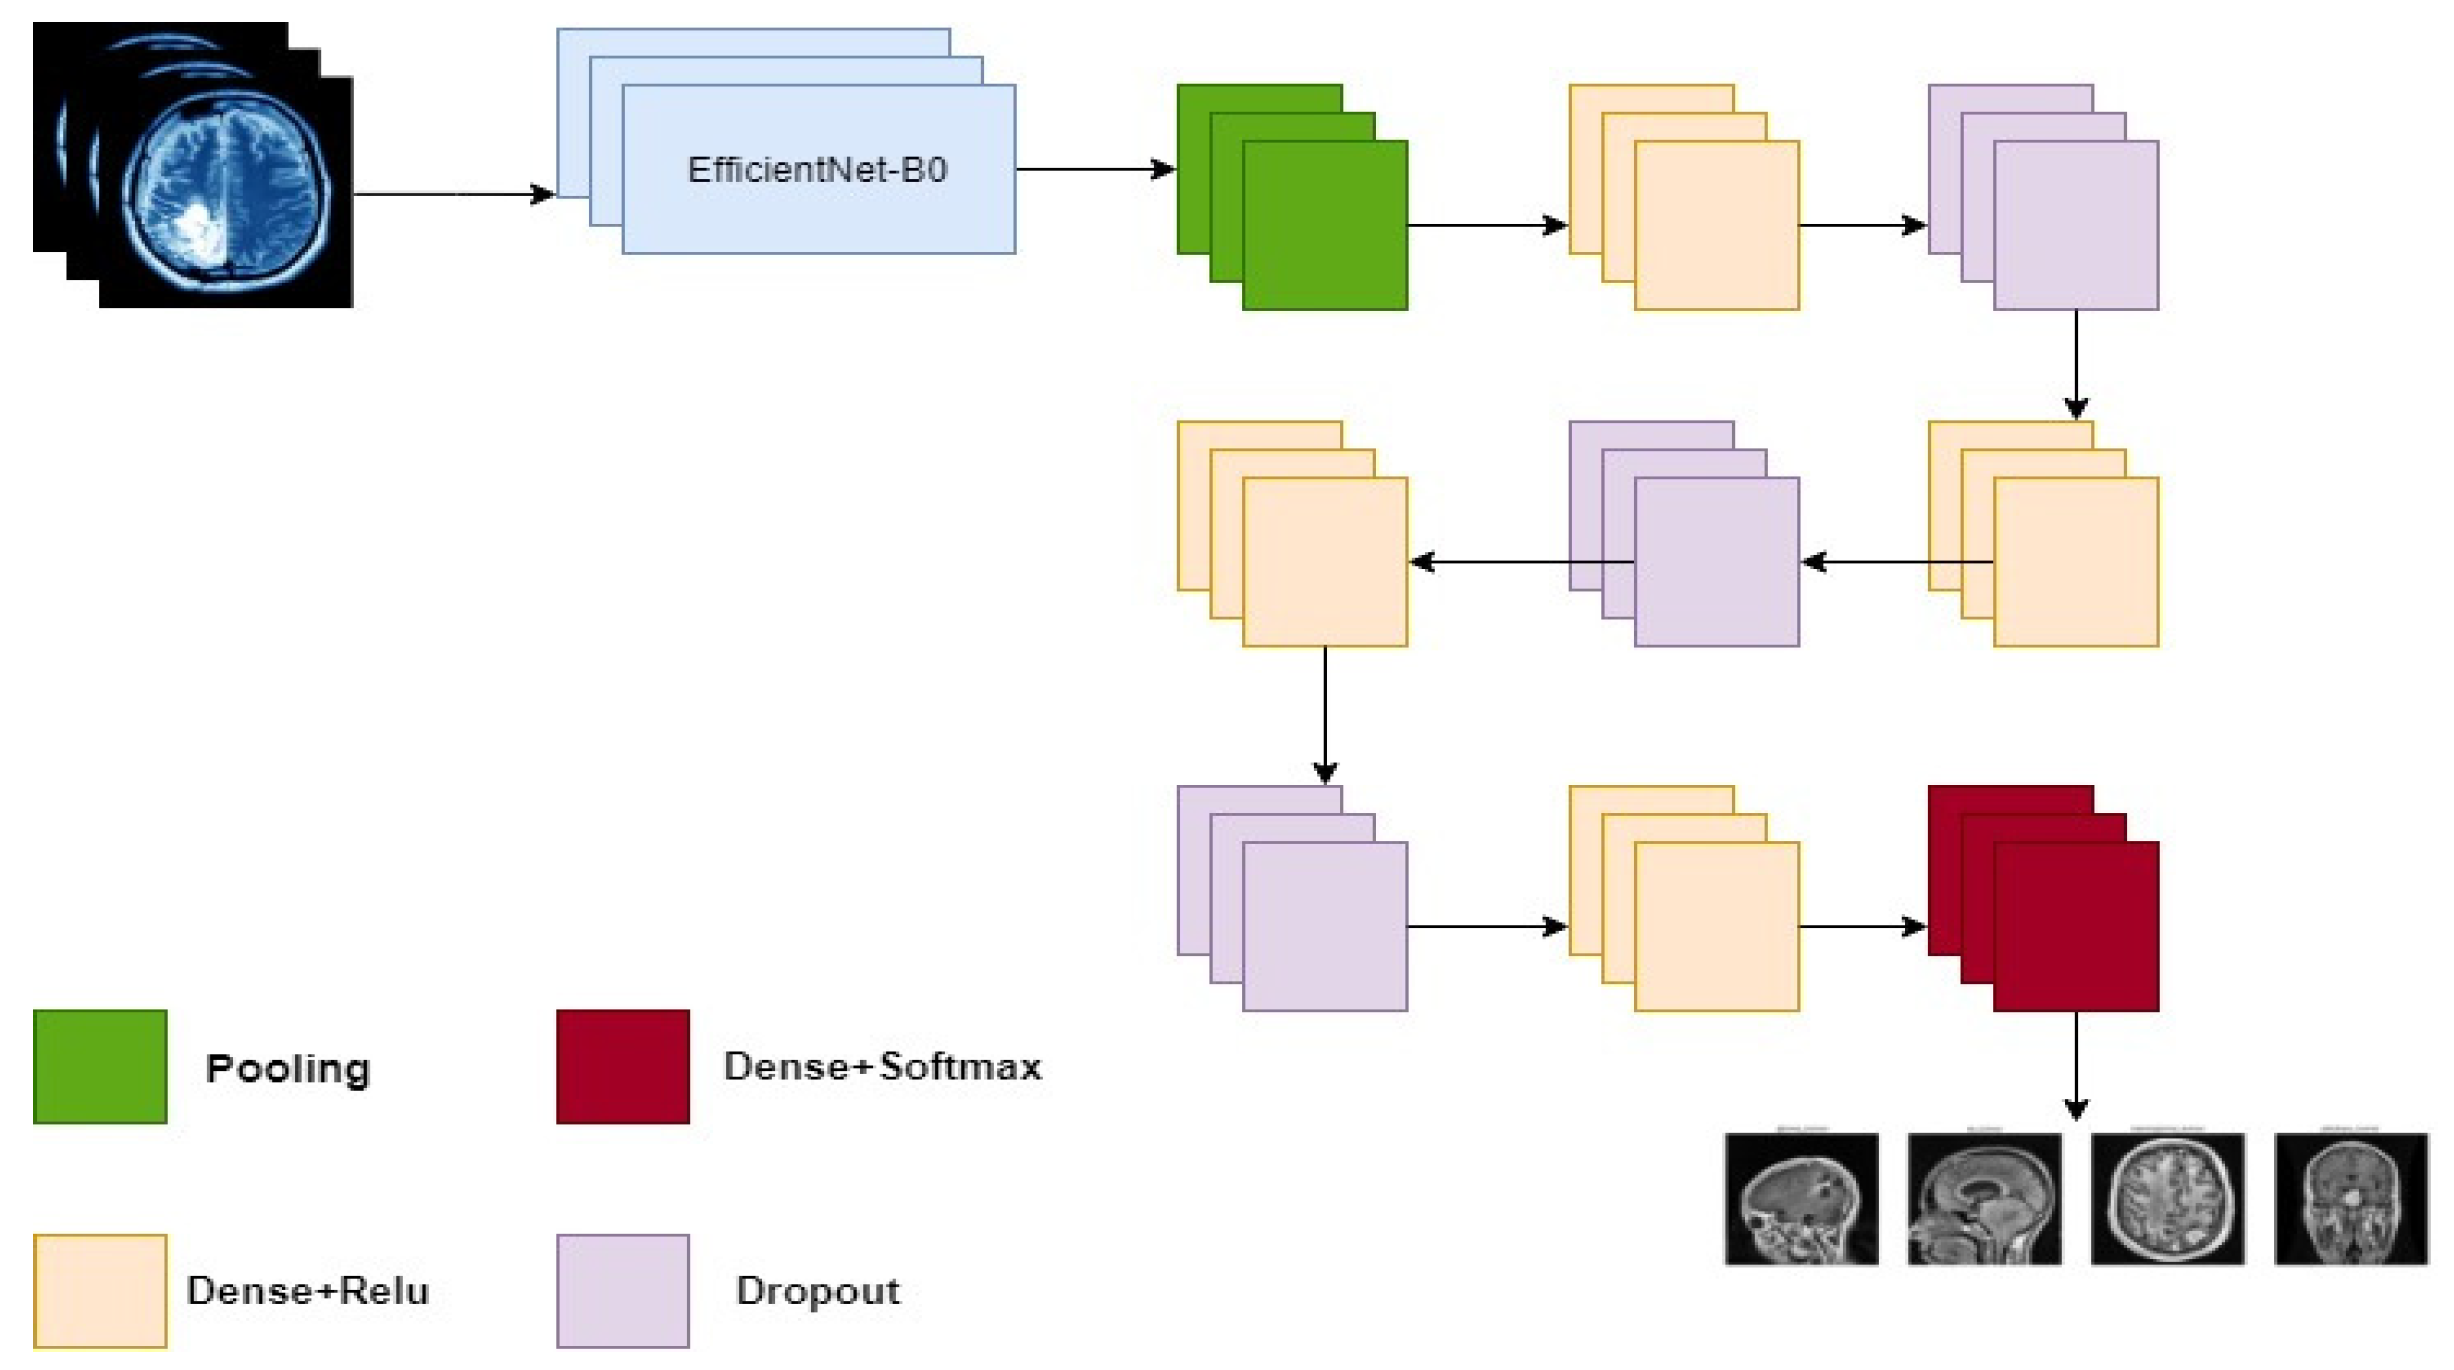
3.3. Dense EfficientNet CNN Model
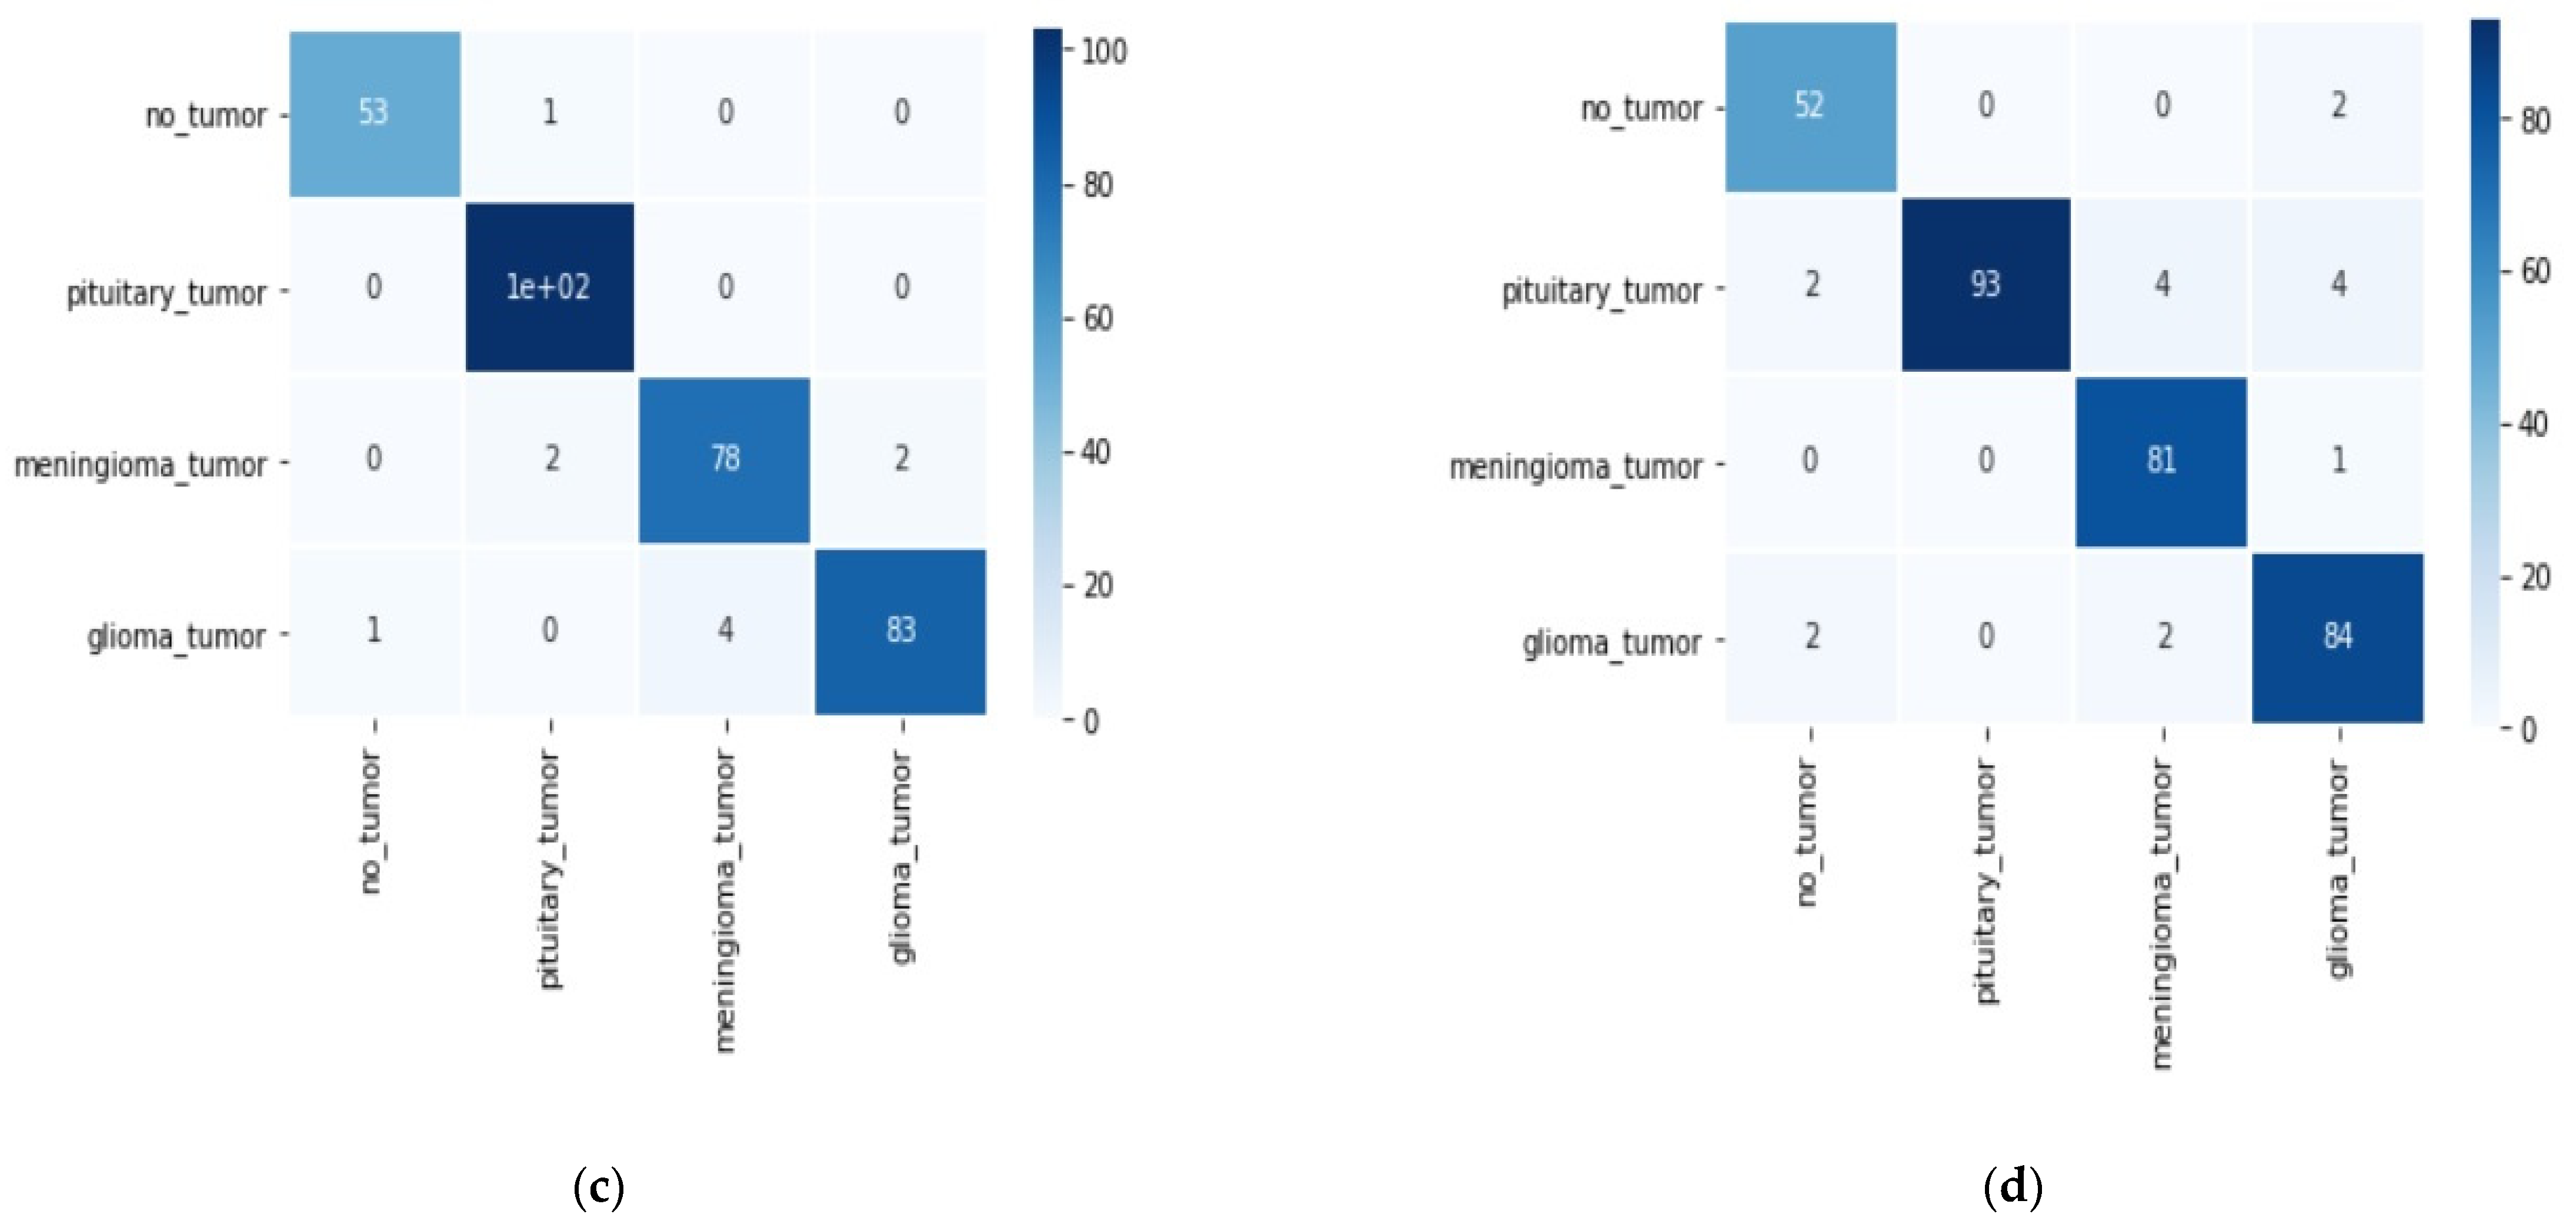
4. Results and Discussion
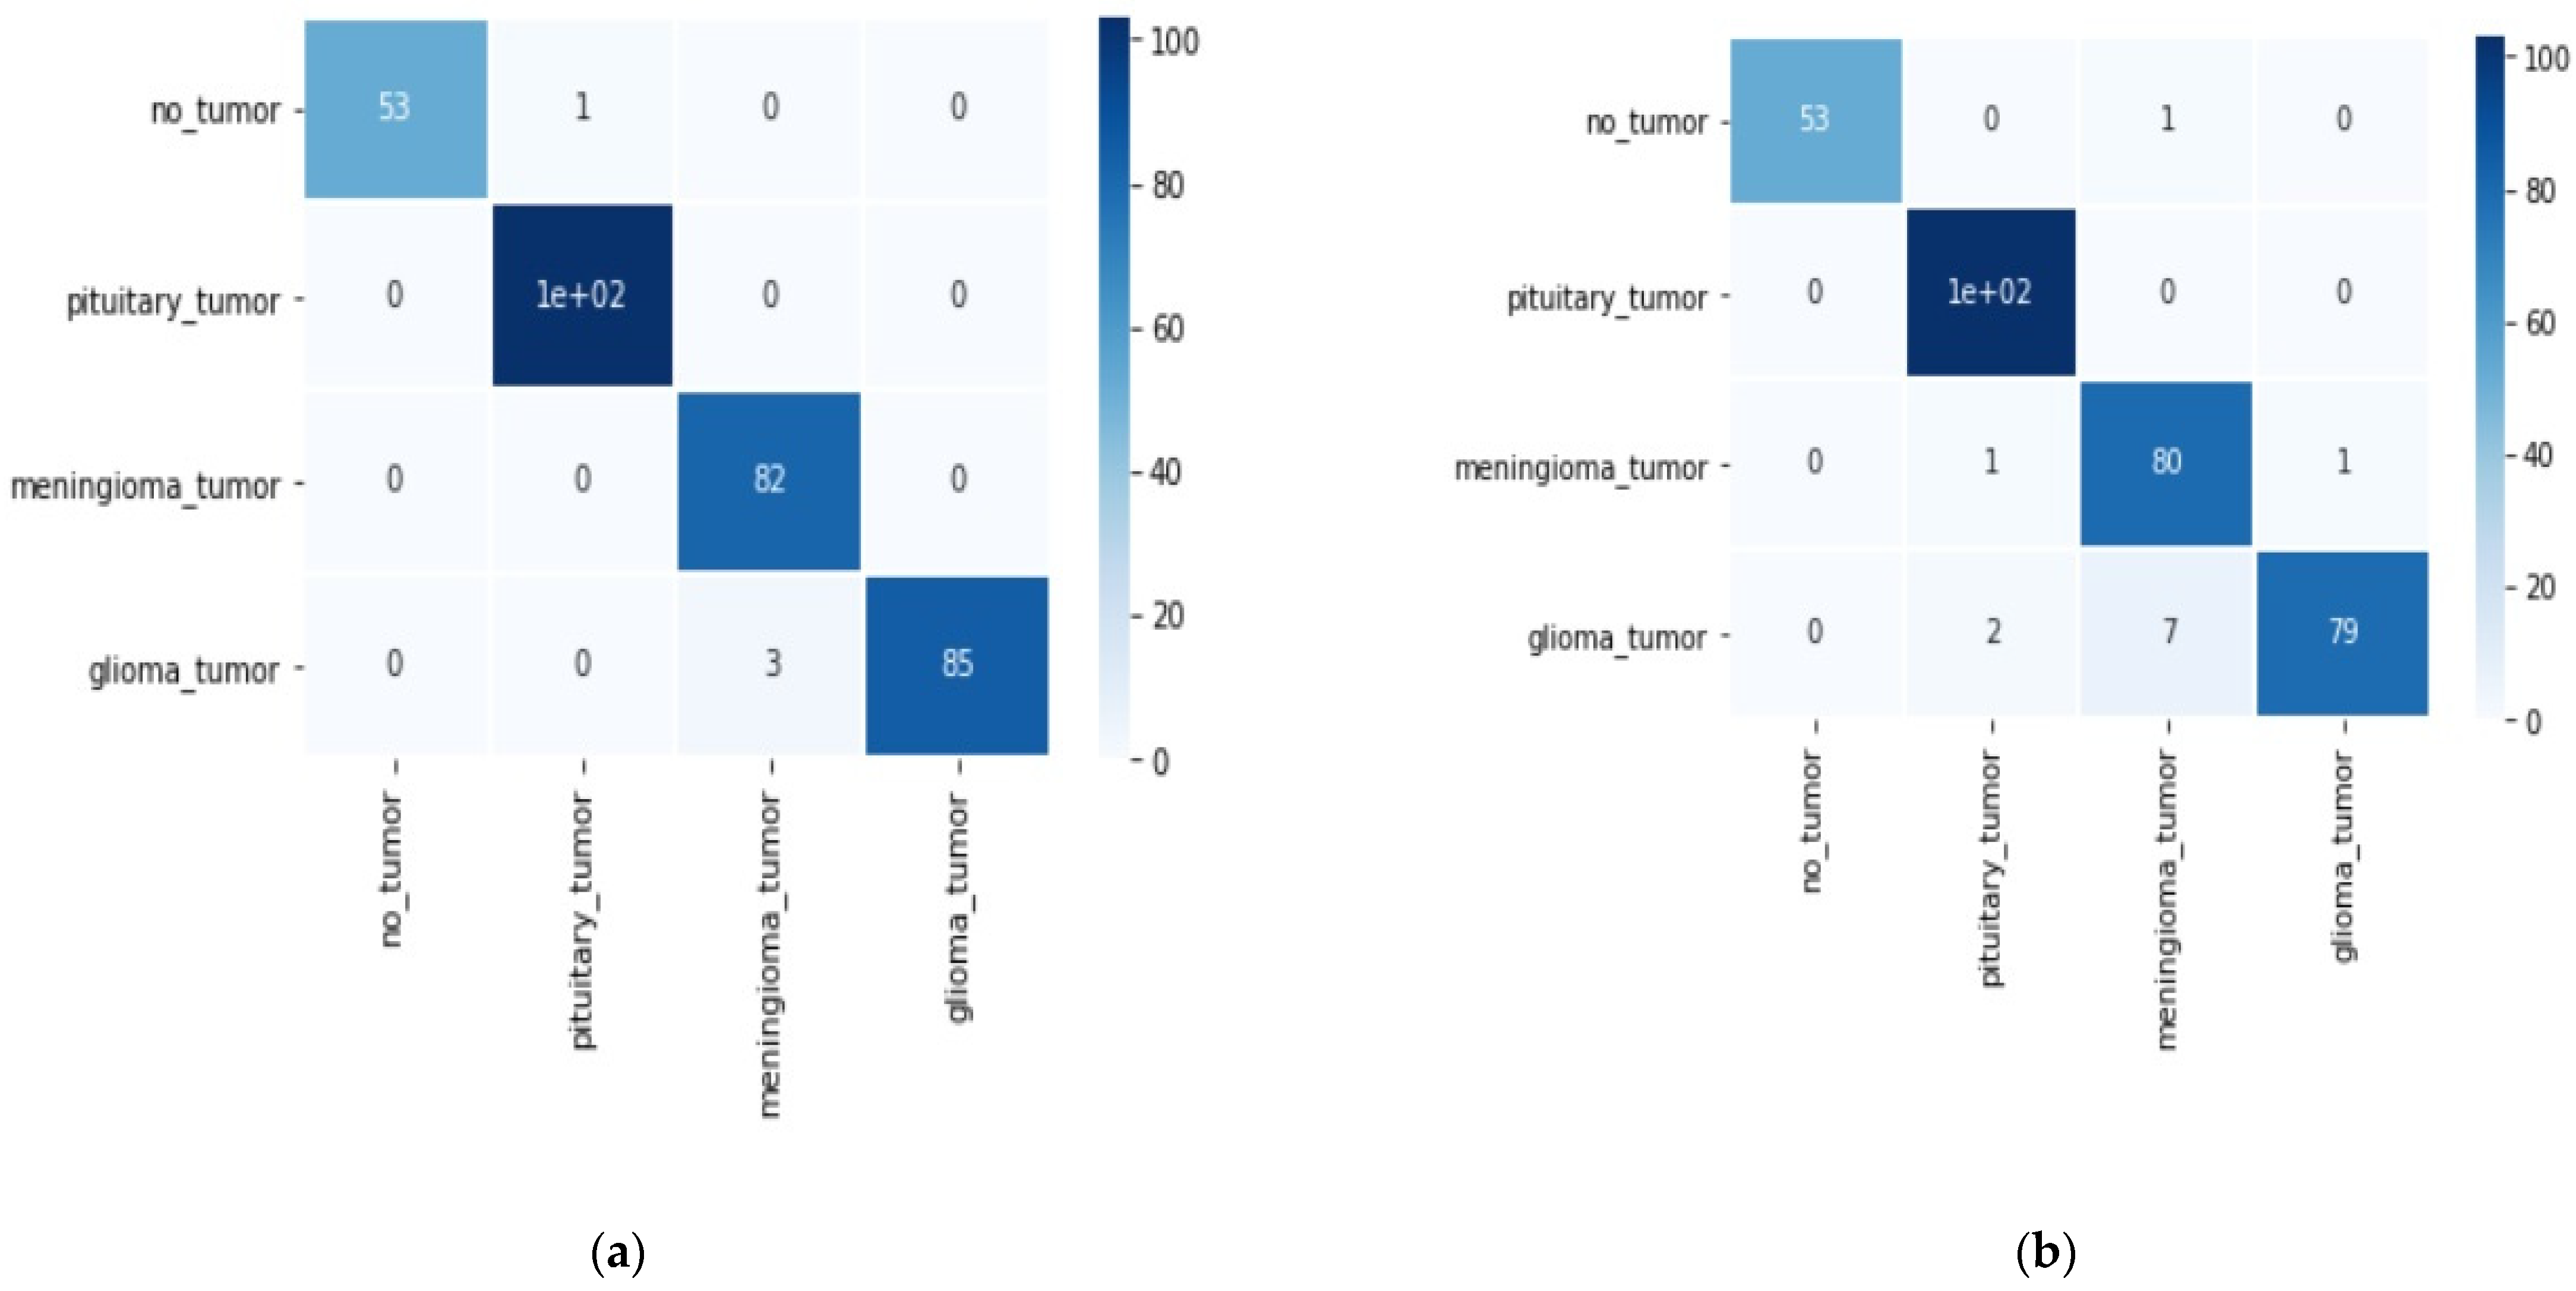
- True positive (TP) = classified as +ve and sample belongs to the tumor;
- True negative (TN) = classified as −ve and sample belongs to healthy;
- False positive (FP) = classified as +ve and sample belongs to healthy;
- False negative (FN) = classified as −ve and sample belongs to a tumor.
5. Conclusions
Author Contributions
Funding
Data Availability Statement
Acknowledgments
Conflicts of Interest
References
- Pradhan, A.; Mishra, D.; Das, K.; Panda, G.; Kumar, S.; Zymbler, M. On the Classification of MR Images Using “ELM-SSA” Coated Hybrid Model. Mathematics 2021, 9, 2095. [Google Scholar] [CrossRef]
- Reddy, A.V.N.; Krishna, C.P.; Mallick, P.K.; Satapathy, S.K.; Tiwari, P.; Zymbler, M.; Kumar, S. Analyzing MRI scans to detect glioblastoma tu-mor using hybrid deep belief networks. J. Big Data 2020, 7, 35. [Google Scholar] [CrossRef]
- Nayak, D.R.; Padhy, N.; Mallick, P.K.; Bagal, D.K.; Kumar, S. Brain Tumour Classification Using Noble Deep Learning Approach with Parametric Optimization through Metaheuristics Approaches. Computers 2022, 11, 10. [Google Scholar] [CrossRef]
- Mansour, R.F.; Escorcia-Gutierrez, J.; Gamarra, M.; Díaz, V.G.; Gupta, D.; Kumar, S. Ar-tificial intelligence with big data analytics-based brain intracranial hemorrhage e-diagnosis us-ing CT images. Neural Comput. Appl. 2021. [Google Scholar] [CrossRef]
- Rehman, A.; Naz, S.; Razzak, M.I.; Akram, F.; Imran, M.A. Deep learning-based framework for automatic brain tumors classification using transfer learning. Circuits Syst. Signal Processing 2020, 39, 757–775. [Google Scholar] [CrossRef]
- Long, J.; Shelhamer, E.; Darrell, T. Fully convolutional networks for semantic segmentation. In Proceedings of the IEEE Conference on Computer Vision and Pattern Recognition, Boston, MA, USA, 7–12 June 2015; pp. 3431–3440. [Google Scholar]
- Ozyurt, F.; Sert, E.; Avci, D. An expert system for brain tumor detection, Fuzzy C-means with super-resolution and convolutional neural network with extreme learning machine. Med. Hypotheses 2020, 134, 109433. [Google Scholar] [CrossRef] [PubMed]
- Hu, M.; Zhong, Y.; Xie, S.; Lv, H.; Lv, Z. Fuzzy System Based Medical Image Processing for Brain Disease Prediction. Front. Neurosci. 2021, 15, 714318. [Google Scholar] [CrossRef] [PubMed]
- Maqsood, S.; Damasevicius, R.; Shah, F.M. An Efficient Approach for the Detection of Brain Tumor Using Fuzzy Logic and U-Net CNN Classification. In Lecture Notes in Computer Science; Springer: Berlin/Heidelberg, Germany, 2021; Volume 12953. [Google Scholar]
- Ragupathy, B.; Karunakaran, M. A fuzzy logic-based meningioma tumor detection in magnetic resonance brain images using CANFIS and U-Net CNN classification. Int. J. Imaging Syst. Technol. 2021, 31, 379–390. [Google Scholar] [CrossRef]
- Cheng, J.; Huang, W.; Cao, S.; Yang, R.; Yang, W.; Yun, Z.; Wang, Z.; Feng, Q. Correction, enhanced performance of brain tumor classification via tumor region augmentation and partition. PLoS ONE 2015, 10, e0144479. [Google Scholar] [CrossRef] [PubMed]
- Badža, M.M.; Barjaktarović, M.Č. Classification of brain tumors from MRI images using a convolutional neural network. Appl. Sci. 2020, 10, 1999. [Google Scholar] [CrossRef] [Green Version]
- Mzoughi, H.; Njeh, I.; Wali, A.; Slima, M.B.; BenHamida, A.; Mhiri, C.; Mahfoudhe, K.B. Deep multi-scale 3D convolutional neural network (CNN) for MRI gliomas brain tumor classification. J. Digit. Imaging 2020, 33, 903–915. [Google Scholar] [CrossRef] [PubMed]
- Hashemzehi, R.; Mahdavi, S.J.S.; Kheirabadi, M.; Kamel, S.R. Detection of brain tumors from MRI images base on deep learning using hybrid model CNN and NADE. Biocybern. Biomed. Eng. 2020, 40, 1225–1232. [Google Scholar] [CrossRef]
- Díaz-Pernas, F.J.; Martínez-Zarzuela, M.; Antón-Rodríguez, M.; González-Ortega, D. A deep learning approach for brain tumor classification and segmentation using a multiscale convolutional neural network. Healthcare 2021, 9, 153. [Google Scholar] [CrossRef] [PubMed]
- Sultan, H.H.; Salem, N.M.; Al-Atabany, W. Multi-classification of brain tumor images using deep neural network. IEEE Access 2019, 7, 69215–69225. [Google Scholar] [CrossRef]
- Abd El Kader, I.; Xu, G.; Shuai, Z.; Saminu, S.; Javaid, I.; Salim Ahmad, I. Differential deep convolutional neural network model for brain tumor classification. Brain Sci. 2021, 11, 352. [Google Scholar] [CrossRef] [PubMed]
- Sajja, V.R. Classification of Brain tumors using Fuzzy C-means and VGG16. Turk. J. Comput. Math. Educ. (TURCOMAT) 2021, 12, 2103–2113. [Google Scholar]
- Das, S.; Aranya, O.R.; Labiba, N.N. Brain tumor classification using a convolutional neural network. In Proceedings of the 2019 1st International Conference on Advances in Science, Engineering and Robotics Technology (ICASERT), Dhaka, Bangladesh, 3 May 2019; IEEE: New York, NY, USA, 2019; pp. 1–5. [Google Scholar]
- Cheng, J. Brain tumor dataset. Figshare. Dataset. 2017, 1512427/5. Available online: https://figshare.com/articles/dataset/brain_tumor_dataset/1512427 (accessed on 12 October 2021).
- Nayak, D.R.; Padhy, N.; Swain, B.K. Brain Tumor Detection and Extraction using Type-2 Fuzzy with Morphology. Int. J. Emerg. Technol. 2020, 11, 840–844. [Google Scholar]
- Tan, M.; Le, Q.V. EfficientNet, Rethinking Model Scaling for Convolutional Neural Networks. arXiv 2019, arXiv:1905.11946. [Google Scholar]
- Available online: https://towardsdatascience.com/complete-architectural-details-of-all-efficientnet-models-5fd5b736142 (accessed on 16 October 2021).


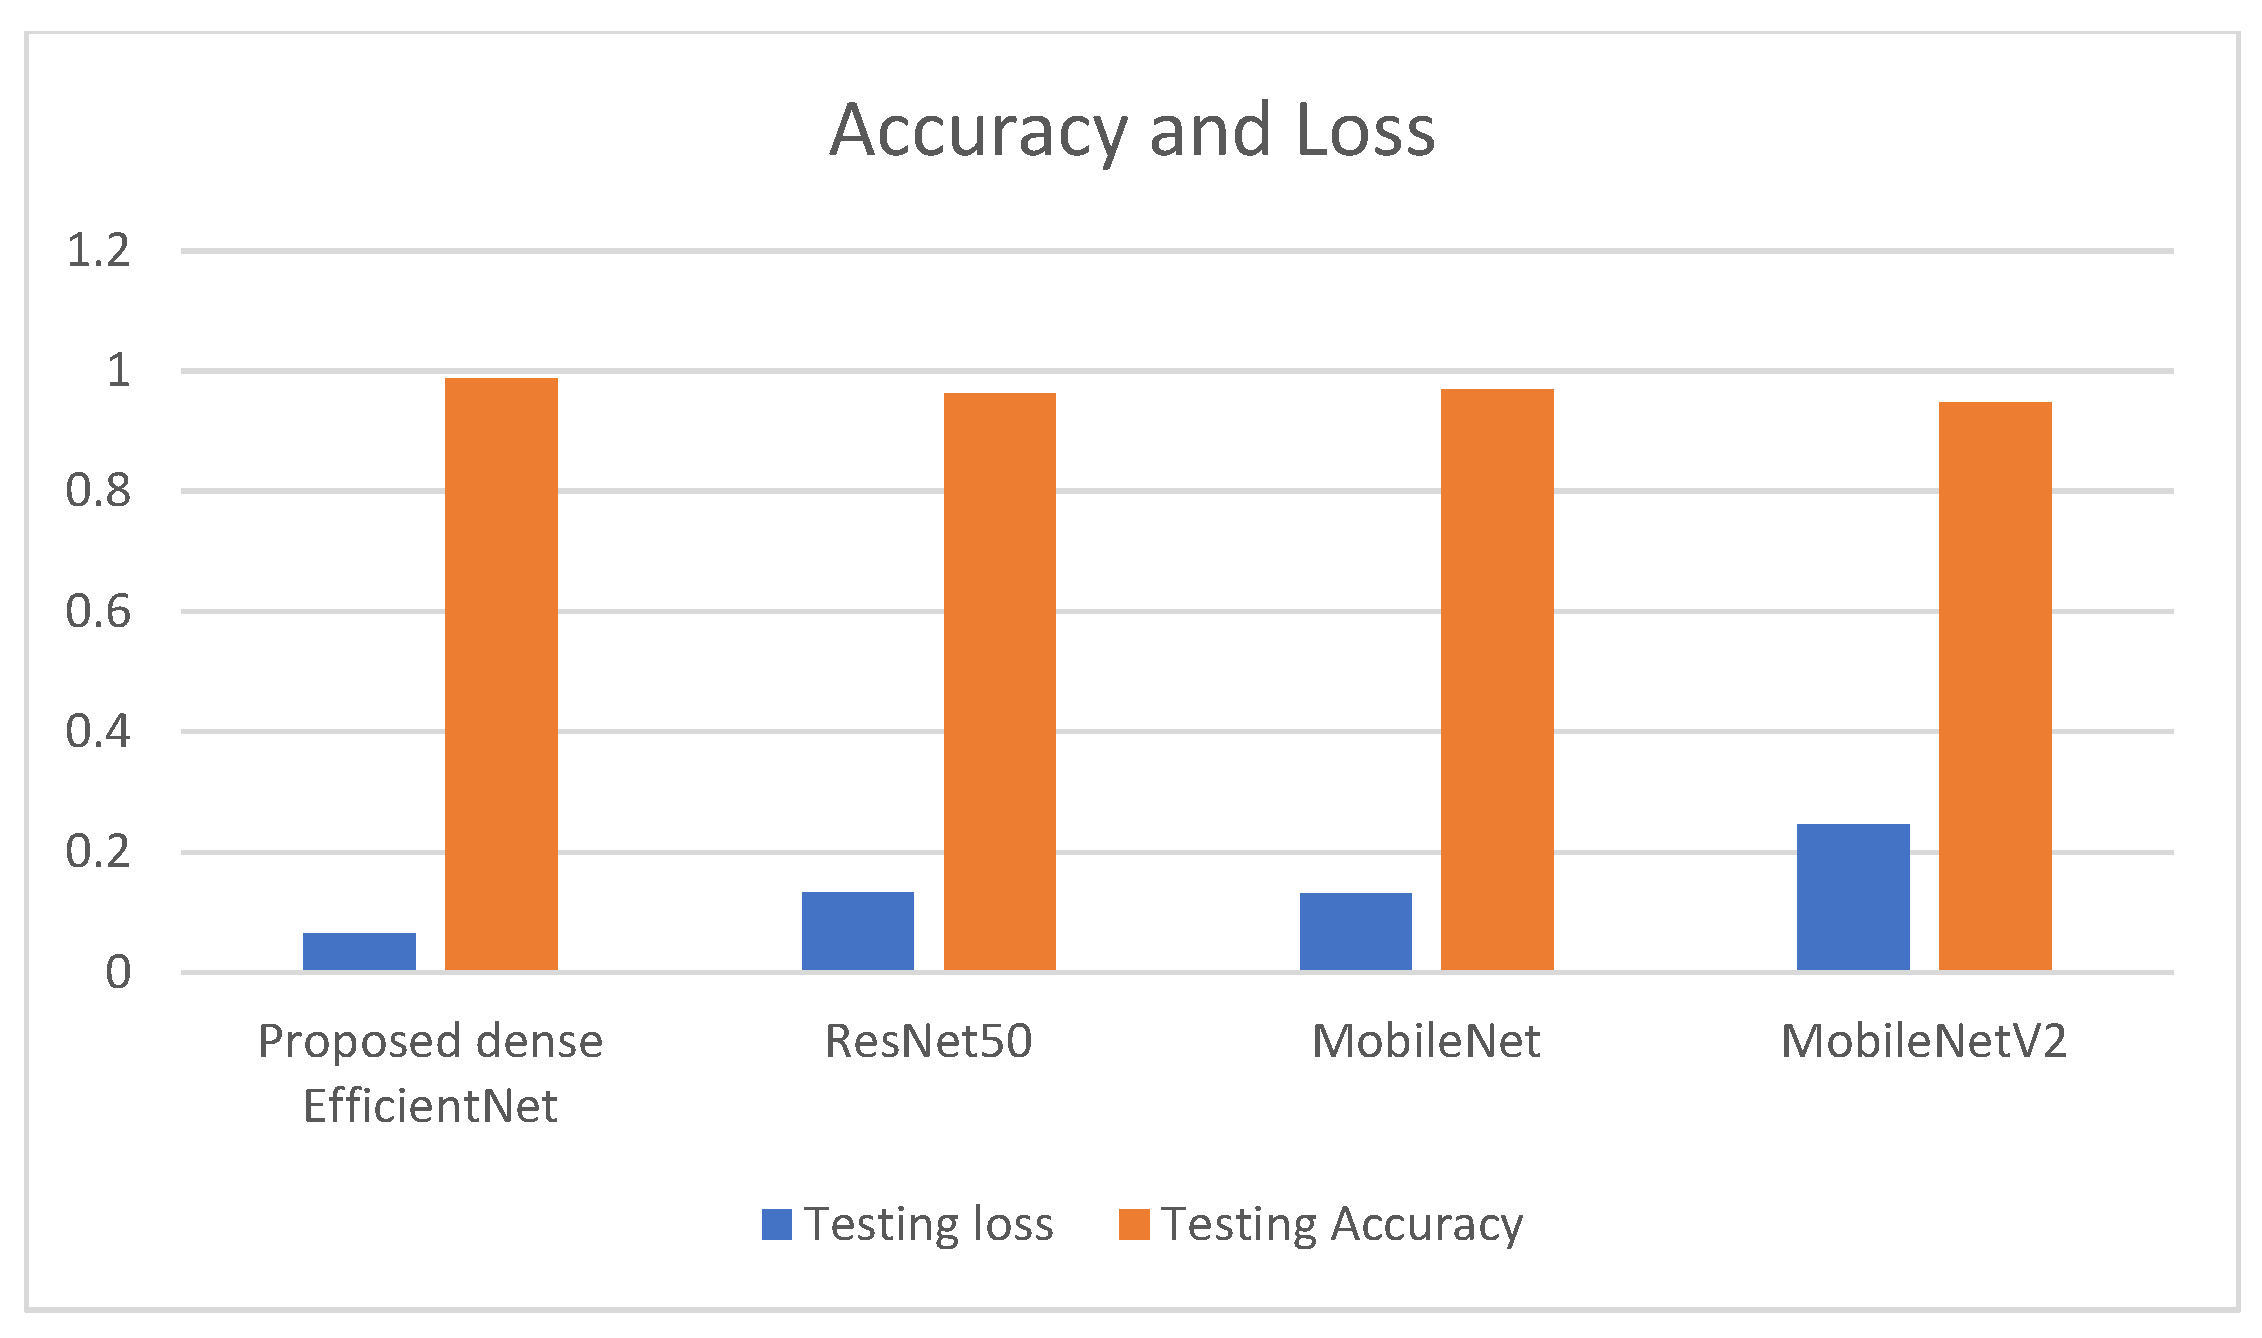
| Model | Dataset | Testing Loss | Testing Accuracy |
|---|---|---|---|
| Proposed dense EfficientNet | T1 contrast brain tumors | 0.0645 | 98.78% |
| ResNet50 | T1 contrast brain tumors | 0.1337 | 96.33% |
| MobileNet | T1 contrast brain tumors | 0.1339 | 96.94% |
| MobileNetV2 | T1 contrast brain tumors | 0.2452 | 94.80% |
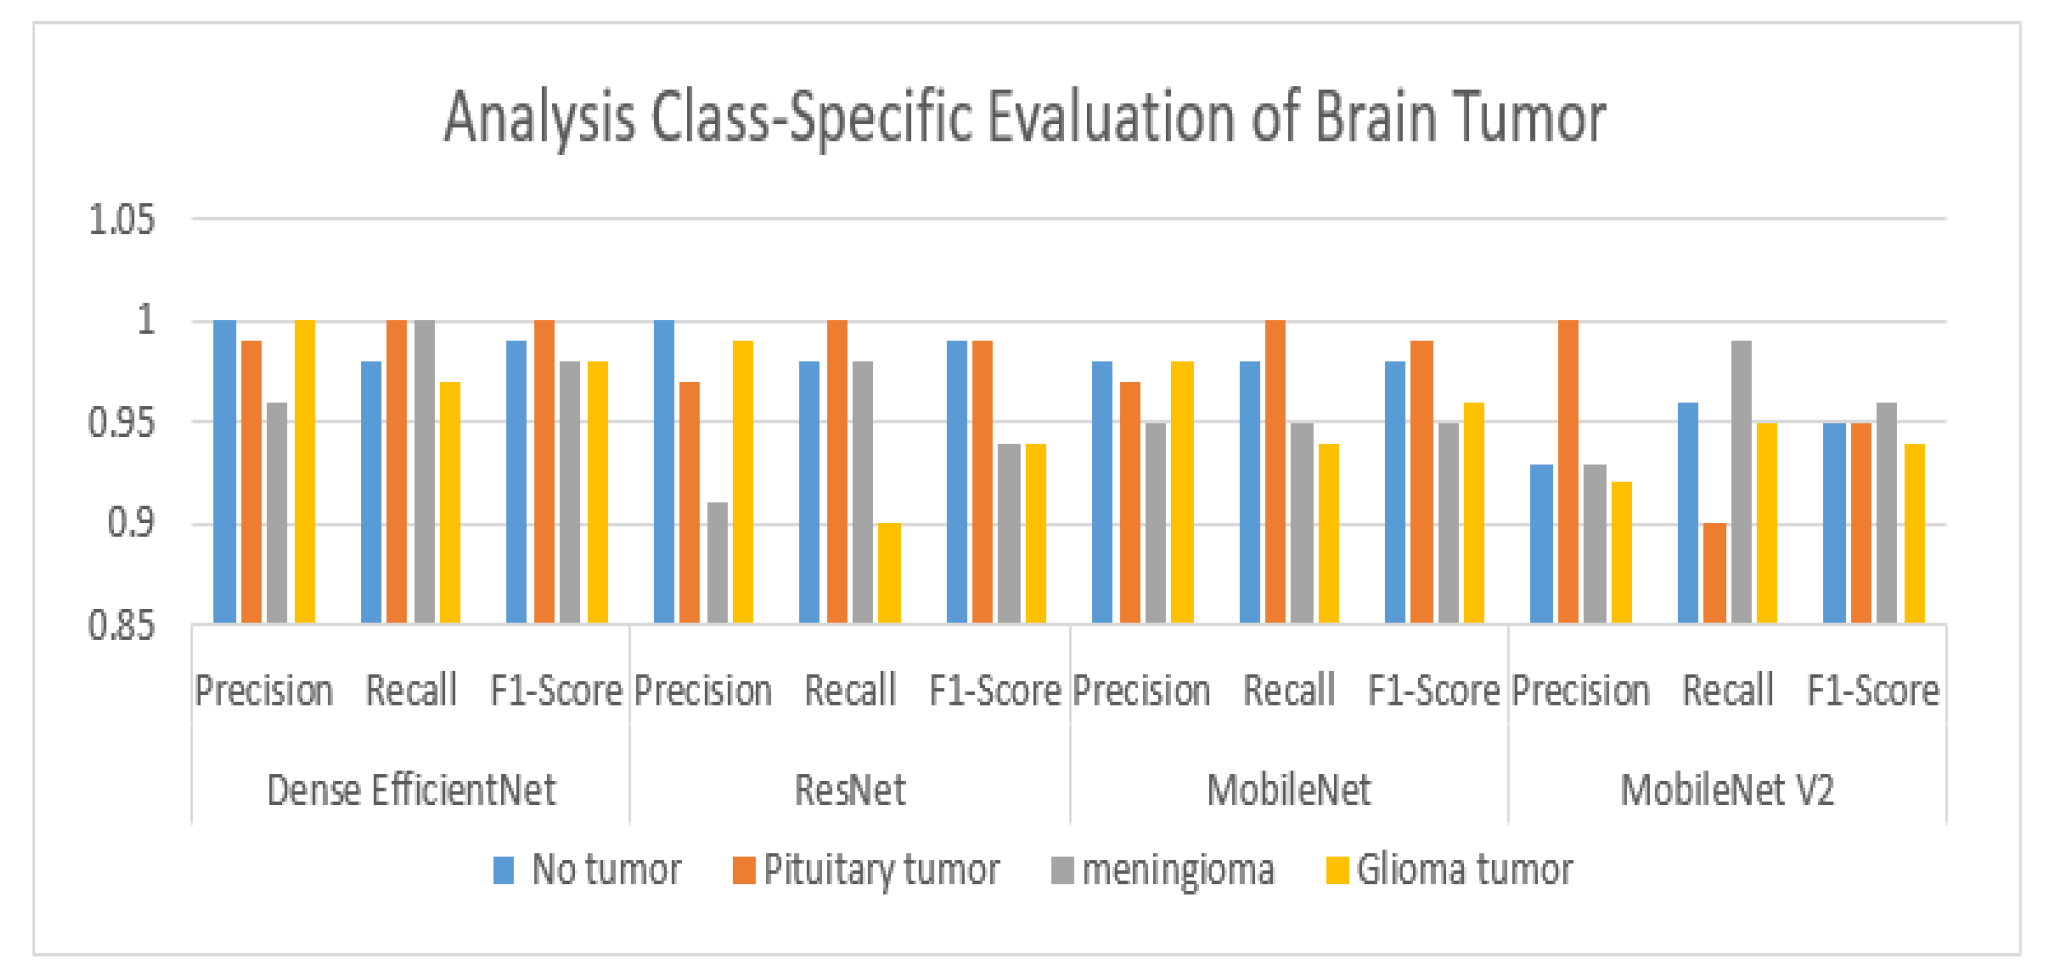
| Types of CNN | Dense EfficientNet | ResNet50 | MobileNet | MobileNetV2 | ||||||||
|---|---|---|---|---|---|---|---|---|---|---|---|---|
| Different types of tumors | Precision | Recall | F1-Score | Precision | Recall | F1-Score | Precision | Recall | F1-Score | Precision | Recall | F1-Score |
| No tumor | 1 | 0.98 | 0.99 | 1 | 0.98 | 0.99 | 0.98 | 0.98 | 0.98 | 0.93 | 0.96 | 0.95 |
| Pituitary tumor | 0.99 | 1 | 1 | 0.97 | 1 | 0.99 | 0.97 | 1 | 0.99 | 1 | 0.9 | 0.95 |
| Meningioma | 0.96 | 1 | 0.98 | 0.91 | 0.98 | 0.94 | 0.95 | 0.95 | 0.95 | 0.93 | 0.99 | 0.96 |
| Glioma tumor | 1 | 0.97 | 0.98 | 0.99 | 0.9 | 0.94 | 0.98 | 0.94 | 0.96 | 0.92 | 0.95 | 0.94 |
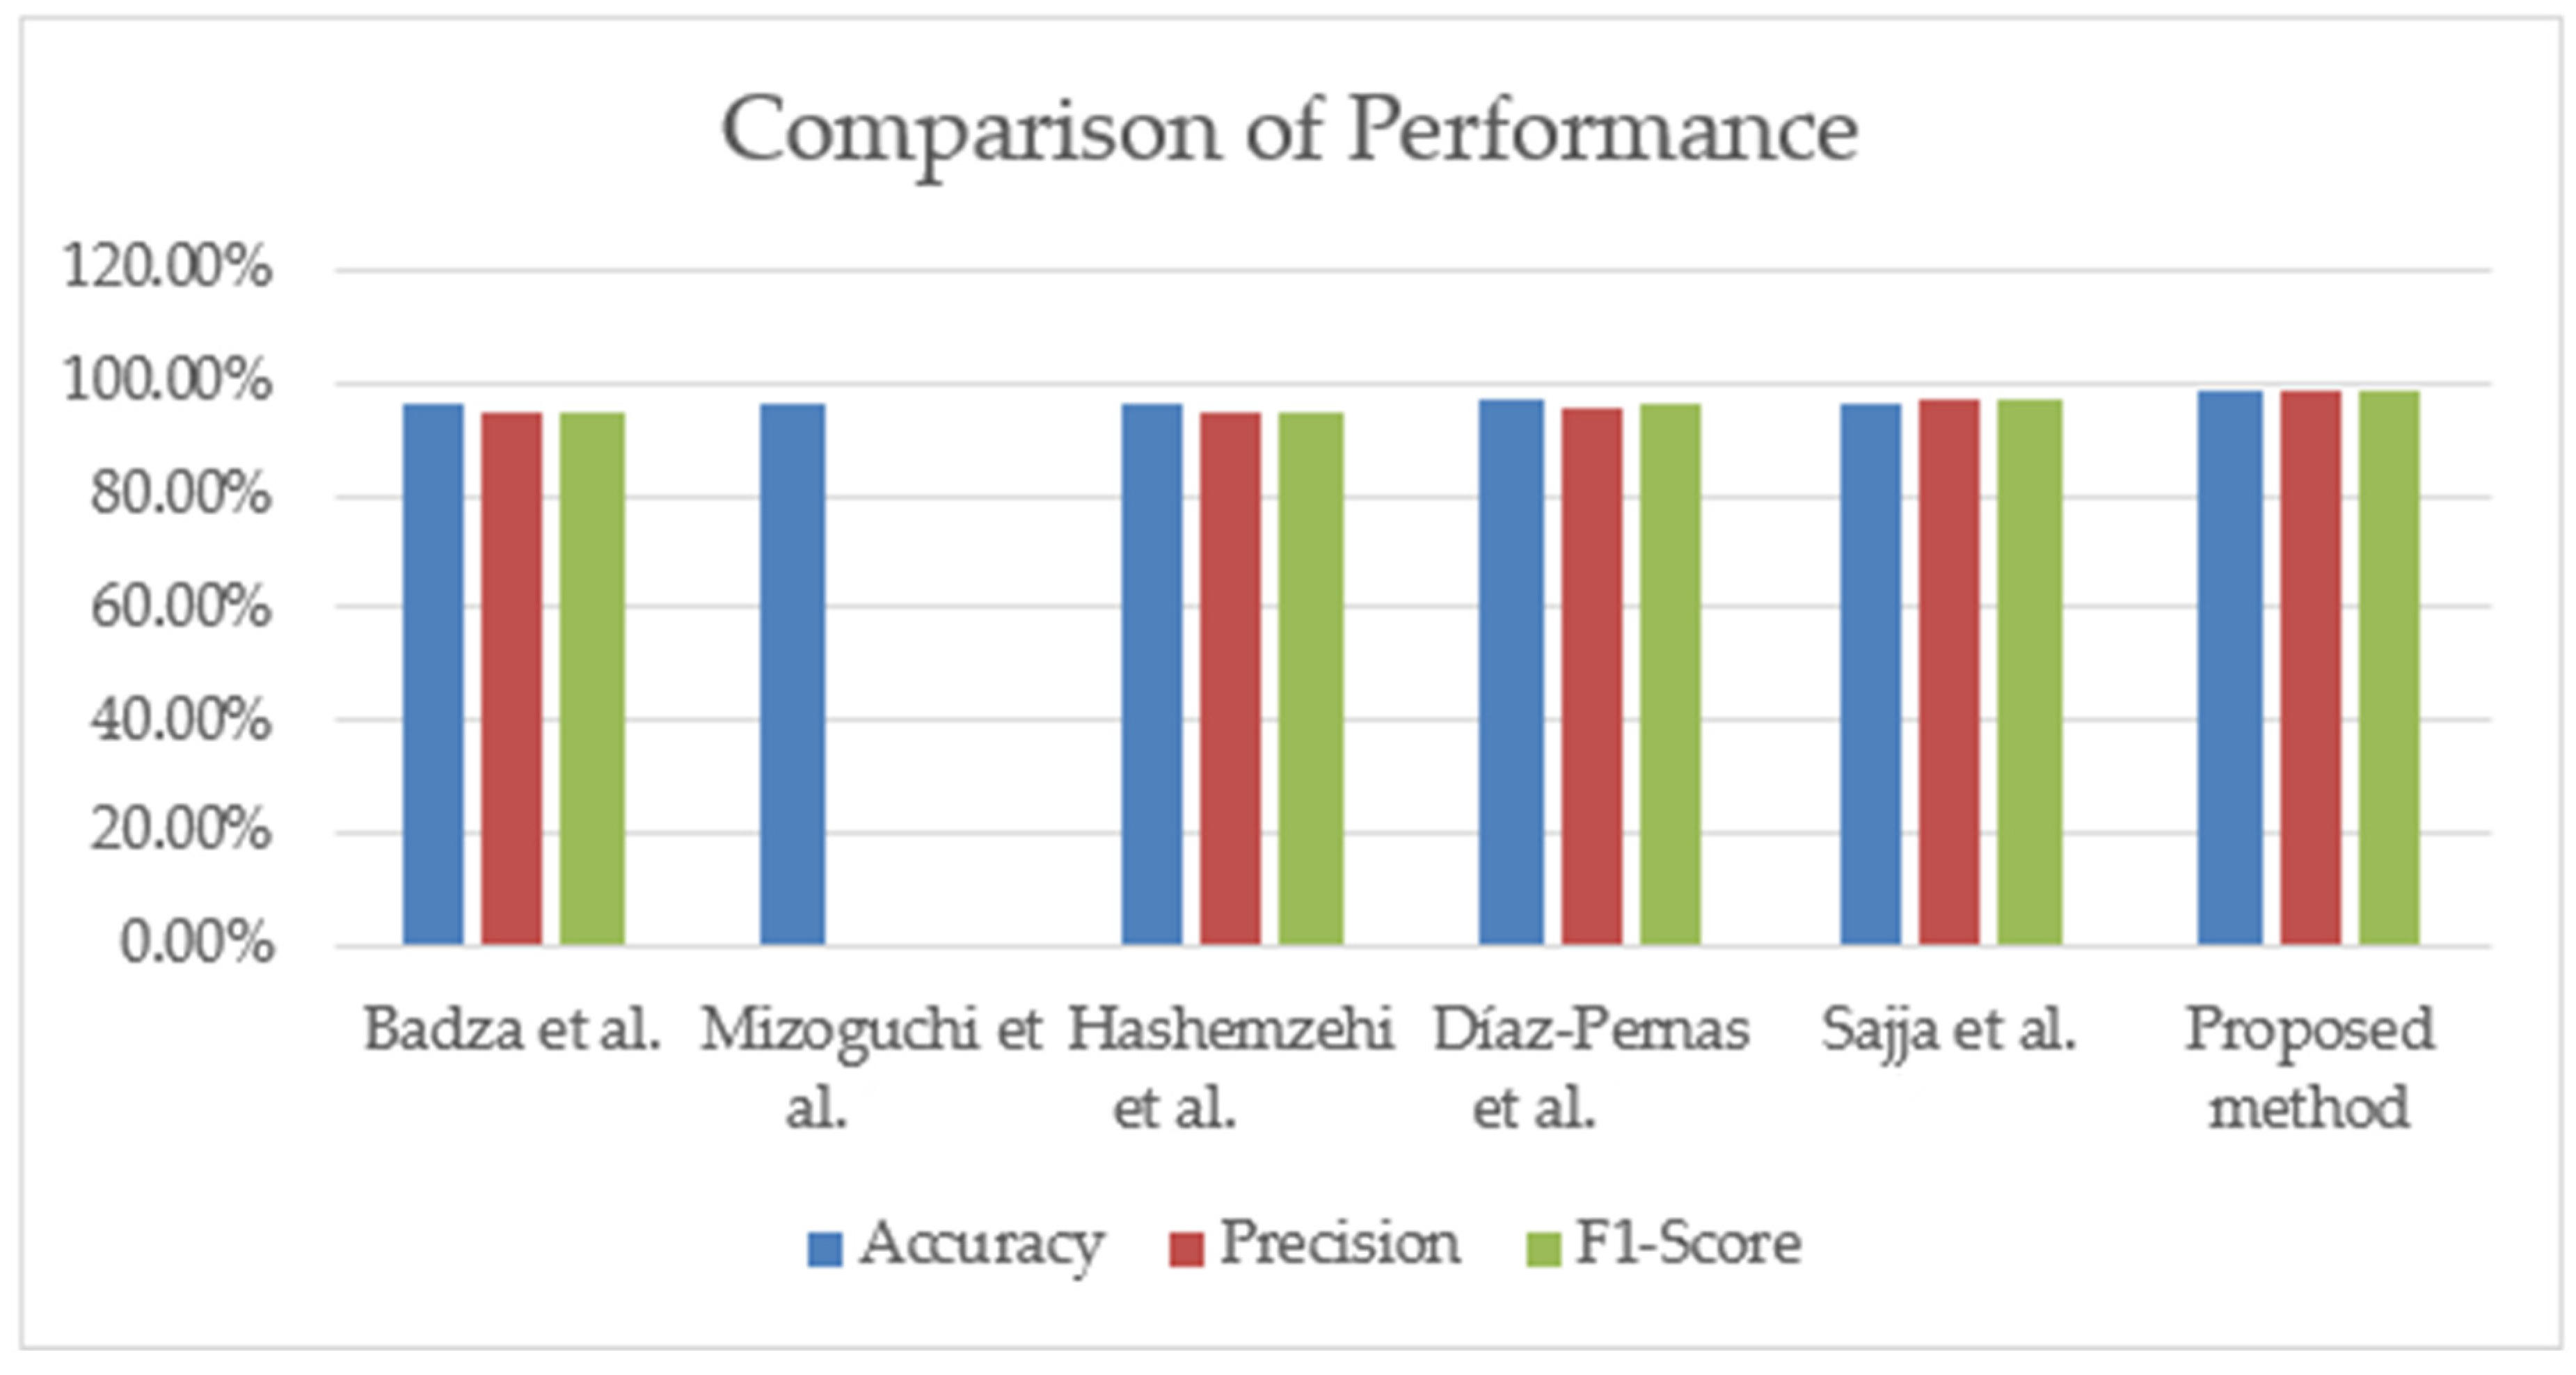
| Authors | Year | Dataset | Model | Accuracy | Precision | F1-Score |
|---|---|---|---|---|---|---|
| Badza et al. [12] | 2020 | T1 contrast brain tumors | CNN | 96.56% | 94.81% | 94.94% |
| Mizoguchi et al. [13] | 2020 | Brats-2018 | 3D CNN | 96.49% | - | - |
| Hashemzehi et al. [14] | 2020 | T1 contrast brain tumors | CNN and NAND | 96.00% | 94.49% | 94.56% |
| Díaz-Pernas et al. [15] | 2021 | T1 contrast brain tumors | Multi-scale CNN | 97.00% | 95.80% | 96.07% |
| Sajja et al. [18] | 2021 | T1 contrast brain tumors | Deep-CNN | 96.70% | 97.05% | 97.05% |
| Proposed method | Present | T1 contrast brain tumors | Dense EfficientNet | 98.78% | 98.75% | 98.75% |
Publisher’s Note: MDPI stays neutral with regard to jurisdictional claims in published maps and institutional affiliations. |
© 2022 by the authors. Licensee MDPI, Basel, Switzerland. This article is an open access article distributed under the terms and conditions of the Creative Commons Attribution (CC BY) license (https://creativecommons.org/licenses/by/4.0/).
Share and Cite
Nayak, D.R.; Padhy, N.; Mallick, P.K.; Zymbler, M.; Kumar, S. Brain Tumor Classification Using Dense Efficient-Net. Axioms 2022, 11, 34. https://doi.org/10.3390/axioms11010034
Nayak DR, Padhy N, Mallick PK, Zymbler M, Kumar S. Brain Tumor Classification Using Dense Efficient-Net. Axioms. 2022; 11(1):34. https://doi.org/10.3390/axioms11010034
Chicago/Turabian StyleNayak, Dillip Ranjan, Neelamadhab Padhy, Pradeep Kumar Mallick, Mikhail Zymbler, and Sachin Kumar. 2022. "Brain Tumor Classification Using Dense Efficient-Net" Axioms 11, no. 1: 34. https://doi.org/10.3390/axioms11010034