Article

The Key Success Factors for Attracting Foreign Investment in the Post-Epidemic Era

1
Department of Industrial Engineering and Management, National Taipei University of Technology, Taipei 10608, Taiwan
2
Graduate Institute of Urban Planning, College of Public Affairs, National Taipei University, New Taipei City 23741, Taiwan
3
Marketing and Logistics Management Department, China University of Technology, Taipei 11695, Taiwan
4
College of Management, National Taipei University of Technology, Taipei 10608, Taiwan
*
Author to whom correspondence should be addressed.
Axioms 2021, 10(3), 140; https://doi.org/10.3390/axioms10030140
Submission received: 31 May 2021 / Revised: 25 June 2021 / Accepted: 26 June 2021 / Published: 30 June 2021
(This article belongs to the Special Issue Intelligent and Fuzzy Systems)

Abstract

:
The global economy has been hit by the unexpected COVID-19 outbreak, and foreign investment has been seen as one of the most important tools to boost the economy. However, in the highly uncertain post-epidemic era, determining how to attract foreign investment is the key to revitalizing the economy. What are the important factors for governments to attract investment, and how to improve them? This will be an important decision in the post-epidemic era. Therefore, this study develops a novel decision-making model to explore the key factors in attracting foreign investment. The model first uses fuzzy Delphi to explore the key factors of attracting foreign investment in the post-epidemic era, and then uses DEMATEL to construct the causal relationships among these factors. To overcome the uncertainty of various information sources and inconsistent messages from decision-makers, this study combined neutrosophic set theory to conduct quantitative analysis. The results of the study show that the model is suitable for analyzing the key factors of investment attraction in the post-epidemic period. Based on the results of the study, we also propose strategies that will help the relevant policy-making departments to understand the root causes of the problem and to formulate appropriate investment strategies in advance. In addition, the model is also used for comparative analysis, which reveals that this novel approach can integrate more incomplete information and present expert opinions in a more objective way.

1. Introduction

Recently, with the rapid development of technology, the global economy has been growing quickly. However, the outbreak of COVID-19 occurred at the end of 2019, and this unexpected public health crisis is threatening the world [1]. Because of the risk of wide spread of this infectious disease, further transmission may occur through human activities [2]. To prevent the sweeping spread of the epidemic, massive border control, home isolation, home quarantine, work suspension, school suspension, activity restriction, etc. have been introduced worldwide. Because of these measures, economic development is being challenged worldwide [3]. For example, the tourism industry around the world has been affected by the panic, resulting in a decline in demand and stagnation of the industry [4], and the aviation industry, which is linked to the tourism industry, was not spared from the huge losses [5]. Notably, West Texas Intermediate (WTI) crude oil in New York also traded at a negative dollar breakout price for the first time [6]. These economic disruptions are evidence that the global economy has been severely impacted by COVID-19.
With the efforts of scientists, the good news is starting to come out from around the world that vaccinations are available, which means that the post-epidemic era is just around the corner. How governments should plan ahead to boost their domestic economies in the post-epidemic era will be a critical issue. In the past, there were many different views among international scholars on the means and strategies to boost local economies, such as government policies [7], tourism promotion [8], financial market revitalization [9], public construction expansion [10], military expenditure [11], urbanization and urban renewal [12], industrial development [13], foreign investment [14], etc. However, after the impact of COVID-19, the global industry is facing massive fluctuations and adjustments, and many companies have to find new ways and transform in order to survive and grow [15,16]. This is also an opportunity for governments to improve the structure of local industries and increase the utilization of resources [17]. Foreign investment has been internationally recognized as an important development strategy for technological innovation and industrial upgrading [14]. Therefore, attracting foreign investment will be one of the most important development strategies for governments in the post-epidemic era.
In the past, there has been much discussion on how to attract foreign investment [18,19]. However, there is an inextricable link between foreign investment and location selection [20]. Kim and Aguiler [21] reviewed the previous studies and focused on the selection mechanisms, summarizing them into four main directions, namely Economics tradition, Behavioral tradition, Neglect, and revival. Based on the different mechanisms, the final outcome will affect the final investment decision of the company. Li et al. [22] in 2018 reviewed 363 studies (1980–2016) related to investment selection and the findings showed that a very large number of factors affect foreign investment selection, such as market size, productivity, stage of economic development, local infrastructure (hardware construction, manpower, knowledge), host country risk (political, economic, financial, disaster), labor cost (wages), regulations (legislation, regulations, legal and political system), normality (cultural distance, cultural similarity, cultural affinity), acknowledgment (intensity of business transactions, simulated isomorphism), local government (similar industry clusters, education, transportation infrastructure, changes in R&D resources), domestic market factors (domestic market and industry structure, domestic competitive pressure, domestic innovation orientation, home-based business development), etc. In recent years, many studies have shown that foreign investment and regional/country competitiveness interact with each other [23]. Competitive economies tend to generate higher levels of income for their citizens, and the level of productivity determines the rate of return on investment in the economy, making competitiveness indicators highly valued [24]. Therefore, many institutions focus on the discussion of the regional/national competitiveness index, such as the World Economic Forum (WEF), the World Bank (WB), and the International Institute for Management Development (IIMD), etc. It is worth noting that the Global Competitiveness Index (GCI) developed by WEF focuses on the macro- and microeconomic factors of competitiveness, so it is more valued by scholars, policy makers, and business leaders [24,25]. However, Bucher [26] pointed out that the GCI is a comprehensive assessment system that does not assess a single factor, but rather a combination of related indicators. This shows that the use of GCI to enhance and improve a region/country should be considered from a systemic perspective. In the limited literature, few studies discuss the impact relationships among indicators and the causal relationships of the whole evaluation system to enhance and improve the root causes of the problem.
In the face of the post-epidemic era, governments of all countries have invested a lot of resources in COVID-19 prevention. During this period, the resources that governments can dispatch and use will be extremely scarce. How to effectively attract foreign investment is another urgent multi-attribute decision. Facing the dilemma, government units should accurately and effectively improve the investment environment. Therefore, exploring the causal relationships of the evaluation system will be more important than before. Decision-making trial and evaluation laboratory (DEMATEL) is an effective tool for exploring causal relationships between factors or indicators. It has been successfully applied to the exploration of key factors in various fields, such as psychotherapy [27], medical tourism [28], Sponge City PPP projects [29], green supply chain management [30], and sustainable supply chain [31]. Although it has many advantages, DEMATEL still has the following limitations in practical applications.
The first issue is how to define the indicator framework. Since the scope of the Global Competitiveness Index (GCI) is quite broad [24], it is important to define the assessment system. In the past, the Delphi method has been shown to have the following properties: shaping the consensus of experts, brainstorming, high accuracy, etc. [32,33,34]. However, the traditional Delphi method does not consider the ambiguity of the decision-making process [35]. Second, traditional DEMATEL relies on experts for decision-making [36]. Expert expression is a natural semantics [37]. Therefore, in recent years, many studies and model extensions have been proposed for natural semantics, such as fuzzy DEMATEL [38,39], and intuitionistic fuzzy DEMATEL [40,41,42]. Although FS and IFS contribute to the processing of ambiguities and incomplete messages in natural semantics [43], it is still unable to handle inconsistent and uncertain messages [44]. The final issue is about the integration of group opinions. It is almost impossible to find decision-makers with the same or similar experience, attitude, and knowledge in the decision-making group for group decision-making problems [45]. Therefore, the weights of the decision-makers play an important role in group decision-making problems [46]. In the past, many studies have used arithmetic averages or the direct subjective weighting of experts based on the view of the central tendency in the integration of expert opinions [1,36,47]. This will limit the importance or reliability of the decision-makers in solving a particular problem [45].
Based on the above limitations, this study proposes a novel decision-making model that will be empirically demonstrated in a case study of Taiwan’s experience. The case study will explore the key factors driving foreign investment in a post-epidemic era with limited resources and incomplete information. Therefore, the model uses the fuzzy Delphi method to construct a framework of core indicators, the neutrosophic set theory to quantify incomplete information, the entropy algorithm to obtain objective weights of decision-makers, and then the simple weighting method to integrate expert opinions. Finally, the DEMATEL method is used to investigate the causal relationships of the core indicators.
The contribution of this study is that the methodology can help relevant decision-makers to effectively explore the root causes of the system to provide an important basis for developing investment strategies. The following improvements have been achieved:
(1)
Constructing a framework of indicators for foreign investment in the post-epidemic era, which is more suitable for under-resourced contexts because they will be important indicators for attracting foreign investment in the post-epidemic era.
(2)
The proposed model will be able to quantify natural semantics more effectively because it can quantify incomplete, uncertain, and inconsistent information at the same time.
(3)
The opinions obtained will be more objective and reliable because objective expert weights are used to integrate the opinions of the group.
(4)
By identifying the causal relationships and visualizing the results of the analysis, it helps to simplify the complex evaluation system, so that the root causes of problems can be explored and response strategies can be developed more effectively.

2. Literature Review

In this section, first, a brief review of the Global Competitiveness Index is presented. Second, the methodology of exploring the key factors is discussed. Third, the specificity of natural semantics is explained. Finally, the integration techniques in group decision-making are discussed.

2.1. Global Competitiveness Index (GCI)

The Global Competitiveness Report was launched by the World Economic Forum (WEF) in 1979 and has been a globally recognized competitiveness index for more than 30 years [25,48]. Since 2004, the WEF has developed a Global Competitiveness Index [24] as the methodology and ideas on assessing a country’s competitiveness have evolved over time. The index is a highly comprehensive index that takes into account both microeconomic and macroeconomic bases, and aims to measure a country’s economic competitiveness thoroughly by assessing various relevant dimensions. These relevant dimensions together define multiple concepts of competitiveness [25,26]. With the arrival of the fourth industrial revolution (4IR), new fundamental changes in the way national economies operate have guided the development of the GCI 4.0 [49]. The GCI 4.0, published by the WEF in 2018, ranks 140 economies around the world using 98 assessment sub-criteria, and the GCI 4.0 divides all factors into 26 indicators and 12 pillars (institutions, infrastructure, ICT adoption, macroeconomic stability, health, skills, product market, labour market financial system, market size, business dynamism, innovation capability) and four categories (enabling environment, markets, human capital, innovation ecosystem), as shown in Table 1.

2.2. Methods for Exploring Key Indicators

By reviewing the previous literature, it can be found that there are many methods and various discussions on the construction of indicator frameworks and key factor exploration, such as document analysis [50], focus group interviews [51], factor analysis [52,53], brainstorming [54], in-depth interviews [55], Delphi method [33], modified Delphi method [56], fuzzy Delphi [37], etc. The discussion of the improvement of a country’s competitiveness will cover a wide range of areas, and the experts involved in decision-making come from different backgrounds and professional fields. In the face of such complex group decision-making, it is important to effectively build consensus. In the past, many studies have shown that the Delphi method is effective in consensus building. The Delphi method has the advantage of fully exploiting the role of experts, pooling their ideas, being accurate, and expressing the divergent views of experts—taking the strengths of each and avoiding the weaknesses of each [32,33]. However, the traditional Delphi method does not use a fuzzy language scale to deal with the ambiguity of information [37]. Therefore, in this study, fuzzy Delphi is used to construct the core indicator framework.
Although the fuzzy Delphi method contributes to the consensus-building of experts, it cannot effectively identify the causal relationships of the evaluation system. In the face of limited resources, it is important to take a systematic view of root cause improvement [57]. In the past, there have been many approaches to successfully examine causal relationships, such as interpretive structural modeling (ISM) [58], fuzzy cognitive map (FCM) [59], structural equation modeling (SEM) [60], Granger causality [61], transfer entropy [62], DEMATEL [36], etc. DEMATEL has the advantage of high ease of use and flexibility of integration when compared with various other methods [63,64]. Compared to other methods, it does not have the limitation of independence assumptions and considers the mutual influences within the evaluation system; moreover, the visualization of the analysis results will facilitate analysis and decision-making [65,66]. Therefore, in this study, DEMATEL is used for the test of causal relationships.

2.3. Ambiguity of Natural Semantics

DEMATEL can effectively explore causal relationships among indicators, whereas traditional DEMATEL uses explicit values to construct expert opinions and make subjective judgments based on expert experience. However, experts are human, and humans are more familiar with the use of natural semantics [67]. The use of natural semantics inherently suffers from message inconsistency [37]. The impact of COVID-19 is highly uncertain for the economic development of the world, and this uncertainty will magnify the extent of inconsistent messages. Therefore, based on the above-mentioned decision-making process, it is very important to master the uncertainty of information, which cannot be solved by the traditional DEMATEL.
Fuzzy set theory (FS) was first used to solve the ambiguity of natural human semantics, and classical FS uses membership functions to quantify the degree of ambiguity in semantics [68]. Later on, many researchers have subsequently proposed different extensions of fuzzy theory based on different viewpoints, such as interval value fuzzy set (IVFS), hesitant fuzzy set (HFS), intuitionistic fuzzy set (IFS), interval value intuitionistic fuzzy set (IVIFS), intuitionistic fuzzy set of type 2 (IFS2), picture fuzzy set theory (PFS), spherical fuzzy set (SFS), etc. But of great interest is the discussion of the non-memberships, an extension that takes fuzzy theory a step further, namely “intuitionistic fuzzy sets (IFS)” [69]. However, both FS and IFS can only deal with incomplete messages in natural semantics and still cannot quantify inconsistent and uncertain information [43]. Incomplete, uncertain, and inconsistent information does exist in the real world. The concept of neutrosophic set theory was proposed to quantify uncertainty using truth-membership, indeterminacy-membership, and falsity-membership. This will allow a more comprehensive extension of fuzzy theory and a more favorable quantification of incomplete, uncertain, and inconsistent information [44]. Therefore, this study will adopt the neutrosophic set theory to quantify incomplete messages in natural semantics.

2.4. Integration of Expert Opinions

As natural semantics has gained attention in decision science, more researchers are beginning to notice the divergence of opinions among experts. Most studies in the past have used arithmetic means to aggregate opinions in the face of group decision-making [70,71]. They advocate consistency in expert decision-making based on expert consensus tests [57,72]. The test results will help to determine whether the experts’ decision-making is consistent or not, and a higher degree of expert consensus means that the experts’ opinions tend to be consistent and representative. Finally, by using the concept of central tendency, the mean is used for opinion integration [57,73].
In recent years, some researchers have held different views. For example, [45] argues that it is difficult to find decision-makers with the same or similar experience, attitude, and knowledge in the decision-making team. Since each expert is different, the decision-making process will be more reliable if it relies differently on certain experts for a particular problem. Therefore, some studies have started to discuss group decision-making using weighted averages [74,75]. Due to the use of weighted average to integrate group opinions, the weight of experts will play an important role in group decision-making [45,46]. In the past, many researchers have given expert weights directly or evaluated the participating experts subjectively in their studies and generated subjective expert weights based on the results of the evaluation [74,75].
In the relevant studies mentioned above, the importance of individual experts has been considered. However, few studies have examined “who can effectively identify experts”. Therefore, this study presents an interesting commentary here: “who is the expert in evaluating experts?” In the past, the calculation of weights in the field of MCDM has been an interesting topic for which there is no definite answer yet, but it is crucial for decision-making [76]. Investigations indicate that objective weights generated based on the structure of the data include entropy, criteria importance through inter-criteria correlation (CRITIC), criterion impact loss (CILOS), and correlation coefficient and standard deviation (CCSD) [77,78]. The entropy method has a solid theoretical foundation and has been proven to be suitable for decision-making in different domains [79]. It is mainly based on the degree of deviation among data to determine the weights, and the method is somewhat objective [77]. Therefore, in this study, the objective weights of experts are determined by applying the degree of deviation in their decision-making results, which means that experts with discriminant power are given higher weights and experts without discriminant power are given lower weights.

3. Methodology

This section first describes the proposed method. Next, the novel practice is explained. Finally, the entire process and computational steps of the proposed model are presented.

3.1. Innovativeness of the Model

With the onslaught of the COVID-19 pandemic around the world, the global economic structure has undergone significant changes and mankind is faced with a new and unknown situation. Without prior experience, decision-makers are faced with many challenges of uncertainty when making decisions in such a situation [80]. Therefore, it is significant and necessary to consider uncertainty and incomplete information in the decision-making process. For this reason, this study uses the neutrosophic set theory to measure the uncertainty in the problem, and the results of the measurement generate useful decision information that is eventually imported into DEMATEL for the analysis of causal relationships. Such a procedure takes into account the incomplete, uncertain, and inconsistent information in the analysis process [81].
Neutrosophic set in combination with DEMATEL has been applied in many fields to make decisions on practical issues. For example, [75] compared municipalities based on an environmental sustainability perspective, and [74] investigated factors of coastal erosion. Therefore, the concept and practice of using the neutrosophic set to measure uncertainty in decision-making is a concept that deserves recognition and continual development. In recent years, researchers have developed SVNN to simplify the cumbersome process of neutrosophic set theory in decision-making situations with incomplete information. Although the use of SVNN can effectively simplify the complex process of neutrosophic set theory, it still has some limitations. For example, Quote [75,82] measured uncertainty using the practice of fixed linguistic variable, a process that assumes inconsistent messages as consistent, and the process thus limits theoretical development.
To illustrate how this is not reasonable, this study applies a case study for detailed illustration. As shown in Figure 1, three evaluation dimensions (D1, D2, D3) are assumed. According to the original approach, experts perform pairwise comparisons between dimensions to generate the evaluation matrix A. The corresponding neutrosophic set is then converted according to the fixed linguistic variable table (matrix H on the top right of the figure). However, this approach assumes that a semantic variable corresponds to fixed values of truth (T) and indeterminacy (I), which is not reasonable because different decision-makers may generate different values of truth (T) and indeterminacy (I) for the same semantic variable. Therefore, in this study, the choice of membership of truth and membership of indeterminacy is added to the expert opinion survey. For example, in the cases of D1 versus D3, D2 versus D3, and D3 versus D2, all three degrees of influence were considered low by the experts. Therefore, the responses obtained in the evaluation matrix A are all the same as “LI”. Although the semantic variable of the degree of influence is the same, it is considered to have a completely different membership, which cannot be captured in the traditional method.
Moreover, in the past, arithmetic averages were often used to estimate the central tendency in the process of facing group decisions. However, such estimation is more applicable in decision-making situations where there is a high degree of consensus among experts [83]. Since the impact of COVID-19 is unexpected, it would be more beneficial to have more information covering more possibilities in the face of this unknown impact. Therefore, this study advocates the use of a weighted average to integrate the experts’ opinions. The weighting of experts is constructed by the entropy technique, and the weighting of experts is based on the degree of deviation of decision information: the higher the degree of discrimination, the higher the weighting is.

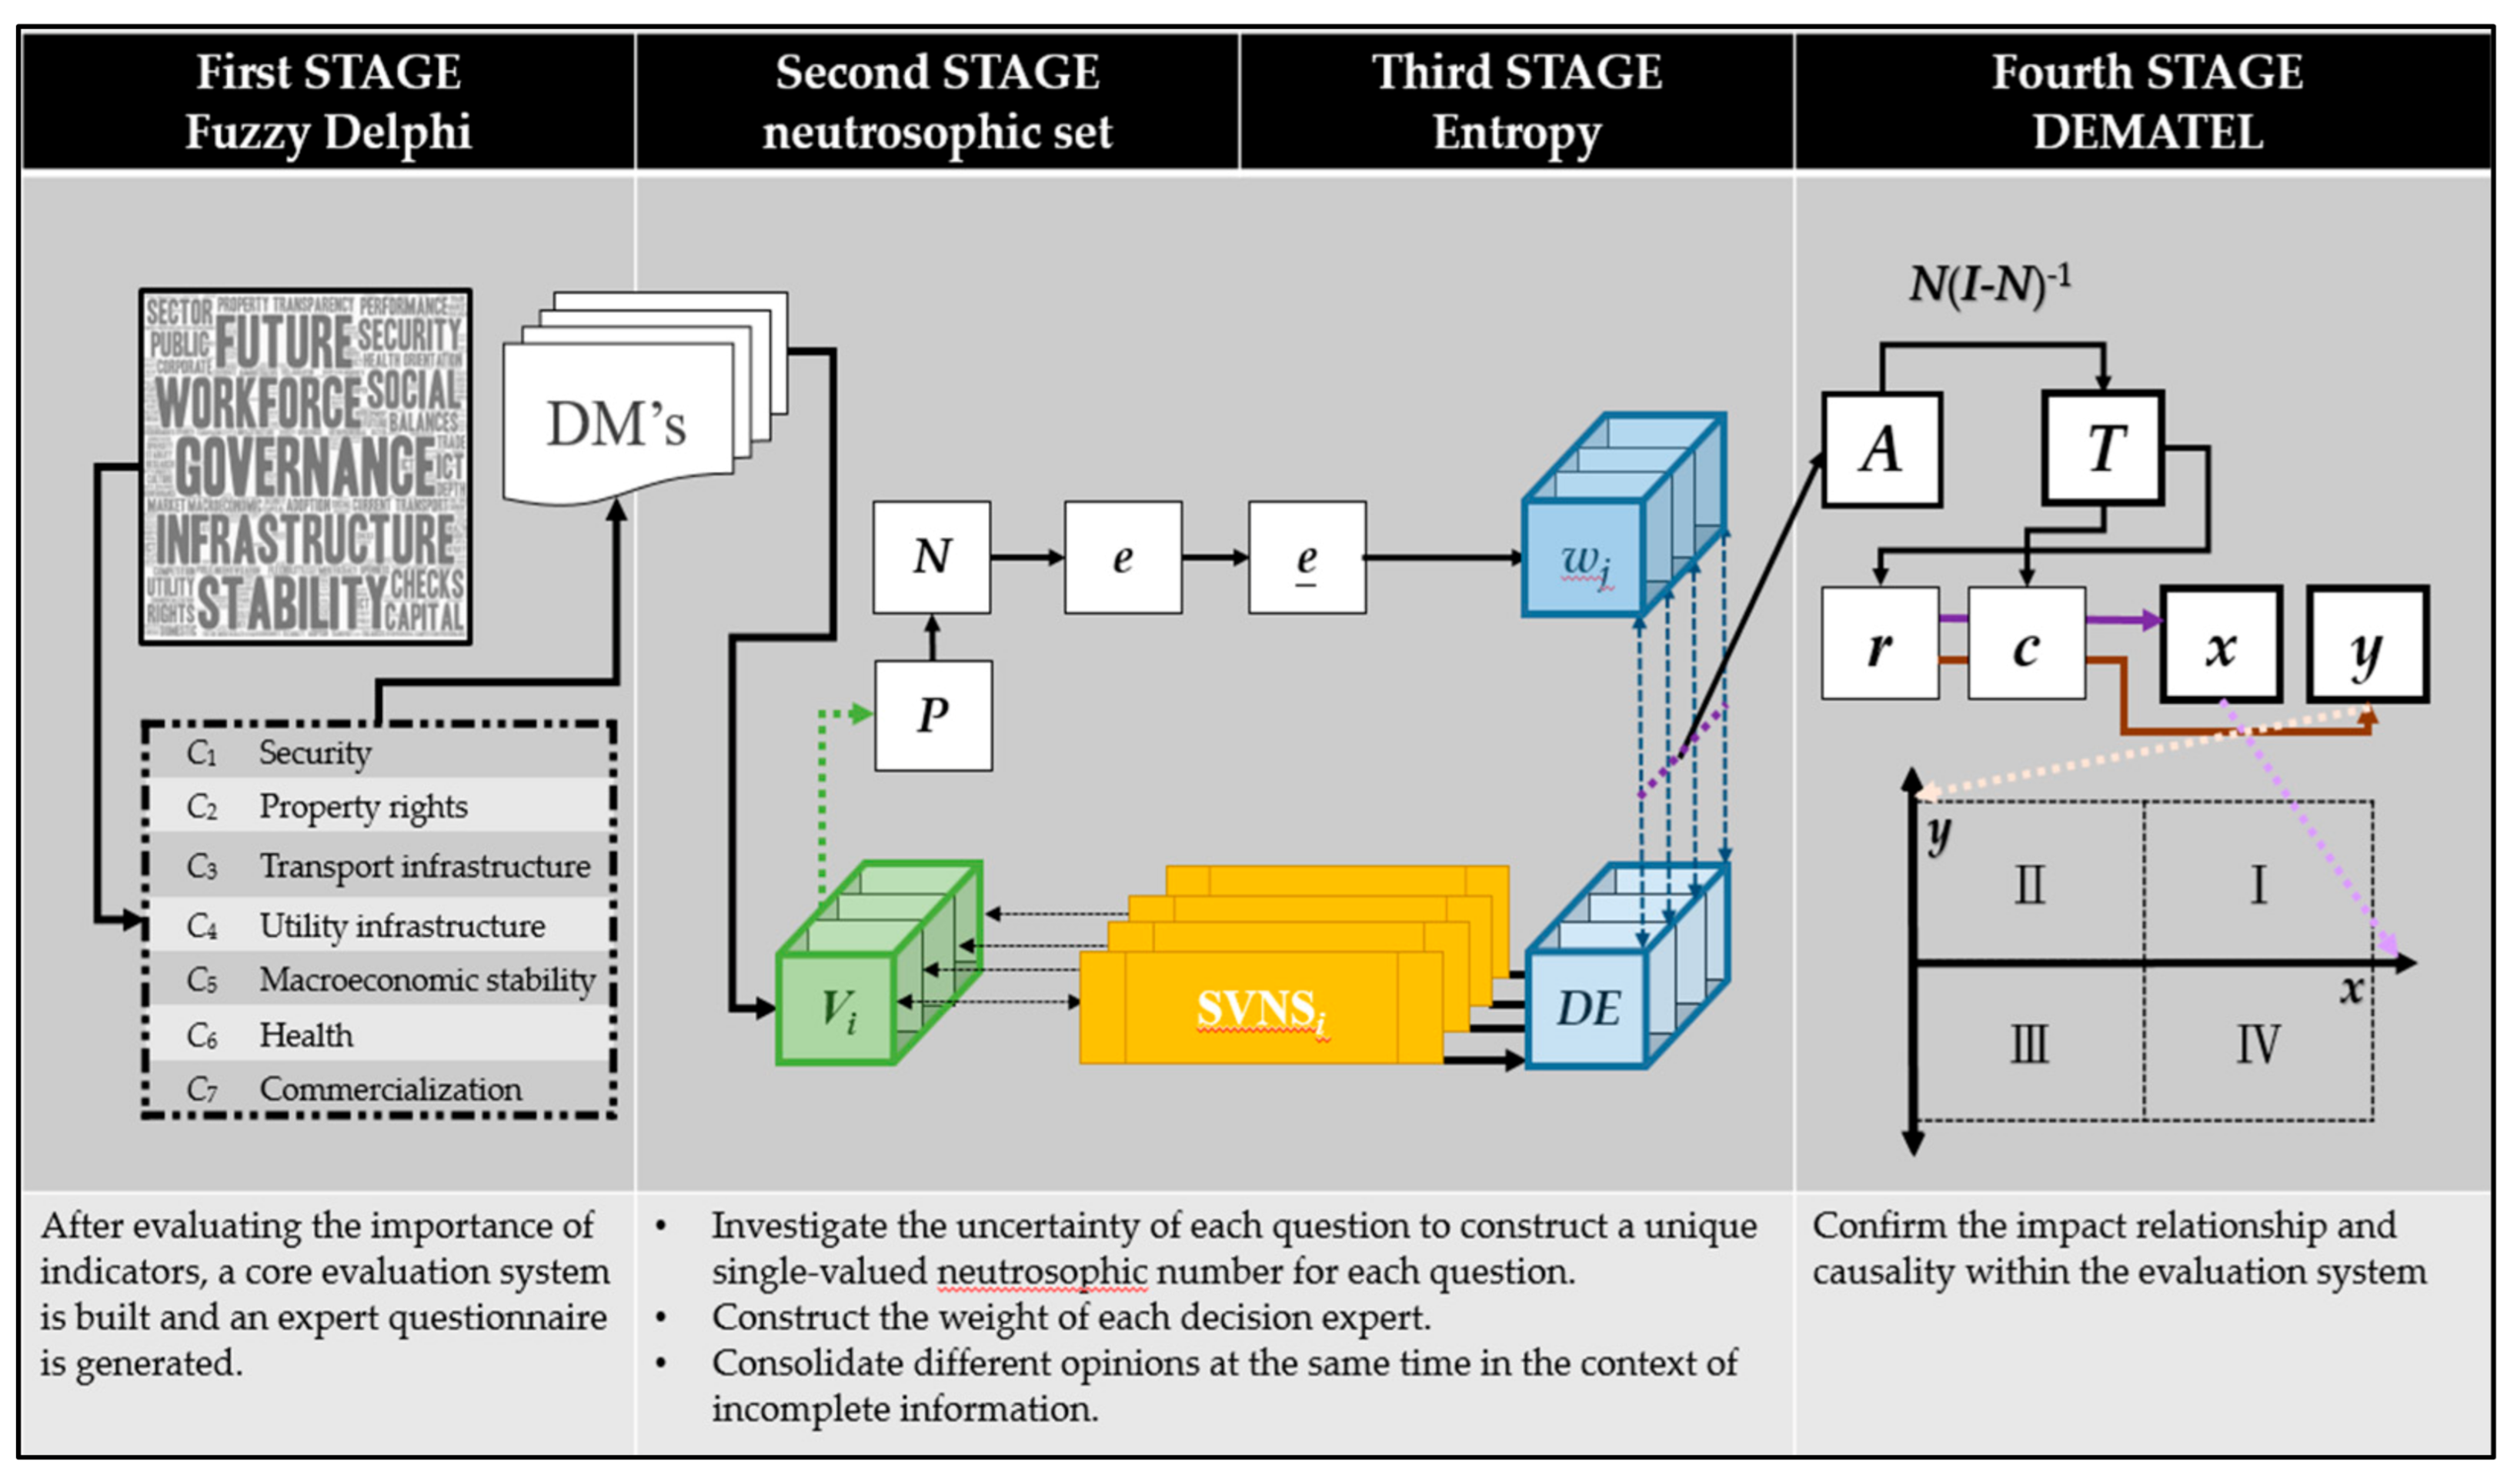
3.2. Analytical Processes of the Proposed Method

This section describes in detail the features and computational steps of this novel model. It is divided into four stages as shown in Figure 2. The four stages use different methods including fuzzy Delphi, neutrosophic set, entropy, and DEMATEL. The objectives of the four stages are as follows:
(1)
Constructing the core evaluation framework;
(2)
Measuring incomplete, uncertain, and inconsistent information;
(3)
Obtaining expert weights and integrating opinions among experts;
(4)
Evaluating causal relationships of the core indicators.
(1)
First Stage: Constructing a core evaluation framework
The fuzzy Delphi method can be used to obtain expert consensus to construct the core indicators framework.
Step 1: Constructing an index importance matrix F
Based on each expert’s survey on the importance of indicators, the results are collected to form the indicator importance evaluation matrix F. fij is any element of the matrix, where i = 1, 2,..., b and j = 1, 2,..., k. The matrix refers to the evaluation results of k experts on b evaluation indicators, as shown in Equation (1).
F = f i j b × k f 11 f 1 j f 1 k f i 1 f i j f i k f b 1 f b j f b k b × k
Step 2: Constructing fuzzy decision matrix Q
According to the initial matrix of expert importance using Equations (2)–(5), the fuzzy decision matrix Q can be constructed. p refers to the fuzzy number of the geometric shape, and this study uses the triangular fuzzy number; therefore, p = (l, m, u).
Q = q i j b × p   f o r p = l , m , u
li is the minimum requirement among the evaluations of the experts:
l = l i b × 1 = min f i j
ui is the maximum requirement among the evaluations of the experts:
u = u i b × 1 = max ( f i j )
mi is the geometric mean among the k experts:
m = m i b × 1 = j = 1 k f i j k ,   w h e r e j = 1 , , k
Step 3: Obtaining the crisp values.
To obtain the crisp value oi, the centroid method is used to defuzzify the fuzzy decision matrix Q, as shown in Equation (6).
o = o i = l i + m i + u i / 3
Step 4: Determining the threshold value based on demand
Usually, the threshold value is determined subjectively by the decision-makers [84] (Dzeng and Wen, 2005). In this study, the inter-quartile range (IQR) technique is used to evaluate the threshold value in order to avoid the influence of extreme values. The smaller the value, the more concentrated the data in the middle; the larger the value, the more dispersed the data in the middle, as shown in Figure 3.
If oi of an indicator > the threshold value, then “Delete” is applied to the indicator. If oi of an indicator < the threshold value, then “KEEP” is applied to the indicator. The framework formed by the retained indicators after the importance evaluation is called the core framework. The number of core indicators is denoted by Ψ.
(2)
Second Stage: Measuring incomplete, uncertain, and inconsistent information
The expert judgments may produce inconsistent results depending on their backgrounds and experiences. For this reason, the neutrosophic set is used to collect incomplete, uncertain, and inconsistent information.
Step 1: Definition of neutrosophic sets (NSs)
Let Z be a space consisting of generic elements represented by z. An NS can be denoted by N S = z , λ S ( z ) , β S ( z ) , θ S ( z ) z Z . This parameter is different from the membership functions proposed by Zadeh. λ S ( z )  represents a truth-membership function, β S ( z ) represents an indeterminacy-membership function, and θ S ( z ) represents a falsity-membership function. All three functions are standard subsets λ S ( z ) , β S ( z ) , θ S ( z ) 0 , 1 . The sum of the three functions between 0 and 2 is defined as 0 λ S ( z ) + β S ( z ) + θ S ( z ) 2 , where 0 λ S ( z ) + θ S ( z ) 1 .
Step 2: Opinion survey and information evaluation
This step is different from the previous one. First, the invited experts are interviewed and the degree of influence between two indicators in the whole evaluation system is confirmed through the interviews. Each expert’s opinion is formed into an evaluation matrix G for each expert, and there are k matrices of G for k experts, as shown in Equation (7).
G = g i j ψ × ψ g 11 g 1 j g 1 ψ g i 1 g i j g i ψ g ψ 1 g ψ j g ψ ψ ψ × ψ
Secondly, each response is investigated for whether it represents a truth-membership function or an indeterminacy-membership function. The result is that each expert has a proprietary SVNN for each question. This approach is completely different from the traditional SVNN approach, as shown in Equations (8) and (9).
SVNN = λ S ( z ) , β S ( z ) , θ S ( z )
θ S ( z ) = 1 λ S ( z )
Step 3: Evaluation of opinion (Fusion-SVNN) after considering uncertainty
The expert’s decision opinion v is integrated with its proprietary SVNN. This step evaluates the influence relationships of the system and considers the incomplete information at the same time to obtain Fusion-SVNN, as shown in Equations (10)–(13).
Fusion SVNN = λ S Fision ( z ) , β S Fision ( z ) , θ S Fision ( z )
λ S Fision ( z ) = ( v i × λ S ( z ) ) / 4
β S Fision ( z ) = ( v i × β S ( z ) ) / 4
θ S Fision ( z ) = ( v i × θ S ( z ) ) / 4
Step 4: Obtaining the decision matrix H of crisp values for each expert
The decision matrix H is formed with deneutrosophicated values for each expert’s Fusion-SVNN. For k experts, there are k matrices of H, as shown in Equation (14).
H = h i j ψ × ψ h 11 h 1 j h 1 ψ h i 1 h i j h i ψ h ψ 1 h ψ j h ψ ψ ψ × ψ
Equation (15) is used for deneutrosophication, and this step is similar to the traditional defuzzification and eventually obtains the crisp values from the neutrosophic sets.
Z S = 1 1 λ S Fision ( z ) 2 + β S Fision ( z ) 2 + θ S Fision ( z ) 2 / 3
(3)
Third Stage: Calculating expert weights and integrating opinions among experts
According to the previous stage, each expert’s opinion is obtained and the weight of each expert is constructed using the entropy technique according to the degree of deviation of the expert’s opinion. The lower the expert’s discriminant power of the evaluation system, the lower the weight will be given.
Step 1: Obtaining the initial expert opinion matrix V
According to Step 2 of the Second Stage, the original survey data can be transferred and the opinions of k experts can be combined to form an initial matrix V of expert opinions, where ε represents the number of questions ε = b × b to be answered after pairwise comparisons. The vector v refers to the decision opinion of each expert, as shown in Equations (16) and (17).
V = v i j ε × k v 11 v 1 j v 1 k v i 1 v i j v i k v ε 1 v ε j v ε k ε × k
v = ( v i ) ε × 1 = ( v 1 , v 2 , , v ε )
Step 2: Normalization of expert opinions
The initial influence relationship matrix of expert opinions is normalized as shown in Equation (18).
N e = n i j e = v i j i = 1 ε v i j
Step 3: Derivation of the variation degree of the criterion ej
The normalized performance evaluation matrix is derived from the variation degree to obtain the entropy value ej for the degree of variation in each criterion, as shown in Equation (19). The p is a constant. Let p = ( l n ( q ) ) 1 be used to ensure that e j ( j = 1 , 2 , , k ) ranges from 0 to 1.
e = e j = p j = 1 n n i j e ln n i j e
Step 4: Calculation of the degree of the divergence coefficient e ¯ j
The entropy vector is used to calculate the degree of deviation and each degree of the divergence coefficient e ¯ j is obtained, as shown in Equation (20). The e ¯ j ( j = 1 , 2 , , k ) represents the inherent intensity of contrast among j criteria. The higher the value of the e ¯ j criteria, the greater the relative importance of the role it plays in the whole system.
e ¯ = e ¯ j = 1 e j
Step 5: Derivation of the expert weights w of the entire system
The divergence coefficient e ¯ j is derived by simple additive normalization to obtain the objective weights w of the entire system as shown in Equation (21).
w = ( w i ) k × 1 = ( w j ) 1 × k = ( w 1 , w 2 , , w k )
Step 6: Construction of the direct influence relationship matrix A of crisp values
By applying the SAW technique to each expert’s weight w and crisp value decision matrix H, the direct influence relationship matrix A of the crisp values can be obtained, as shown in Equation (22).
A = a i j ψ × ψ = a 11 a 1 j a 1 m a i 1 a i j a i m a m 1 a m j a m m ψ × ψ
(4)
Fourth Stage: Evaluation of causal relationships of the core system
Based on the direct influence relationship matrix A of the crisp values obtained in the Third Stage, the influence relationships of the core indicator framework are considered for infinite times, and the total influence relationships of the core indicator framework are obtained.
Step 1: Direct influence relationship matrix N after normalization
The purpose of normalization of the evaluated matrix is to remove the inconsistency of units. The normalized direct influence relationship matrix N is obtained through Equations (23)–(25), where ϖ is the maximum of the sum of a row or column, and n i j is each element of the matrix N.
N = n i j ψ × ψ = n 11 n 1 j n 1 ψ n i 1 n i j n i ψ n ψ 1 n ψ j n ψ ψ ψ × ψ
n i j = A ϖ
ϖ = max i j = 1 n a i j , max j i = 1 n a i j
Step 2: Total influence relationship matrix T
The total influence relationship matrix can be generated after infinite interactions of influence relationships, as shown in Equations (26) and (27).
T = t i j ψ × ψ = t 11 t 1 j t 1 ψ t i 1 t i j t i ψ t ψ 1 t ψ j t ψ ψ ψ × ψ
T = N + N 2 + N 3 + + N k = N ( I + N + N 2 + + N k 1 ) [ ( I N ) ( I N ) 1 ] = N ( I N k ) ( I N ) 1 = N ( I N ) 1 , when k , N k = 0 m × m
Step 3: Calculation of influence relationships
The influence relationship of an indicator includes the degree of influence, the degree of being influenced, the total degree of influence, and the net degree of influence (r, c, x, y). The degree of influence refers to the sum of the influence of an indicator on other indicators as shown in Equation (28).
r = ( r 1 , r 2 , , r ψ ) = ( r i ) ψ × 1 = j = 1 n r i j ψ × 1 f o r   i , j = 1 , 2 , , ψ
The degree of being influenced refers to the sum of the degrees of an indicator being influenced by other indicators, as shown in Equation (29).
c = ( c i ) ψ × 1 = ( c 1 , c 2 , , c ψ ) = ( c j ) 1 × ψ = i = 1 ψ c i j 1 × ψ f o r   i , j = 1 , 2 , , ψ
The degree of net influence refers to the degree of influence of the indicator minus the degree of being influenced as shown in Equations (30) and (31). A positive value of yi indicates a cause, and a negative value of yi indicates an effect.
y = ( y 1 , y 2 , , y ψ ) = ( y i ) ψ × 1
y i = r i c i , f o r i = 1 , 2 , , ψ
The total degree of influence is the sum of the degrees of an indicator influencing and being influenced, which means the “prominence” of the indicator, as shown in Equations (32) and (33).
x = ( x 1 , x 2 , , x ψ ) = ( x i ) ψ × 1
x i = r i + c i , f o r i = 1 , 2 , , ψ
Step 4: Drawing the influential network relation map (INRM)
Based on the calculation in the previous stage, the influence relationship (T, r, c, x, y) among all evaluation indicators can be obtained, and the INRM can be drawn based on the influence relationships.
  • Drawing the scatter diagram
The INRM is drawn based on the total influence relationships and the net influence relationships. The horizontal axes of the coordinates represent the influence of the indicators and the vertical axes represent the causal relationships of the indicators. The corresponding relationships among all indicators and the coordinates are projected onto the coordinate axes, and the corresponding relationships based on the prominence and relation of each indicator are indicated.
b.
Retaining the relatively higher influence relationships
In order to have a better visual effect to facilitate decision-making, this study will use the consensus difference index (CDI) to retain the relatively higher influence relationships using the IQR technique.
c.
Marking the influence relationships between systems
Based on the matrix of the retained influence relationships, the influence relationships between the corresponding indicators are compared, and the relatively larger influence relationships are retained and their influence paths are plotted.

4. Case Study Results and Analysis

Taiwan is a small economy that is vulnerable to international economic influences. In order to effectively combat the epidemic and mitigate the impact on the domestic economy and society, Taiwan has been easing its monetary policy and increasing fiscal spending. The total size of the increased fiscal spending has reached US$38 billion. Taiwan has proposed corresponding financial strategies and has been continuously attracting foreign investment. It is hoped that the impact of the epidemic will improve the local industrial structure and increase the utilization of existing resources. Taiwan has therefore set up a task force on this issue. In the past, Taiwan has always been using the approach of improving its own competitiveness to attract foreign investment.
However, for the vestment promotion in the post-epidemic era, resources will be extremely scarce, information will be quite limited and incomplete, and experts in decision-making will come from different fields. In the past, the country’s competitiveness will affect the willingness of foreign investors and the economic development of Taiwan. It should be noted that the core framework based on Taiwan’s resource advantages may vary from country to country depending on the advantages it possesses.

4.1. Establishment of the Core Evaluation System

The core evaluation system of this study was established after three rounds of expert validation. The composition of the expert team consisted of 4 males and 1 female, all with master’s degrees or higher, and all with more than 25 years of working experience and from different organizations, all of whom were on-the-job managers, as shown in Table 2.
First, the experts summarized 26 indicators based on the national competitiveness indicators developed by WEF and coded them as I1~I26. Secondly, we conducted a roundtable survey on the importance of the 26 indicators and calculated the decision coefficients of each indicator from 5.590 to 8.988 based on the survey results. Finally, the indicators with decision coefficients >8.384 were retained (I1, I6, I9, I10, I12, I13, and I26), and the indicators were recoded from C1~C7 for ease of labeling, and were called the core evaluation framework, as shown in Table 3.
The core evaluation framework was constructed based on the fuzzy Delphi. The core evaluation framework includes security, property rights, transport infrastructure, utility infrastructure, and macroeconomic stability. The definition of the evaluation framework is shown in Table 4.

4.2. Measuring Incomplete, Uncertain, and Inconsistent Information

The following data were obtained based on the results of the expert interviews, which are illustrated by examples due to space limitations in the study, as shown in Table 5. The invited experts responded based on the influence of the indicators on one another, correctness, uncertainty, and error rates. For example, the first expert interviewed considered C1 to have a very high effect on C2, with a correctness rate of 0.9, an uncertainty rate of 0.2, and an error rate of 0.2. The study coded “4 (0.9, 0.2, 0.2)” based on the experts’ responses. The neutrosophic direct-influence matrix for the initial expert opinion evaluation was constructed by aggregating the opinions of all the invited experts.
The following evaluation matrix, the neutrosophic aggregated direct-influence matrix, was obtained by integrating the initial evaluation opinion of each expert with the correctness, uncertainty, and error rates according to Equations (10)–(13), as shown in Table 6.

4.3. Obtaining Objective Expert Weights and Integration of Opinions

Each expert was assigned a corresponding weight based on his or her ability to evaluate the direct influence relationship. In this study, the direct influence relationships evaluated by each expert were transposed as shown in Table 7. The final expert weights were obtained by applying Equations (16)–(21). The expert weights are 0.283, 0.148, 0.140, 0.143, and 0.286, respectively. Experts 1 and 5 have a larger degree of deviation, so they are given larger expert weights.
The neutrosophic aggregated direct-influence matrix was deneutrosophicated according to Equation (15), as shown on the left side of Table 8. Then, the opinions of different experts are given corresponding expert weights to weigh all opinions, as shown on the right side of Table 8, and the crisp values of the direct-influence matrix are obtained, as shown in Table 8.

4.4. Evaluation of Causal Relationships of the Core Indicators

After considering the opinions and uncertainties of the expert team, the matrix A of direct influence relationships with crisp values is obtained, and the matrix of total influence relationship T is obtained by infinite interactions as shown in Table 9. From matrix A, we can find that the direct influence relationship of C1 (security) on C2 (property rights) is the greatest in the whole system up to 0.844, followed by the direct influence relationship of C5 (macroeconomic stability) on C1 (security) up to 0.807, and so on. It is noteworthy that after an infinite number of interactions, the influence relationship of the whole system changes, and it can be found from the matrix T that C5 (macroeconomic stability) on C1 (security) has the greatest influence relationship of 2.148. This is followed by the influence relationship of C5 (macroeconomic stability) on C4 (utility infrastructure) of 2.103. This would imply that the original influence relationships have changed after considering the interaction effects, and also implies that the influence of macroeconomic stability on security is the highest in the whole evaluation system. This is followed by the degree of influence of macroeconomic stability on utility infrastructure.
The various influence relationships in the overall evaluation system are obtained from the total influence relationship matrix, as shown in Table 10. The top three indicators influencing other indicators are C5 (macroeconomic stability): 14.107 > C1 (security): 13.704 > C4 (utility infrastructure): 13.187. The top three indicators influenced by other indicators are C1 (security): 13.955 > C4 (utility infrastructure): 13.675 > C2 (property rights): 13.460. Based on the total influence of the indicators in descending order, C1 (security) > C5 (macroeconomic stability) > C4 (utility infrastructure) > C3 (transport infrastructure) > C7 (commercialization) > C2 (property rights) > C6 (health). This means that “security” has the highest total impact in the whole system, followed by “macroeconomic stability”. And the total degree of influence is based on the sum of the degrees of influence and being influenced. In addition, the net influence of the indicators from C1 (security) to C4 (utility infrastructure) are positive, while C5 (macroeconomic stability) to C7 (commercialization) are negative. This means that macroeconomic stability, health, and commercialization are the “effects” of the causal relationships, while security, property rights, and transport infrastructure are the “causes” of the causal relationships.
The INRM of the whole system can be obtained by projecting the degree of total influence (x) and the net influence (y) of each evaluation indicator onto the coordinate axes as shown in Figure 4. The dotted spheres at the top of the figure represent the causes of the system, and the spheres at the bottom of the figure are the effects. The right side of the co-ordinates represents the indicators with higher total influence, while the left side is 0. The solid line in the figure will represent the influence between the two indicators. In order to make the effect of INRM clearer and more definite, we use IQR to set the threshold values and keep the influence relationship above Q2 (1.893), and then plot the flow of influence according to the larger influence relationships. From the figure, we can find that C5 plays the role of “cause” in the whole evaluation system and has a greater degree of total influence, which means that macroeconomic stability is the root cause and key to the whole evaluation system.

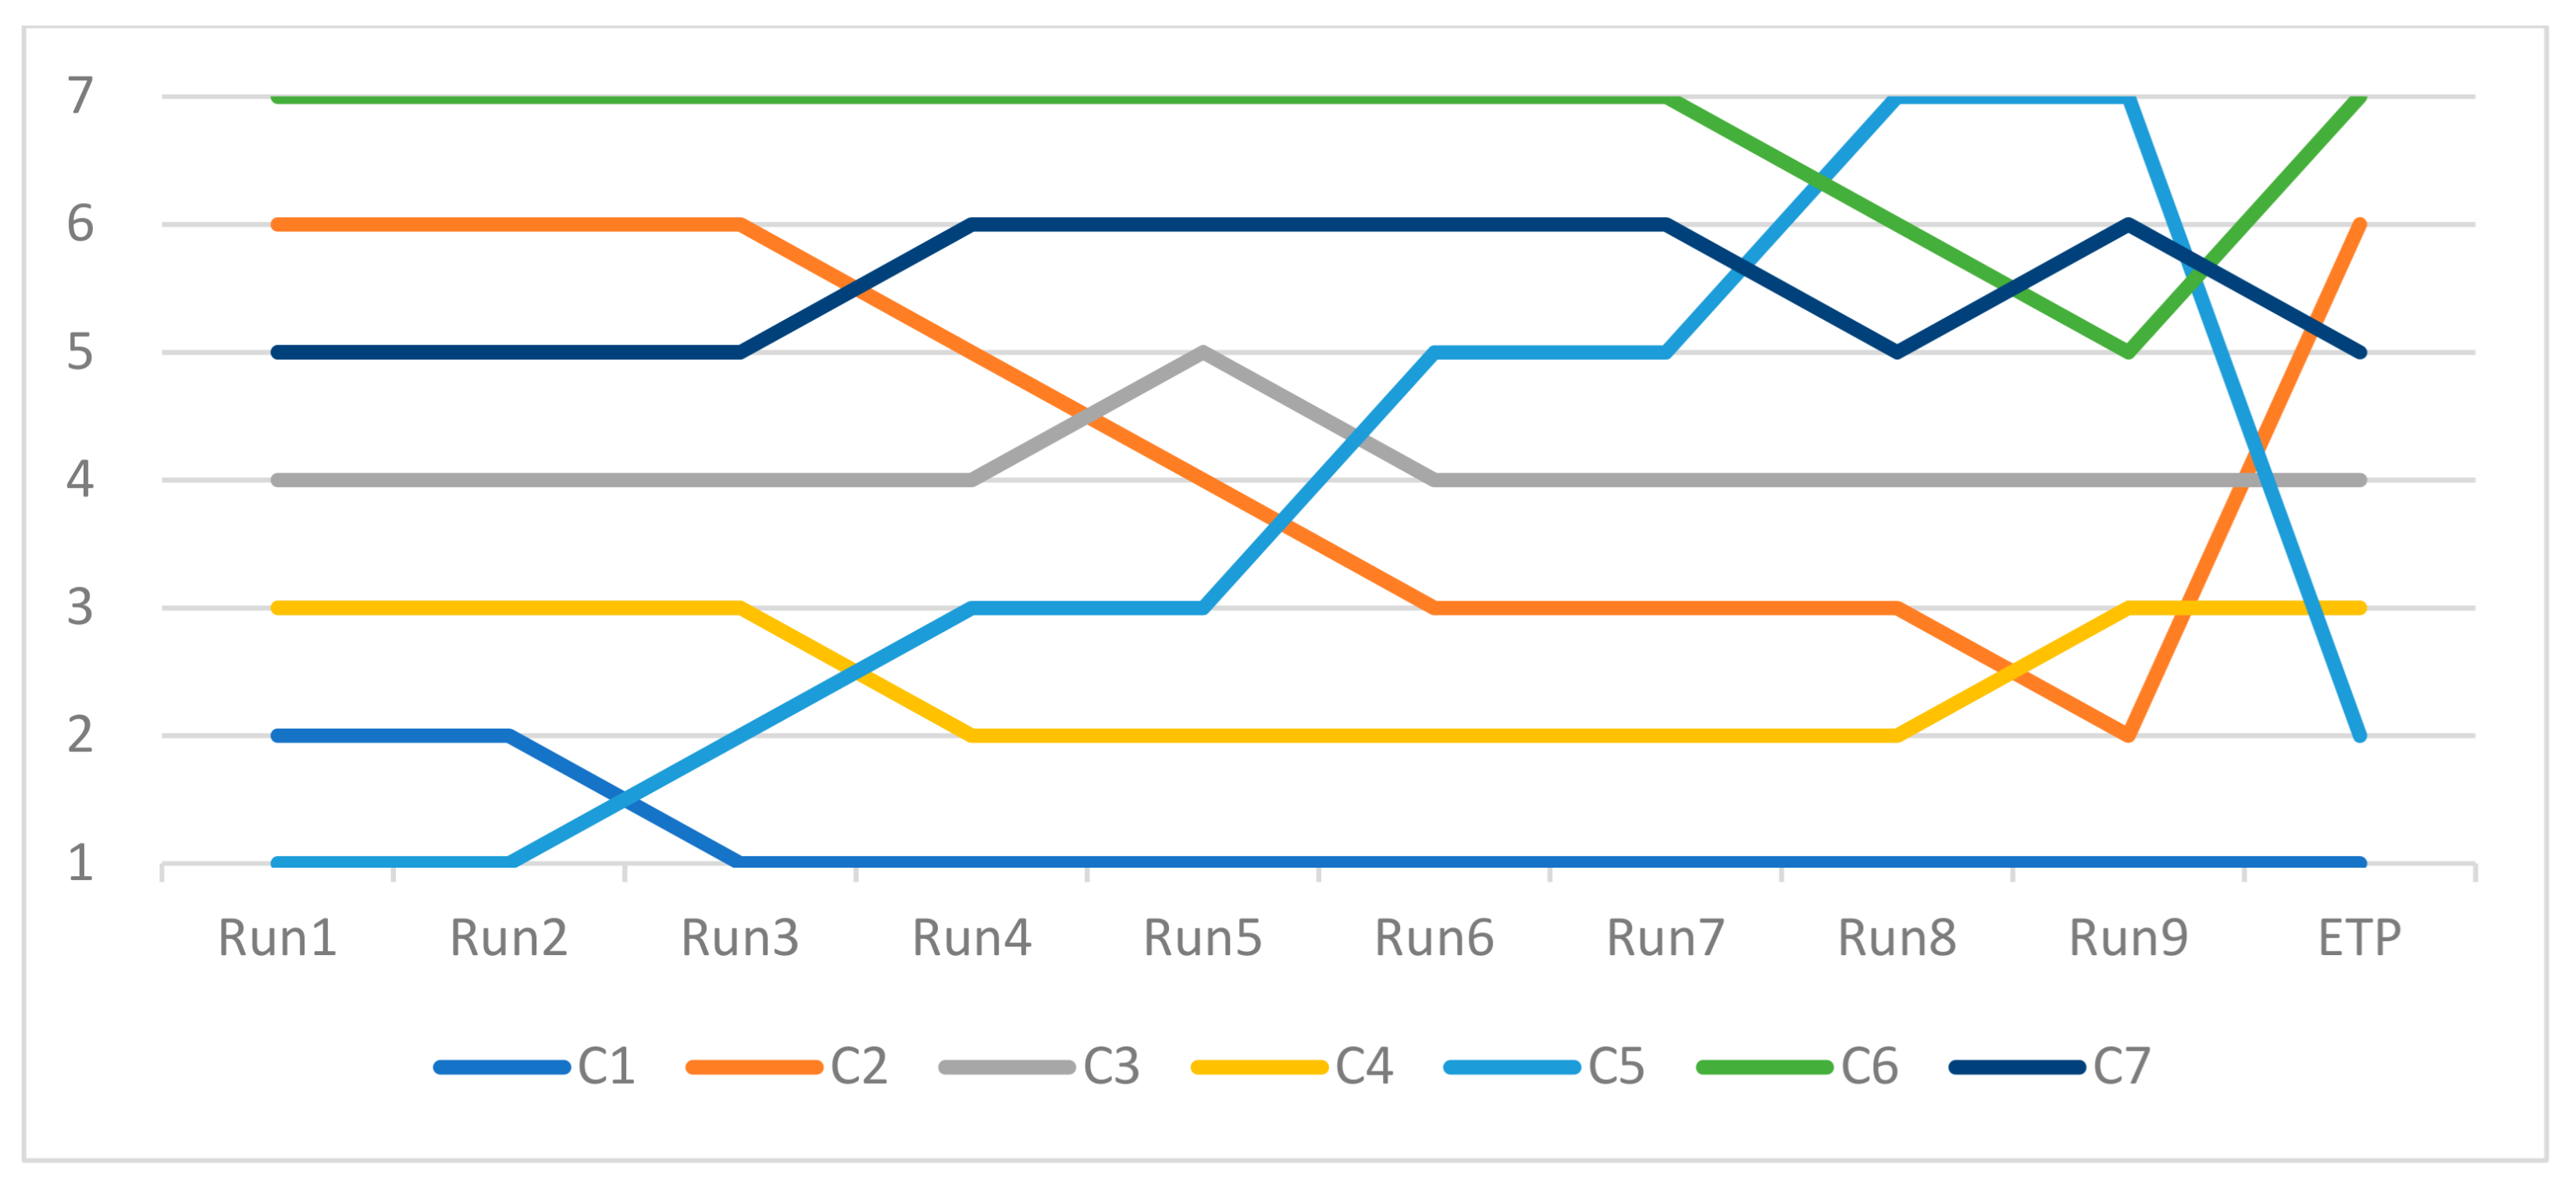
4.5. Comparative Analysis and Sensitivity Analysis

(1)
Comparative analysis
In order to show that the novel design practices of the proposed model are different from the original DEMATEL, this study compares and analyzes the original DEMATEL and the novel design practices. The analysis results are shown in Table 11. The ranking of original DEMATEL in the overall influence relationship is C1 (security), C5 (macroeconomic stability), C4 (utility infrastructure), C7 (commercialization), C3 (transport infrastructure), C2 (property rights), C6 (health). The ranking of novel design practices in the overall influence relationship is C1 (security), C5 (macroeconomic stability), C4 (utility infrastructure), C3 (transport infrastructure), C7 (commercialization), C2 (property rights), C6 (health). It can be found that the ranks 4–5 have changed. This is sufficient to show that novel design practices are different from those of the original DEMATEL.
(2)
Sensitivity analysis
Furthermore, the novel design practice uses objective weights and weighted averages to integrate expert opinions. In order to illustrate the importance of objective weights, this study adopts the concept of sensitivity analysis used in previous studies [83,85]. Since the fifth expert has the largest weight among the five experts, we set the weight of the fifth expert from 0.1 to 0.9, and the rest will be adjusted and distributed proportionally. According to the above description, the respective weights of the five experts in each situation are shown as Run1~Run9 on the left side of Table 12. This study analyzes the results for different situations, and it can be found that the causal relationship between Run1 and Run2 is different from other situations, as shown on the right side of Table 12.
In addition, it can be found that the ranking of the total influence relationship of the criteria changes substantially under different situations, as shown in Figure 5. It is worth noting that C6 (health) tends to be stable for Run1~Run7, and changes for Run8 and Run9. C1 (security) ranks first in the total influence relationship for Run3~Run9, and changes to second for Run1 and Run2.
Based on the results of the above analysis, it can be found that the proposed model is different from the traditional DEMATEL. In addition, the novel design practice can consider more uncertain, incomplete, and inconsistent information, and its evaluation results are closer to the facts. Besides, based on the results of the sensitivity analysis, it can be found that changes in expert weights can cause significant changes in the results, so it is meaningful and contributive to consider the expert weights in the decision-making process.

5. Discussions

In this section, management recommendations and theoretical implications are discussed based on the results of the case study.

5.1. Management Implications

This study is based on the Global Competitiveness Index (GCI) developed by the WEF, which aims to assess and improve national competitiveness. Since Michael Porter proposed the Diamond Model, national competitiveness has been a trendsetter in the world and has been followed by many. In recent years, national competitiveness has been regarded as one of the keys to attracting foreign investors. However, after the unexpected hit of COVID-19, how to effectively enhance national competitiveness with limited resources has been one of the main concerns. In this study, health, commercialization, and macroeconomic stability are found to be the factors influencing the core evaluation system. Therefore, it is recommended that management should prioritize the improvement towards the criteria of health, commercialization, and macroeconomic stability in a resource-limited situation.
From the INRM of this study, it is found that “macroeconomic stability” is the factor that influences the system and also has the greatest influence on the integration of the core evaluation system. This means that this indicator is the root cause of the whole evaluation system and its improvement can easily lead to the change of the whole evaluation system. Therefore, it is suggested that improvement in the post-epidemic era should focus on accelerating the development of macroeconomic stability, as its development will lead to the development of other indicators, a finding similar to that of [86]. In addition, [87] showed that conflict, openness, and democratic politics are three important keys to maintaining macroeconomic stability, among which democratic politics is the most robust.
As a result, several specific recommendations are proposed in response to the above findings and discussions. First, although this case country has been moving towards democratic politics, it is suggested that the culture and rules left behind by the authoritarian rule in the early days of the country should be raised and improved. Second, it is recommended that the government should accelerate macroeconomic policies to stabilize the economy. For example, it should speed up the open market operations to effectively regulate the money supply in order to stabilize the country’s balance of payments. Third, it is recommended that the government should accelerate the formulation of relevant detailed plans to stabilize domestic prices. For example, it should closely monitor the changes in domestic and foreign commodity prices, conduct regular surveys on domestic commodity prices, and grasp the trend of changes in consumer prices. It should also strengthen the control and monitoring of the overall process of production and sales of essential commodities from upstream, midstream, and downstream, and take timely measures to stabilize prices to ensure the stability of consumer prices and protect consumers’ rights and interests. Fourth, full employment in the country will be severely impacted by the epidemic. In the post-COVID-19 era, new lifestyles, consumer patterns, and economic models will emerge, with the rise of new business models driven by digital technology. Therefore, in the labor market, more emphasis should be placed on the inclusion of “intermediate workers”, the provision of basic social security for casual laborers with high risks, innovation and relaxation of the labor law system to meet the demand for diversified work options and flexibility in hiring by enterprises, as well as assistance in job transition and re-employment, in response to the strong demand for digital talents and manpower, etc.
Finally, according to the INRM results, it is interesting to note that although the total influence of health is very low, it plays the role of the “cause” in the whole evaluation system. This shows that a good health care system in the country is one of the keys to attracting foreign investors. Therefore, it is recommended that the government should move towards smart health care, fully integrating the two industries of technology and health care. After the epidemic, innovative technology combined with digital therapy, smart medicine, precision medicine, and digital epidemic prevention in the health care field will drive the country’s advancement in the health industry. Therefore, it is recommended that the adaptation of regulations for innovative technology and emerging business models should be accelerated to help accelerate the launch of innovative technology products and their global deployment.

5.2. Theoretical Implications

This study proposes a novel evaluation model to explore the key factors driving foreign investment in the post-epidemic era. The model has several advantages. First, based on the comparative analysis, it is found that the novel evaluation model has different evaluation results compared with the traditional DEMATEL. In addition, the novel evaluation model can effectively identify the core evaluation system, which will be more helpful in forming expert consensus and convergence of divergent expert opinions in a resource-constrained decision-making situation. Second, the proposed model is an extension of the neutrosophic set theory when using the single-valued neutrosophic set [44], which is easier to operate compared to the traditional neutrosophic set theory. However, the past SVNNs are based on a fixed scale, which will limit the excellence of SVNN.
The novel design practice conducts membership of truth and membership of indeterminacy surveys for each question. This advantage helps to quantify incomplete information, and the questionnaire developed for this study will make the content of the expert interviews clearer and easier to understand. Third, the traditional aggregation of opinions using arithmetic averages would completely ignore the extreme opinions. A weighted average aggregates the opinions and takes into account each expert’s opinion more fully. In addition, based on the results of the sensitivity analysis in this study, it can be found that there is a need to evaluate the weight of experts. By constructing the expert weights based on their discriminant power on the evaluation questions, the generated weights will be more objective and reasonable. Finally, the use of the consensus difference index (CDI) to distinguish relatively large influence relationships makes the visualization of the results clearer and more definite, and this advantage makes decision-making easier and faster for managers.

6. Conclusions

This study shows that the proposed causal analysis model (single-valued neutrosophic set, entropy, and DEMATEL) is more useful than the conventional DEMATEL for applying to group decision problems with incomplete information. The results of this study found that during COVID-19, the experts agree that the core factors for attracting foreign investment in Taiwan are security, property rights, transport infrastructure, utility infrastructure, macroeconomic stability, health and commercialization, etc. Macroeconomic stability is the root of the system that affects the entire foreign investment decision. In addition, it is worth noting that health and commercialization also play the role of “cause” in the core evaluation system. The results provide a valuable reference on how to effectively attract foreign investment, and provide useful practical advice for decision-making science and national development agencies.
Despite the contribution of this study to the enhancement of the key success factor model, some limitations should be mentioned. Since the input of DEMATEL relies on experts for impact relationship analysis, and experts are susceptible to professional backgrounds and preferences, future topics might move towards data-driven concepts to construct influence relationships. In addition, this study only discusses the influence relationships between factors, but does not analyze the performance of the country. Therefore, it is suggested that the discussion could be directed towards the addition of performance analysis. Finally, the proposed approach is only applicable to the core evaluation system, and future work could be directed toward how it can be applied to more complex evaluation frameworks.

Author Contributions

Conceptualization, S.-W.H., J.J.H.L. and G.-H.T.; methodology, S.-W.H., J.J.H.L. and G.-H.T.; software, S.-H.C. and S.-W.H.; resources, S.-H.C. and W.T.; data curation, S.-H.C. and W.T.; writing—original draft preparation, S.-W.H., J.C.Y.M. and J.J.H.L.; reviewing and editing, S.-W.H. and J.J.H.L.; visualization, S.-W.H., J.C.Y.M. and J.J.H.L.; supervision, J.J.H.L. and G.-H.T.; project administration, J.J.H.L. and G.-H.T.; All authors have read and agreed to the published version of the manuscript.

Funding

This research was funded by the Ministry of Science and Technology, Taiwan, grant number MOST 107-2410-H-305-038-MY3, MOST 108-2221-E-305-002-MY3, and MOST 109-2410-H-305-056.

Acknowledgments

The authors are extremely grateful for the editorial team’s valuable comments on improving the quality of this article.

Conflicts of Interest

The authors declare no conflict of interest.

References

  1. Singhal, T. A review of coronavirus disease-2019 (COVID-19). Indian J. Pediatr. 2020, 87, 281–286. [Google Scholar] [CrossRef] [PubMed] [Green Version]
  2. Wang, C.; Horby, P.W.; Hayden, F.G.; Gao, G.F. A novel coronavirus outbreak of global health concern. Lancet 2020, 395, 470–473. [Google Scholar] [CrossRef] [Green Version]
  3. Ahmad, T.; Haroon, M.B.; Hui, J. Coronavirus Disease 2019 (COVID-19) Pandemic and economic impact. Pak. J. Med Sci. 2020, 36, 73–78. [Google Scholar] [CrossRef] [PubMed]
  4. Bakar, N.A.; Rosbi, S. Effect of Coronavirus disease (COVID-19) to tourism industry. Int. J. Adv. Eng. Res. Sci. 2020, 7, 189–193. [Google Scholar] [CrossRef] [Green Version]
  5. Bandyopadhyay, S. Coronavirus Disease 2019 (COVID-19): We shall overcome. Clean Technol. Environ. Policy 2020, 22, 545–546. [Google Scholar] [CrossRef] [Green Version]
  6. Dutta, A.; Bouri, E.; Uddin, G.S.; Yahya, M. Impact of COVID-19 on global energy markets. In IAEE Energy Forum Covid-19 Issue; IAEE: Cleveland, OH, USA, 2020; pp. 26–29. [Google Scholar]
  7. Bajpai, N.; (Columbia University, New York, NY, USA); Biberman, J.; (Columbia University, New York, NY, USA). Personal communication, 2012.
  8. Kruczek, Z.; Kruczek, M. Post-industrial tourism as a means to revitalize the environment of the former oil basin in the Polish Carpathian Mountains. Pol. J. Environ. Stud. 2016, 25, 895–902. [Google Scholar] [CrossRef]
  9. Lortie, P. Entrepreneurial Finance and Economic Growth: A Canadian Overview; C.D. HOWE Institute: Toronto, SD, Canada, 2019. [Google Scholar]
  10. Enderwick, P. The economic growth and development effects of China’s One Belt, One Road Initiative. Strateg. Chang. 2018, 27, 447–454. [Google Scholar] [CrossRef]
  11. Tao, R.; Glonț, O.R.; Li, Z.Z.; Lobonț, O.R.; Guzun, A.A. New evidence for Romania regarding dynamic causality between military expenditure and sustainable economic growth. Sustainability 2020, 12, 5053. [Google Scholar] [CrossRef]
  12. Yoade, A.O.; Adeyemi, O.O.; Adeyemi, B.A. Assessment of urban renewal projects implementation and its socio-economic impacts in Ado-Ekiti, Nigeria. J. Urban Regen. Renew. 2020, 14, 98–116. [Google Scholar]
  13. Jobarteh, F.; Selemani, M. Assessing the Effect of Agriculture Sub-sectors on the Gambia’s Economic Growth Using Time Series Econometric Models. Int. J. Agric. Econ. 2020, 5, 142. [Google Scholar] [CrossRef]
  14. Domazet, I.S.; Marjanović, D.M. FDI as a Factor of Improving the Competitiveness of Developing Countries: FDI and Competitiveness. In Foreign Direct Investments (FDIs) and Opportunities for Developing Economies in the World Market; IGI Global: Hershey, PA, USA, 2018; pp. 82–104. [Google Scholar]
  15. Miroudot, S. The Reorganization of Global Value Chains in East Asia before and after COVID-19. East Asian Econ. Rev. 2020, 24, 389–416. [Google Scholar] [CrossRef]
  16. Strange, R. The 2020 Covid-19 pandemic and global value chains. J. Ind. Bus. Econ. 2020, 47, 455–465. [Google Scholar] [CrossRef]
  17. Duan, W.; Zhu, S.; Lai, M. The impact of COVID-19 on China’s trade and outward FDI and related countermeasures. J. Chin. Econ. Bus. Stud. 2020, 18, 355–364. [Google Scholar] [CrossRef]
  18. Dimitrova, A.; Rogmans, T.; Triki, D. Country-specific determinants of FDI inflows to the MENA region. Multinatl. Bus. Rev. 2019, 28, 1–38. [Google Scholar] [CrossRef]
  19. Noon, P.; De Vita, G.; Appleyard, L. What do we know about the impact of intellectual property rights on the foreign direct investment location (country) choice? A review and research agenda. J. Econ. Surv. 2019, 33, 665–688. [Google Scholar] [CrossRef]
  20. Paul, J.; Feliciano-Cestero, M.M. Five decades of research on foreign direct investment by MNEs: An overview and research agenda. J. Bus. Res. 2021, 124, 800–812. [Google Scholar] [CrossRef]
  21. Kim, J.U.; Aguilera, R.V. Foreign location choice: Review and extensions. Int. J. Manag. Rev. 2016, 18, 133–159. [Google Scholar] [CrossRef]
  22. Li, X.; Quan, R.; Stoian, M.C.; Azar, G. Do MNEs from developed and emerging economies differ in their location choice of FDI? A 36-year review. Int. Bus. Rev. 2018, 27, 1089–1103. [Google Scholar] [CrossRef]
  23. Bonelli, R. A note on foreign direct investment and industrial competitiveness in Brazil. Oxf. Dev. Stud. 1999, 27, 305–327. [Google Scholar] [CrossRef]
  24. Pérez-Moreno, S.; Rodríguez, B.; Luque, M. Assessing global competitiveness under multi-criteria perspective. Econ. Model. 2016, 53, 398–408. [Google Scholar] [CrossRef]
  25. Buscema, M.; Sacco, P.L.; Ferilli, G. Multidimensional similarities at a global scale: An approach to mapping open society orientations. Soc. Indic. Res. 2016, 128, 1239–1258. [Google Scholar] [CrossRef]
  26. Bucher, S. The Global Competitiveness Index as an indicator of sustainable development. Her. Russ. Acad. Sci. 2018, 88, 44–57. [Google Scholar] [CrossRef]
  27. Dalvi-Esfahani, M.; Niknafs, A.; Kuss, D.J.; Nilashi, M.; Afrough, S. Social media addiction: Applying the DEMATEL approach. Telemat. Inform. 2019, 43, 101250. [Google Scholar] [CrossRef]
  28. Nilashi, M.; Samad, S.; Manaf, A.A.; Ahmadi, H.; Rashid, T.A.; Munshi, A.; Almukadi, W.; Ibrahim, O.; Ahmed, O.H. Factors influencing medical tourism adoption in Malaysia: A DEMATEL-Fuzzy TOPSIS approach. Comput. Ind. Eng. 2019, 137, 106005. [Google Scholar] [CrossRef]
  29. Zhang, L.; Sun, X.; Xue, H. Identifying critical risks in Sponge City PPP projects using DEMATEL method: A case study of China. J. Clean. Prod. 2019, 226, 949–958. [Google Scholar] [CrossRef]
  30. Kaur, J.; Sidhu, R.; Awasthi, A.; Chauhan, S.; Goyal, S. A DEMATEL based approach for investigating barriers in green supply chain management in Canadian manufacturing firms. Int. J. Prod. Res. 2018, 56, 312–332. [Google Scholar] [CrossRef]
  31. Li, Y.; Mathiyazhagan, K. Application of DEMATEL approach to identify the influential indicators towards sustainable supply chain adoption in the auto components manufacturing sector. J. Clean. Prod. 2018, 172, 2931–2941. [Google Scholar] [CrossRef]
  32. Snyder-Halpern, R. Indicators of organizational readiness for clinical information technology/systems innovation: A Delphi study. Int. J. Med. Inform. 2001, 63, 179–204. [Google Scholar] [CrossRef]
  33. Schmajuk, G.; Hoyer, B.F.; Aringer, M.; Johnson, S.R.; Daikh, D.I.; Dörner, T. Multicenter Delphi exercise to identify important key items for classifying systemic lupus erythematosus. Arthritis Care Res. 2018, 70, 1488–1494. [Google Scholar] [CrossRef] [Green Version]
  34. Shariff, N. Utilizing the Delphi survey approach: A review. J. Nurs. Care 2015, 4, 246. [Google Scholar] [CrossRef]
  35. Ren, Q.; Shen, X.; Shen, H.; Hsu, W.L.; Duan, S. Exploring the Key Indexes of Environmental Conservation Zones using Fuzzy Delphi Method. In Proceedings of the 3rd Eurasian Conference on Educational Innovation 2020 (ECEI 2020), Hanoi, Vietnam, 5–7 February 2020. [Google Scholar]
  36. Du, Y.W.; Li, X.X. Hierarchical DEMATEL method for complex systems. Expert Syst. Appl. 2021, 167, 113871. [Google Scholar] [CrossRef]
  37. Velázquez, A.I.U.; Coello, D.A.G.; Garlobo, E.R.; Vinueza, C.E. Neutrosophic Iadov tecnique for assessing the proposal of standardization of the beef cutting for roasting in Patate canton, Ecuador. In Neutrosophic Sets and Systems, Book Series, Vol. 34, 2020. An International Book Series in Information Science and Engineering. Special Issue: Social Neutrosophy in Latin America; Florentin, S., Mohamed, A.B., Maikel, L.V., Eds.; Infinite Study: West Conshohocken, PA, USA, 2020; Volume 34. [Google Scholar]
  38. Mavi, R.K.; Standing, C. Critical success factors of sustainable project management in construction: A fuzzy DEMATEL-ANP approach. J. Clean. Prod. 2018, 194, 751–765. [Google Scholar] [CrossRef]
  39. Kazancoglu, Y.; Ozkan-Ozen, Y.D. Analyzing Workforce 4.0 in the Fourth Industrial Revolution and proposing a road map from operations management perspective with fuzzy DEMATEL. J. Enterp. Inf. Manag. 2018, 31, 891–907. [Google Scholar] [CrossRef]
  40. Abdullah, L.; Zulkifli, N.; Liao, H.; Herrera-Viedma, E.; Al-Barakati, A. An interval-valued intuitionistic fuzzy DEMATEL method combined with Choquet integral for sustainable solid waste management. Eng. Appl. Artif. Intell. 2019, 82, 207–215. [Google Scholar] [CrossRef]
  41. Zhang, L.; Lin, D.; Kusov, Y.; Nian, Y.; Ma, Q.; Wang, J.; Von Brunn, A.; Leyssen, P.; Lanko, K.; Neyts, J.; et al. α-Ketoamides as broad-spectrum inhibitors of coronavirus and enterovirus replication: Structure-based design, synthesis, and activity assessment. J. Med. Chem. 2020, 63, 4562–4578. [Google Scholar] [CrossRef]
  42. Ocampo, L.; Yamagishi, K. Modeling the lockdown relaxation protocols of the Philippine government in response to the COVID-19 pandemic: An intuitionistic fuzzy DEMATEL analysis. Socio Econ. Plan. Sci. 2020, 72, 100911. [Google Scholar] [CrossRef]
  43. Liu, P.; Wang, Y. Multiple attribute decision-making method based on single-valued neutrosophic normalized weighted Bonferroni mean. Neural Comput. Appl. 2014, 25, 2001–2010. [Google Scholar] [CrossRef]
  44. Broumi, S.; Bakali, A.; Bahnasse, A. Neutrosophic Sets: An Overview; Infinite Study: West Conshohocken, PA, USA, 2018. [Google Scholar]
  45. Yue, C. Entropy-based weights on decision makers in group decision-making setting with hybrid preference representations. Appl. Soft Comput. 2017, 60, 737–749. [Google Scholar] [CrossRef]
  46. Koksalmis, E.; Kabak, Ö. Deriving decision makers’ weights in group decision making: An overview of objective methods. Inf. Fusion 2019, 49, 146–160. [Google Scholar] [CrossRef]
  47. Feng, C.; Ma, R. Identification of the factors that influence service innovation in manufacturing enterprises by using the fuzzy DEMATEL method. J. Clean. Prod. 2020, 253, 120002. [Google Scholar] [CrossRef]
  48. The Global Competitiveness Report. Available online: http://www3.weforum.org/docs/WEF_TheGlobalCompetitivenessReport2020.pdf (accessed on 5 April 2021).
  49. Schwab, K. The Global Competitiveness Report 2018. World Econ. Forum 2018, 671. Available online: http://reports.weforum.org/global-competitiveness-report-2018/chapter-3-benchmarking-competitiveness-in-the-fourth-industrial-revolution-introducing-the-global-competitiveness-index-4-0/ (accessed on 5 April 2021).
  50. Hard, N.; Lee, P.; Dockett, S. Mapping the policy landscape of Australian early childhood education policy through document analysis. Australas. J. Early Child. 2018, 43, 4–13. [Google Scholar] [CrossRef]
  51. Muijeen, K.; Kongvattananon, P.; Somprasert, C. The key success factors in focus group discussions with the elderly for novice researchers: A review. J. Health Res. 2020, 34, 359–371. [Google Scholar] [CrossRef]
  52. Fernández-Rodríguez, M.J.; Milstein, A.; Jiménez-Rodríguez, A.; Mazuelos, N.; Medialdea, M.; Serrano, L. Multivariate factor analysis reveals the key role of management in integrated multitrophic aquaculture of veta la Palma (Spain). Aquaculture 2018, 495, 484–495. [Google Scholar] [CrossRef]
  53. Skowrońska-Szmer, A.; Kowalska-Pyzalska, A. Key factors of development of electromobility among microentrepreneurs: A case study from Poland. Energies 2021, 14, 764. [Google Scholar] [CrossRef]
  54. Woźny, A.; Saja, P.; Dobosz, M.; Kucęba, R. Occupational health and safety management with the use of brainstorming method. Prod. Eng. Arch. 2017, 17, 19–24. [Google Scholar] [CrossRef]
  55. Modabberniya, Y.; Vazifehdust, H.; Abdolvand, M.A. Providing a model of key factors affecting behavioral intentions of using e-banking services in Tejarat Bank. Iran. J. Oper. Res. 2020, 11. Available online: http://iors.ir/journal/article-1-666-en.html&sw=Ease+of+Use (accessed on 7 June 2020).
  56. Mellett, C.; O’Donovan, A.; Hayes, C. The development of outcome key performance indicators for systemic anti-cancer therapy using a modified Delphi method. Eur. J. Cancer Care 2020, 29, 13240. [Google Scholar] [CrossRef]
  57. Qu, G.B.; Zhao, T.Y.; Zhu, B.W.; Tzeng, G.H.; Huang, S.L. Use of a modified DANP-mV model to improve quality of life in rural residents: The empirical case of Xingshisi village, China. Int. J. Environ. Res. Public Health 2019, 16, 153. [Google Scholar] [CrossRef] [Green Version]
  58. Guan, L.; Abbasi, A.; Ryan, M.J. Analyzing green building project risk interdependencies using Interpretive Structural Modeling. J. Clean. Prod. 2020, 256, 120372. [Google Scholar] [CrossRef]
  59. Papageorgiou, K.; Singh, P.K.; Papageorgiou, E.; Chudasama, H.; Bochtis, D.; Stamoulis, G. Fuzzy cognitive map-based sustainable socio-economic development planning for rural communities. Sustainability 2020, 12, 305. [Google Scholar] [CrossRef] [Green Version]
  60. Nicolas, C.; Kim, J.; Chi, S. Quantifying the dynamic effects of smart city development enablers using structural equation modeling. Sustain. Cities Soc. 2020, 53, 101916. [Google Scholar] [CrossRef]
  61. Handa, B.S.; Li, X.; Aras, K.K.; Qureshi, N.A.; Mann, I.; Chowdhury, R.A.; Whinnett, Z.I.; Linton, N.W.; Lim, P.B.; Kanagaratnam, P.; et al. Granger causality–based analysis for classification of fibrillation mechanisms and localization of rotational drivers. Circ. Arrhythm. Electrophysiol. 2020, 13, 008237. [Google Scholar] [CrossRef]
  62. Huynh, T.L.D. The effect of uncertainty on the precious metals market: New insights from Transfer Entropy and Neural Network VAR. Resour. Policy 2020, 66, 101623. [Google Scholar] [CrossRef]
  63. Abolhabib, M.; Sharifi, F.; Dehaghani, A.R. A hesitant fuzzy DANP for Identifying and prioritizing effects and challenges of green roof on mental health in developing countries. J. Adv. Pharm. Educ. Res. 2020, 10, 125–136. [Google Scholar]
  64. Chen, K.H.; Yien, J.M.; Chiang, C.H.; Tsai, P.C.; Tsai, F.S. Identifying key sources of city air quality: A hybrid MCDM model and improvement strategies. Appl. Sci. 2019, 9, 1414. [Google Scholar] [CrossRef] [Green Version]
  65. Huang, S.W.; Liou, J.J.; Tang, W.; Tzeng, G.H. Location Selection of a Manufacturing Facility from the Perspective of Supply Chain Sustainability. Symmetry 2020, 12, 1418. [Google Scholar] [CrossRef]
  66. Singh, C.; Singh, D.; Khamba, J.S. Analyzing barriers of Green Lean practices in manufacturing industries by DEMATEL approach. J. Manuf. Technol. Manag. 2020, 32, 176–198. [Google Scholar] [CrossRef]
  67. Becerra Arévalo, N.P.; Calles Carrasco, M.F.; Toasa Espinoza, J.L.; Velasteguí Córdova, M. Neutrosophic AHP for the prioritization of requirements for a computerized facial recognition system. Neutrosophic Sets Syst. 2020, 34, 158–168. [Google Scholar]
  68. Zadeh, L.A. Information and control. Fuzzy Sets 1965, 8, 338–353. [Google Scholar]
  69. Atanassov, K. Intuitionistic fuzzy sets. Fuzzy Sets Syst. 1986, 20, 87–96. [Google Scholar] [CrossRef]
  70. Lin, P.J.; Shiue, Y.C.; Tzeng, G.H.; Huang, S.L. Developing a sustainable long-term ageing health care system using the DANP-mV model: Empirical case of Taiwan. Int. J. Environ. Res. Public Health 2019, 16, 1349. [Google Scholar] [CrossRef] [Green Version]
  71. Tsai, P.H. Strategic evaluation criteria to assess competitiveness of the service industry in Taiwan. J. Policy Model. 2020, 42, 1287–1309. [Google Scholar] [CrossRef]
  72. Tsai, P.H.; Lin, G.Y.; Zheng, Y.L.; Chen, Y.C.; Chen, P.Z.; Su, Z.C. Exploring the effect of Starbucks’ green marketing on consumers’ purchase decisions from consumers’ perspective. J. Retail. Consum. Serv. 2020, 56, 102162. [Google Scholar] [CrossRef]
  73. Zhu, B.W.; Zhang, J.R.; Tzeng, G.H.; Huang, S.L.; Xiong, L. Public open space development for elderly people by using the DANP-V model to establish continuous improvement strategies towards a sustainable and healthy aging society. Sustainability 2017, 9, 420. [Google Scholar] [CrossRef] [Green Version]
  74. Mishra, A.R.; Rani, P.; Pandey, K.; Mardani, A.; Streimikis, J.; Streimikiene, D.; Alrasheedi, M. Novel multi-criteria intuitionistic fuzzy SWARA–COPRAS approach for sustainability evaluation of the bioenergy production process. Sustainability 2020, 12, 4155. [Google Scholar] [CrossRef]
  75. Kilic, H.S.; Yalcin, A.S. Comparison of municipalities considering environmental sustainability via neutrosophic DEMATEL based TOPSIS. Socio Econ. Plan. Sci. 2020, 75, 100827. [Google Scholar] [CrossRef]
  76. Zavadskas, E.K.; Podvezko, V. Integrated determination of objective criteria weights in MCDM. Int. J. Inf. Technol. Decis. Mak. 2016, 15, 267–283. [Google Scholar] [CrossRef]
  77. Biswas, T.K.; Chaki, S.; Das, M.C. MCDM technique application to the selection of an Indian institute of technology. Oper. Res. Eng. Sci. Theory Appl. 2019, 2, 65–76. [Google Scholar] [CrossRef]
  78. Peng, K.H.; Tzeng, G.H. Exploring heritage tourism performance improvement for making sustainable development strategies using the hybrid-modified MADM model. Curr. Issues Tour. 2019, 22, 921–947. [Google Scholar] [CrossRef]
  79. Yang, K.; Zhu, N.; Chang, C.; Wang, D.; Yang, S.; Ma, S. A methodological concept for phase change material selection based on multi-criteria decision making (MCDM): A case study. Energy 2018, 165, 1085–1096. [Google Scholar] [CrossRef]
  80. Altig, D.; Baker, S.; Barrero, J.M.; Bloom, N.; Bunn, P.; Chen, S.; Davis, S.J.; Leather, J.; Meyer, B.; Mihaylov, E.; et al. Economic uncertainty before and during the COVID-19 pandemic. J. Public Econ. 2020, 191, 104274. [Google Scholar] [CrossRef]
  81. Smarandache, F. Neutrosophy: Neutrosophic Probability, Set, and Logic: Analytic Synthesis & Synthetic Analysis; American Research Press: Santa Fe, NM, USA, 1998. [Google Scholar]
  82. Awang, A.; Aizam, N.A.H.; Abdullah, L. An integrated decision-making method based on neutrosophic numbers for investigating factors of coastal erosion. Symmetry 2019, 11, 328. [Google Scholar] [CrossRef] [Green Version]
  83. Lo, H.W.; Liou, J.J. A novel multiple-criteria decision-making-based FMEA model for risk assessment. Appl. Soft Comput. 2018, 73, 684–696. [Google Scholar] [CrossRef]
  84. Dzeng, R.J.; Wen, K.S. Evaluating project teaming strategies for construction of Taipei 101 using resource-based theory. Int. J. Proj. Manag. 2005, 23, 483–491. [Google Scholar] [CrossRef]
  85. Gupta, H.; Barua, M.K. Supplier selection among SMEs on the basis of their green innovation ability using BWM and fuzzy TOPSIS. J. Clean. Prod. 2017, 152, 242–258. [Google Scholar] [CrossRef]
  86. Yahia, Y.E.; Liu, H.; Khan, M.A.; Shah, S.S.H.; Islam, M.A. The impact of foreign direct investment on domestic investment: Evidence from Sudan. Int. J. Econ. Financ. Issues 2018, 8, 1–10. [Google Scholar]
  87. Subramanian, A.; Satyanath, S. What Determines Long-Run Macroeconomic Stability? Democratic Institutions; International Monetary Fund: Washington, DC, USA, 2004. [Google Scholar]
Figure 1. Comparison of the novel practice and the original practice.
Axioms 10 00140 g001
Figure 2. The flowchart of the proposed model.
Axioms 10 00140 g002
Figure 3. The inter-quartile range (IQR).
Axioms 10 00140 g003
Figure 4. INRM of the core evaluation system.
Axioms 10 00140 g004
Figure 5. Sensitivity analysis of expert weights.
Axioms 10 00140 g005
Table 1. GCI pillars and indicators.
NoPillarIndicators
P1InstitutionsSecurity, social capital, checks and balances, public-sector performance, transparency, property rights, corporate governance, future orientation of government.
P2InfrastructureTransport infrastructure, utility infrastructure.
P3ICT adoptionMobile-cellular telephone, mobile-broad, fixed-broadband internet,
fiber internet, internet users.
P4Macroeconomic stabilityInflation, debt dynamics.
P5HealthHealthy life expectancy
P6SkillsCurrent workforce, future workforce.
P7Product marketDomestic market competition, trade openness.
P8Labor marketFlexibility, meritocracy and incentivization.
P9Financial systemDepth, stability
P10Market sizeGross domestic product, imports of goods and services.
P11Business dynamismAdministrative requirement, entrepreneurial culture.
P12Innovation capabilityDiversity and collaboration, research and development,
commercialization.
Table 2. Background information of decision-making experts.
CodeGenderOrganizationAgeTitleEducationSeniority
1MEducation55ProfessorPHD25
2MGovernment56PresidentPHD25
3MFoundation60Associate DeanPHD30
4MCompany58Chairman of the BoardPHD25
5FGuild62Union PresidentMS30
Table 3. Using fuzzy Delphi to construct the core evaluation framework.
CODEIndicatorLMUo>8.384No
I1Security88.618108.873KEEPC1
I2Social capital35.76985.590Delete
I3Checks and balances67.56097.520Delete
I4Public-sector performance46.86896.623Delete
I5Transparency67.86297.621Delete
I6Property rights78.243108.414KEEPC2
I7Corporate governance55.94475.981Delete
I8Future orientation of government67.489107.830Delete
I9Transport infrastructure88.618108.873KEEPC3
I10Utility infrastructure78.243108.414KEEPC4
I11ICT adoption66.95286.984Delete
I12Macroeconomic stability88.963108.988KEEPC5
I13Health88.32098.440KEEPC6
I14Current workforce88.00088.000Delete
I15Future workforce56.80496.935Delete
I16Domestic market competition77.884108.295Delete
I17Trade openness67.23097.410Delete
I18Flexibility77.95897.986Delete
I19Meritocracy and incentivization56.25776.086Delete
I20Depth56.54286.514Delete
I21Stability66.95286.984Delete
I22Administrative requirements66.31676.439Delete
I23Entrepreneurial culture55.84886.283Delete
I24Diversity and collaboration56.46396.821Delete
I25Research and development77.95897.986Delete
I26Commercialization78.243108.414KEEPC7
Note: The threshold values are Q1: 6.672, Q2: 7.570, and Q3: 8.384 (inter quartile range, IQR).
Table 4. The core evaluation framework.
CODECriteriaDefinition
C1SecurityRefers to the local organized crime, homicide rate, terrorism incident, and reliability of police service
C2Property rightsRefers to property rights, intellectual property protection, and quality of land administration
C3Transport infrastructureThe quality of the local road network and infrastructure, railroad density and efficiency of train services, connectivity of airport and liner shipping, and efficiency of air transport services and seaport services.
C4Utility infrastructureElectricity supply quality and reliability of water supply
C5Macroeconomic stabilityRefers to inflation and debt dynamics
C6HealthHealthy life expectancy
C7CommercializationBuyer sophistication and trademark applications
Table 5. Initial expert opinion evaluation.
Crisp C1C2C3C4C5C6C7
Exp1C10 (0, 0, 0)4 (0.9, 0.2, 0.1)4 (0.9, 0.2, 0.1)4 (0.8, 0.3, 0.2)4 (0.8, 0.3, 0.2)3 (0.7, 0.3, 0.3)3 (0.8, 0.3, 0.2)
C22 (0.7, 0.2, 0.3)0 (0, 0, 0)0 (0.8, 0.3, 0.2)3 (0.8, 0.2, 0.2)3 (0.8, 0.2, 0.2)0 (0.8, 0.3, 0.2)2 (0.8, 0.2, 0.2)
C33 (0.8, 0.2, 0.2)0 (0.7, 0.3, 0.3)0 (0, 0, 0)2 (0.8, 0.2, 0.2)3 (0.8, 0.2, 0.2)0 (0.7, 0.3, 0.3)3 (0.8, 0.2, 0.2)
C41 (0.8, 0.2, 0.2)3 (0.9, 0.1, 0.1)3 (0.9, 0.1, 0.1)0 (0, 0, 0)4 (0.9, 0.1, 0.1)1 (0.8, 0.2, 0.2)3 (0.9, 0.1, 0.1)
C53 (0.9, 0.1, 0.1)3 (0.9, 0.1, 0.1)4 (0.9, 0.1, 0.1)4 (0.9, 0.1, 0.1)0 (0, 0, 0)1 (0.9, 0.1, 0.1)3 (0.9, 0.1, 0.1)
C61 (0.8, 0.2, 0.2)1 (0.8, 0.2, 0.2)1 (0.8, 0.2, 0.2)0 (0.7, 0.2, 0.3)2 (0.8, 0.2, 0.2)0 (0, 0, 0)1 (0.8, 0.2, 0.2)
C72 (0.8, 0.2, 0.2)1 (0.7, 0.2, 0.3)3 (0.8, 0.1, 0.2)3 (0.8, 0.1, 0.2)3 (0.8, 0.1, 0.2)0 (0.7, 0.2, 0.3)0 (0, 0, 0)
Exp2C10 (0, 0, 0)4 (0.9, 0.2, 0.1)4 (0.9, 0.1, 0.1)2 (0.9, 0.3, 0.1)2 (0.9, 0.3, 0.1)4 (0.9, 0.3, 0.1)4 (0.9, 0.3, 0.1)
C24 (0.9, 0.1, 0.1)0 (0, 0, 0)2 (0.7, 0.1, 0.3)2 (0.9, 0.1, 0.1)2 (0.9, 0.1, 0.1)2 (0.7, 0.1, 0.3)2 (0.9, 0.1, 0.1)
C34 (0.9, 0.1, 0.1)4 (0.9, 0.1, 0.1)0 (0, 0, 0)4 (0.9, 0.1, 0.1)4 (0.9, 0.1, 0.1)2 (0.9, 0.1, 0.1)4 (0.9, 0.1, 0.1)
C44 (0.9, 0.1, 0.1)2 (0.8, 0.1, 0.2)2 (0.8, 0.1, 0.2)0 (0, 0, 0)2 (0.8, 0.1, 0.2)4 (0.9, 0.1, 0.1)2 (0.8, 0.1, 0.2)
C54 (0.9, 0.1, 0.1)4 (0.9, 0.1, 0.1)4 (0.9, 0.1, 0.1)4 (0.9, 0.1, 0.1)0 (0, 0, 0)4 (0.9, 0.1, 0.1)4 (0.9, 0.1, 0.1)
C64 (0.9, 0.1, 0.1)3 (0.9, 0.1, 0.1)4 (0.9, 0.1, 0.1)4 (0.9, 0.1, 0.1)4 (0.9, 0.1, 0.1)0 (0, 0, 0)4 (0.9, 0.1, 0.1)
C72 (0.8, 0.1, 0.2)4 (0.8, 0.1, 0.2)4 (0.8, 0.1, 0.2)2 (0.8, 0.1, 0.2)4 (0.8, 0.1, 0.2)4 (0.8, 0.1, 0.2)0 (0, 0, 0)
Expi
Expk
Note: Crisp (truth-membership function, indeterminacy-membership function, falsity-membership function).
Table 6. Integration of crisp values and uncertainties.
C1C2C3C4C5C6C7
Exp1C1(0, 0, 0)(0.9, 0.2, 0.1)(0.9, 0.2, 0.1)(0.8, 0.3, 0.2)(0.8, 0.3, 0.2)(0.5, 0.2, 0.2)(0.6, 0.2, 0.2)
C2(0.4, 0.1, 0.2)(0, 0, 0)(0, 0, 0)(0.6, 0.2, 0.2)(0.6, 0.2, 0.2)(0, 0, 0)(0.4, 0.1, 0.1)
C3(0.6, 0.2, 0.2)(0, 0, 0)(0, 0, 0)(0.4, 0.1, 0.1)(0.6, 0.2, 0.2)(0, 0, 0)(0.6, 0.2, 0.2)
C4(0.2, 0.1, 0.1)(0.7, 0.1, 0.1)(0.7, 0.1, 0.1)(0, 0, 0)(0.9, 0.1, 0.1)(0.2, 0.1, 0.1)(0.7, 0.1, 0.1)
C5(0.7, 0.1, 0.1)(0.7, 0.1, 0.1)(0.9, 0.1, 0.1)(0.9, 0.1, 0.1)(0, 0, 0)(0.2, 0, 0)(0.7, 0.1, 0.1)
C6(0.2, 0.1, 0.1)(0.2, 0.1, 0.1)(0.2, 0.1, 0.1)(0, 0, 0)(0.4, 0.1, 0.1)(0, 0, 0)(0.2, 0.1, 0.1)
C7(0.4, 0.1, 0.1)(0.2, 0.1, 0.1)(0.6, 0.1, 0.2)(0.6, 0.1, 0.2)(0.6, 0.1, 0.2)(0, 0, 0)(0, 0, 0)
Exp2C1(0, 0, 0)(0.9, 0.2, 0.1)(0.9, 0.1, 0.1)(0.5, 0.2, 0.1)(0.5, 0.2, 0.1)(0.9, 0.3, 0.1)(0.9, 0.3, 0.1)
C2(0.9, 0.1, 0.1)(0, 0, 0)(0.4, 0.1, 0.2)(0.5, 0.1, 0.1)(0.5, 0.1, 0.1)(0.4, 0.1, 0.2)(0.5, 0.1, 0.1)
C3(0.9, 0.1, 0.1)(0.9, 0.1, 0.1)(0, 0, 0)(0.9, 0.1, 0.1)(0.9, 0.1, 0.1)(0.5, 0.1, 0.1)(0.9, 0.1, 0.1)
C4(0.9, 0.1, 0.1)(0.4, 0.1, 0.1)(0.4, 0.1, 0.1)(0, 0, 0)(0.4, 0.1, 0.1)(0.9, 0.1, 0.1)(0.4, 0.1, 0.1)
C5(0.9, 0.1, 0.1)(0.9, 0.1, 0.1)(0.9, 0.1, 0.1)(0.9, 0.1, 0.1)(0, 0, 0)(0.9, 0.1, 0.1)(0.9, 0.1, 0.1)
C6(0.9, 0.1, 0.1)(0.7, 0.1, 0.1)(0.9, 0.1, 0.1)(0.9, 0.1, 0.1)(0.9, 0.1, 0.1)(0, 0, 0)(0.9, 0.1, 0.1)
C7(0.4, 0.1, 0.1)(0.8, 0.1, 0.2)(0.8, 0.1, 0.2)(0.4, 0.1, 0.1)(0.8, 0.1, 0.2)(0.8, 0.1, 0.2)(0, 0, 0)
Expi
Expk
Table 7. Using entropy to obtain the weights of experts.
C1C2C1C3C1CC1C7C2C1C2C2C2CC2C7CCC7C7eieiwRank
Exp104320200.8940.1060.2832
Exp204440200.9440.0560.1483
Exp304430300.9470.0530.1405
Exp404330300.9460.0540.1434
Exp503130100.8920.1080.2861
Table 8. Deneutrosophication and weights assigned to experts.
wDEC1C2C3C4C5C6C7w × DEC1C2C3C4C5C6C7
Exp10.283C10.4230.8590.8590.7620.7620.670.721C10.1190.2430.2430.2150.2150.1890.204
C20.6110.4230.4230.7390.7390.4230.644C20.1730.1190.1190.2090.2090.1190.182
C30.7390.4230.4230.6440.7390.4230.739C30.2090.1190.1190.1820.2090.1190.209
C40.5360.8030.8030.4230.90.5360.803C40.1520.2270.2270.1190.2540.1520.227
C50.8030.8030.90.90.4230.5520.803C50.2270.2270.2540.2540.1190.1560.227
C60.5360.5360.5360.4230.6440.4230.536C60.1520.1520.1520.1190.1820.1190.152
C70.6440.5210.750.750.750.4230.423C70.1820.1470.2120.2120.2120.1190.119
Exp20.148C10.4230.8590.90.670.670.8090.809C10.0630.1270.1330.0990.0990.120.12
C20.90.4230.6140.680.680.6140.68C20.1330.0630.0910.1010.1010.0910.101
C30.90.90.4230.90.90.680.9C30.1330.1330.0630.1330.1330.1010.133
C40.90.6480.6480.4230.6480.90.648C40.1330.0960.0960.0630.0960.1330.096
C50.90.90.90.90.4230.90.9C50.1330.1330.1330.1330.0630.1330.133
C60.90.8030.90.90.90.4230.9C60.1330.1190.1330.1330.1330.0630.133
C70.6480.8270.8270.6480.8270.8270.423C70.0960.1220.1220.0960.1220.1220.063
Expj
Expk
Table 9. Direct influence relationship matrix and total influence relationship matrix.
AC1C2C3C4C5C6C7TC1C2C3C4C5C6C7
C10.4230.8440.7690.7580.6870.6320.697C12.0182.0281.9982.0431.9521.7291.935
C20.7450.4230.5910.7290.6630.5220.645C21.8971.7741.7921.8591.7761.5581.756
C30.7780.5890.4230.7410.6780.5780.722C31.9771.8781.8301.9341.8491.6301.840
C40.7140.6930.7250.4230.7350.6400.677C42.0011.9311.9211.9081.8921.6701.864
C50.8070.7540.7640.7820.4230.6520.768C52.1482.0682.0522.1031.9551.7802.001
C60.7340.6970.6520.6750.6680.4230.592C61.9401.8701.8451.8931.8191.5741.788
C70.6960.7060.7360.6780.7270.5810.423C71.9741.9111.9001.9341.8681.6401.794
Table 10. Direct influence relationship matrix and total influence matrix.
CriteriarcxRankyGroup
C113.70413.95527.6581−0.251E
C212.41213.46025.8726−1.048E
C312.93713.33726.2734−0.400E
C413.18713.67526.8633−0.488E
C514.10713.11027.21720.997C
C612.72811.58024.30871.148C
C713.02112.97825.99950.043C
Note: “r” is the degree of influence, “c” is the degree of being influenced, “x” is the total degree of influence, and “y” is the degree of net influence.
Table 11. Comparisons of novel design practices.
Original DEMATELNovel Design Practice
rcxRankyGrouprcxRankyGroup
C17.1377.09114.22810.046C13.70413.95527.6581−0.251E
C25.4336.46511.8986(1.032)E12.41213.46025.8726−1.048E
C36.0916.34612.4385(0.255)E12.93713.33726.2734−0.400E
C46.1176.67112.7893(0.554)E13.18713.67526.8633−0.488E
C57.0636.30013.36320.763C14.10713.11027.21720.997C
C65.9065.03810.94470.868C12.72811.58024.30871.148C
C76.4336.26812.70140.165C13.02112.97825.99950.043C
Table 12. Expert weights and causal relationships in different situations.
SituationExp1Exp2Exp3Exp4Exp5C1C2C3C4C5C6C7
ETP0.2830.1480.1400.1430.286EEEECCC
Run10.3560.1870.1770.1800.100CEEECCE
Run20.3170.1660.1570.1600.200CEEECCE
Run30.2770.1450.1380.1400.300EEEECCC
Run40.2380.1240.1180.1200.400EEEECCC
Run50.1980.1040.0980.1000.500EEEECCC
Run60.1580.0830.0790.0800.600EEEECCC
Run70.1190.0620.0590.0600.700EEEECCC
Run80.0790.0410.0390.0400.800EEEECCC
Run90.0400.0210.0200.0200.900EEEECCC
Note: “ETP” stands for “entropy”; “Run” stands for “situation”.
Publisher’s Note: MDPI stays neutral with regard to jurisdictional claims in published maps and institutional affiliations.

