Structural Characterizations of Aluminosilicates in Two Types of Fly Ash Samples from Shanxi Province, North China


Abstract
:1. Introduction
2. Samples and Methods
2.1. Samples
2.2. Major and Trace Element Chemistry
2.3. XRD
2.4. FTIR
2.5. MAS–NMR
2.6. XPS
3. Results and Discussion
3.1. Properties of the FA
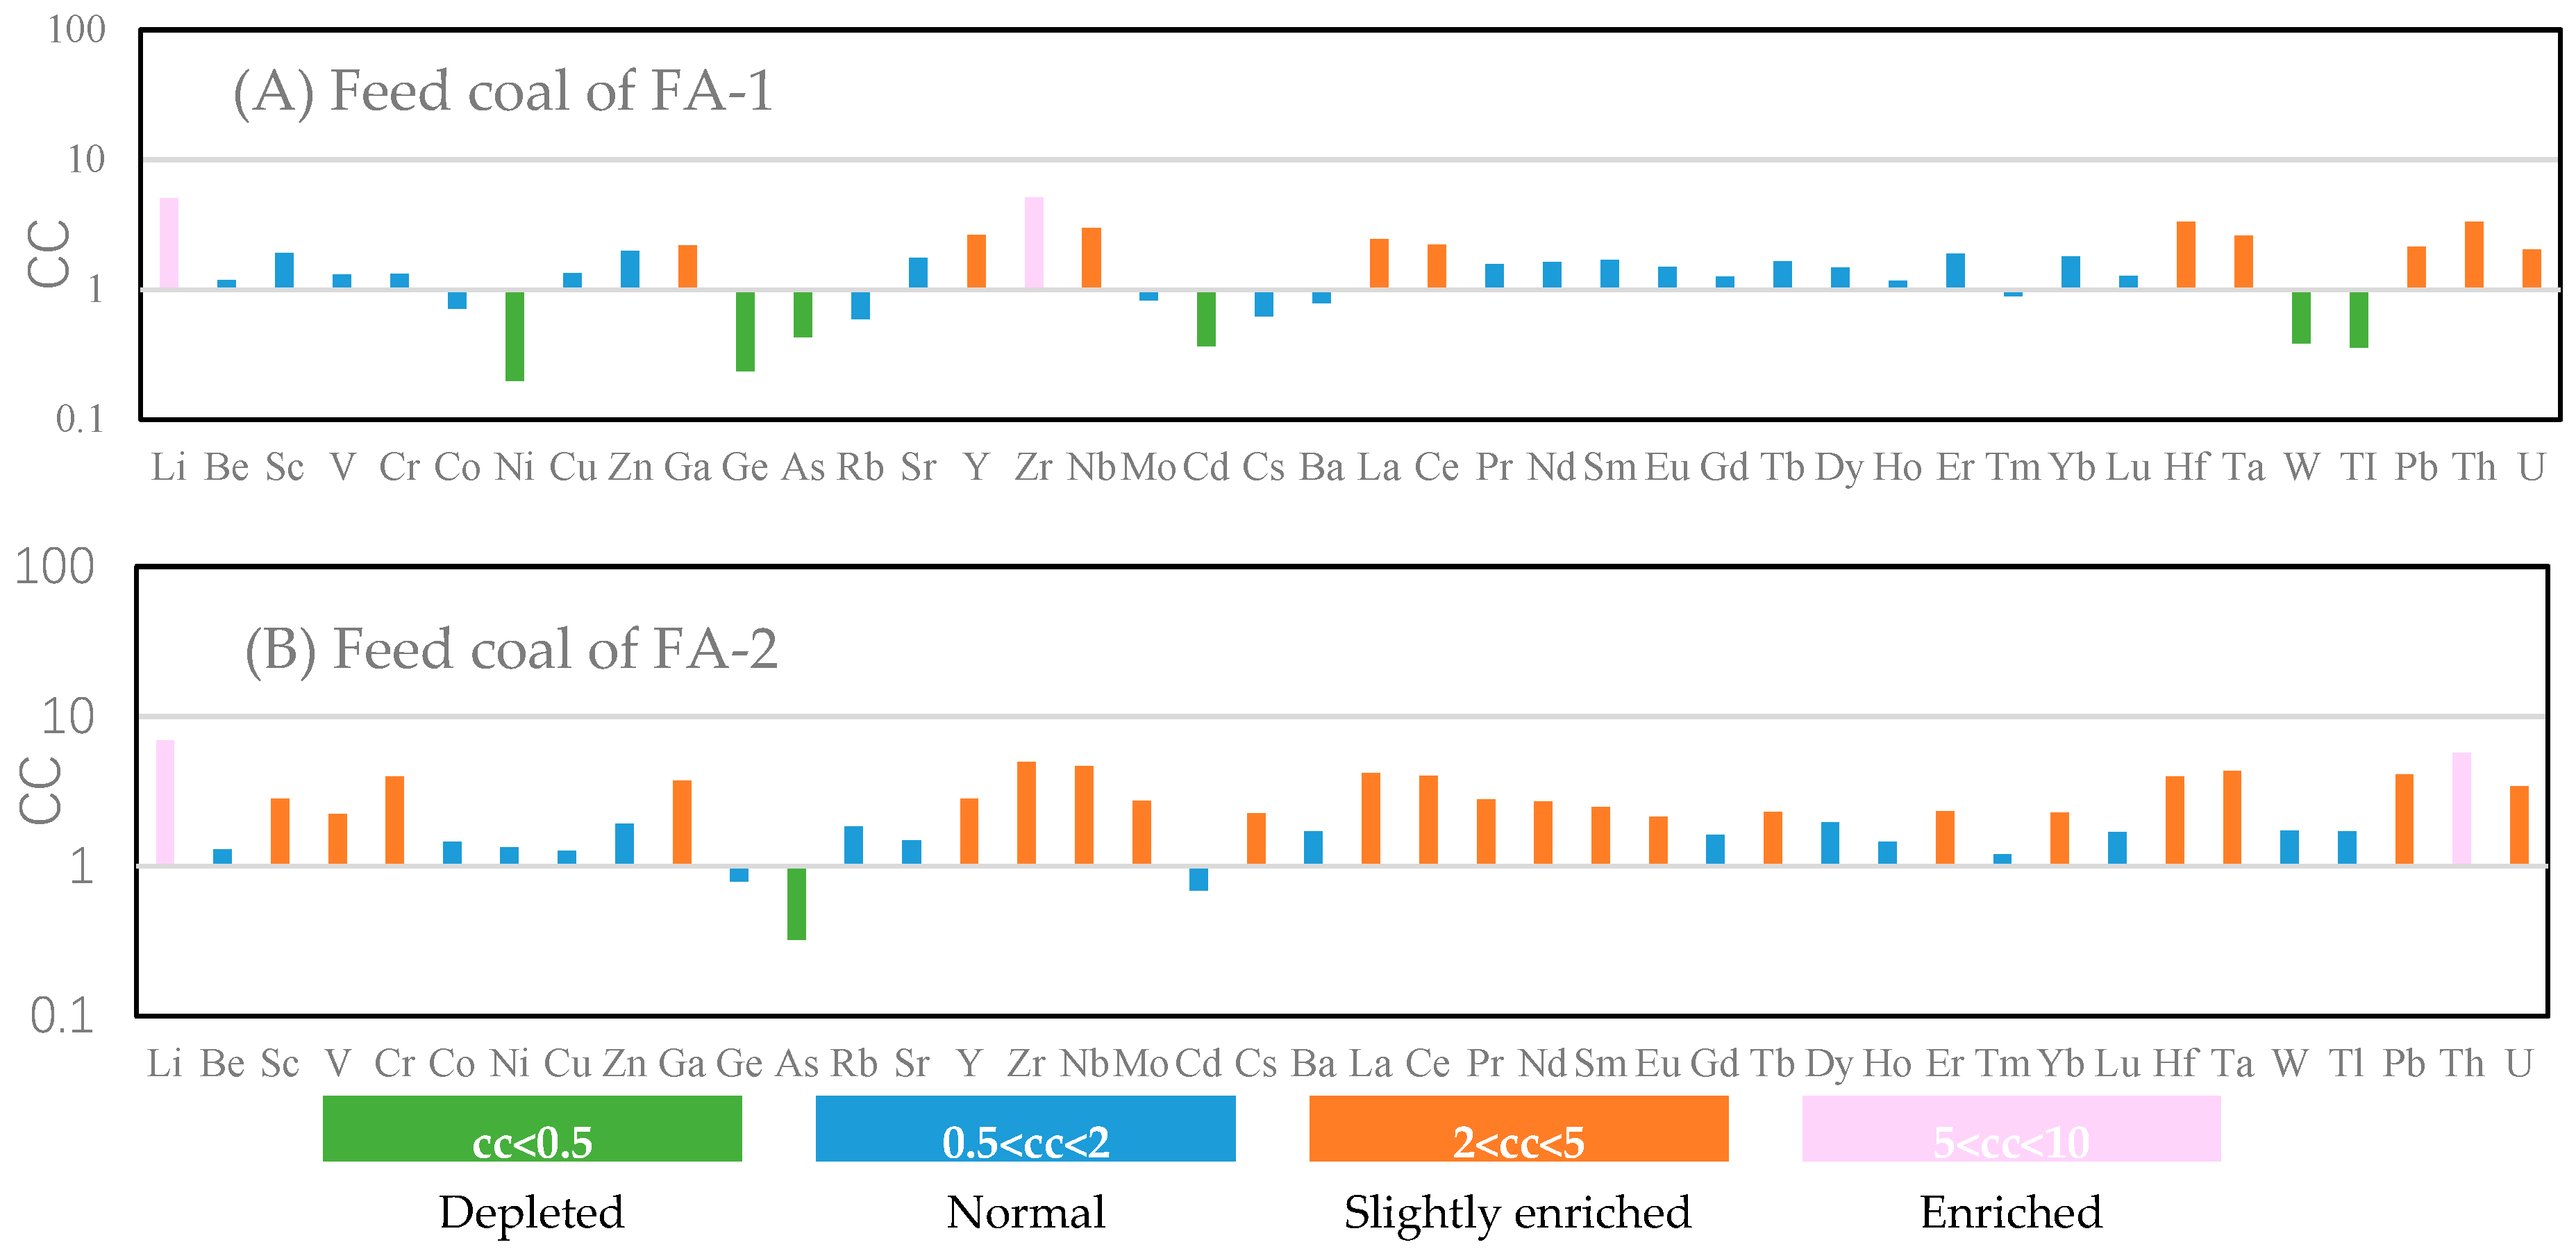
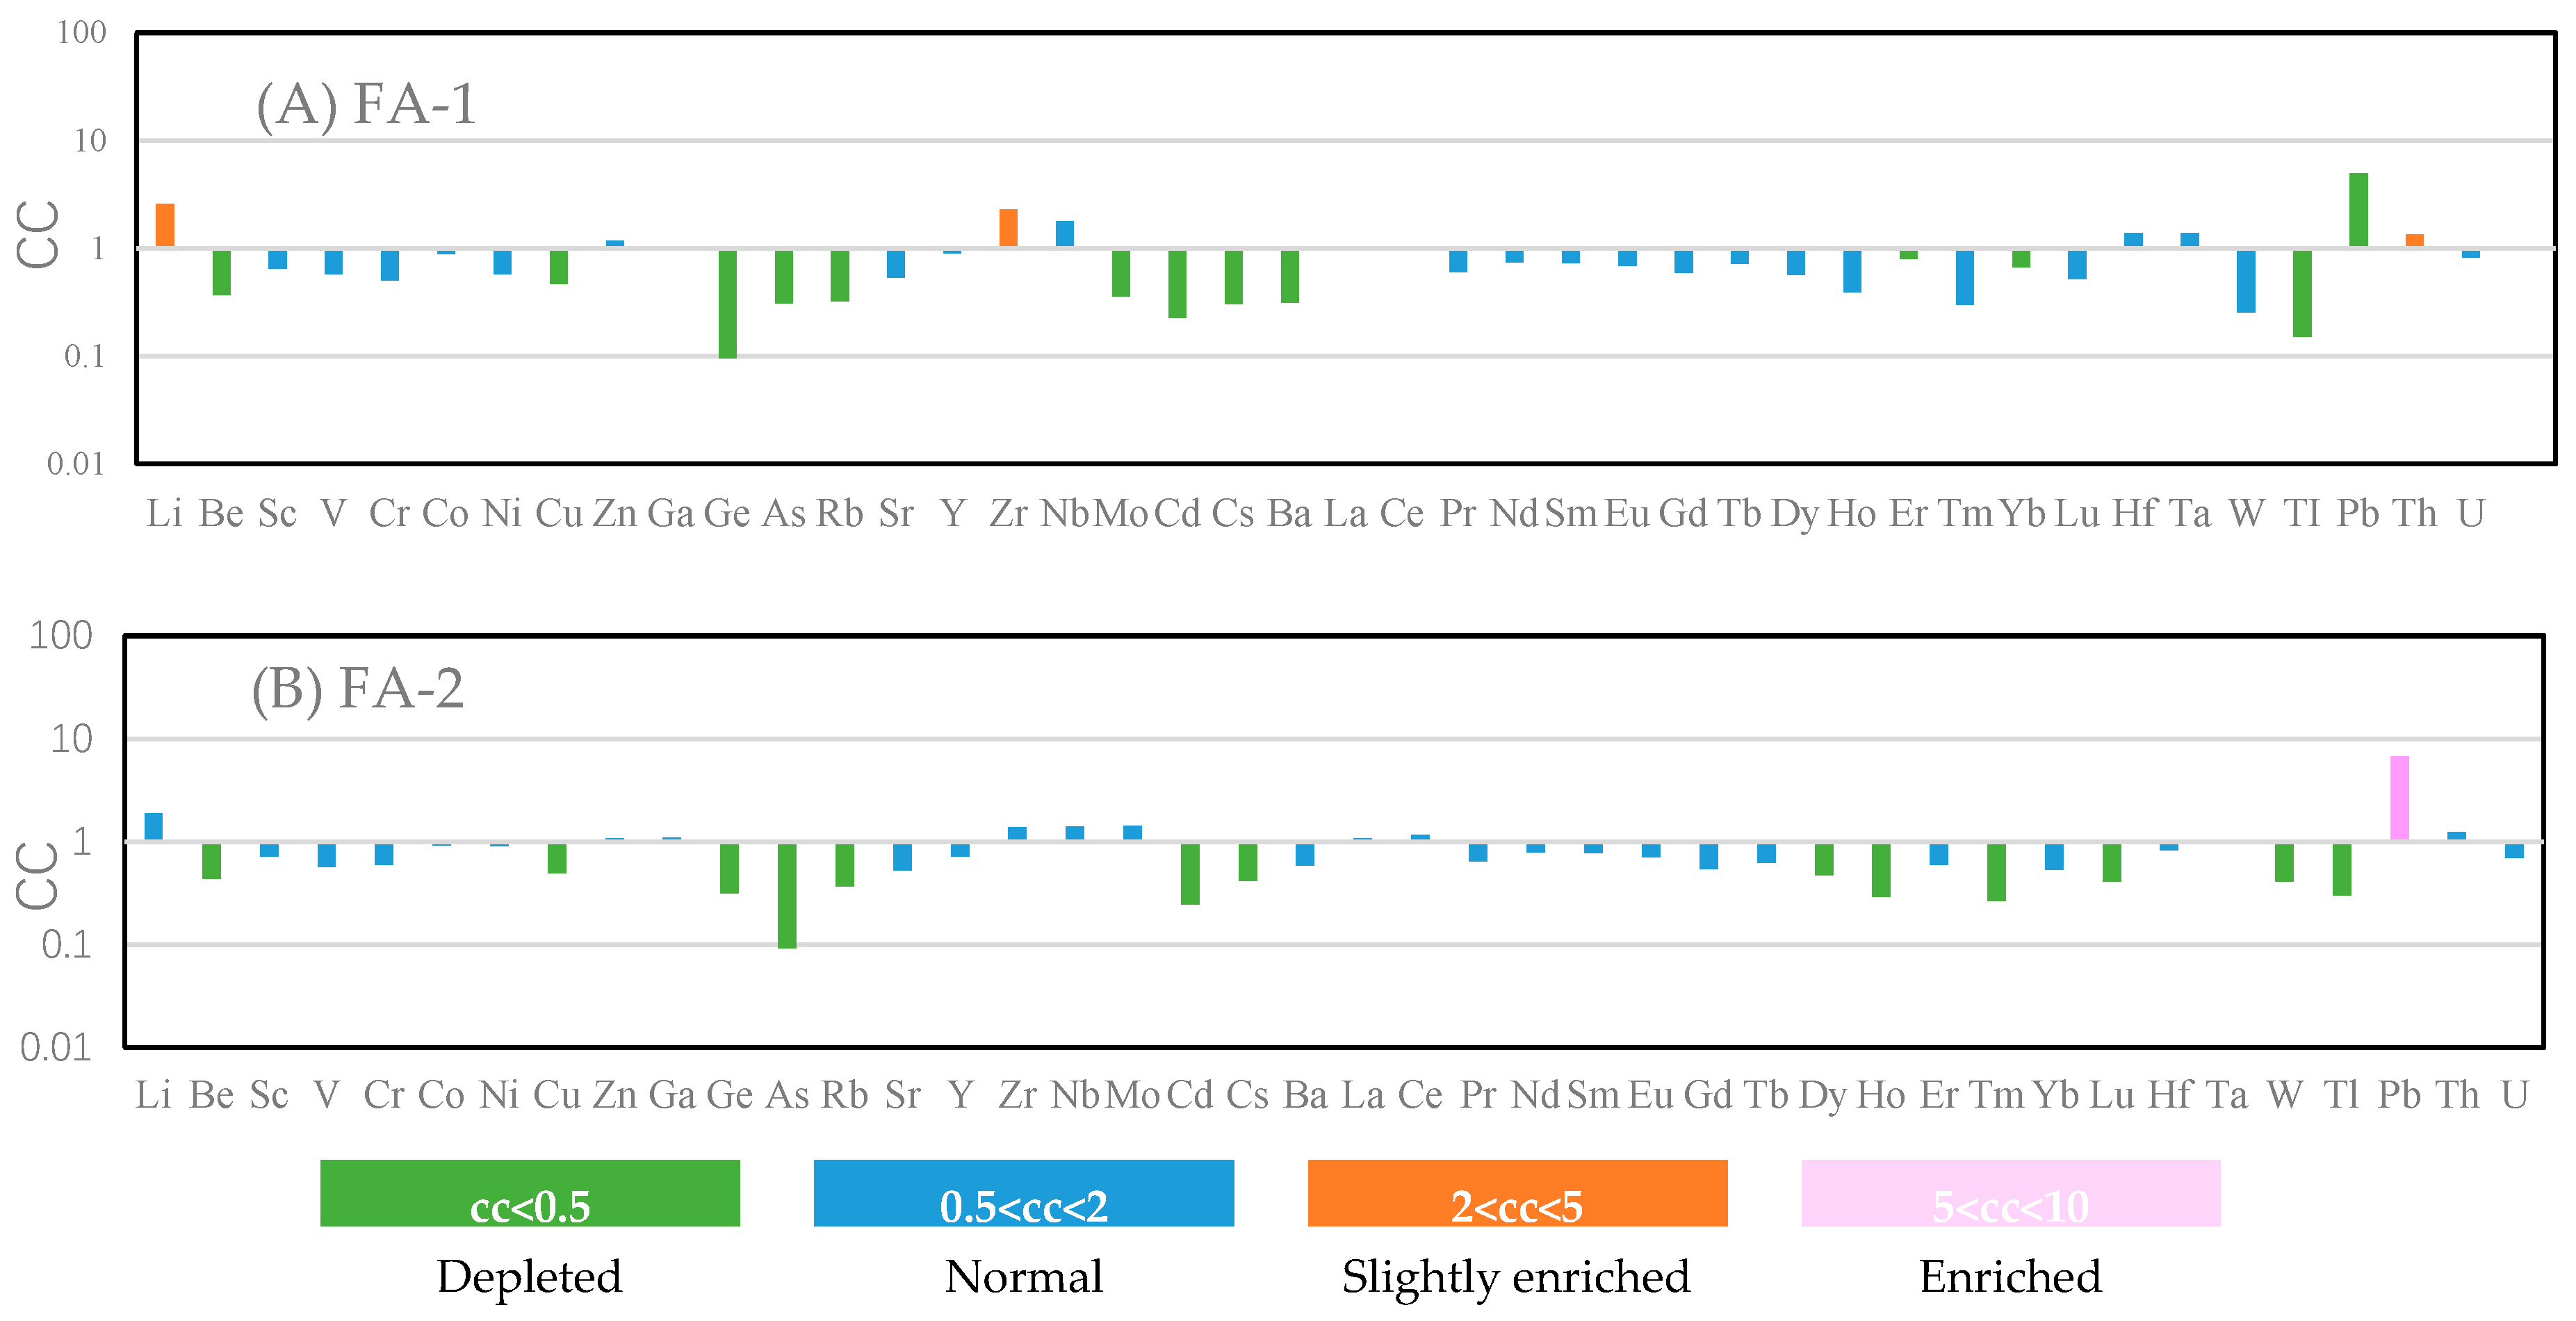
3.1.1. Major and Trace Element Chemistry
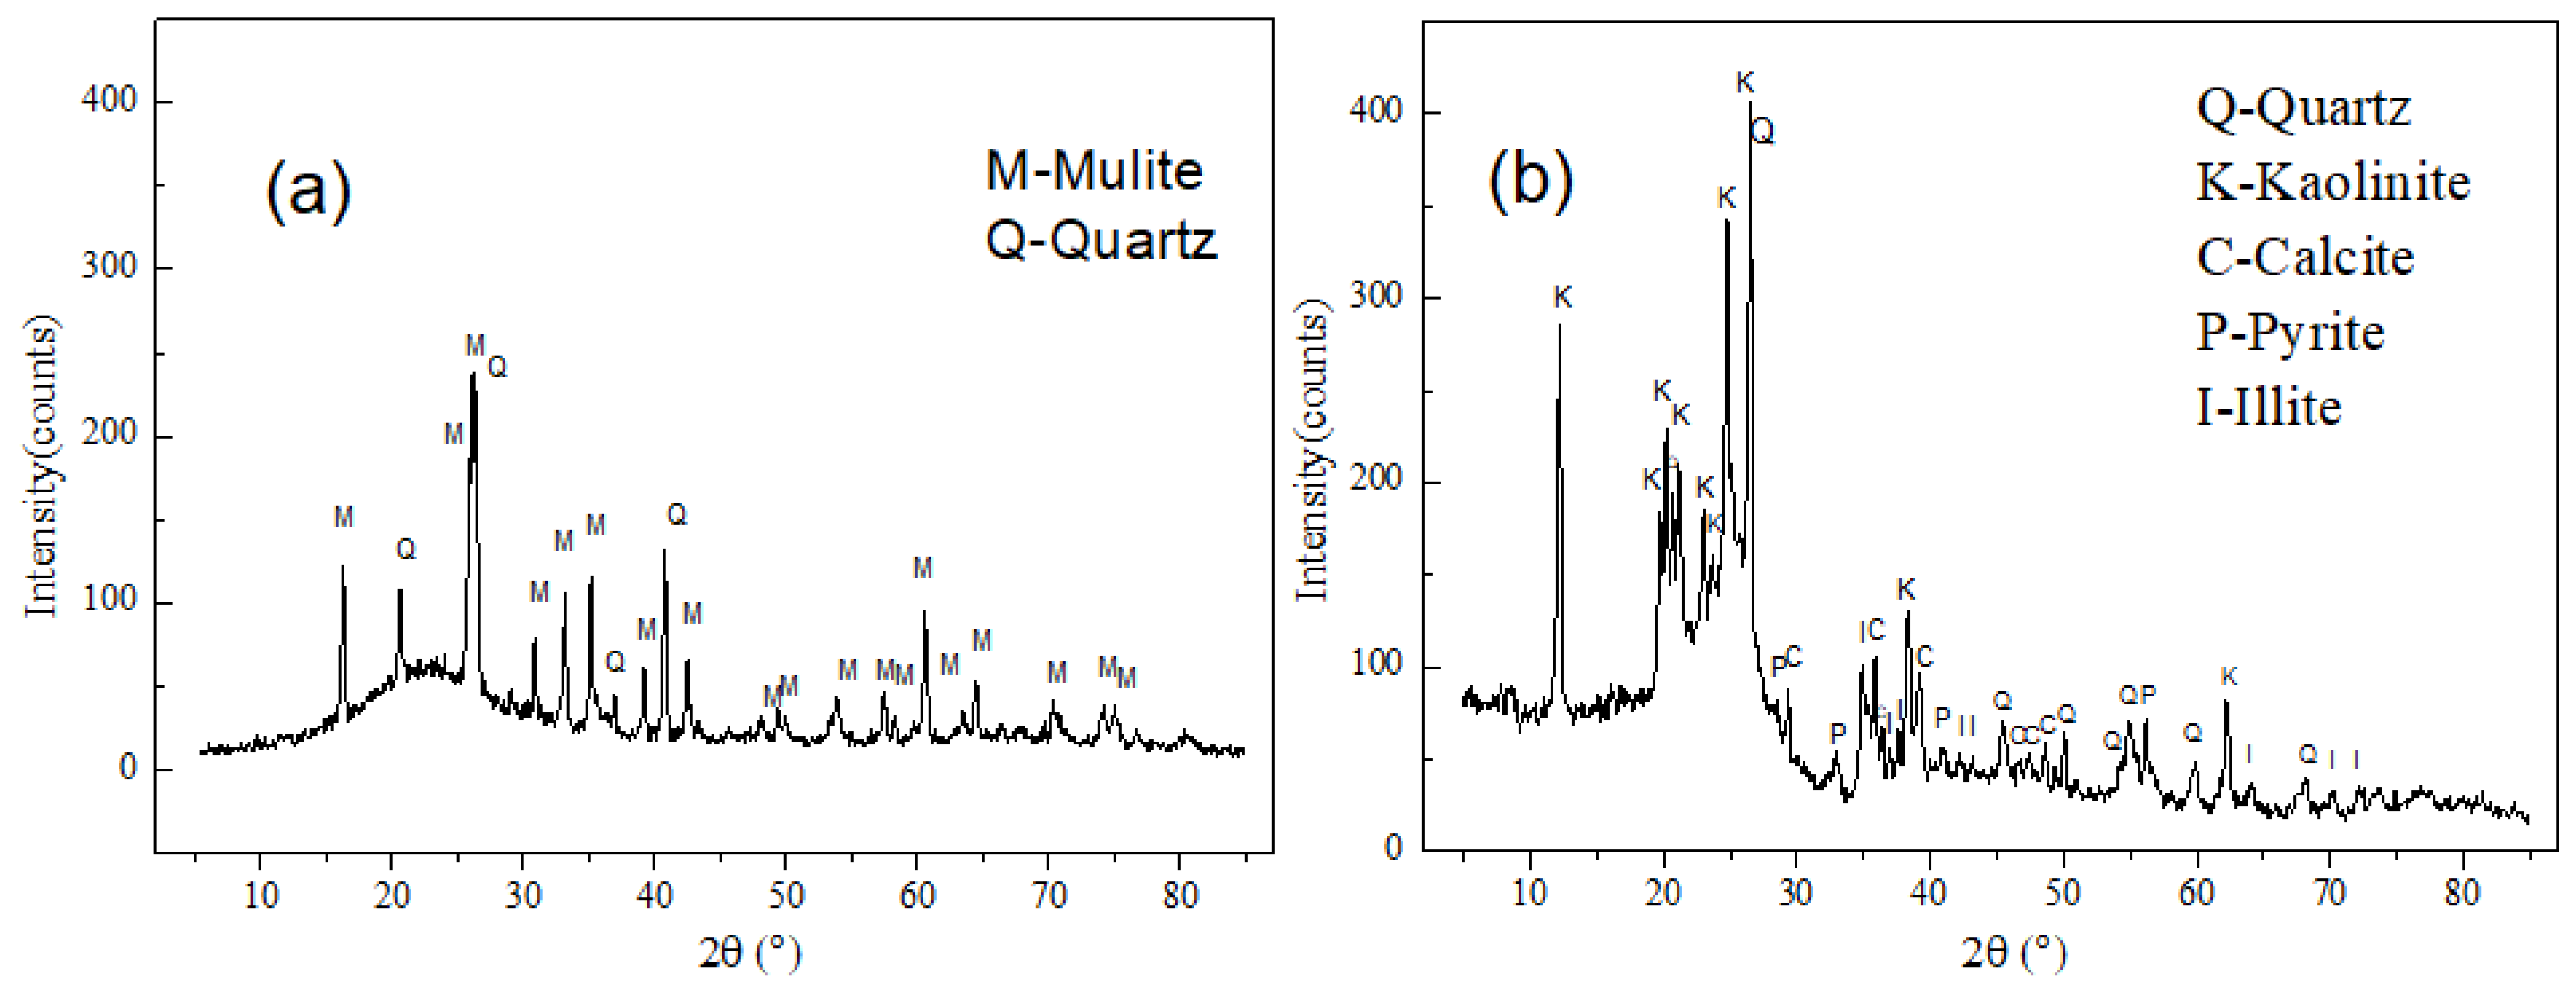
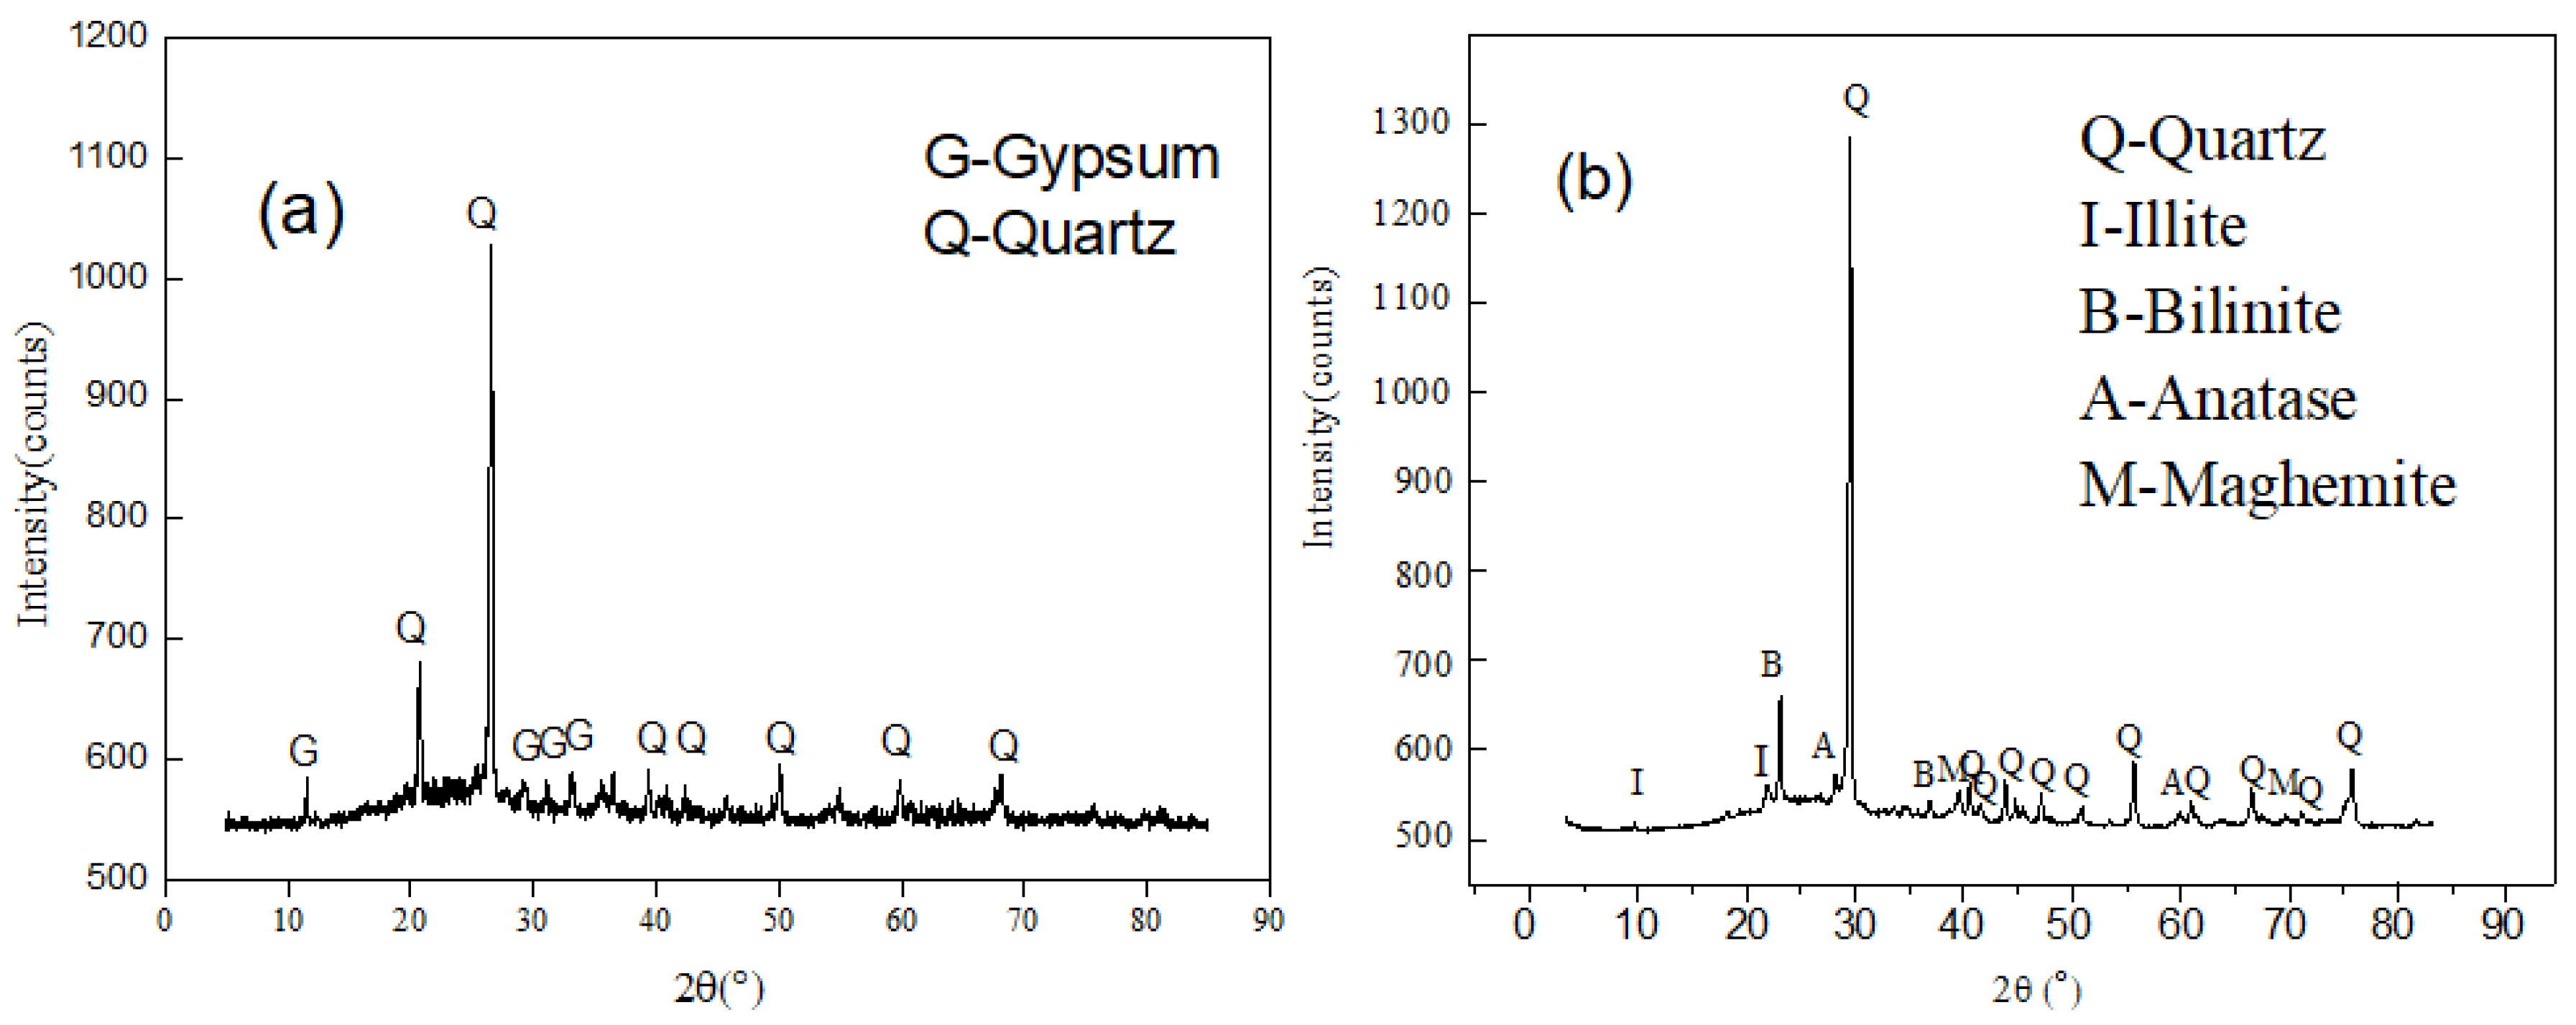
3.1.2. Mineralogy
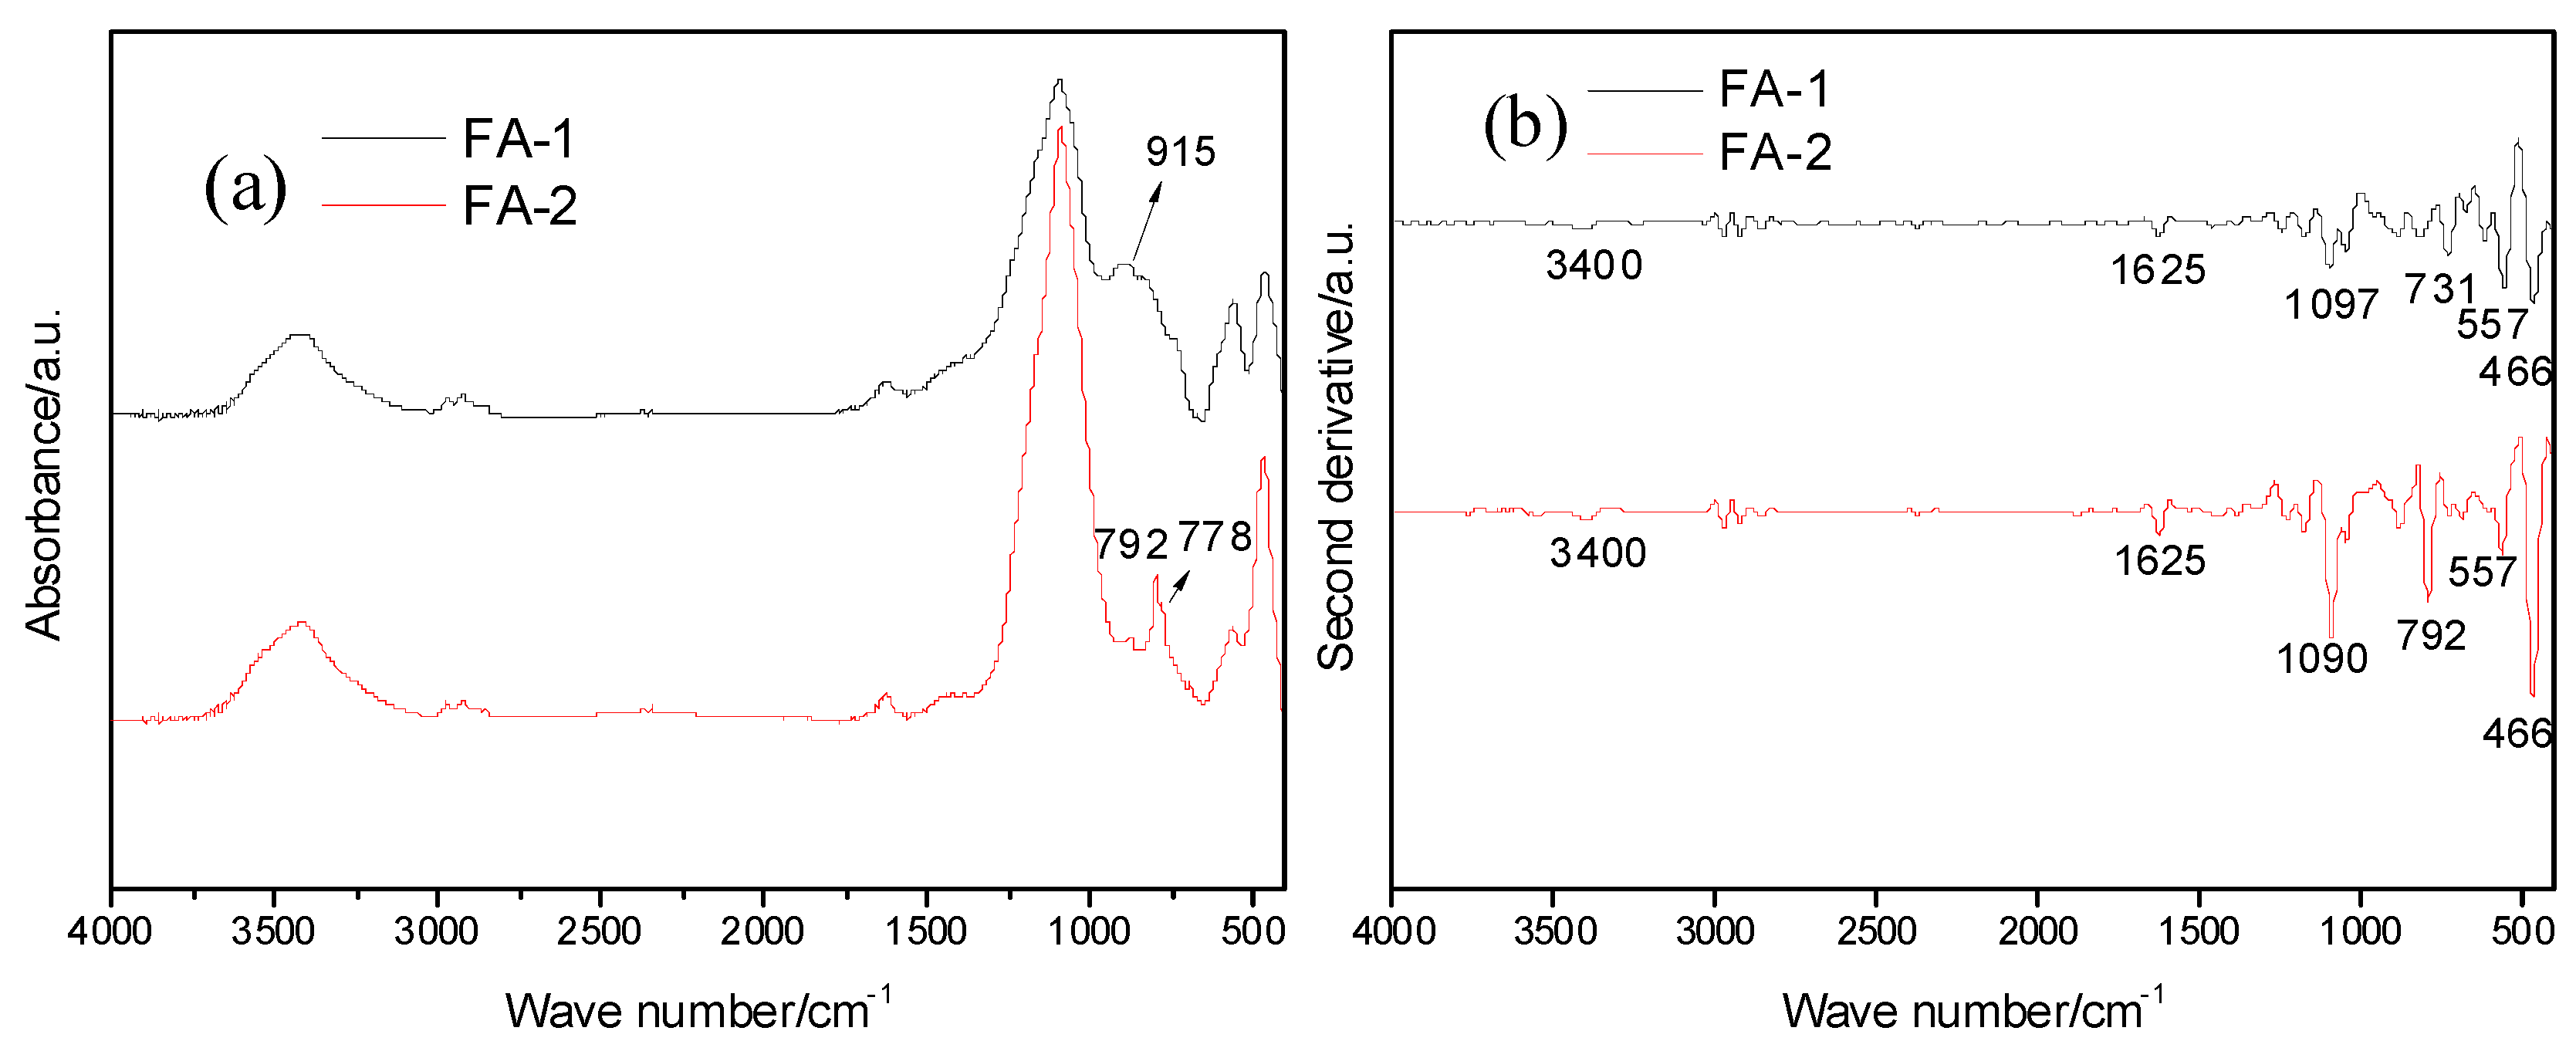
3.2. FTIR
3.3. MAS–NMR
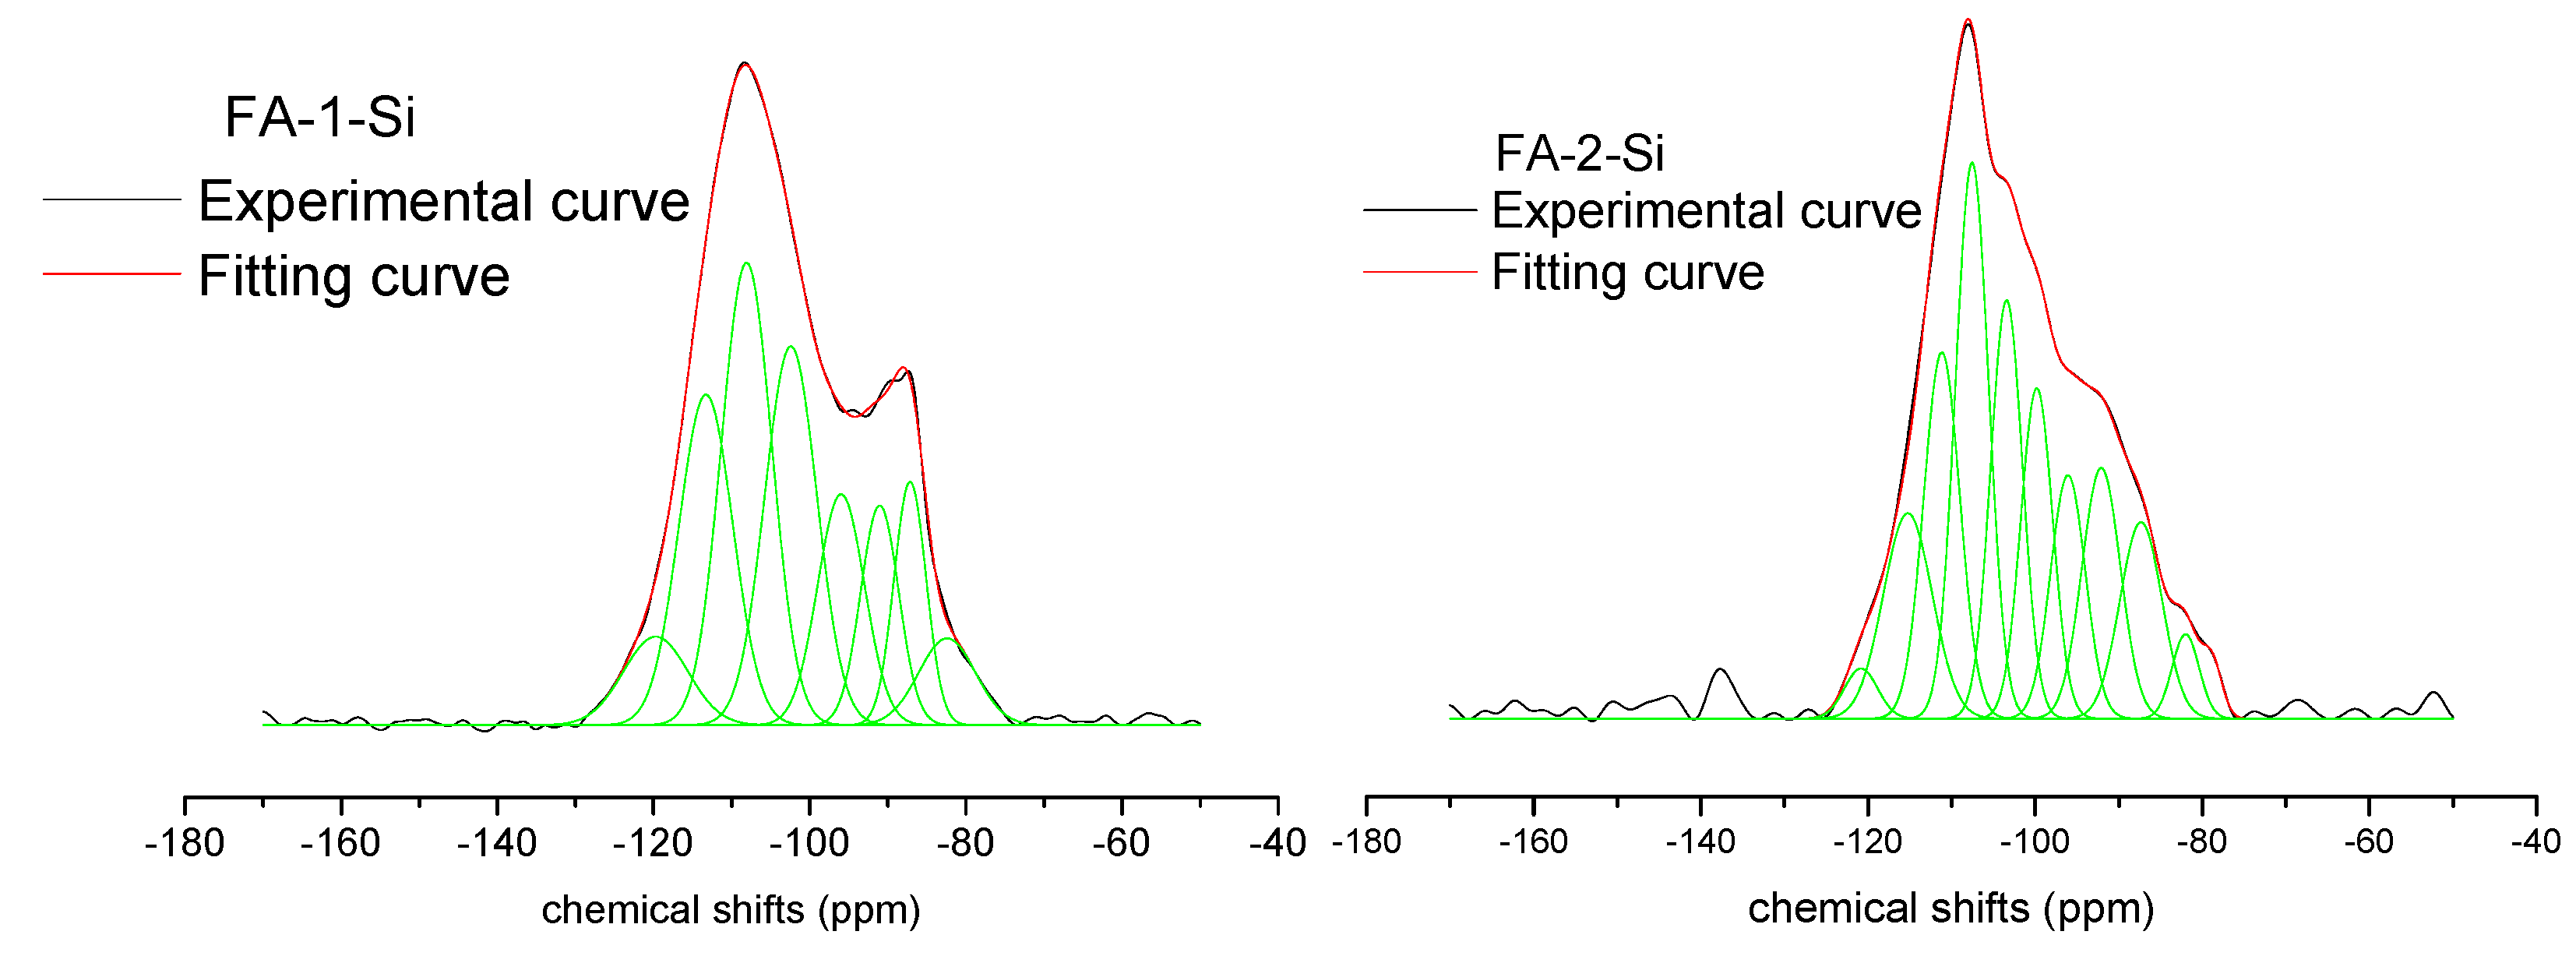
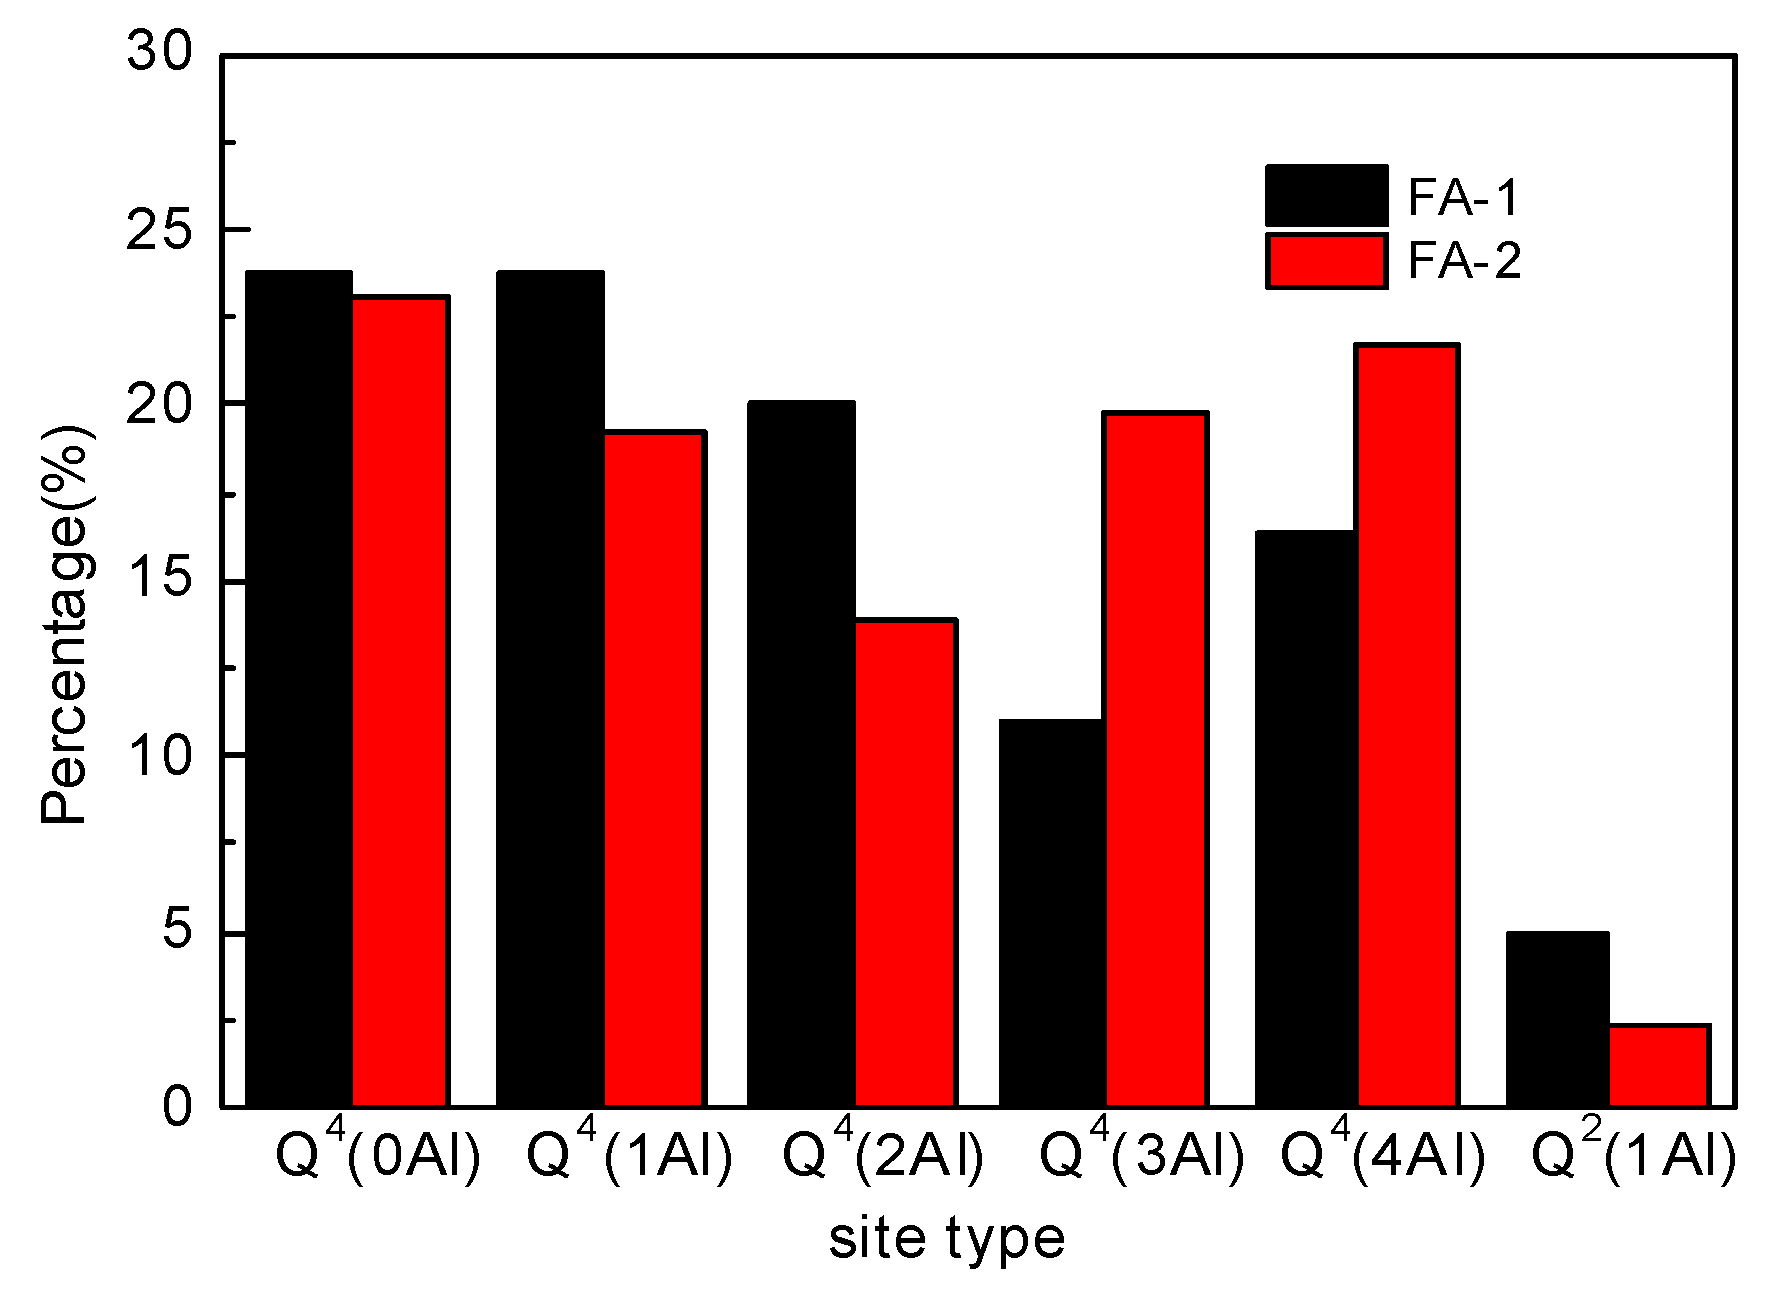
3.3.1. 29Si MAS–NMR
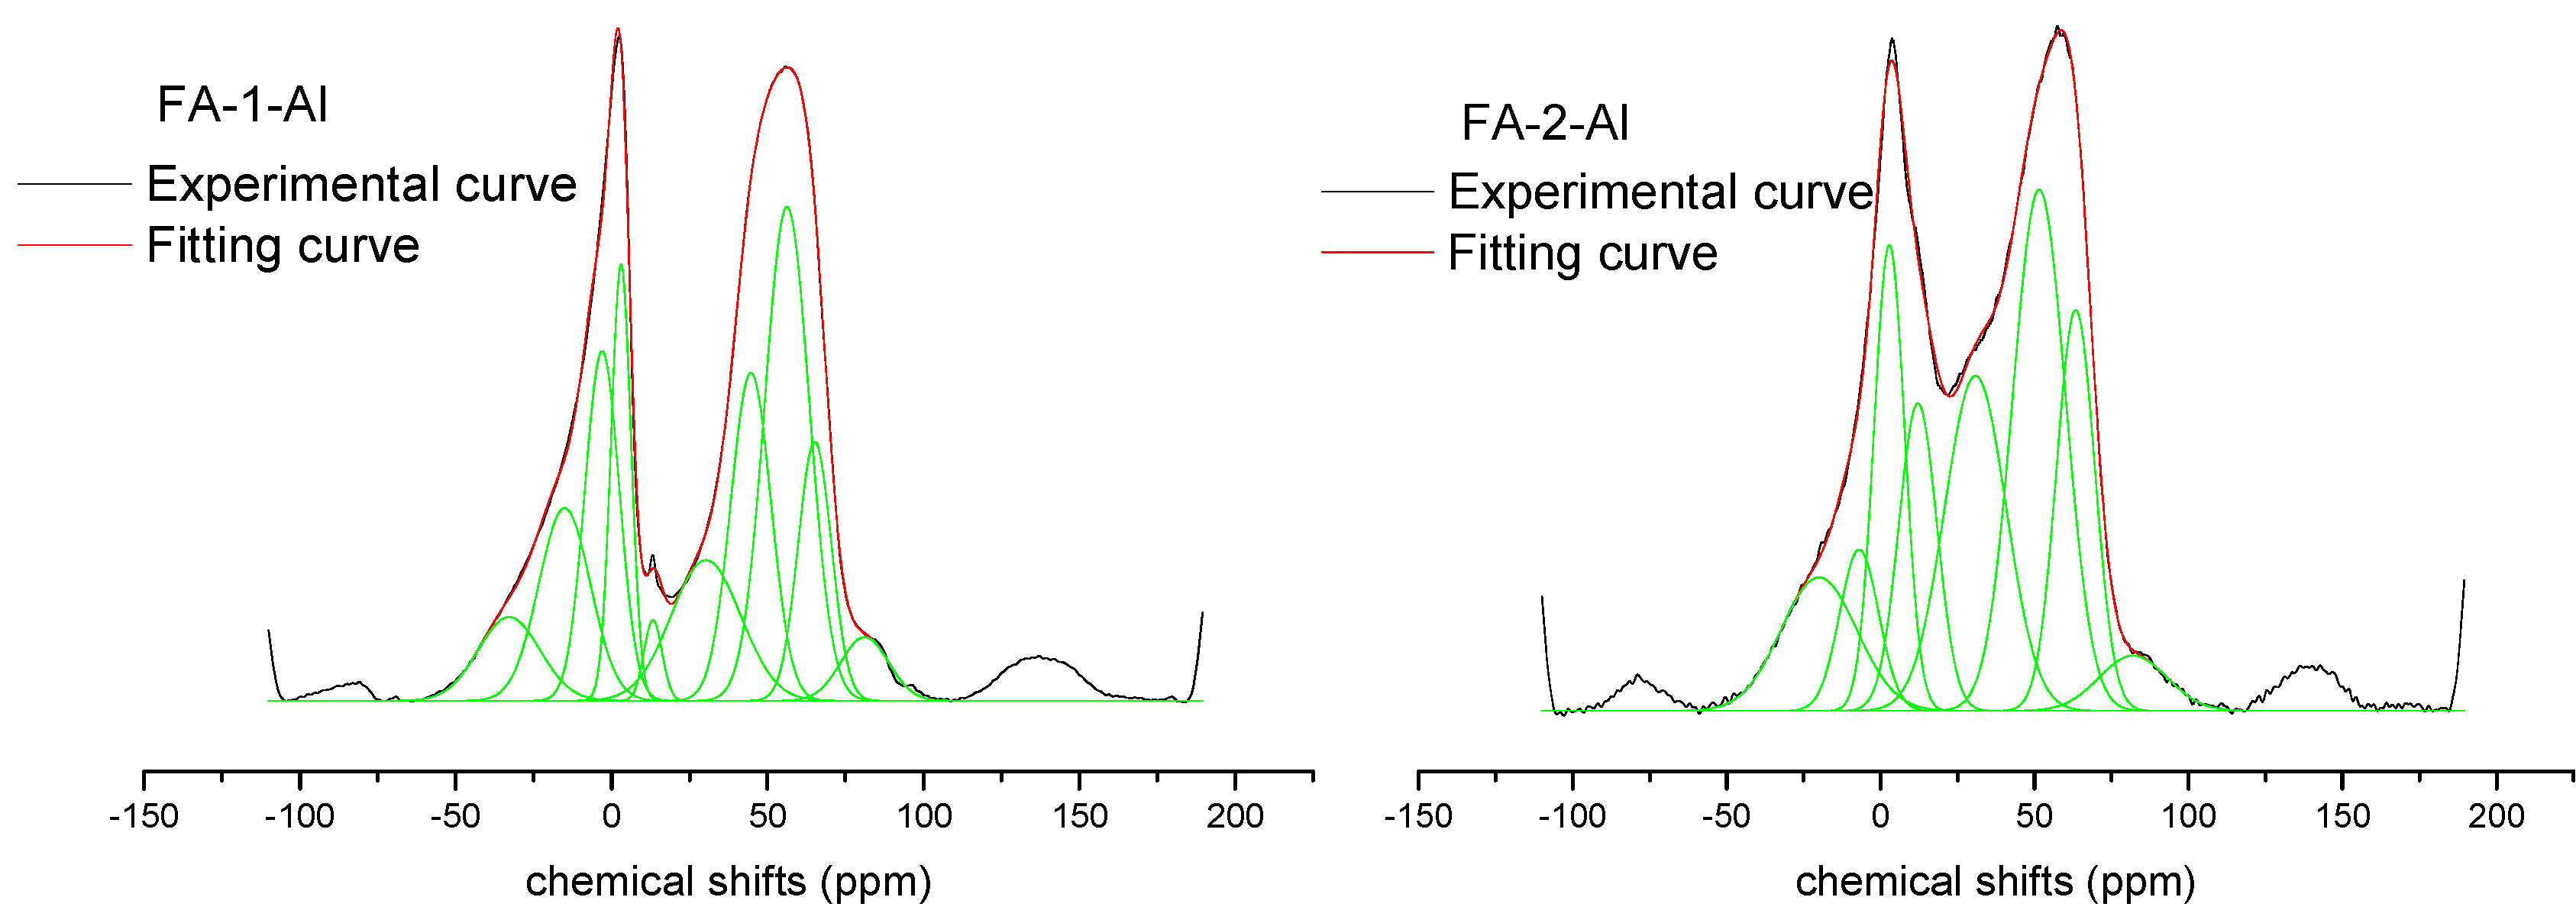
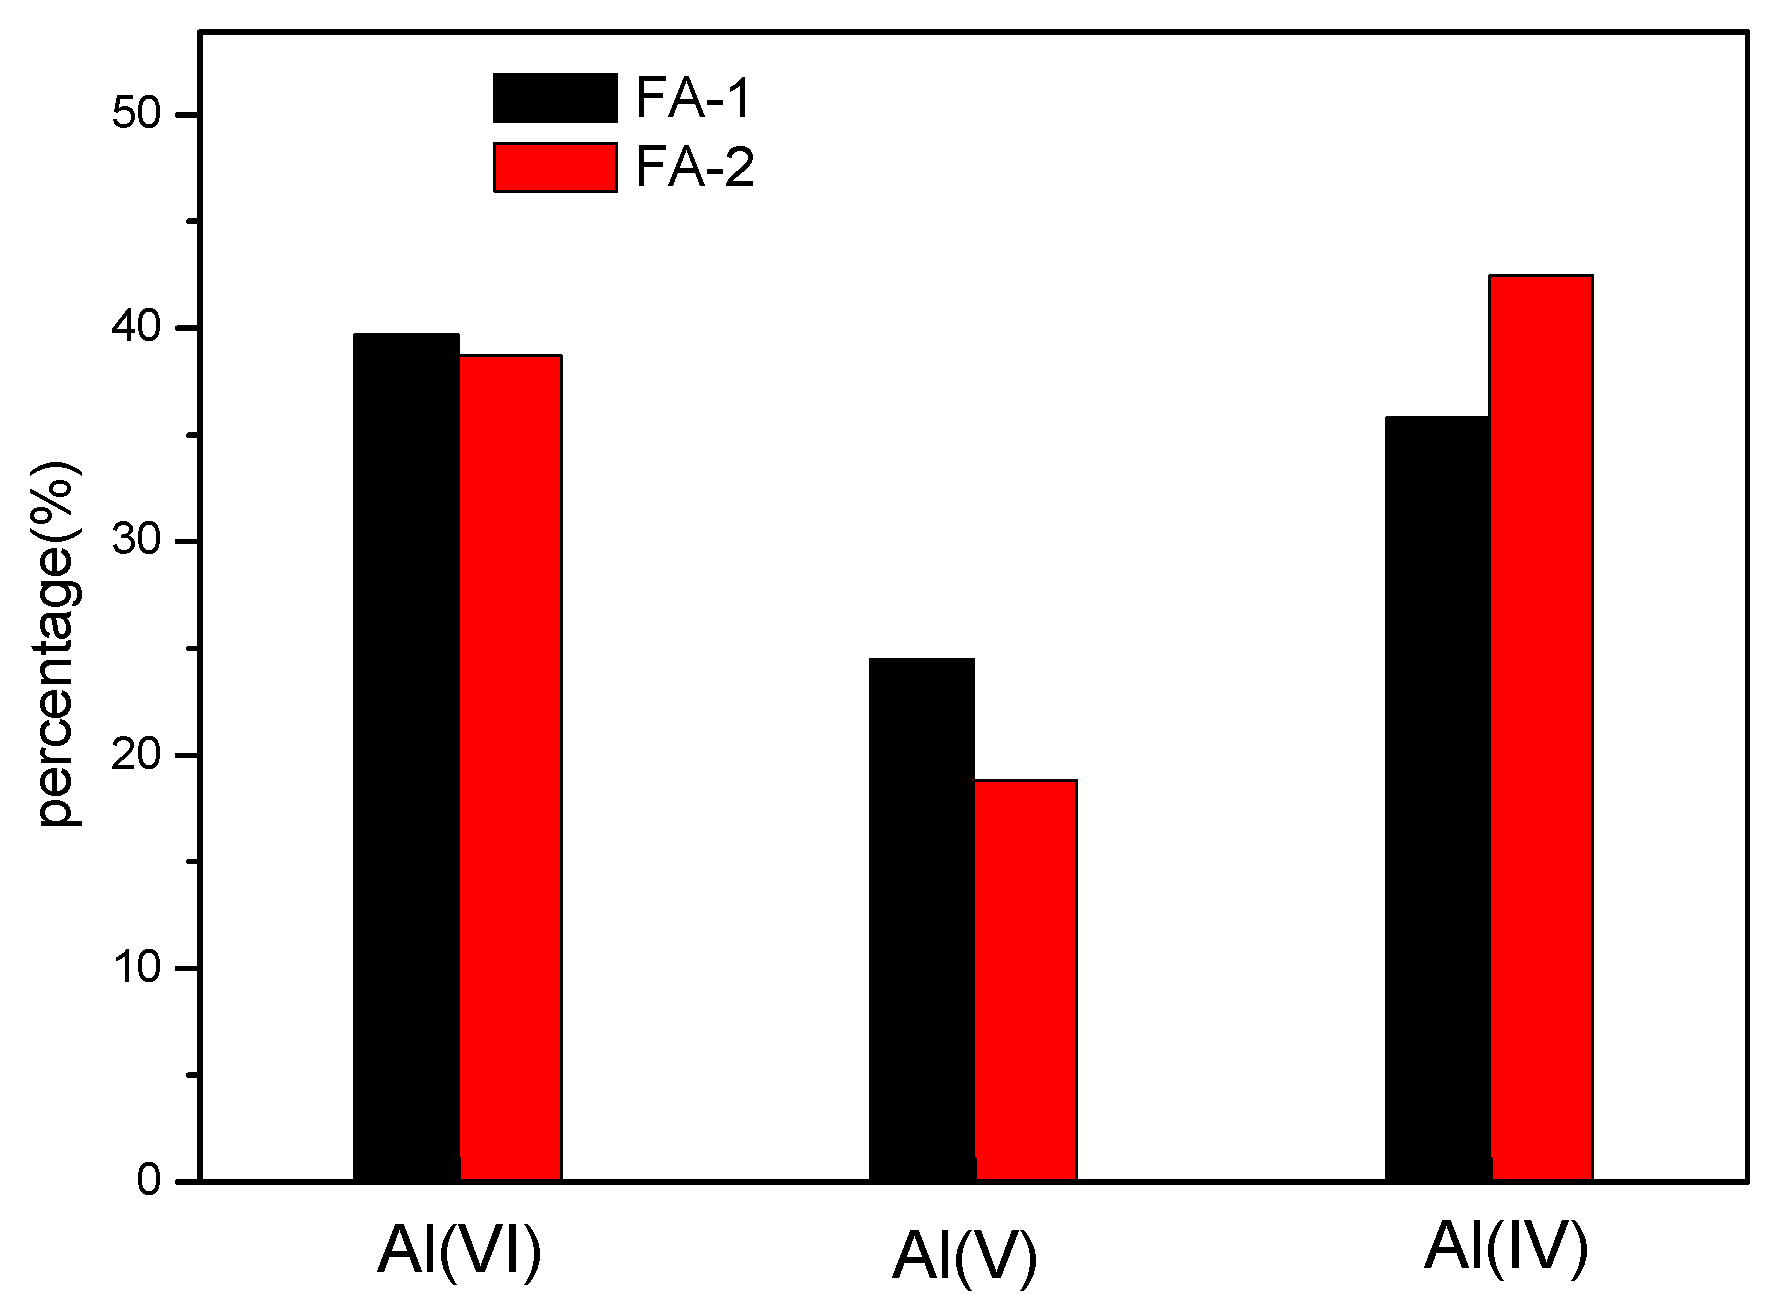
3.3.2. 27Al MAS–NMR
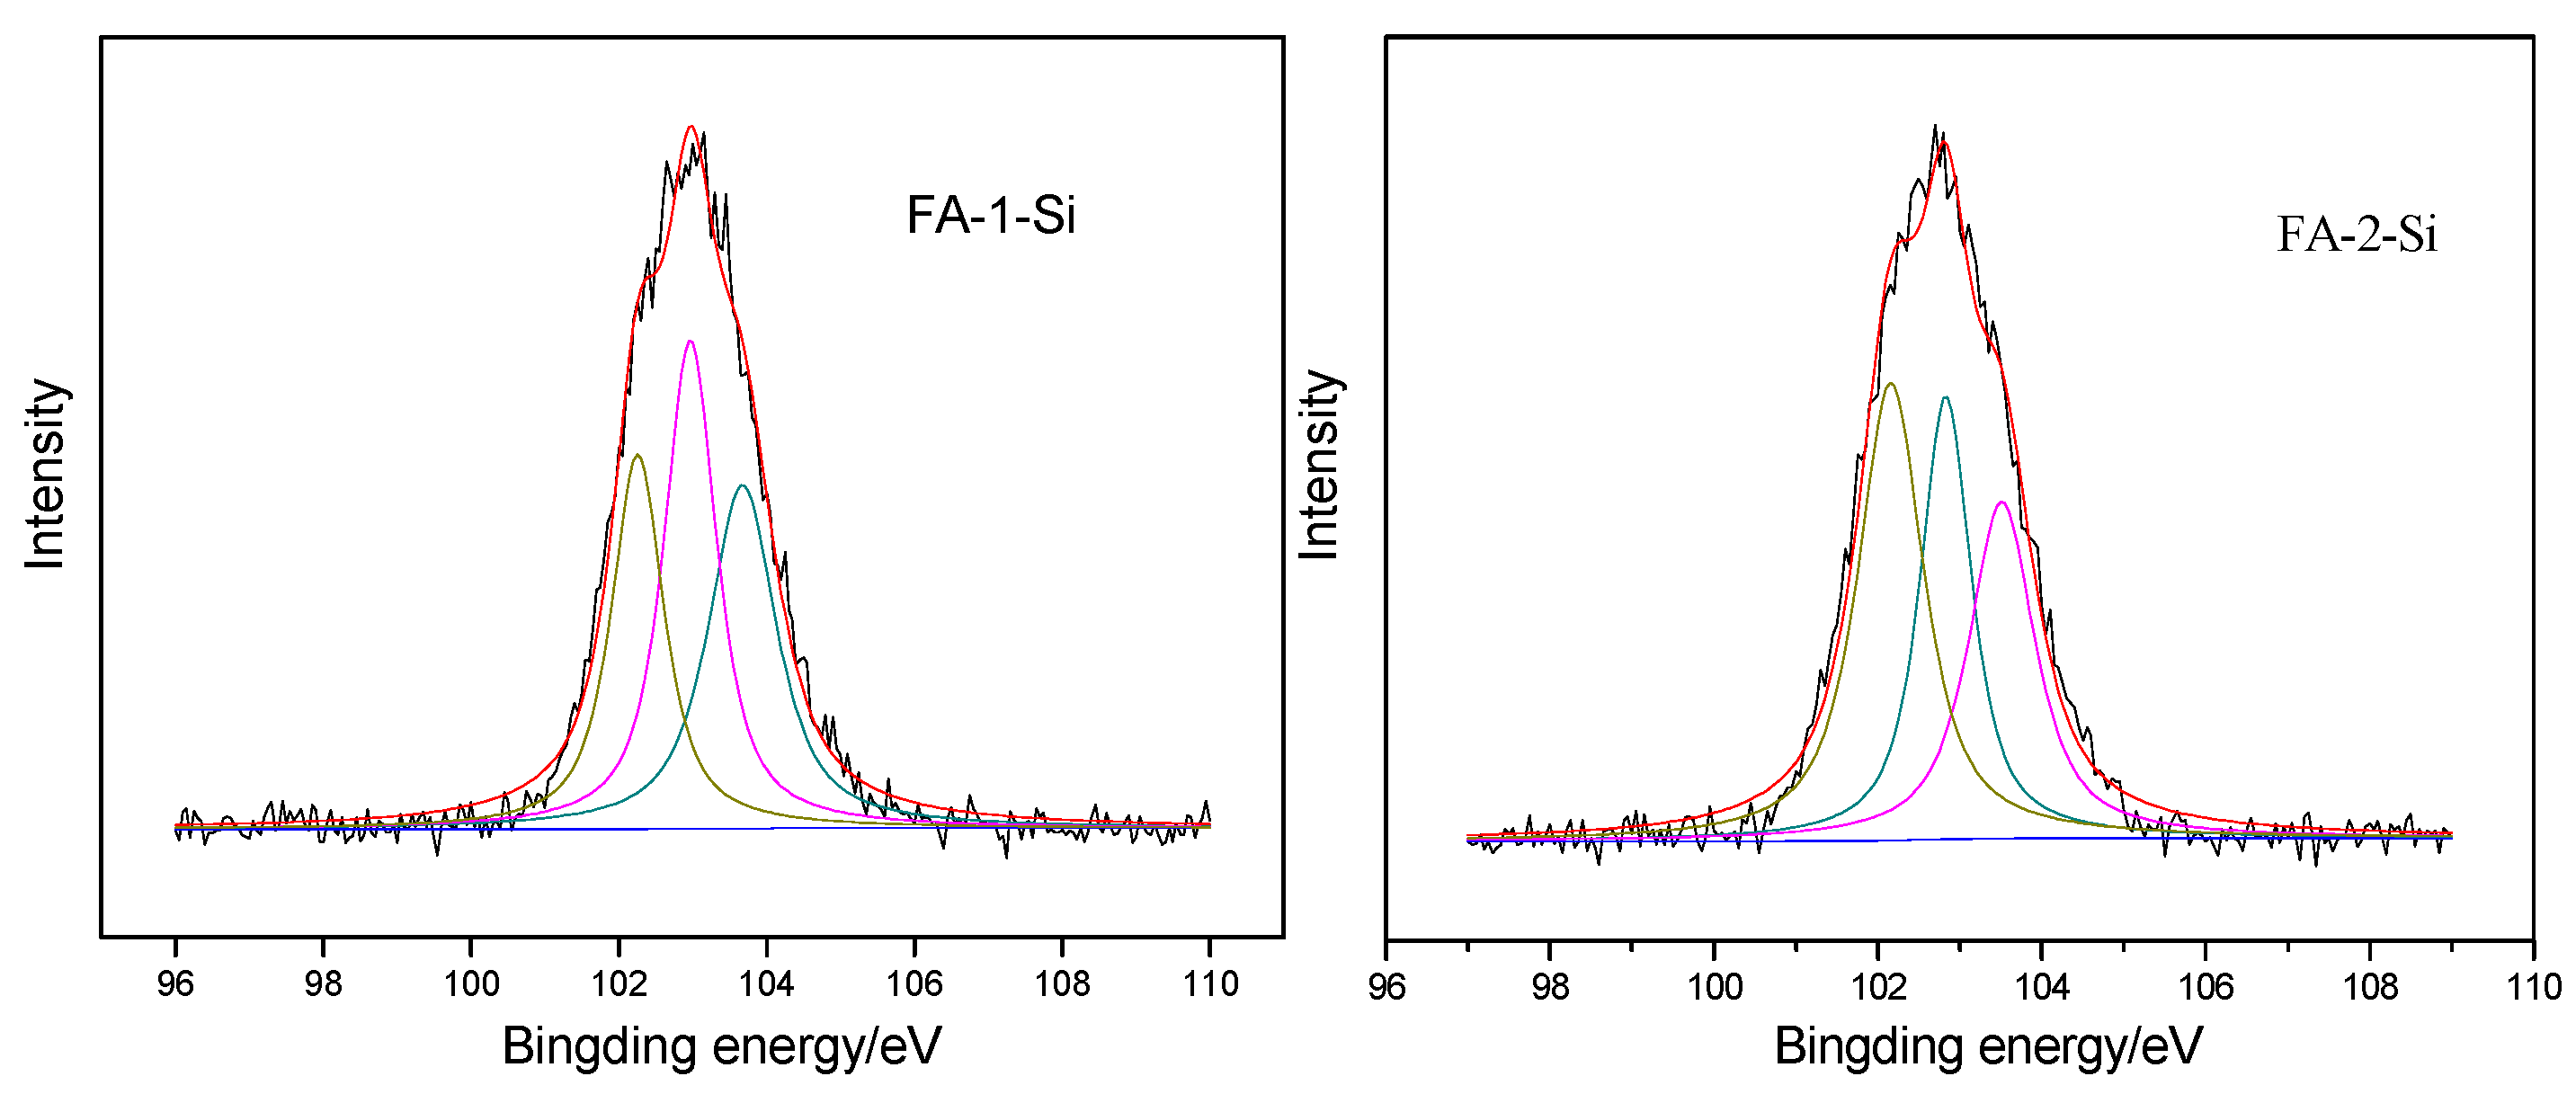
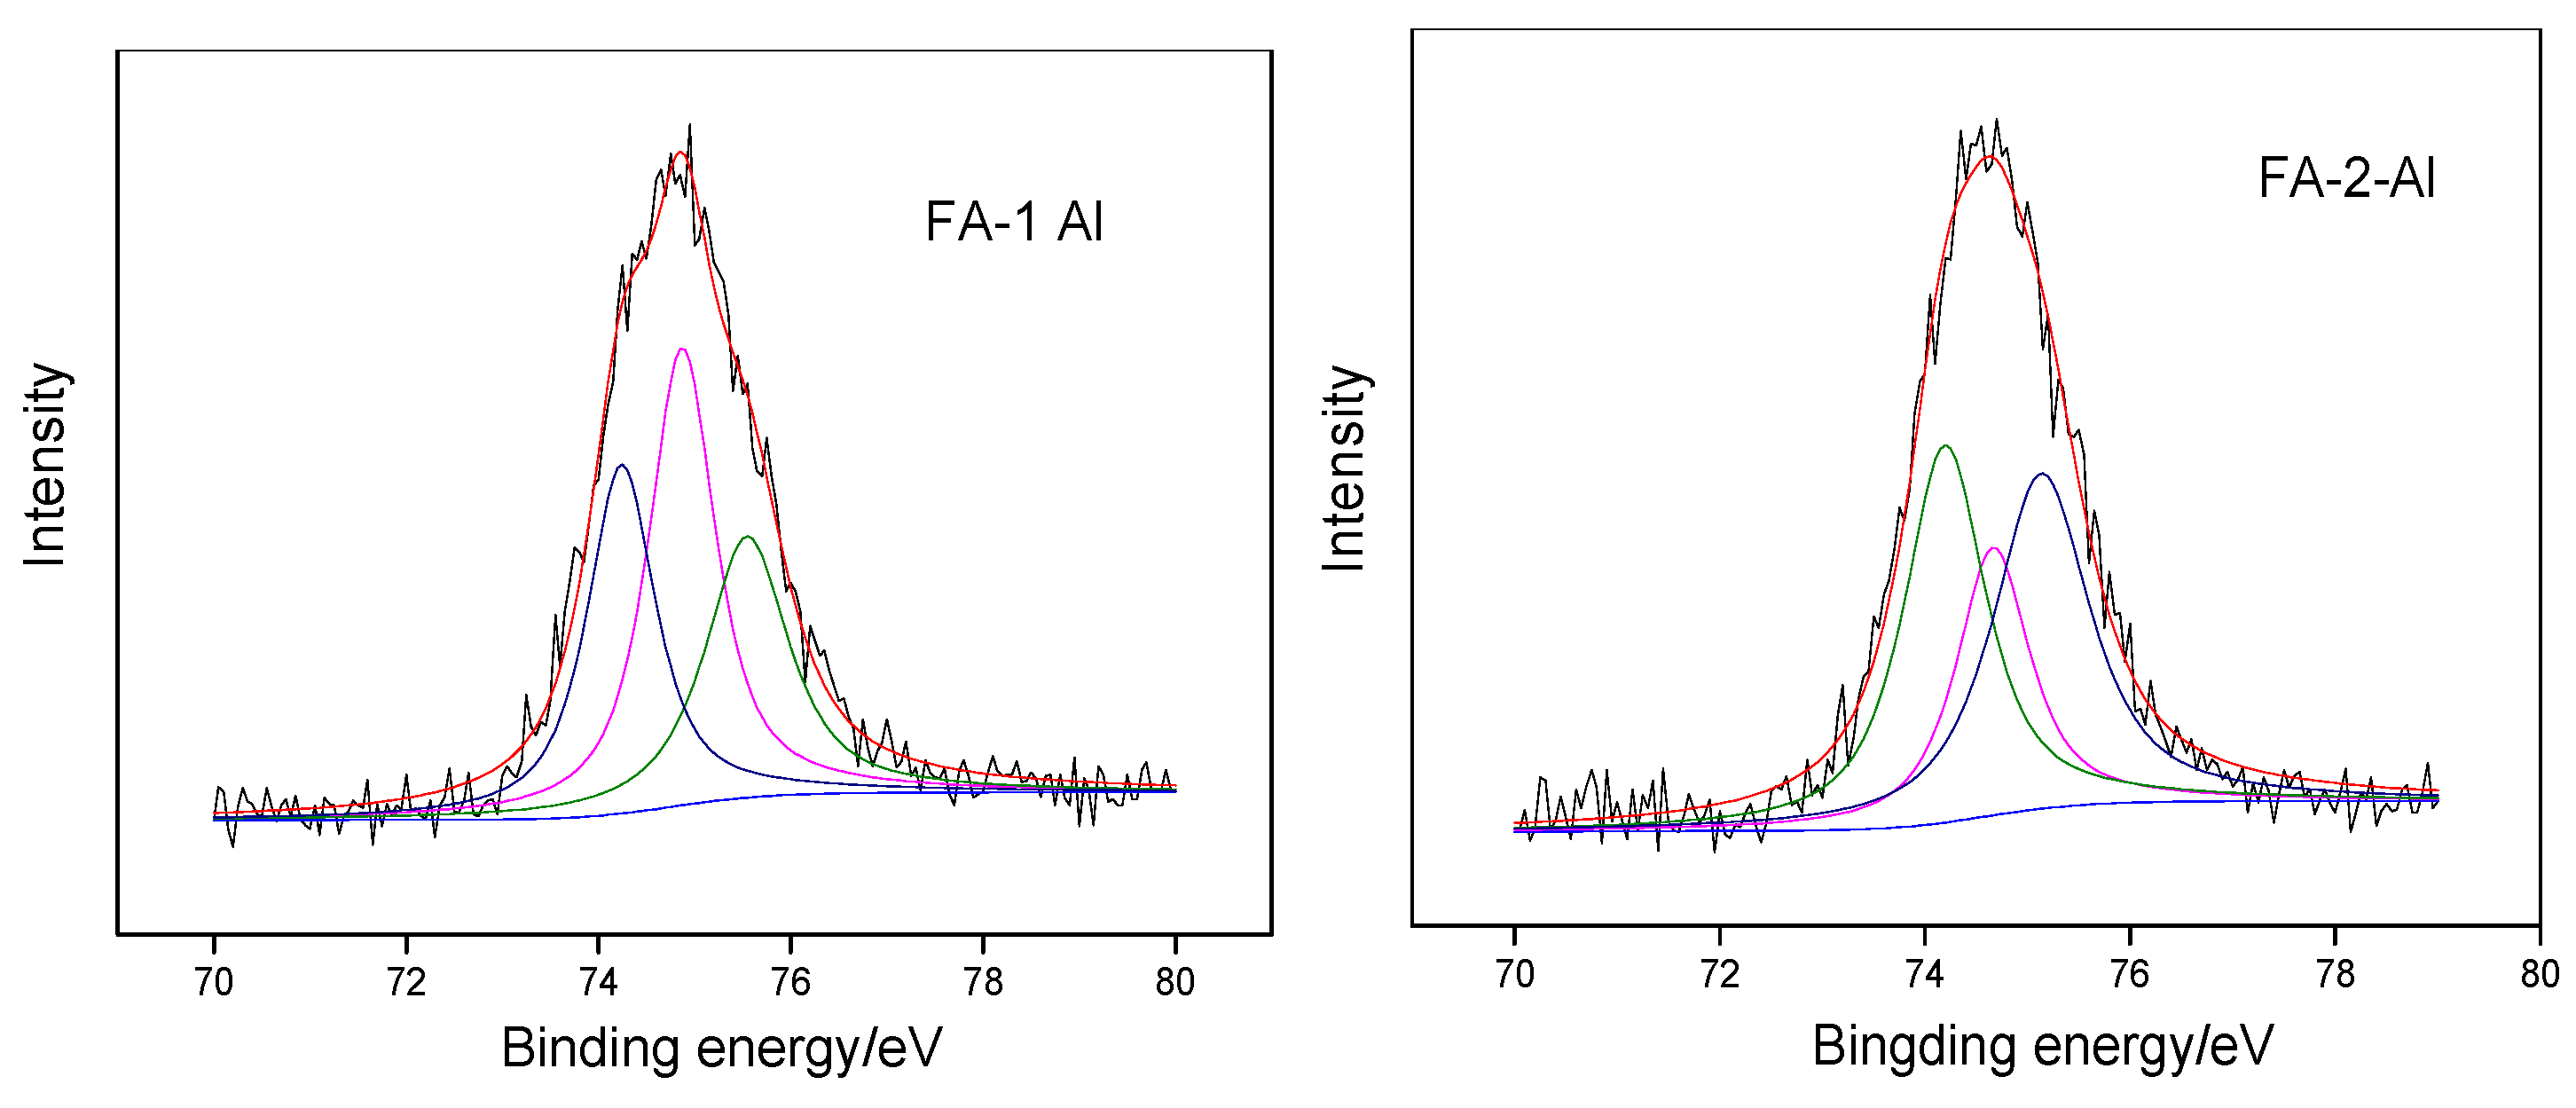
3.4. XPS
4. Conclusions
Author Contributions
Funding
Conflicts of Interest
References
- Zhao, S.L.; Duan, Y.F.; Liu, M.; Wang, C.P.; Zhou, Q.; Lu, J.H. Effects on enrichment characteristics of trace elements in fly ash by adding halide salts into the coal during CFB combustion. J. Energy Inst. 2018, 91, 214–221. [Google Scholar] [CrossRef]
- Dai, S.; Finkelman, R.B. Coal as a promising source of critical elements: Progress and future prospects. Int. J. Coal Geol. 2018, 186, 155–164. [Google Scholar] [CrossRef]
- Yuan, C.G. Leaching characteristics of metals in fly ash from coal-fired power plant by sequential extraction procedure. Microchim. Acta. 2009, 165, 91–96. [Google Scholar] [CrossRef]
- Koukouzas, N.; Ketikidis, C.; Itskos, G. Heavy metal characterization of CFB-derived coal fly ash. Fuel Process. Technol. 2011, 92, 441–446. [Google Scholar] [CrossRef]
- Duan, S.Y.; Liao, H.Q.; Song, H.P.; Cheng, F.Q. Physical and Chemical properties studies of fly ash from two typical coal-Fired boiler. In Proceedings of the 1st Conference on Solid Waste Utilization and Eco-materials, Beijing, China, 1–2 August 2015; p. 226. (In Chinese). [Google Scholar]
- Hower, J.C.; Groppo, J.G.; Graham, U.M.; Ward, C.R.; Kostova, I.J.; Maroto-Valer, M.M.; Dai, S. Coal-derived unburned carbons in fly ash: A review. Int. J. Coal Geol. 2017, 179, 11–27. [Google Scholar] [CrossRef]
- Mukherjee, A.B.; Zevenhoven, R.; Bhattacharya, P.; Sajwan, K.S.; Kikuchi, R. Mercury flow via coal and coal utilization by-products: A global perspective. Resour., Conserv. Recycl. 2008, 52, 571–591. [Google Scholar] [CrossRef]
- Kanuchova, M.; Drabova, M.; Sisol, M.; Mosej, J.; Ľubica, K.; Skvarla, J. Influence of Mechanical Activation of Fly Ash on the Properties of Geopolymers Investigated by XPS Method. Environ. Prog. Sustain. Energy 2016, 35, 1338–1343. [Google Scholar] [CrossRef]
- Koukouzas, N.; Ketikidis, C.; Itskos, G.; Spiliotis, X.; Karayannis, V.; Papapolymerou, G. Synthesis of CFB-Coal Fly Ash Clay Bricks and Their Characterisation. Waste Biomass Valorization. 2011, 2, 87–94. [Google Scholar] [CrossRef]
- Rong, J.X.; Yan, K.H.; Bin, T.; Si, H.S. Experimental Study of CFB Modification Fly Ash in Concrete. Adv. Mater. Res. 2014, 1051, 743–747. [Google Scholar] [CrossRef]
- Ahmaruzzaman, M.A. Review on the Utilization of Fly Ash. Prog. Energy Combust. Sci. 2010, 36, 327–363. [Google Scholar] [CrossRef]
- Dai, S.; Zhao, L.; Peng, S.; Chou, C.-L.; Wang, X.; Zhang, Y.; Li, D.; Sun, Y. Abundances and distribution of minerals and elements in high-alumina coal fly ash from the Jungar Power Plant, Inner Mongolia, China. Int. J. Coal Geol. 2010, 81, 320–332. [Google Scholar] [CrossRef]
- Seredin, V.V.; Dai, S.; Sun, Y.; Chekryzhov, I.Y. Coal deposits as promising sources of rare metals for alternative power and energy-efficient technologies. Appl. Geochem. 2013, 31, 1–11. [Google Scholar] [CrossRef]
- Hower, J.C.; Qian, D.L.; Briot, N.J.; Henke, K.R.; Hood, M.M.; Taggart, R.K.; Hsu-Kim, H. Rare earth element associations in the Kentucky State University stoker ash. Int. J. Coal Geol. 2018, 189, 75–82. [Google Scholar] [CrossRef]
- King, J.F.; Taggart, R.K.; Smith, R.C.; Hower, J.C.; Hsu-Kim, H. Aqueous acid and alkaline extraction of rare earth elements from coal combustion ash. Int. J. Coal Geol. 2018, 195, 75–83. [Google Scholar] [CrossRef]
- Kolker, A.; Scott, C.; Hower, J.C.; Vazquez, J.A.; Lopano, C.L.; Dai, S. Distribution of rare earth elements in coal combustion fly ash, determined by SHRIMP-RG ion microprobe. Int. J. Coal Geol. 2017, 184, 1–10. [Google Scholar] [CrossRef]
- Laudal, D.A.; Benson, S.A.; Addleman, R.S.; Palo, D. Leaching behavior of rare earth elements in fort union lignite coals of North America. Int. J. Coal Geol. 2018, 191, 112–124. [Google Scholar] [CrossRef]
- Stuckman, M.Y.; Lopano, C.L.; Granite, E.J. Distribution and speciation of rare earth elements in coal combustion by-products via synchrotron microscopy and spectroscopy. Int. J. Coal Geol. 2018, 195, 125–138. [Google Scholar] [CrossRef]
- Zhang, W.C.; Honaker, R.Q. Rare earth elements recovery using staged precipitation from a leachate generated from coarse coal refuse. Int. J. Coal Geol. 2018, 195, 189–199. [Google Scholar] [CrossRef]
- Wang, Z.; Dai, S.; Zou, J.H.; French, D.; Graham, I.T. Rare earth elements and yttrium in coal ash from the Luzhou power plant in Sichuan, Southwest China: Concentration, characterization and optimized extraction. Int. J. Coal Geol. 2019, 203, 1–14. [Google Scholar] [CrossRef]
- Dai, S.; Seredin, V.V.; Colin, C.R.; Jiang, J.H.; Hower, J.C.; Song, X.; Jiang, Y.; Wang, X.; Gornostaeva, T.; Li, X.; et al. Composition and modes of occurrence of minerals and elements in coal combustion products derived from high-Ge coals. Int. J. Coal Geol. 2014, 121, 79–97. [Google Scholar] [CrossRef]
- Sun, Y.Z.; Zhao, C.L.; Li, Y.H.; Wang, J.X.; Liu, S.M. Li Distribution and Mode of Occurrences in Li-Bearing Coal Seam # 6 from the Guanbanwusu Mine, Inner Mongolia, Northern China. Energy Explor. Exploit. 2012, 30, 109–130. [Google Scholar] [CrossRef] [Green Version]
- Hu, P.P.; Hou, X.J.; Zhang, J.B.; Li, S.P.; Wu, H.; Damø, A.J.; Li, H.Q.; Wu, Q.S.; Xi, X.G. Distribution and occurrence of lithium in high-alumina-coal fly ash. Int. J. Coal Geol. 2018, 189, 27–34. [Google Scholar] [CrossRef] [Green Version]
- Dai, S.; Graham, I.T.; Ward, C.R. A review of anomalous rare earth elements and yttrium in coal. Int. J. Coal Geol. 2016, 159, 82–95. [Google Scholar] [CrossRef]
- Dai, S.; Seredin, V.V.; Ward, C.R.; Hower, J.C.; Xing, Y.; Zhang, W.; Song, W.; Wang, P. Enrichment of U–Se–Mo–Re–V in coals preserved within marine carbonate successions: Geochemical and mineralogical data from the Late Permian Guiding Coalfield, Guizhou, China. Miner. Deposita. 2015, 50, 159–186. [Google Scholar] [CrossRef]
- Dai, S.; Yan, X.; Ward, C.R.; Hower, J.C.; Lei, Z.; Wang, X.; Zhao, L.; Ren, D.; Finkelman, R.B. Valuable elements in Chinese coals: A review. Int. Geol. Rev. 2016, 60, 590–620. [Google Scholar] [CrossRef]
- Hower, J.C.; Dai, S. Petrology and chemistry of sized Pennsylvania anthracite, with emphasis on the distribution of rare earth elements. Fuel 2016, 185, 305–315. [Google Scholar] [CrossRef]
- Hower, J.C.; Eble, C.F.; Dai, S.; Belkin, H.E. Distribution of rare earth elements in eastern Kentucky coals: Indicators of multiple modes of enrichment? Int. J. Coal Geol. 2016, 160–161, 73–81. [Google Scholar] [CrossRef]
- Seredin, V.V.; Dai, S. The occurrence of gold in fly ash derived from high-Ge coal. Miner. Deposita. 2014, 49, 1–6. [Google Scholar] [CrossRef]
- Zhang, J.B.; Li, S.P.; Li, H.Q.; He, M.M. Acid activation for pre-desilicated high-alumina fly ash. Fuel Process. Technol. 2016, 151, 64–71. [Google Scholar] [CrossRef]
- Mozgawa, W.; Król, M.; Dyczek, J.; Deja, J. Investigation of the coal fly ashes using IR spectroscopy. Spectrochim. Acta 2014, 132, 889–894. [Google Scholar] [CrossRef]
- Gao, X.; Yu, Q.L.; Brouwers, H.J.H. Apply 29Si, 27Al MAS NMR and selective dissolution in identifying the reaction degree of alkali activated slag-fly ash composites. Ceram. Int. 2017, 43, 12408–12419. [Google Scholar] [CrossRef]
- Kanuchova, M.; Ľubica, K.; Drabova, M.; Sisol, M.; Estokova, A.; Kaňuch, J.; Skvarla, J. Monitoring and characterization of creation of geopolymers prepared from fly ash and metakaolin by X-ray photoelectron spectroscopy method. Environ. Prog. Sustain. Energy 2014, 34, 841–849. [Google Scholar] [CrossRef]
- Wyatt, P.J. Some chemical, physical, and optical properties of fly ash particles. Appl. Opt. 1980, 19, 975–983. [Google Scholar] [CrossRef]
- El-Mogazi, D.; Lisk, D.J.; Weinstein, L.H. A review of physical, chemical, and biological properties of fly ash and effects on agricultural ecosystems. Sci. Total Environ. 1988, 74, 1–37. [Google Scholar] [CrossRef]
- Qi, L.; Jing, H.; Gregoire, D.C. Determination of trace elements in granites by inductively coupled plasma mass spectrometry. Talanta 2000, 51, 507–513. [Google Scholar] [CrossRef]
- Methods for Chemical Analysis of Silicate Rocks-P 3: Determination of Silicon Dioxide Content. Patent GB/T 14506.3-2010, 10 November 2010. (In Chinese).
- Li, L.Z. Rock and Mineral Analysis; Geological Publishing House: Beijing, China, 1991; Volume 1. (In Chinese) [Google Scholar]
- Wang, Z.Y. Quantitative determination of aluminum and silicon elements in corundum, kaolin clay and mullite. Chin. J. Inorg. Anal. Chem. 2011, 1, 35–38. (In Chinese) [Google Scholar] [CrossRef]
- Chen, Y.J.; Li, Q.; Jiang, D.Y. Study on the Glassy Phase Composition of 95 Al2O3 Ceramics. Key Eng. Mater. 2011, 492, 463–466. [Google Scholar] [CrossRef]
- Ciesielczyk, F.; Bartczak, P.; Jesionowski, T. A comprehensive study of Cd(II) ions removal utilizing high-surface-area binary Mg–Si hybrid oxide adsorbent. Int. J. Environ. Sci. Technol. 2015, 12, 3613–3626. [Google Scholar] [CrossRef]
- Chen, Y.Y.; Mastalerz, M.; Schimmelmann, A. Characterization of chemical functional groups in macerals across different coal ranks via micro-FTIR spectroscopy. Int. J. Coal Geol. 2012, 104, 22–33. [Google Scholar] [CrossRef]
- Strydom, C.A.; Bunt, J.R.; Schobert, H.H.; Raghoo, M. Changes to the organic functional groups of an inertinite rich medium rank bituminous coal during acid treatment processes. Fuel Process. Technol. 2011, 92, 764–770. [Google Scholar] [CrossRef]
- Hahn, A.; Vogel, H.; Andó, S.; Garzanti, E.; Kuhn, G.; Lantzsch, H.; Schüürman, J.; Vogt, C.; Zabel, M. Using Fourier Transform Infrared Spectroscopy to determine mineral phases in sediments. Sediment. Geol. 2018, 375, 27–35. [Google Scholar] [CrossRef]
- Palomo, Á.; Alonso, S.; Fernandez-Jiménez, A.; Sobrados, I.; Sanz, J. Alkaline Activation of Fly Ashes: NMR Study of the Reaction Products. J. Am. Ceram. Soc. 2010, 87, 1141–1145. [Google Scholar] [CrossRef]
- Dai, S.; Ren, D.; Chou, C.-L.; Finkelman, R.B.; Seredin, V.V.; Zhou, Y. Geochemistry of trace elements in Chinese coals: A review of abundances, genetic types, impacts on human health, and industrial utilization. Int. J. Coal Geol. 2012, 94, 3–21. [Google Scholar] [CrossRef]
- Ketris, M.P.; Yudovich, Y.E. Estimations of Clarkes for Carbonaceous biolithes: World averages for trace element contents in black shales and coals. Int. J. Coal Geol. 2009, 78, 135–148. [Google Scholar] [CrossRef]
- Liu, H.D. Composition of the Coal Combustion and Utilization of the Fly Ash Generated from Two Major Coal-fired Power Plants in Chongqing city, Southwest China. Ph.D. Thesis, China University of Mining & Technology, Beijing, China, 2015. (In Chinese). [Google Scholar]
- Huang, Y.; Qian, J.S.; Wang, Z.; Zhang, Z.W. Comparative Study of CFB Ashes and PC Ashes. Fly Ash Compr. Util. 2009, 3, 7–9. (In Chinese) [Google Scholar] [CrossRef]
- Wang, E. Mineralogy Properties Comparison of PC Fly Ash and CFB Fly Ash. Clean Coal Technol. 2016, 22, 26–29. (In Chinese) [Google Scholar] [CrossRef]
- Spears, D.A. Role of clay minerals in UK coal combustion. Appl. Clay Sci. 2000, 16, 87–95. [Google Scholar] [CrossRef]
- Henry, J.; Towler, M.R.; Stanton, K.T.; Querol, X.; Moreno, N. Characterization of the Glass Fraction of a Selection of European Coal Fly Ashes. J. Chem. Technol. Biotechnol. 2010, 79, 540–546. [Google Scholar] [CrossRef]
- Painter, P.C.; Coleman, M.M.; Jenkins, R.G.; Whang, P.W.; Walker, P.L., Jr. Fourier Transform Infrared study of mineral matter in coal. A novel method for quantitative mineralogical analysis. Fuel 1978, 57, 337–344. [Google Scholar] [CrossRef]
- Mukherjee, S.; Srivastava, S.K. Minerals Transformations in Northeastern Region Coals of India on Heat Treatment. Energy Fuels 2006, 20, 1089–1096. [Google Scholar] [CrossRef]
- De Benedetto, G.E.; Laviano, R.; Sabbatini, L.; Zambonin, P.G. Infrared spectroscopy in the mineralogical characterization of ancient pottery. J. Cult. Herit. 2002, 3, 177–186. [Google Scholar] [CrossRef]
- Wu, L.M.; Tong, D.S.; Zhao, L.Z.; Yu, W.H.; Zhou, C.H.; Wang, H. Fourier transform infrared spectroscopy analysis for hydrothermal transformation of microcrystalline cellulose on montmorillonite. Appl. Clay Sci. 2014, 95, 74–82. [Google Scholar] [CrossRef]
- Angaji, M.T.; Zinali, A.Z.; Qazvini, N.T. Study of Physical, Chemical and Morphological Alterations of Smectite Clay upon Activation and Functionalization via the Acid Treatment. World J. Nano Sci. Eng. 2013, 3, 161–168. [Google Scholar] [CrossRef] [Green Version]
- Flanigen, E.M.; Khatamt, H.; Szymanski, H.A. Infrared Structural Studies of Zeolite Frameworks. Adv. Chem. 1971, 101, 201–228. [Google Scholar] [CrossRef]
- Fernández-Jiménez, A.; Palomo, A. Mid-infrared spectroscopic studies of alkali-activated fly ash structure. Microporous Mesoporous Mater. 2005, 86, 207–214. [Google Scholar] [CrossRef]
- Bernal, S.A.; Provis, J.L.; Walkley, B.; Nicolas, R.S.; Gehman, J.D.; Brice, D.G.; Kilcullen, A.R.; Duxson, P.; Deventer, J.S.J.V. Gel nanostructure in alkali-activated binders based on slag and fly ash, and effects of accelerated carbonation. Cem. Concr. Res. 2013, 53, 127–144. [Google Scholar] [CrossRef]
- Lee, N.K.; Lee, H.K. Reactivity and reaction products of alkali-activated, fly ash/slag paste. Constr. Build. Mater. 2015, 81, 303–312. [Google Scholar] [CrossRef]
- Saoût, G.L.; Haha, M.B.; Winnefeld, F.; Lothenbach, B. Hydration Degree of Alkali-Activated Slags: A 29Si NMR Study. J. Am. Ceram. Soc. 2011, 94, 4541–4547. [Google Scholar] [CrossRef]
- Walkley, B.; Nicolas, R.S.; Sani, M.A.; Gehman, J.D.; Deventer, J.S.J.V.; Provis, J.L. Synthesis of stoichiometrically controlled reactive aluminosilicate and calcium-aluminosilicate powders. Powder Technol. 2016, 297, 17–33. [Google Scholar] [CrossRef]
- Brough, A.R.; Atkinson, A. Sodium silicate-based, alkali-activated slag mortars: Part I. Strength, hydration and microstructure. Cem. Concr. Res. 2002, 32, 865–879. [Google Scholar] [CrossRef]
- Park, S.M.; Jang, J.G.; Lee, N.K.; Lee, H.K. Physicochemical properties of binder gel in alkali-activated fly ash/slag exposed to high temperatures. Cem. Concr. Res. 2016, 89, 72–79. [Google Scholar] [CrossRef]
- Rejmak, P.; Dolado, J.S.; Stott, M.J.; Ayuela, A. 29Si NMR in Cement: A Theoretical Study on Calcium Silicate Hydrates. J. Phys. Chem. C 2012, 116, 9755–9761. [Google Scholar] [CrossRef]
- Criado, M.; Fernández-Jiménez, A.; Palomo, A.; Sobrados, I.; Sanz, J. Effect of the SiO2/Na2O ratio on the alkali activation of fly ash. Part II: 29Si MAS-NMR Survey. Microporous Mesoporous Mater. 2008, 109, 525–534. [Google Scholar] [CrossRef]
- Fernández-Jiménez, A.; Palomo, A. Characterisation of fly ashes. Potential reactivity as alkaline cements. Fuel 2003, 82, 2259–2265. [Google Scholar] [CrossRef]
- Fernández-Jiménez, A.; Torre, A.G.D.L.; Palomo, A.; López-Olmo, G.; Alonso, M.M.; Aranda, M.A.G. Quantitative determination of phases in the alkaline activation of fly ash. Part II: Degree of reaction. Fuel 1960, 85, 1960–1969. [Google Scholar] [CrossRef]
- Kovalchuk, G.; Fernández-Jiménez, A.; Palomo, A. Alkali-activated fly ash: Effect of thermal curing conditions on mechanical and microstructural development—Part II. Fuel 2007, 86, 315–322. [Google Scholar] [CrossRef]
- Peng, Z.H.; Vance, K.; Dakhane, A.; Marzke, R.; Neithalath, N. Microstructural and 29Si MAS NMR spectroscopic evaluations of alkali cationic effects on fly ash activation. Cem. Concr. Compos. 2015, 57, 34–43. [Google Scholar] [CrossRef]
- Merwin, L.H.; Sebald, A.; Rager, H.; Schneider, H. 29Si and 27Al MAS NMR spectroscopy of mullite. Phys. Chem. Miner. 1991, 18, 47–52. [Google Scholar] [CrossRef]
- Wang, Z.R. Mineralogy; Shanghai Science and Technology Press: Shanghai, China, 1965. (In Chinese) [Google Scholar]
- Black, L.; Stumm, A.; Garbev, K.; Stemmermann, P.; Hallam, K.C.; Allen, G. X-ray photoelectron spectroscopy of aluminium-substituted tobermorite. Cem. Concr. Res. 2005, 35, 51–55. [Google Scholar] [CrossRef]
- Wen, H.T.; Kong, L.X.; Bai, J.; Bai, Z.Q.; Lv, D.M.; Li, W. Research on the transformation of mineral structure of high ash fusion temperature coal ash by XPS Journal of Fuel. Chem. Techenol. 2015, 43, 257–265. (In Chinese) [Google Scholar] [CrossRef]
- Barr, T.L.; Seal, S.; Wozniak, K.; Klinowski, J. ESCA studies of the coordination state of aluminium in oxide environments. J. Chem. Soc. Faraday Trans. 1997, 93, 181–186. [Google Scholar] [CrossRef]


| Samples | Power Plant | Style | Capacity | Utilization |
|---|---|---|---|---|
| FA-1 | Gujiao Power Plant | Four-corner tangential | 2 × 300 MW + 2 × 600 MW + 2 × 660 MW | Gujiao cement plant |
| FA-2 | Xishan Thermal Power Plant | Fluidization | 3 × 50 MW | Huatong brick company |
| Chemical Composition (%) | SiO2 | Al2O3 | Na2O | K2O | CaO | MgO | P2O5 | TiO2 | MnO | Fe2O3 | LOI |
|---|---|---|---|---|---|---|---|---|---|---|---|
| Feed coal of FA-1 | 17.49 | 9.09 | 0.11 | 0.28 | 0.82 | 0.12 | 0.25 | 0.40 | 0.01 | 1.64 | 69.37 |
| Feed coal of FA-2 | 34.76 | 18.05 | 0.16 | 0.81 | 0.74 | 0.28 | 0.07 | 0.72 | 0.02 | 3.82 | 40.66 |
| Chinese coal * | 8.47 | 5.98 | 0.16 | 0.19 | 1.23 | 0.22 | 0.092 | 0.33 | 0.015 | 4.85 | - |
| Chemical Composition(%) | SiO2 | Al2O3 | Na2O | K2O | CaO | MgO | P2O5 | TiO2 | MnO | Fe2O3 | LOI |
|---|---|---|---|---|---|---|---|---|---|---|---|
| FA-1 | 70.30 | 17.04 | 0.17 | 0.93 | 1.79 | 0.32 | 0.19 | 1.39 | 0.03 | 3.23 | 4.62 |
| FA-2 | 42.19 | 25.41 | 0.25 | 1.08 | 1.84 | 0.49 | 0.14 | 1.06 | 0.03 | 6.50 | 21.57 |
| FA-1 | FA-2 | ||||
|---|---|---|---|---|---|
| CenterMAX/ppm | Arearfit/% | Adscription | CenterMAX/ppm | Arearfit/% | Adscription |
| −119.73438 | 5.7954 | Q4(0Al) | −120.83294 | 1.74 | Q4(0Al) |
| −113.29738 | 18.03134 | Q4(0Al) | −115.22508 | 10.50 | Q4(0Al) |
| −108.10059 | 23.7302 | Q4(1Al) | −111.1572 | 10.82 | Q4(0Al) |
| −102.42915 | 20.05077 | Q4(2Al) | −107.53395 | 19.17 | Q4(1Al) |
| −95.99105 | 10.99791 | Q4(3Al) | −103.40652 | 13.88 | Q4(2Al) |
| −91.05172 | 8.48707 | Q4(4Al) | −99.79292 | 10.99 | Q4(3Al) |
| −87.15833 | 7.91601 | Q4(4Al) | −96.0613 | 8.83 | Q4(3Al) |
| −82.4267 | 4.99129 | Q2(1Al) | −92.0807 | 13.06 | Q4(4Al) |
| −87.31883 | 8.62 | Q4(4Al) | |||
| −81.98463 | 2.39 | Q2(1Al) | |||
| FA-1 | FA-2 | ||||
|---|---|---|---|---|---|
| CenterMAX/ppm | Arearfit/% | Adscription | CenterMAX/ppm | Arearfit/% | Adscription |
| −32.85115 | 5.50545 | Al(VI) | −20.04621 | 9.25597 | Al(VI) |
| −15.05214 | 10.60196 | Al(VI) | −6.95479 | 5.74581 | Al(VI) |
| −3.01684 | 12.81897 | Al(VI) | 2.81933 | 13.01829 | Al(VI) |
| 3.06664 | 9.18837 | Al(VI) | 12.09294 | 10.68981 | Al(VI) |
| 13.30475 | 1.56215 | Al(VI) | 30.80117 | 18.82657 | Al(V) |
| 30.28845 | 10.44299 | Al(V) | 51.49316 | 25.06484 | Al(IV) |
| 44.71206 | 14.05927 | Al(V) | 63.36683 | 13.99035 | Al(IV) |
| 56.30446 | 23.41921 | Al(IV) | 82.02285 | 3.40836 | Al(IV) |
| 65.19928 | 9.17178 | Al(IV) | |||
| 81.20427 | 3.22987 | Al(IV) | |||
| FA-1 | FA-2 | ||
|---|---|---|---|
| Binding Energy/eV | Proportion/% | Binding Energy/eV | Proportion/% |
| 102.256 | 28.57 | 102.158 | 40.15 |
| 102.968 | 37.48 | 102.829 | 30.21 |
| 103.674 | 33.94 | 103.511 | 29.63 |
| FA-1 Proportion | FA-2 Proportion | ||
|---|---|---|---|
| Binding Energy/eV | Proportion/% | Binding Energy/eV | Proportion/% |
| 74.241 | 31.36 | 74.197 | 37.36 |
| 74.87 | 40.25 | 74.665 | 23.71 |
| 75.545 | 28.39 | 75.137 | 38.93 |
© 2019 by the authors. Licensee MDPI, Basel, Switzerland. This article is an open access article distributed under the terms and conditions of the Creative Commons Attribution (CC BY) license (http://creativecommons.org/licenses/by/4.0/).
Share and Cite
Liu, Y.; Zeng, F.; Sun, B.; Jia, P.; Graham, I.T. Structural Characterizations of Aluminosilicates in Two Types of Fly Ash Samples from Shanxi Province, North China. Minerals 2019, 9, 358. https://doi.org/10.3390/min9060358
Liu Y, Zeng F, Sun B, Jia P, Graham IT. Structural Characterizations of Aluminosilicates in Two Types of Fly Ash Samples from Shanxi Province, North China. Minerals. 2019; 9(6):358. https://doi.org/10.3390/min9060358
Chicago/Turabian StyleLiu, Yunxia, Fangui Zeng, Beilei Sun, Peng Jia, and Ian T. Graham. 2019. "Structural Characterizations of Aluminosilicates in Two Types of Fly Ash Samples from Shanxi Province, North China" Minerals 9, no. 6: 358. https://doi.org/10.3390/min9060358